Embed Size (px)
Citation preview

What do we know, what have we learned? Michigan, US, and
Obamanomics
Jared Bernstein
Economic Policy Institute
MLHS Annual Meeting

Real Economy, macro
• It’s official—recession, that is…but you knew that.
• Consumer: retrenching, big time.• Investment: squeezed on credit and profit
sides• Exports/Imports: Maybe, maybe not…• Government: most reliable source of short
term growth?

-600
-500
-400
-300
-200
-100
0
100
200Ja
n-0
7
Fe
b-0
7
Ma
r-0
7
Ap
r-0
7
Ma
y-0
7
Jun
-07
Jul-
07
Au
g-0
7
Se
p-0
7
Oct
-07
No
v-0
7
De
c-0
7
Jan
-08
Fe
b-0
8
Ma
r-0
8
Ap
r-0
8
Ma
y-0
8
Jun
-08
Jul-
08
Au
g-0
8
Se
p-0
8
Oct
-08
No
v-0
8
Mo
nth
ly c
ha
ng
e in
em
plo
ym
en
t (t
ho
us
an
ds
)
Total
Private
Total and Private Payroll Employment, Jan. 07 - Nov. 08
Source: Bureau of Labor Statistics, EPI Employment Projections

Employment Declines Across Sectors
Source: Bureau of Labor Statistics
Housing Employment, Jan. 07 - Nov. 08
6600
6800
7000
7200
7400
7600
7800
8000
Mo
nth
ly e
mp
loym
ent
(th
ou
san
ds)
Source: EPI calculated housing index, including residential building, real estate, and credit intermediation
774,000 Jobs Lost (9.6%)
Manufacturing Employment, Jan. 07 - Nov. 08
12600
12800
13000
13200
13400
13600
13800
14000
14200
Mo
nth
ly e
mp
loym
ent
(th
ou
san
ds)
847,000 Jobs Lost (6.0%)
Retail Employment, Jan. 07 - Nov. 08
14800
14900
15000
15100
15200
15300
15400
15500
15600
Mo
nth
ly e
mp
loym
ent
(th
ou
san
ds)
402,000 Jobs Lost (2.6%)
Automotive Manufacturing Employment, Jan. 07 - Nov. 08
800
850
900
950
1000
1050
Mo
nth
ly e
mp
loym
ent
(th
ou
san
ds)
194,000 Jobs Lost (19.0%)

Source: Bureau of Labor Statistics
0%
2%
4%
6%
8%
10%
12%
Jan
-07
Fe
b-0
7
Ma
r-0
7
Ap
r-0
7
Ma
y-0
7
Jun
-07
Jul-
07
Au
g-0
7
Se
p-0
7
Oct
-07
No
v-0
7
De
c-0
7
Jan
-08
Fe
b-0
8
Ma
r-0
8
Ap
r-0
8
Ma
y-0
8
Jun
-08
Jul-
08
Au
g-0
8
Se
p-0
8
Oct
-08
No
v-0
8
Unemployment
Underemployment
Feb. 08: 4.8%
Feb. 08: 8.9%
Oct. 08: 6.7%
Nov. 08: 12.5%
Unemployment and Underemployment, Jan. 07 - Nov. 08


$50,000
$52,000
$54,000
$56,000
$58,000
$60,000
1989 1990 1991 1992 1993 1994 1995 1996 1997 1998 1999 2000 2001 2002 2003 2004 2005 2006 2007
Me
dia
n I
nc
om
e,
20
07
Do
lla
rsReal Median Income, Working-Age Households,
1989-2007
2000: $58,555
1993: $50,806
2007: $56,545
Source: Bureau of Labor Statistics

-3%
-2%
-1%
0%
1%
2%
3%Ja
n-0
7
Fe
b-0
7
Ma
r-0
7
Ap
r-0
7
Ma
y-0
7
Jun
-07
Jul-
07
Au
g-0
7
Se
p-0
7
Oct
-07
No
v-0
7
De
c-0
7
Jan
-08
Fe
b-0
8
Ma
r-0
8
Ap
r-0
8
Ma
y-0
8
Jun
-08
Jul-
08
Au
g-0
8
Se
p-0
8
Oct
-08
Re
al c
ha
ng
e f
rom
pre
vio
us
ye
ar
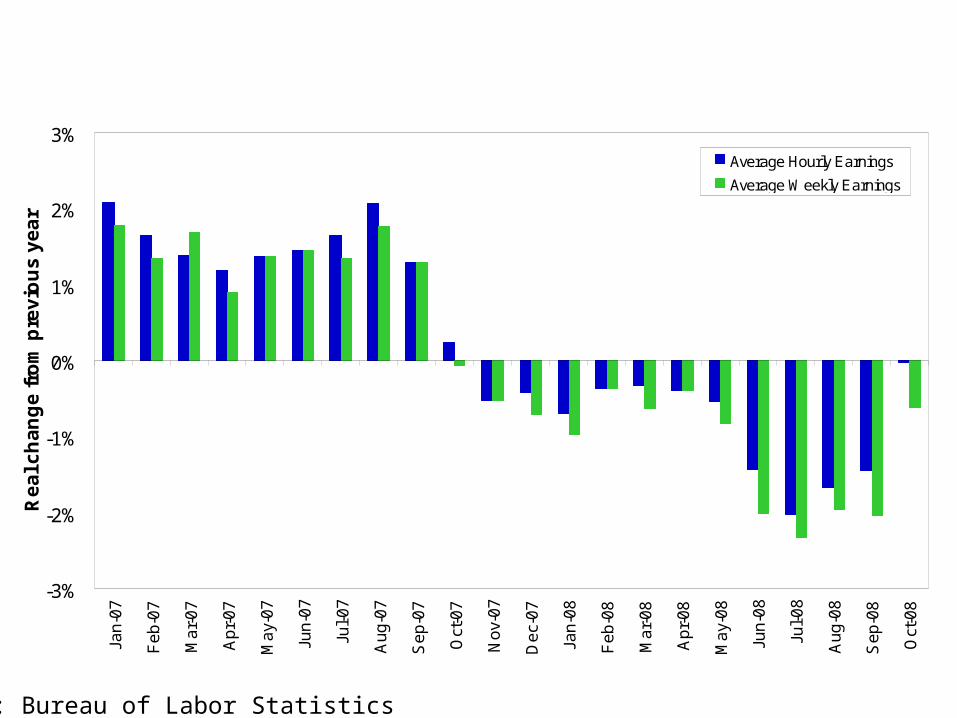
Average Hourly Earnings
Average Weekly Earnings
Yearly Changes in Average Weekly and Hourly Earnings, Jan. 07 - Oct. 08
Source: Bureau of Labor Statistics

Source: Bureau of Labor Statistics
Job Seekers Per Opening, Jan. 07 - Oct. 08
1.0
1.5
2.0
2.5
3.0
3.5
Jan-
07
Feb
-07
Mar
-07
Apr
-07
May
-07
Jun-
07
Jul-0
7
Aug
-07
Sep
-07
Oct
-07
Nov
-07
Dec
-07
Jan-
08
Feb
-08
Mar
-08
Apr
-08
May
-08
Jun-
08
Jul-0
8
Aug
-08
Sep
-08
Oct
-08
Job
See
kers
Per
Op
enin
g
October 2008:3.3 job seekers per opening
January 2007:1.6 job seekers per opening
88
90
92
94
96
98
100
102
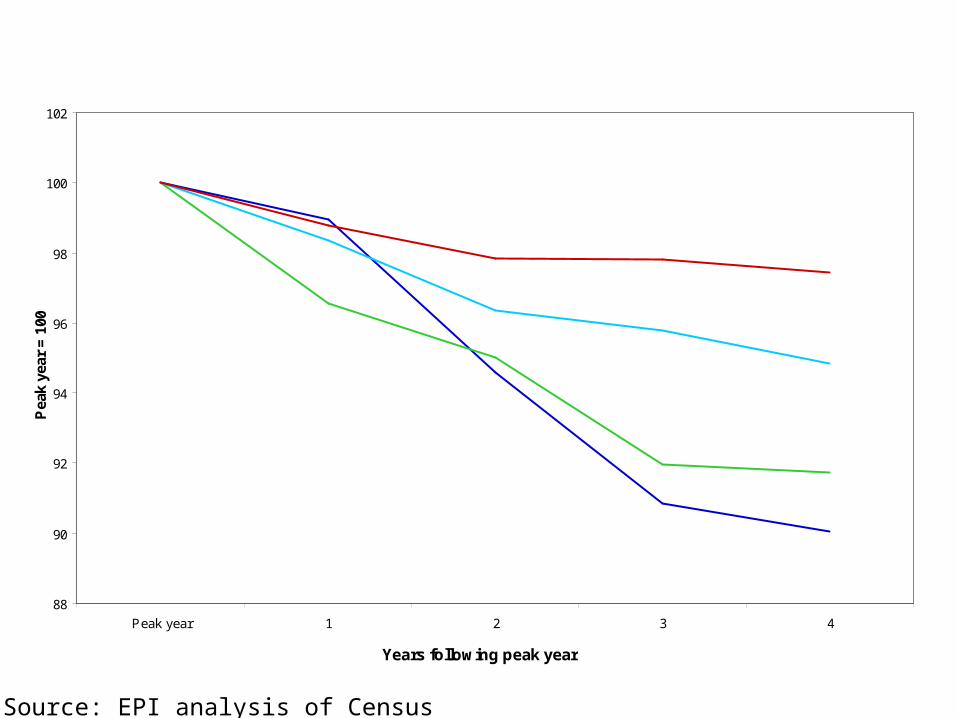
Peak year 1 2 3 4
Years following peak year
Pea
k ye
ar =
100
1989 Lowest fifth
2000 Lowest fifth
1989 Middle fifth
2000 Middle fifth
-3%
-5%
-8%
-10%
Change in Average Real Family Income Following Peak Years,by Selected Income Quintiles
Source: EPI analysis of Census Bureau data

$13,500
$14,000
$14,500
$15,000
$15,500
$16,000
$16,500
$17,000
$17,500
2000 2001 2002 2003 2004 2005 2006 2007 2008 2009
Ave
rag
e In
com
e o
f B
ott
om
Fif
th (
2007
Do
llars
)
$56,000
$57,000
$58,000
$59,000
$60,000
$61,000
$62,000
Ave
rag
e In
com
e o
f M
idd
le F
ifth
(20
07 D
olla
rs)
Bottom Fifth
Bottom Fifth (Forecast)
Middle Fifth
Middle Fifth (Forecast)
Source: EPI Analysis of BLS data and Goldman-Sachs unemployment rate forecasts
2007 - 2009:Middle Fifth: $3,355 lost (-5.5%)Bottom Fifth: $1,128 lost (-7.0%)
Average Income of Bottom and Middle Fifths, 2000-2009 (Forecast)

Poverty Rate, 2000-2009 (Forecast)
0%
2%
4%
6%
8%
10%
12%
14%
16%
2000 2001 2002 2003 2004 2005 2006 2007 2008 2009
Po
ve
rty
Ra
te
Historical
Forecast
Source: EPI Analysis of BLS data and Goldman-Sachs unemployment rate forecasts

125
130
135
140
145
2005 2006 2007 2008 2009 2010 2011 2012
Pa
yro
ll E
mp
loy
me
nt
(Mill
ion
s)
With Stimulus
No Stimulus
Employment Projections, With and Without Stimulus Package
2012 Q4: 144 million
2012 Q4: 140 million
Stimulus creates 4 million jobs by Q4 2012
Source: Mark Zandi, Moody’s economy.com

0
2
4
6
8
10
12
2005 2006 2007 2008 2009 2010 2011 2012
Un
em
plo
ym
en
t R
ate
With Stimulus
No Stimulus
Unemployment Projections, With and Without Stimulus Package
2012 Q4: 7.6%
2012 Q4: 5.5%
Stimulus lowers unemployment by 2.1% in Q4 2012
Source: Mark Zandi, Moody’s economy.com

Un-Real Economy
• Financial Markets: Dow, Nasdaq, S&P 500, Russell 2000…all down about 40% ytd.
• But: good news…”Ted Spread” responding• Housing: some signs bottom in sight, but no
signs re uptick…prices still falling…inventory overhang;
• TARP: Certainly not a confidence builder yet.• Fed: pushing on string but not giving up.

Pres/VP Elect• Fiscal constraints?
• Deficit could go as high as 6% of GDP, but debt around 40% (avg 46% in 1990s).
• Must he alter his long-term plans--hth care/energy?
• There is a time for budget austerity; this ain’t it.
• Middle-class, poor, labor agenda (EFCA, min wg, UI reform, OSHA, etc…)

Their Agenda• Morph his recovery package with House
D’s (Making Work Pay tax cuts; new jobs tax credit; mortgage relief; small biz, UI)
• Manage TARP
• Tax agenda
• Energy/Health Care
• Infrastructure (who gets the jobs?)
• Regulation (Cooper Union speech)

What Have We Learned?
• Markets• Ineq• Public investment• No more TBTF• Financial markets

Learned…cont.
• Budget priorities• Supply-side• Amply funded gov’t• Shampoo economy• Better economists