Embed Size (px)
Citation preview

1
What drives the allocation of the purchase price to goodwill?
By
Martin Bugeja*
University of Technology, Sydney
and
Anna Loyeung
University of Technology, Sydney
Abstract
This paper examines the proportion of the purchase price allocated to goodwill after the
successful acquisition of a publicly listed firm. Using hand collected data on the amount
recorded as goodwill after a takeover, we document that 42% of acquirers record a nil amount
for goodwill. We find that the amount allocated to goodwill is generally unrelated to target
firm economic characteristics. In contrast, consistent with managerial opportunism we find a
positive association between the use of accounting based bonus plans to compensate
acquiring firm CEOs and the amount allocated to goodwill. The amount allocated to goodwill
also increases after Australia adopted IFRS which no longer requires goodwill to be
systematically amortised. Other variables associated with goodwill recognition include, the
acquiring firm’s leverage before the takeover announcement, the takeover premium, whether
the target and the bidder operate in the same industry, existing goodwill in the target firm
before the takeover announcement and the method of payment used in the acquisition. We
also examine the proportion of the purchase price allocated to identifiable intangible assets.
We find that this allocation is largely not associated with opportunism but is explained by
target firm economic characteristics and takeover characteristics.
* Corresponding author: Martin Bugeja, Accounting Discipline Group, The University of Technology Sydney,
2007, New South Wales, Australia. Telephone + 61 2 9514 3743, fax + 61 2 9514 3669.
E-mail address: [email protected].

2
1. Introduction
Following a business combination, accounting standards require consolidation of the
acquired entity into the acquiring firm’s financial statements. As part of the first time
consolidation the parent entity is required to allocate the purchase price to the tangible and
identifiable intangible assets and liabilities acquired (AASB 3: ‘Business Combinations’). As
this allocation is based on the fair value of the respective assets and liabilities the acquiring
firm has significant discretion as to how to allocate the purchase price. Any residual between
the purchase price and the fair value of the identifiable net assets of the acquired firm is then
recorded as goodwill. The objective of this study is to examine the proportion of the purchase
price allocated to goodwill. Specifically, we investigate whether the allocation of the
purchase price to goodwill after an acquisition is explained by opportunism, takeover
characteristics and the underlying financial characteristics of the target and bidding firms.
The motivation for this study is twofold. Firstly, empirical evidence on the allocation
of the purchase price after successful corporate acquisitions is limited. Given that there is
discretion in undertaking this allocation, further evidence is needed on whether allocations
reflect underling target and bidding firm economic characteristics or are driven by managerial
opportunism (Holthausen and Watts 2001). Consistent with managerial opportunism, Shalev
et al. (2013) finds an over-allocation of the purchase price to goodwill when U.S. CEOs
receive bonuses tied to accounting earnings as this, results in increases in post-acquisition
earnings. Their study however, is conducted in a setting where goodwill is required to be
impaired and not required to be amortised post-acquisition. We aim to add to the findings of
Shalev et al. (2013) by investigating a setting where goodwill accounting changed from
systematic amortisation to annual impairment. The Australian setting allows us to understand
how a change in accounting standards impacts on management’s incentives when Australian
firms transition from local GAAP (systematic amortisation setting) to IFRS (annual
impairment setting).
Second, we also add to prior research by investigating whether takeover deal
characteristics impact on goodwill recognition. While goodwill recognition is the outcome of
a successful acquisition, prior studies have generally ignored the fact that takeover
characteristics such as, friendly/hostile acquisitions, synergic acquisitions and the bidding
firm toehold may also explain the amount of recognised goodwill. We argue that when the
bidding firm has more information about the target prior to the acquisition, less goodwill is
recognised. In this instance the bidding firm is able to value the target with more certainty

3
and as a result is unlikely to overpay. Furthermore, as goodwill is a measure of acquisition
synergies, it is expected that more goodwill is recorded when synergistic acquisitions
occur.Using a sample of 308 successful Australian takeovers from 1998 to 2012 we
document that in 42% of takeovers the acquiring firm records neither goodwill nor a bargain
purchase. This high proportion of takeovers with no recorded goodwill is unexpected as it
indicates that the cost of acquisition in these takeovers is exactly equal to the fair value of the
identifiable net assets acquired. This finding suggest that bidding firms managers may be
using their discretion to avoid the costly process of undertaking an accurate purchase price
allocation, which includes complex valuation exercises. Descriptive evidence suggests these
firms have lower leverage and CEO bonuses and are less likely to use cash as a payment
method as opposed to firms which record goodwill. Firms which record no goodwill also
allocate less of the purchase price to identifiable intangible assets. Acquisitions where no
goodwill is recognised also tend to occur when the target and the bidder operate in the same
industry.
We then conduct an analysis of the factors which are associated with the proportion of
the purchase price recorded as goodwill. First, we examine whether goodwill recognition is
associated with proxies for managerial opportunism. Consistent with an opportunism
explanation we find that CEOs with an accounting based bonus plan allocate a greater
proportion of the purchase price to goodwill. This finding suggests that the results of Shalev
et al. (2013) hold in both a goodwill impairment setting and in a goodwill amortisation
setting. We also find that the proportion of the purchase price allocated to goodwill increases
after Australia adopted IFRS and goodwill was no longer amortised. This result suggests that
firms took advantage of the change in accounting requirements by allocating more to
goodwill (and less to other depreciable assets) so as to achieve an improvement in
profitability. Inconsistent with prior findings (e.g., Leftwich 1983 and Mather and Peirson
2006), we document that the amount allocated to goodwill increases with bidding firm
leverage. As goodwill is typically excluded from debt covenants an opportunistic manager
would allocate less to goodwill as debt increases. However, additional analyses suggest that
this positive association between leverage and acquired goodwill only holds when the bidding
firms offer bonuses to their CEOs.
In terms of the takeover characteristics, we find a positive association between
takeover premiums and acquired goodwill. This is consistent with expectations as goodwill is
measured by accounting standards as the difference between the purchase price and the fair

4
value of the identifiable net assets acquired. Since a higher premium increases the purchase
price, this is likely to flow into the amount recorded as goodwill. In addition, we find a
negative association between synergistic acquisitions (i.e., target and bidders which operate
in the same industry) and goodwill recognition. This result is surprising as goodwill is
typically interpreted as representing synergies arising from the acquisition.
We also examine whether the target and bidding firms’ underlying economic
characteristics are associated with goodwill recognition. We find a positive association
between recorded goodwill in acquisitions where the target firms have existing goodwill
suggesting that they remain part of the unidentifiable intangible assets acquired by the
bidding firms. Our analysis suggests that other economic characteristics of the firms, such as,
target identifiable intangible assets, target property, plant and equipment, the target and
bidder market to book ratio are not associated with the proportion of the purchase price
allocated to goodwill. Our results also indicate that the amount recorded as goodwill is
positively associated with the use of cash payment. This result is consistent with prior studies
that show that bidding firms tend to pay more when the payment method is purely cash (e.g.,
Bugeja and Da Silva Rosa 2010).
Overall our results tend to suggest that the underlying economic characteristics of the
target and bidding do not explain the amount allocated to goodwill. In contrast, the findings
tend to support the opportunistic view that managers manipulate the amount of the purchase
price allocated to goodwill.
We contribute to the academic literature in a number of ways. First, we contribute to
the accounting choice literature (Fields et al., 2001 and Armstrong et al., 2010) by examining
managers’ use of discretion in the decision on how to allocate the purchase price in
acquisitions. Our findings suggest that when given accounting flexibility, some managers use
their discretion to adjust the amount of the purchase price in a business combination that is
allocated to goodwill. Second, our results indicate that the purchase price allocation is
conditional on a number of target firm specific factors and takeover characteristics. This
finding is of importance to research which examines the value relevance of goodwill and
goodwill impairment (Barth and Clinch 1996; Jennings et al. 1996; Godfrey and Koh 2001;
Dahmash et al. 2009) as our results indicate that goodwill is endogenously determined. As
such, the factors that are associated with the purchase price allocation are also likely to be
associated with the value relevance of goodwill.

5
Second, we extend previous research which examines the consequences of the
adoption of IFRS (Barth et al., 2008; Daske et al., 2008; Chalmers et al., 2011a; Chalmers et
al., 2012, Cotter et al., 2012; Horton et al., 2013; Lai et al., 2013). Our investigation of
purchase price allocations pre- and post- Australia’s adoption of IFRS provides evidence on
whether the accounting requirements for goodwill influences the proportion of the purchase
price allocated to goodwill. Assuming that the purchase price allocation reflects the
underlying characteristics of the takeover and the target and acquiring firms, changes in
accounting rules are not expected to influence the amount allocated to goodwill. In contrast,
if the purchase price allocation reflects opportunism we predict that prior to 2005 acquiring
firms allocated a lower percentage of the purchase price to goodwill. This expectation arises
because during that time period there was discretion available in regards to the amortisation
of intangible assets and no discretion regarding the amortisation of goodwill. Furthermore,
we also expect that after goodwill amortisation was removed (i.e. post- 2005) that the under
allocation of the purchase price to goodwill is reduced.
The remainder of this paper is structured as follows. The next section provides the
background to accounting for business combinations in Australia and related research.
Section 3 develops the theory and describes the research method. Section 4 provides a
discussion of the data collection process. Results of our analysis are presented in section 5,
whilst section 6 concludes the paper.
2. Background
2.1 Accounting for goodwill in Australia
The accounting requirements for corporate acquisitions in Australia are currently
prescribed in AASB 3. This accounting standard requires goodwill to be measured as the
difference between the purchase consideration and the fair value of the identifiable net assets
acquired (paragraph 32). Where the purchase consideration is not cash the purchase
consideration must be measured using the fair value of the assets or equity provided as
consideration (paragraph 37). Prior to Australia’s adoption of IFRS in 2005 the amount
recorded as goodwill was systematically amortised to earnings over a maximum period of 20
years (AASB 1013). After the adoption of IFRS, however, AASB 136 requires that goodwill
is no longer amortised but is subject to annual impairment testing.
Johnson and Petrone (1998) separate the amount recorded as purchased goodwill into the
following components:

6
i) The difference between the fair value and book value of the target firm’s
recognised net assets;
ii) The fair value of net assets not recognised by the target firm such as internally
generated intangible assets;
iii) The fair value of the going concern component of the target firm as a standalone
business (i.e., internally generated goodwill);
iv) The fair value of any synergies arising from the business combination between the
target and bidding firms (i.e. purchased goodwill);
v) Over or undervaluation of the consideration paid by the bidder.
vi) Over or under payment by the bidder
Under the requirements of the accounting standards only components iii) and iv)
should be recorded as goodwill. Components i) and ii) are required under accounting
standards to be recorded separately as part of the business combination. However, in practice
due to measurement difficulties or a lack of expertise by the acquiring firm and their auditors
it is possible that these components are included as part of goodwill. Similarly, components
v) and vi) do not represent goodwill but are likely to be included in the amount designated as
goodwill due to this amount being recorded as the residual balance. As the manner of
calculating goodwill relies on estimating the fair values of non-traded assets managers are
afforded significant discretion in determining the amount allocated to any class of assets and
ultimately goodwill.
2.2 Related research on goodwill
The accounting for purchased goodwill has been the subject of controversy for many
years. The first point of contention regarding purchased goodwill is whether acquired
goodwill is an asset (Johnson and Petrone 1998). The recognition of goodwill as an asset is
problematic as it is arguable as to whether goodwill provides future economic benefits. As a
reflection of the uncertainty as to whether goodwill is an asset, the preferred treatment of the
earlier UK accounting standard was that goodwill acquired in an acquisition be immediately
written-off to reserves (Standard Accounting Practice 22: ‘Accounting for Goodwill’). To test
whether goodwill warrants reporting on the balance sheet as an asset prior studies have
examined the value relevance of goodwill (Chauvin and Hirschey 1994; Barth and Clinch
1996; Jennings et al., 1996; Godfrey and Koh 2001; Bugeja and Gallery, 2006; Dahmash et

7
al., 2009). Generally, these studies find that investors view recorded amounts of goodwill as
representing valuable economic resources.
Another area which has been investigated in prior literature is the treatment of
goodwill post- recognition. Until recently most countries required that goodwill be subject to
periodic amortisation with additional write-offs required if goodwill was considered
impaired. For instance, until the issue of Statement of Financial Accounting Standard No. 142
(SFAS 142: ‘Goodwill and Other Intangible Assets)’ in 2001, goodwill in the U.S. was
required to be amortised over a maximum period of 40 years. Empirical studies in this area
have shed light on the causes and market reaction to goodwill write-offs.
In terms of the causes of goodwill write-offs, prior studies document that acquisition
characteristics and performance indicators are associated with goodwill write-offs.
Subsequent goodwill impairment has been found to be positively associated with the payment
of higher takeover premiums and the amount initially recorded as goodwill (Hayn and
Hughes 2006; Gu and Lev 2011 and Li et al., 2011). Empirical findings also suggest that the
mode of consideration used in the acquisition is also associated with goodwill impairment.
Specifically, the component of consideration paid using overvalued stock is positively
associated with goodwill impairment (Hayn and Hughes 2006; Gu and Lev 2011 and Li et al.,
2011). Goodwill impairment frequency has been found to be lower in focus enhancing
acquisitions (Li et al., 2011) and in takeovers made by firms with strong corporate
governance mechanisms (Gu and Lev 2011). Furthermore, Godfrey and Koh (2009) find that
goodwill impairment charges in the U.S. are negatively related to a firm’s investment
opportunity set. In the Australian setting, Chalmers et al. (2011b) find that goodwill charges
are negatively associated with a firm’s investment opportunity set only in the goodwill
impairment regime (i.e. post- IFRS).
Evidence on the market reaction to goodwill write-offs provides mixed findings.
While Francis, et al. (1996) find little share price reaction to goodwill write-offs, others have
documented evidence of negative abnormal returns (e.g. Hirschey and Richardson 2002;
Hayn and Hughes 2006; Bens et al. 2011; Li et al. 2011). Furthermore, Abu Ghazaleh et al.
(2012) document a significantly negative association between goodwill write-offs and the
market value of equity.
Prior research has also documented that when given a choice managers often prefer to
minimise the amount recorded as goodwill. For example, prior to the introduction of an

8
enforceable accounting standard the most common methods used to account for goodwill in
Australia avoided systematic amortisation (Gibson and Francis 1975; Anderson and Zimmer
1992). U.S. research has studied reasons for firms’ preference for the pooling rather than the
purchase method of accounting for acquisitions and concludes that this choice is driven by a
desire to maximise reported earnings (Gagnon 1967; Copeland and Wodjak 1969; Aboody et
al., 2000 and Ayers et al., 2002).
More recently Shalev et al. (2013) study the amount allocated to goodwill for a
sample of U.S. acquisitions. Consistent with opportunism they find evidence showing an
over-allocation to goodwill by firms whose CEOs receive a greater proportion of their
remuneration from accounting based bonus-plans. As goodwill is not amortised, allocating a
higher amount of the purchase price to goodwill likely increases post-acquisition earnings
and bonuses. However, their study takes place solely during a period of time when
accounting standards required goodwill to be impaired, they do not provide evidence on
whether the move from goodwill amortisation to impairment changed the proportion of the
acquisition price allocated to goodwill. This study provides such evidence.
3. Theory development and research method
3.1 Determinants of the purchase price allocated to goodwill
3.1.1 Opportunism
Under the opportunistic view, managers use their discretion to either over or under
allocate the purchase price to goodwill. The likelihood of opportunistic behaviour arises
because the measurement of goodwill requires numerous estimates of fair values when
assigning the purchase price to identifiable net assets (Holthausen and Watts 2001; Ramanna
2008). In particular, the majority of assets acquired are likely to not be traded on active
markets increasing the need for subjective fair value estimates. We argue that managers may
use this discretion to opportunistically determine the amount recorded as goodwill for a
number of reasons. For instance, firms may have incentives to minimise the costs of
completing an accurate purchase price allocation. As mentioned in section 2.1, the accounting
standard requires acquiring firms to calculate the fair values of both recorded and unrecorded
target firm identifiable net assets when calculating goodwill. This exercise is complex and
requires an acquiring firm and their auditors to undertake difficult and costly valuation
exercises. For some firms it may be simpler and less costly to simply pro rata the value of the

9
purchase consideration across the non-monetary assets of the target firm so that the amount
allocated to such assets equates to the purchase consideration resulting in no goodwill being
recorded. An additional incentive for recording a nil balance of goodwill is that it also avoids
the complex annual task for preparers and auditors of testing the goodwill balance for
impairment.1 Finally, recognising a nil amount of goodwill means that firms do not have to
recognise decreases in post-acquisition earnings either through systematic amortisation or
annual impairment.
In line with managerial opportunism, we expect the decision to recognise goodwill to
be associated with the financial reporting environment. Prior to Australia’s adoption of IFRS,
goodwill was amortised for a period not exceeding 20 years which decreases post-acquisition
profits. This gives managers an incentive to report higher earnings by allocating more of the
purchase price to longer lived assets or to assets with an indefinite life and less to goodwill, to
avoid recording the systematic goodwill amortisation expense. This expectation is supported
by prior research which suggests that managers prefer to avoid the amortisation of goodwill
due to its income decreasing effect. For example, Gore et al. (2000) report that U.K. CEOs
with profit based compensation plans prefer to immediately write-off goodwill to reserves as
opposed to recording goodwill as an asset. Furthermore, U.S. research indicates that firms are
willing to pay an additional premium to avoid the need to amortise goodwill through the use
of the pooling method of accounting (Robinson and Shane 1990 and Ayers et al., 2002). This
line of research suggests that firms are reluctant to record goodwill when it needs to be
amortised.2 Thus, it is expected that before the adoption of IFRS in Australia, managers used
their discretion to recognise less goodwill.
Post- Australia’s adoption of IFRS, however, goodwill was no longer subject to
amortisation but was subject to annual impairment testing. If managers act opportunistically
they have an incentive to over-allocate an amount to goodwill as opposed to other depreciable
assets to avoid a systematic annual charge against earnings (Shalev et al., 2013). A counter
argument is that over-allocating an amount to goodwill increases the probability that the firm
needs to impair goodwill which potentially increases earnings volatility post-acquisition.
There are also costs associated with the subsequent impairment of goodwill such as negative 1 Prior to Australia’s adoption of IFRS in 2005 goodwill was also tested annually for impairment (AASB 1013 paragraph 5.4). In 2009, The IASB issued IFRS for Small and Medium Sized Entities (SME’s) which highlights that accounting standard setters recognise the complexity of goodwill impairment testing. That standard requires SME’s to amortise goodwill over its estimated useful life, with the life set at 10 years if it cannot be reliably estimated (paragraphs 18.19, 18.20 and 19.23). 22 Accounting standards in Australia have never allowed the use of the pooling method of accounting.

10
stock returns (e.g. Bens et al., 2011; Li et al., 2011) and a decrease in firm value (e.g. Abu
Ghazaleh et al., 2012). Although these capital market effects may motivate managers to not
over-allocate an amount to goodwill we argue that there is an important difference between
goodwill impairment and amortisation. In particular, managers have greater discretion as to
when an impairment charge is recorded compared to certain annual amortisation.
Additionally, it is unlikely that at the time of making a takeover that bidding firm
management expects that they will subsequently need to impair goodwill, particularly if they
are ‘infected’ with hubris (Roll 1986).
There are also likely to be contractual incentives for managing the amount recorded as
goodwill. First, goodwill and other intangible assets are typically not included in the
calculation of leverage in debt contract covenants (Cotter, 1998), prompting managers to
allocate more of the purchase price to tangible assets rather than goodwill (e.g. Grinyer et al.,
1991; Wong and Wong 2001; Beatty and Weber 2006). 3 Second, when CEOs receive a
higher level of compensation which is tied to accounting earnings they have an incentive to
manipulate the amount recorded as goodwill to maximise their remuneration (Watts and
Zimmerman 1990; Shalev et al., 2013). Thus, we expect that prior to the adoption of IFRS,
when a firm compensates their CEO using an accounting based bonus plan that the firm
minimises the amount allocated to goodwill to avoid goodwill amortisation and hence
maximise earnings. Furthermore, when goodwill amortisation was replaced by impairment
post- IFRS we expect this association to reverse.
Therefore under the opportunistic view, managers use their discretion to manage the
amount allocated to goodwill. This leads to the first hypothesis.
H1a: The amount allocated to acquired goodwill increases after the adoption of IFRS
and decreases with bidding firm leverage.
3 Beatty and Weber (2006) document that more than 50 per cent of bank debt contracts had covenants that exclude goodwill (amongst other intangible assets). In terms of the association between goodwill and leverage, Grinyer et al. (1991) find that the amount of goodwill is negatively related to acquiring firm leverage. Wong and Wong (2001), however, argue that this finding is also consistent with an investment opportunity set explanation. They find that the amount allocated to goodwill for a sample of New Zealand takeovers is higher for firms with lower leverage and interpret their result to indicate that firms with lower leverage have a better investment opportunity set and as a result allocate a greater amount to goodwill. The influence of leverage on goodwill recognition is also examined by Gore et al. (2000). They study management’s preference for capitalising goodwill or immediately writing goodwill off against reserves using a survey conducted in the UK. They find that manager’s prefer goodwill capitalisation when their firm has high gearing and a gearing based debt covenant restriction in place as the immediate write-off option would have the effect of increasing gearing by reducing firm equity.

11
H1b: The amount allocated to acquired goodwill is associated with the use of CEO
bonus plans based on accounting profit.
Monitoring of opportunistic behaviour
In order to curb managerial discretion and to protect the interest of shareholders, firms
are likely to put monitoring systems in place. We take the view that Big 4 auditors provide
higher quality audits and object to managerial discretion to misreport the accounts (e.g.
Francis and Yu 2009). Also Big 4 auditors possess more expertise and resources than non-
Big 4 firms and are better able to accurately identify unrecognised intangibles and to also
value both recognised and unrecognised target firm assets. In contrast, non-Big 4 auditors are
more likely to accept a simplistic approach of proportionately allocating the purchase price
across existing target firm net assets resulting in no goodwill being recorded. Big 4 auditors
are also more likely to have the skills to conduct complex goodwill impairment testing.
Therefore, we expect that bidders audited by a Big 4 audit firms to report more goodwill as
Big 4 audit firms have both the ability to measure goodwill accurately and the incentives to
curb managers’ discretion to prepare their purchase price allocation opportunistically.
Furthermore, it is possible that the relative size of the target firm to the bidding firm
impacts on the acquirer’s decision to recognise goodwill. Grinyer et al. (1991) argue that
takeovers which are considered large compared to the bidding firm’s size attract more
attention (for example, from the media). In this instance, we expect managers to exercise less
discretion and expect that they devote more resources to achieving greater accuracy in the
allocation of the purchase price to the various assets, including goodwill. Auditors are also
likely to pay greater attention to the purchase price allocation in larger takeovers due to
materiality reasons. As a result we expect a positive association between the relative size of
the takeover and acquired goodwill.
In summary, external monitoring from audit firms, debt holders and other
stakeholders are expected to curb managers’ discretion in misreporting acquired goodwill
suggesting a positive association between acquired goodwill and monitoring practices. This
leads to our second hypothesis.
H2: There is an association between acquired goodwill and the use of Big 4 auditors
and the relative size of the acquisition

12
3.1.2 Takeover deal characteristics
The successful acquisition of a target firm is the result of extensive negotiations
between the bidding firm and the target firm. We argue that a number of takeover
characteristics influence the amount allocated to goodwill as they impact on the purchase
price. First, we argue that greater access to information about the target firm gives the bidder
an increased ability to accurately identify and value the target firm assets both before and
after making a bid. As a result, the consideration offered is expected to be closer to the fair
value of the net identifiable assets leading to a lower risk of overpayment and hence a
reduction in the amount recorded as goodwill (i.e., category vi. of Johnson and Petrone
1998).
A higher ownership interest by the bidder in the target firm prior to the takeover (i.e.,
toehold) is likely to give the bidder greater access to target firm financial information prior to
the takeover. This better information set may arise for example through the preparation of
equity accounting. In addition, a prior equity stake in the target may provide the bidding firm
with the ability to appoint a director to the target firm board thus reducing information
asymmetry. Hence, we predict a negative association between the pre- takeover ownership
interest of the bidding firm and acquired goodwill.
Whether the takeover is friendly or hostile is also expected to be associated with
acquired goodwill. In friendly takeovers, the target firm typically grants permission for the
bidder to conduct due diligence. This due diligence process provides the bidder with more
detailed information on the value and existence of target firm assets and as a result the bidder
may be less likely to over pay for the target firm. As a result, we predict a negative
association between friendly takeovers and acquired goodwill.
A higher takeover premium may result in a greater amount of the purchase price being
recorded in goodwill. The additional premium is expected to flow through to the amount
recorded as goodwill, given that goodwill is calculated as the difference between the
acquisition price and the target firm net identifiable assets. Takeover premiums may also
reflect the acquisition synergies that the bidding firm expect from an acquisition (Sudarsanam
and Sorwar (2010).4 Arguably operating synergies are also expected to be greatest when the
bidding firm and the target firm are in the same industry. Given that goodwill is argued to be
4 A higher takeover premium is also paid if managers suffer from hubris or overconfidence whereby they overestimate their ability to generate future returns (Roll 1986; Malmendier and Tate 2008).

13
a measure of acquisition synergies, we expect the takeover premium and acquisitions in the
same industry to be positively associated with goodwill recognition.
The above arguments lead to the third hypothesis.
H3a: There is a negative association between acquired goodwill and the bidding firm
toehold and friendly acquisitions.
H3b: There is a positive association between acquired goodwill and takeover
premiums and acquisitions in the same industry.
3.1.3 Economic characteristics of the target and bidding firm
The purchase price allocation to goodwill is fundamentally determined by the
underlying economic characteristics of the target and the bidding firms. We argue that more
goodwill is recognised in acquisitions of target firms which have greater amounts of existing
goodwill prior to the acquisition. The existing goodwill of the target firm is expected to
remain part of the unidentifiable intangible assets identified by the bidding firm (Shalev et al.,
2013). Furthermore, the method of accounting for a business combination requires the
recording of all tangible and identifiable intangible assets at fair value before calculating the
amount of goodwill. Therefore, it is expected that a higher amount of acquired target firm
tangible and intangible assets pre-acquisition reduces the amount allocated to goodwill.
In terms of the economic characteristics of the bidding firm, overvalued bidders (as
captured by market to book ratio) are more likely to overpay in an acquisition (Li et al. 2011).
This overpayment is expected to overstate the amount allocated to goodwill since goodwill is
the residual between the purchase price and the identifiable net assets acquired. Finally, we
argue that the payment method used (equity versus cash) may also explain the amount of the
purchase price allocated to goodwill. Results from prior research suggest that the bidding
firm is likely to pay higher premiums when the payment method is cash (e.g., Bugeja and Da
Silva Rosa 2010). Moreover, equity payments by the bidding firm may indicate that the
equity of the bidding firm is overvalued (Myers and Majluf 1984). This overvaluation is
likely to increase the amount recorded as goodwill. Given the two competing views, we argue
that there is an association between the payment method and the amount of the purchase price
recorded as goodwill but do not make a prediction as to the sign of the direction.

14
H4: There is an association between acquired goodwill and the economic characteristics of
the bidding and the target firms.
We empirically test the factors that influence the choice to record goodwill using the
following tobit regression model:5
GW_DV = i + 1IFRS + 2B_LEV + 3BONUS + 4IFRSxBONUS + 5 BIG4 + 6RELSIZE +
7TOEHOLD + 8FRIENDLY + 9PREMIUM + 10SAMEIND + 11T_GW_DV +12T_PPE_DV +
13T_IIA_DV + 14T_MB + 15B_MB +16PAYCASH+ i (1)
The dependent variable GW_DV is the dollar value of the purchase price allocated to
goodwill scaled by the value of the deal. Our first set of variables capture managerial
opportunism. To identify takeovers in which the first year of consolidation occurs after
Australia adopted IFRS we include in the model an indicator variable (IFRS). We also
control for contractual incentives to manage the amount allocated to goodwill. Bidder firm
leverage (B_LEV) measured using the ratio of debt to equity for the financial year prior to the
acquisition is used to control for the incentive of firms to allocate the purchase price to
tangible assets which are included in debt covenant ratios. The influence of CEO bonus plans
is controlled in the model using an indicator variable coded as one if the firm compensates
their managers using a bonus plan based on accounting earnings (BONUS). This variable is
also interacted with the IFRS indicator variable to determine whether the association between
CEO compensation structure and the amount allocated to goodwill changed after the adoption
of IFRS (IFRSxBONUS).To capture the strength of the monitoring system in place to curb
managerial opportunism we include in the model, an indicator variable highlighting
acquisitions in which the acquiring firm uses a Big 4 auditor in the first financial year in
which the target firm is consolidated, zero otherwise (BIG4). As indicated above we
including bidding firm leverage in the model. This variable also controls for the monitoring
role of debt holders.6 We also include in the regression the relative size of the target to the
bidder measured using the natural logarithm of the target firm to acquiring firm market
capitalisation two months before the takeover announcement (RELSIZE).
To control for takeover characteristics we include four variables in model (1). First,
we control for the equity ownership of the bidder in the target at the date of the takeover
announcement (TOEHOLD). We also identify whether the takeover offer is friendly.
5 A tobit regression is used since the amount allocated to goodwill is censored at zero. 6 We use the acquiring firm leverage ratio the year before the acquisition to exclude the effects of the takeover on leverage after the acquisition. Results are unchanged if we use leverage in the first year the target firm is consolidated.

15
Friendly takeovers are denoted in the regression using a binary variable coded as one when
the initial recommendation of the target firm board is takeover acceptance (FRIENDLY). To
capture synergies arising from the acquisition we control for the takeover premium and
industry of the target and bidding firms. The takeover premium (PREMIUM) is calculated as
the offer price minus the target share price two months prior to the takeover announcement,
divided by the price two months prior to the takeover announcement. We also control for
SAMEIND which is an indicator variable set to equal to one if the target and bidder firm
operate in the same industry as measured using two-digit GICS codes.
We also control for the economic characteristics of the target and the bidding
firms. First, we include the amount of the existing goodwill on the target firm balance sheet
(T_GW_DV). Goodwill already recorded by the target firm is expected to remain part of the
unidentifiable assets of the combined group and as a result should be positively associated
with the percentage of the purchase price allocated to goodwill. As the amount allocated to
goodwill is determined after adjusting the fair values of other target firm assets we include
controls for the target firm’s net property plant and equipment (T_PPE_DV) and recognised
identifiable intangible assets (T_IIA_DV). These three variables are extracted from the target
firm financial statements for the financial year prior to the takeover and are scaled by deal
value. If the difference between the purchase consideration and the book value of target firm
assets is recorded firstly against already recognised assets then there is expected to be a
negative association between T_PPE_DV and T_IIA_DV and recorded goodwill. To capture
the growth potential of the target firm, we control for the target firm’s market to book ratio
calculated two months before the takeover announcement (T_MB).7 Finally, we control for
the bidding firm’s market to book ratio (B_MB) and consideration form used by the bidding
firm through the use of an indicator variable denoting takeovers in which the payment form is
completely cash, zero otherwise (PAYCASH).
We control for industry fixed effects in the estimation of model (1) through the use of
indicator variables based on the target firm two digit GICS code. In the interest of brevity we
do not report the results on these variables. Standard errors are also clustered by the year of
takeover announcement to correct for potential serial correlation. Appendix 1 provides a
summary of the definitions of all variables used in this study.
7 The market value two months before the takeover announcement is used as there is often a run-up in target share price leading up to the takeover announcement (Schwert 1996). In additional tests we also include the target firm sales growth in the two years leading up to the takeover announcement (T_GROWTH) as an additional variable in the model.

16
4. Sample and data
The Connect 4 Mergers and Acquisitions database is used to identify all takeovers
announced for Australian Securities Exchange (ASX) listed targets between 1998 and 2012.
This search identified 1,239 takeovers. Since this study is investigating the amount allocated
to goodwill after successful acquisitions it is necessary to exclude 394 unsuccessful
takeovers. As the amount of goodwill recorded after an acquisition is collected from the
financial statements of the successful bidder we delete 346 takeovers in which the bidding
firm is not listed on the ASX. For a similar reason it is also necessary to eliminate 20
takeovers in which the acquiring firm is delisted from the ASX prior to the dissemination of
their financial statements post- acquisition. Due to missing data needed to estimate the
variables we remove 171 observations from the estimation of model (1). The sample
collection process is summarised in Table 1.
INSERT TABLE 1 HERE
Panel A of Table 2 presents the temporal distribution of the sample. The two years
with the highest proportion of takeovers are 2006 and 2007 with respectively 10.4% and
9.4% of successful takeovers occurring in these two years. The lowest number of takeovers
occurs in the first year of the sample (i.e., 1998).
INSERT TABLE 2 HERE
The breakdown of the sample by target and acquiring firm industry is shown in Panel
B of Table 2. Industrial classification is based on target and acquiring firm two digit GICS
codes. Approximately 30% of target and bidding firms are from the materials sector. The
second largest sector included in our sample is financial firms (approximately 16%), followed
by takeovers in the consumer discretionary industry (between 13-14%). The industry sector
with the lowest representation in the sample is utilities. We control for industry fixed effects
in the estimation of our regression models using indicator variables for target firm two digit
GICS codes.

17
We collect the amount of the purchase price allocated to goodwill for each target firm
by firstly downloading the acquiring firm’s financial statements subsequent to the takeover
using the Morningstar DatAnalysis database. We then read through the notes to the accounts
to determine the first year in which the target firm is consolidated. For this financial year we
hand collect the amount (if any) of the purchase price allocated to goodwill and identifiable
intangible assets.8 We also hand collect for that year details of the acquiring firm auditor and
whether the financial statements are prepared using IFRS. The target firm takeover
documents lodged with the ASX are used to manually collect information on the
recommendation of the target firm board to shareholders. In a similar fashion, we collect
from the bidding firm documents lodged with the ASX details of: the bidding firm toehold,
the initial offer price and the method of payment. The Morningstar DatAnalysis database is
used as the source of both the target and bidding firm takeover documents. Share price
information used to calculate takeover premiums, relative size and market to book ratios are
extracted from the Core Research Database maintained by SIRCA. Accounting information
needed to calculate bidding firm leverage, and asset values (i.e, goodwill, identifiable
intangible assets and property plant and equipment) and the book values of equity for the
target and acquiring firm are obtained from the financial statements released for the year prior
to the takeover announcement. We determine the existence of an accounting based bonus
plan for the bidding firm CEO by reading through the directors’ report included in the
bidding firm’s annual report in the year prior to the takeover announcement.
Table 3 presents descriptive statistics for the variables included in the regression
model.
INSERT TABLE 3 HERE
Panel A of Table 3 presents descriptive statistics for each variable after partitioning
the firms into those with no goodwill and firms which report positive goodwill. The results
CEO bonuses (BONUS ($000)) are significantly higher for firms reporting goodwill. This
preliminary evidence is consistent with the opportunistic argument whereby managers use
their discretion to recognise more goodwill. The results also indicate that firms which record
goodwill have higher leverage and engage Big 4 auditors consistent with a monitoring
8 Due to a lack of disclosure we are unable to further partition identifiable intangibles into separate categories (e.g., brand names, patents etc.).

18
explanation. Firms recognising goodwill also report larger amounts of acquired identifiable
intangible assets (IIA ($m)) and are more likely to use cash as the method of payment
(PAYCASH). Surprisingly, these descriptive results show that goodwill is less likely to be
recorded with the target and acquiring firm operate in the same industry (SAMEIND).
Panel B of Table 3 presents the mean for each of the variables after partitioning the
sample by whether the takeover is first consolidated before or after the adoption of IFRS. A
comparison of variables before and after the adoption of IFRS shows that the percentage of
the purchase price allocated to goodwill is higher after the adoption of IFRS, although the
difference is insignificant. A number of the other variables show significant changes after the
adoption of IFRS. The results show that the target and bidding firm market-to-book ratios
(T_MB and B_MB) and the use of friendly acquisitions (FRIENDLY) are significantly higher
in the post- IFRS sub-sample. In contrast, after the adoption of IFRS we find a significant
decrease in the ownership stake of the bidder in the target firm (TOEHOLD).
Panel C of Table 3 presents descriptive statistics for the variables in model (1)
partitioned by whether the CEO of the acquiring firm has an accounting based compensation
plan in place for the year prior to the takeover. There is no significant difference for the
proportion of the purchase price allocated to goodwill and identifiable intangible assets for
firms with and without a CEO accounting based bonus plan in place. We find that acquiring
firms which use accounting based bonus plans are more likely to offer cash payment
(PAYCASH) and engage Big 4 audit firms (BIG4). The greater use of Big 4 auditors by these
firms is suggestive of larger firms remunerating their CEO with accounting based bonus
schemes.
The descriptive statistics presented in Table 3 show the presence of significant
outliers. As a result we winsorise the top and bottom 1% of the continuous variables when
estimating model (1).
Table 4 presents a Pearson correlation matrix for the variables included in the
regression model.
INSERT TABLE 4 HERE
We find a significant positive correlation between bidding firm leverage (B_LEV) and
the percentage allocated to goodwill. Also, consistent with predictions there is a significant
negative association between the acquiring firm toehold (TOEHOLD) and the amount

19
allocated to goodwill. In line with expectations, there is a significant positive correlation
between takeover premiums (PREMIUM) and the percentage of the purchase price allocated
to goodwill. As predicted, the results show a significant positive correlation between the
proportion of the purchase price allocated to goodwill and the pre- takeover goodwill of the
target firm (T_GW_DV). The positive correlation between pre-takeover target firm PPE
(T_PPE_DV) and the proportion allocated to goodwill is however unexpected. The size of the
correlations between the independent variables included in the model (1) indicates that
multicollinearity is unlikely to be a concern with the estimation of the regression model. This
is confirmed by VIF diagnostics testing conducted after estimating the regression model.
5. Results
5.1 Purchase price allocated to goodwill
The results of estimating regression model (1) examining the factors which influence
the percentage of the purchase price allocated to goodwill are presented in Table 5.
INSERT TABLE 5 HERE
The first six independent variables are proxies for opportunism and monitoring. The
dummy variable denoting takeovers consolidated using IFRS is positive and significant
indicating that the change from goodwill amortisation to goodwill impairment increased the
proportion of the purchase price allocated to goodwill. This finding indicates that firms have
taken advantage of the new accounting regime to allocate more of the purchase price to a
non-amortised asset which results in higher reported earnings. The results also show that
acquiring firms with higher pre-acquisition leverage (B_LEV) are more likely to allocate a
greater percentage of the purchase price to goodwill.9 This finding is inconsistent with an
opportunism explanation but could be suggestive of the increased monitoring of debt holders
in financial reporting. Greater monitoring of borrowers may be more likely in Australia due
9 This result is inconsistent with prior studies as firms with higher leverage would be expected to allocate a greater proportion of the purchase price to tangible assets to allow the firm to loosen any debt covenants that are defined excluding intangible assets. Our results are also inconsistent with Wong and Wong (2001) who argue that firms with low leverage have a better investment opportunity set and as a result allocate a greater amount of the purchase price to goodwill.

20
to the prevalence of corporate lending from public banks as opposed to public debt issues
(Cotter, 1998).
The result on BONUS is positive and significant, but the interaction of this variable
with IFRS is insignificant. As such, our results suggest that bidding firms which compensate
their CEO with accounting based remuneration allocate a greater proportion of the purchase
price to goodwill and this association was unchanged after Australia’s adoption of IFRS. A
possible explanation of this finding is that before IFRS adoption goodwill was amortised over
a maximum period of 20 years. As this amortisation period likely exceeds the useful life
employed for other tangible assets, allocating a greater amount of the purchase price to
goodwill is likely to minimise depreciation and amortisation charges and maximise firm
profit. Turning to the variables which proxy for firm monitoring we find no association
between Big 4 audit firms (BIG4) and the relative size of the target to the bidder (RELSIZE)
and the amount of the deal value allocated to goodwill.10
H3a predicts that due to lower information asymmetry the proportion of the purchase
price recorded as goodwill is lower in friendly acquisitions and acquisitions in which the
bidding firm has a higher toehold. The results, however, are inconsistent with expectations
with an insignificant coefficient on both TOEHOLD and FRIENDLY. We find a significant
positive association between takeover premiums (PREMIUM) and the percentage of the
purchase price allocated to goodwill. This result is unsurprising because as discussed by
Johnson and Petrone (1998), goodwill is calculated as the residual between the purchase price
and the fair value of the net assets acquired. Since a higher premium mechanically increases
the size of the purchase price this is likely to result in a higher amount being recorded as the
residual difference (i.e., goodwill). The coefficient on SAMEIND is significant but the
negative sign is counter to our expectations. As synergies would be predicted to be higher in
takeovers amongst firms in the same industry it was expected that these takeovers would
result in a higher amount being allocated to goodwill.
In terms of the economic characteristics of the target firm, we only find the coefficient
on T_GW_DV to be significant in the predicted direction with the results indicating a higher
amount is allocated to goodwill when the target firm has greater pre-existing goodwill.
10 We also estimate the regression replacing the relative size variable with separate variables for the acquiring and target firm size measured using the natural logarithm of the market capitalisation of each firm two months prior to the takeover announcement. Both the target and bidder size variables in this alternative regression are insignificant and the other results remain unchanged.

21
Surprisingly, target and the bidder firm market-to-book ratios are insignificant in the
regression results. We find that goodwill is more likely to be recorded when the method of
payment is cash (PAYCASH). As acquiring firms which offer equity have flexibility in
regards to the value attributed to the purchase consideration our findings suggest that
acquiring firms use this flexibility to record less goodwill. An alternative explanation is that
the characteristics of target firms acquired with cash are associated with a higher level of
purchased goodwill. Interestingly, our findings are inconsistent with prior studies which
document greater goodwill and goodwill impairment when equity is used as payment
consideration (Hayn and Hughes 2006; Gu and Lev 2011 and Li et al., 2011).
5.2 Additional analysis
The results presented above show that acquiring firms which compensate their CEO
using an accounting based bonus plan allocate a greater amount of the purchase price to
goodwill. This conclusion is similar to that reported in Shalev et al. (2013). A possible
concern with this finding is that firms self-select whether to offer an accounting based
compensation plan to their executives. As such, the result we document may be driven by
omitted correlated variables that are associated with the decision to offer the CEO an
accounting based bonus plan. To partially address this concern we partition our sample into
those firms with and without a CEO accounting based bonus plan and estimate model (1)
separately for each of these two groups. These results are presented in Table 6.
INSERT TABLE 6 HERE
A comparison of the findings shown in Table 6 indicates a contrasting effect of the
adoption of IFRS on the allocation of the purchase price to goodwill for the two groups. For
firms with an accounting based bonus plan the IFRS dummy is insignificant suggesting that
the change in accounting requirements had no impact on the decision to recognise goodwill.
Combined with the results documented in Table 5, this suggests such CEOs that have an
accounting based bonus-plan allocated an additional amount to goodwill and this was
unchanged by the adoption of IFRS. In contrast, for firms without an accounting based bonus
plan the IFRS dummy is positive and significant. As such, these firms post- IFRS allocated
an additional amount to goodwill potentially to report higher earnings due to goodwill no
longer being amortised.

22
Interestingly, the unexpected finding on bidder leverage is only significant for firms
which offer their CEO an accounting based bonus plan. There is also now some evidence
consistent with H3a as the bidding firm toehold variable is now negative for bidding firms
whose CEOs receive an accounting based bonus. We also find a positive association between
cash payment and acquired goodwill when the CEO receives a bonus. After partitioning the
sample the results continue to suggest that the target firm economic characteristics generally
do not influence the allocation of the purchase price to goodwill with the exception of
T_GW_DV.
5.3 Allocation of the purchase price to identifiable intangible assets
The adoption of IFRS in Australia in 2005 also led to changes in the accounting for
identifiable intangible assets. Before 2005 the accounting for identifiable intangible assets
was largely unregulated and management had discretion to recognise both purchased and
internally generated identifiable intangible assets.11 Identifiable intangible assets acquired as
part of a business combination were required to be recorded at their fair value (AASB 1015
Acquisition of Assets). Furthermore, in the absence of accounting guidance, management had
discretion as to whether intangible assets that were recorded (including those acquired in a
business combination) were amortised systemically to the income statement. 12 After the
implementation of IFRS in 2005, AASB 138 Intangible Assets prohibited the recognition of
internally generated intangible assets. Additionally, it requires identifiable intangible assets to
be amortised if such asset has a finite life and to be tested annually for impairment tested if
the asset’s life is considered indefinite.
Wyatt (2005) examines the factors which are associated with the recording of
intangible assets in Australia’s unregulated environment. The results indicate that the
underlying economic characteristics of the firm, rather than opportunism, explain
management’s decision to record intangible assets. Specifically, intangible assets are more
likely to be recorded when the technology is more likely to be profitable and when the life
cycle of the technology is lower. A number of more recent studies examine the impact of the
adoption of IFRS on intangible assets. For example, Chalmers et al. (2008) find evidence
11 Prior to the adoption of IFRS there was an accounting standard regulating the manner of accounting for research and development (AASB 1011 Accounting for Research and Development). This standard allowed the capitalisation of research and development only if future economic benefits were expected to exceed costs beyond a reasonable doubt. 12 Wyatt et al. (2001) present descriptive evidence on the methods used to account for identifiable intangibles prior to the adoption of IFRS.

23
consistent with IFRS adoption in Australia improving the value relevance of goodwill. In
contrast, the value relevance of other intangibles is found to be higher using the pre- IFRS
accounting standards. Chalmers et al. (2011b) examine if the association between goodwill
charges to the income statement and a firm’s investment opportunity set changed after
Australia’s adoption of IFRS. They show that goodwill charges have a higher association
with a firm’s investment opportunity set only in the goodwill impairment regime (i.e., post-
IFRS). They interpret this finding as showing that goodwill charges better reflect the
underlying economic reality of a firm when goodwill is impaired as opposed to amortised.
Meanwhile Chalmers et al. (2012) find that after the adoption of IFRS, the size and
dispersion of analyst forecast error is more negatively associated with reported intangible
assets than pre- IFRS, with this result being driven by goodwill.
The above discussion highlights that managers were provided broad discretion over
whether to amortise identifiable intangible assets acquired in a business combination before
the adoption of IFRS. If firms acted opportunistically they could maximise post- acquisition
profits by over allocating the purchase price to such assets and not subsequently amortising
them. Furthermore, this approach would minimise the proportion of the purchase price
allocated to goodwill which was subject to periodic amortisation. After the adoption of IFRS,
the necessity to amortise intangible assets was dependent on whether managers determined
that these assets had a finite or indefinite life. In consequence, the change in accounting
requirements for intangible assets upon adopting IFRS does not have a conclusive impact on
post- acquisition profit as firms can continue to avoid amortisation by classifying these assets
as having an indefinite life.
To provide evidence on whether the change in the accounting requirements for
intangible assets upon the adoption of IFRS influenced the allocation of the purchase price to
identifiable intangible assets we re-estimate a modified version of model (1). This alternative
model employs as the dependent variable the proportion of the purchase price allocated to
identifiable intangible assets (IIA_DV). The independent variables are consistent with those in
the original model. The results of estimating this regression are presented in Table 7.
INSERT TABLE 7 HERE

24
The results presented in Table 7 show that the IFRS dummy has an insignificant
coefficient suggesting that the adoption of IFRS did not influence the percentage of the
purchase price in acquisitions which is allocated to identifiable intangible assets.13 The other
variables capturing opportunism are also insignificant. For instance, inconsistent with
opportunism being associated with the allocation to identifiable intangible assets both the
CEO bonus indicator variable (BONUS) and bidder leverage (B_LEV) are statistically
insignificant. The bidding firm toehold (TOEHOLD) is significantly negatively associated
with the allocation of the purchase price to identifiable intangibles. One possible explanation
is that a higher toehold lowers information asymmetry regarding the value of intangible
assets resulting in a lower likelihood of overpayment. Of the target firm economic
characteristics we find a positive association between existing identifiable intangible assets of
the target (T_IIA_DV) and the amount recorded as identifiable intangible assets post-
acquisition. We also find a negative association between existing PPE of the target firm
(T_PPE_DV) and the amount recognised as identifiable intangible assets. This association is
to be expected, since the greater the proportion of the purchase price allocated to other assets,
such as PPE, less of the deal value remains to be allocated to identifiable intangible assets.
6. Conclusion
The accounting for purchased goodwill is controversial and has been subject to a
substantial amount of previous research. An area that has received little attention in prior
studies are the factors which determine the amount recorded as goodwill at the time the target
firm is first consolidated into the bidding firm’s financial statements. This study addresses
this void in the literature. Our results tend to support the argument that the allocation of the
purchase price to goodwill is opportunistic and suggest that the amount allocated to goodwill
does not appear to reflect synergy potential. A possible area for future research is to further
refine these tests using better measures of target firm growth potential and acquisition
synergies.
13 In additional testing the regression model was estimated separately for firms with and without an accounting based CEO bonus plan. The IFRS indicator variable was insignificant for the sub-group with an accounting based bonus plan and positive and significant for firms without an accounting based bonus plan. These results indicate that firms which do not provide an accounting based bonus plan to their CEO allocated more to identifiable intangible assets post- IFRS. One possible explanation for this finding is that, such an allocation allows firms to take advantage of the discretion associated with the determination of the lives of these assets to potentially increase profitability. This possibility is difficult to verify however, as firms do not disclose whether identifiable intangible assets acquired in an acquisition have finite or indefinite lives.

25
Consistent with firms undertaking their purchase price allocation opportunistically,
we find that the amount allocated to goodwill increases after the adoption of IFRS when
goodwill is no longer amortised. Thus, it appears that bidding firms took advantage of this
change in accounting requirements to allocate more to goodwill to increase reported
profitability post-acquisition. We also document a positive association between the amount
allocated to goodwill and the use of accounting based CEO bonus plans by acquiring firms.
This association was unchanged by the adoption of IFRS. Therefore, it appears that CEOs
that are remunerated partially based on accounting results have consistently allocated more to
goodwill after an acquisition. A possible explanation of this finding is that pre- IFRS an over-
allocation of the purchase price to goodwill increases reported profit as the life of other
tangible assets are likely to be shorter than the 20 year life used for amortising goodwill. We
also show that firms offering cash as payment are more likely to record goodwill.
We also find evidence that more leveraged acquiring firms allocate a higher amount
to goodwill. This result is inconsistent with opportunism. Our results, however, show no
association between the use of Big 4 auditors and the amount allocated to goodwill.
Supporting the results in earlier studies we find that a higher takeover premium results in the
recording of additional goodwill. This result is unsurprising as any additional premium is
expected to flow through to the amount recorded as goodwill, given that goodwill is
calculated as the difference between the purchase price and the target firm identifiable net
assets.
Collectively, our findings highlight that managers use their discretion when
conducting purchase price allocations following a business combination. Our results are
likely to be of interest to accounting standard setters when debating how to account for
goodwill post- acquisition, as our findings suggests firms have opportunistically increased
their allocation of the purchase price to goodwill after IFRS adoption. Future research could
shed further light on other contractual and non-contractual incentives to over or under
allocate the purchase price in acquisitions to goodwill (e.g. earnings volatility or capital
raising).

26
References
Aboody, D., R. Kazsnik, and M. Williams, 2000, Purchase versus Pooling in Stock-for-Stock Acquisitions: Why Do Firms Care? Journal of Accounting and Economics 29, 261-286.
Abu Ghazaleh, N., O. Al-Hares, and A. Haddad, 2012, The Value Relevance of goodwill impairments: UK Evidence. International Journal of Economics & Finance 4, 206-216.
Accounting Standards Committee, 1984, Statement of Standard Accounting Practice 22: Accounting for Goodwill.
Anderson, D., and I. Zimmer, 1992, Reactions to regulation of accounting for goodwill. Accounting and Finance 32, 27-50.
Armstrong, C., W. Guay, and J. Weber, 2010 The role of information and financial reporting in corporate governance and debt contracting. Journal of Accounting and Economics 50, 179-234.
Australian Accounting Standards Board, 1996, AASB 1013, Accounting for goodwill.
Australian Accounting Standards Board, 2010, AASB 136, Impairment of Assets.
Australian Accounting Standards Board, 2009, AASB 3, Business Combinations.
Ayers, B., C. Lefanowicz, and J. Robinson, 2002 Do firms purchase the pooling method? Review of Accounting Studies 7, 5-32.
Bargeron, L., F. Schlingemann, R. Stulz, and C. Zutter 2008, Why do private acquirers pay so little compared to public acquirers? Journal of Financial Economics 89, 375–390.
Barth, M. E., and G. Clinch, 1996, International accounting differences and their relation to share prices: evidence from U.K., Australian, and Canadian firms. Contemporary Accounting Research 13, 135–170.
Barth, M., W. Landsman, and M. Lang, 2008, International accounting standards and accounting quality. Journal of Accounting Research 46, 467-498.
Beatty, A., and J. Weber, 2006, Accounting discretion in fair value estimates: An examination of SFAS 142 goodwill impairments. Journal of Accounting Research 44, 257-288.
Bellamy, D., and W. Lewin, 1992, Corporate takeovers, method of payment, and bidding firms' shareholder returns: Australian evidence, Asia Pacific Journal of Management 9, 137-149.
Bens, D., W. Heltzer, and B. Segal, 2011, The information content of goodwill impairments under SFAS 142, Journal of Accounting and Public Policy 26, 527–555.
Bryer, R., 1995, A political economy of SSAP22: Accounting for goodwill, British Accounting Review 27, 283-310.

27
Bugeja, M., and N. Gallery, 2006, Is older goodwill value relevant? Accounting and Finance 46, 519-535.
Bugeja, M., and T. Walter, 1995, An empirical analysis of some determinants of the target shareholder premium in takeovers, Accounting and Finance 35, 33-60.
Chalmers, K., J. Godfrey, and J. Webster, 2011, Does a goodwill impairment regime better reflect the underlying economic attributes of goodwill? Accounting and Finance 51, 634-660.
Chauvin, K., and M. Hirschey, 1994, Goodwill, profitability, and the market value of the firm, Journal of Accounting and Public Policy 13, 159–180.
Chalmers, K., G. Clinch, and J. Godfrey, 2011, Changes in value relevance of accounting information upon IFRS adoption: Evidence from Australia. Australian Journal of Management 36, 151-173.
Chen, C., M. Kohlbeck, and T. Warfield, 2004, Goodwill valuation effects of the initial adoption of SFAS 142. Working paper.
Clinch, G., 1995, Capital markets research and the goodwill debate. Australian Accounting Review 5, 22-30.
Comiskey, E., J. Clarke, and C. Mulford, 2010, Is negative goodwill valued by investors? Accounting Horizons 24, 333-353.
Copeland, R., and J. Wojdak, 1969, Income manipulation and the purchase-pooling choice. Journal of Accounting Research 7, 188-195.
Cotter, J., 1998, Utilisation and restrictiveness of covenants in Australian private debt contracts. Accounting and Finance 38, 181-196.
Cotter, J., A. Tarca, and M. Wee, 2012, IFRS adoption and analysts’ earnings forecasts: Australian evidence. Accounting and Finance 52, 395-419.
Dahmash, F., R. Durand, and J. Watson, 2009, The value relevance and reliability of reported goodwill and identifiable intangible assets. British Accounting Review 41, 120-137.
Daske, H., L. Hail, C. Leuz, and R. Verdi, 2008, Mandatory IFRS adoption around the world: Early evidence on the economic consequences. Journal of Accounting Research 46, 1085-1142.
Fields, T., T. Lys, and L. Vincent, 2001, Empirical research on accounting choice. Journal of Accounting and Economics 31, 255-307.
Financial Accounting Standards Board (FASB), 2001, ‘‘Statement of Financial Accounting Standards No. 142, Goodwill and Other Intangibles.’’ Stamford, CT: FASB.No. 142, Goodwill and Other Intangibles.’’ Stamford, CT: FASB.
Francis, J., D. Hanna and L. Vincent, 1996, Causes and effects of discretionary asset write-offs. Journal of Accounting Research 34, 117-134.

28
Francis, J., and M. D. Yu, 2009, Big 4 office size and audit quality. The Accounting Review 84, 1521-1552.
Gagnon, J., 1967, Purchase versus pooling of interests: The search for a predictor. Journal of Accounting Research 5, 187-204.
Gibson, R., and J. Francis, 1975, Accounting for goodwill – A study in permissiveness. Abacus 11, 167-171.
Godfrey, J., and P.-S. Koh, 2001, The relevance to firm valuation of capitalising intangible assets in total and by category. Australian Accounting Review 11, 39–48.
Gore, P., F. Taib, and P. Taylor, 2000, Accounting for goodwill: an examination of factors influencing management preferences. Accounting and Business Research 30, 213-225.
Godfrey, J., and P.S. Koh, 2009, Goodwill impairment as a reflection of investment opportunities. Accounting and Finance 49, 117–140.
Grinyer, J., A. Russell, and M. Walker, 1991, Managerial choices in the valuation of acquired goodwill in the UK. Accounting and Business Research 85, 51-55.
Gu, F., and B. Lev, 2011, Overpriced shares, ill-advised acquisitions and goodwill impairment. The Accounting Review 86, 1995-2022.
Hayn, C., and P. Hughes, 2006, Leading indicators of goodwill impairment. Journal of Accounting and Public Policy, 223-265.
Henning, S. L., B. L. Lewis, and W. H. Shaw, 2000, Valuation of the components of purchased goodwill. Journal of Accounting Research 38, 375–386.
Henry, D., 2004, Corporate governance and ownership structure of target companies and the outcome of takeovers. Pacific Basin Finance Journal 12, 419-444.
Hirschey, M., and V. Richardson, 2002, Information content of accounting goodwill numbers. Journal of Accounting and Public Policy 21, 173–191.
Holthausen, R. W., and R. L. Watts, 2001, The relevance of the value-relevance literature for financial accounting standard setting. Journal of Accounting and Economics 31, 3-75.
Horton, J., G. Serafeim, and I. Serafeim, 2013, Does mandatory IFRS adoption improve the information environment? Contemporary Accounting Research 30, 388-423.
Jennings, R., J. Robinson, R. B. Thompson, and L. Duvall, 1996, The relation between accounting goodwill numbers and equity values. Journal of Business Finance and Accounting 23, 513–533.
Johnson, L., and K. Petrone, 1998, Is goodwill an asset? Accounting Horizons 12, 293–303.
Lai, C., Y. Shan, and S. Taylor, 2013, Costs of mandatory international financial reporting standards. Australian Journal of Management 38, 491-521.
29
Le, H., and E. Schultz, 2007, Toeholds and the Bidder Shareholder Wealth Effects of Takeover Announcements, Australian Journal of Management 32, 315-344.
Leftwich, R., 1983, Accounting information in private markets: Evidence from private lending agreements. Accounting Review 58, 23–42.
Li, Z., Z. Shroff, R. Venkataraman, and I. Zhang, 2011, Causes and consequences of goodwill impairment losses. Review of Accounting Studies 16, 745-778.
Louis, H., 2005, Acquirers’ abnormal returns and the non-Big 4 auditor clientele effect. Journal of Accounting and Economics 40, 75-99.
Malmendier, U., and G. Tate, 2008, Who makes acquisitions? CEO overconfidence and the market’s reaction. Journal of Financial Economics 89, 20-43.
Mather, P., and G. Peirson, 2006, Financial covenants in the markets for public and private debt. Accounting and Finance 46, 285–307.
Muller, K.A., 1999, An examination of the voluntary recognition of acquired brand names in the United Kingdom. Journal of Accounting and Economics 26, 179-191.
Myers, S., and N. Majluf, 1984, Corporate financing and investment decisions when firms have information that investors do not have. Journal of Financial Economics 13, 187-221.
Nelson, R. H., 1953, The momentum theory of goodwill. The Accounting Review, 491-499.
Ramanna, K., 2008, The implications of unverifiable fair-value accounting: evidence from the political economy of goodwill accounting. Journal of Accounting and Economics 45, 253-281.
Rau, R., and T. Vermaelen, 1998, Glamour, value and the post-acquisition performance of acquiring firms. Journal of Financial Economics 49, 223-253.
Robinson, J., and P. Shane, 1990, Acquisition accounting method and bid premia for target firms. The Accounting Review 65, 25-48.
Roll, R., 1986, The hubris hypothesis of corporate takeovers. Journal of Business 59, 197-216.
Savor, P., and Q. Lu, 2009, Do stock mergers create value for acquirers. The Journal of Finance 64, 1061-1097.
Schwert, G.W., 1996, Markup pricing in mergers and acquisitions. Journal of Financial Economics 41, 153-192.
Shalev, R., I. Zhang, and Y. Zhang, 2013, CEO compensation and fair value accounting: Evidence from purchase price allocation. Journal of Accounting Research 51, 819-854.
Stulz, R., 1988, Managerial control of voting rights: financing policies and the market forcorporate control. Journal of Finanical Economics 20, 25-54.

30
Sudarsanam, S., and A. Mahate, 2003, Glamour acquirers, method of payment and post-acquisition performance: the UK evidence. Journal of Business Finance & Accounting 30, 299-342.
Sudarsanam, S., and G. Sorwar, 2010, Determinants of takeover premium in cash offers: An option pricing approach. Journal of Business Finance & Accounting 37, 687-714.
Tearney, M.G., 1973, Accounting for goodwill: A realistic approach. Journal of Accountancy 136, 41-45.
Walter, T., 1984, Australian takeovers: Capital market efficiency and shareholder risk and return. Australian Journal of Management 9, 63-118.
Watts, R., and J. Zimmerman, 1990, Positive accounting theory: A ten year perspective. The Accounting Review 65, 131-158.
Wong, J., and N. Wong, 2001, The investment opportunity set and acquired goodwill. Contemporary Accounting Research 18, 173-196.

31
Table 1 Sample selection
The sample comprises takeovers announced for ASX listed targets identified from the Connect 4 Mergers and Acquisitions Database.
Takeovers between 1998 to 2012 1239
Less: Unsuccessful takeover bids (394)
Less: Acquiring firms not listed on the ASX (346)
Less: Acquiring firms which are delisted post- acquisition prior to releasing financial statements
(20)
Less: Takeovers with missing observations to test model (1) (171)
Sample for estimating model (1) 308

32
Table 2 Temporal and industry distribution of the sample
Panel A table shows the yearly distribution of the sample used to estimate model (1). Panel B presents the distribution of the sample by target and bidding firm two digit GICS codes.
Panel A: Sample temporal distribution
Year takeover No. of % of Cumulative %
announced takeovers sample
1998 5 1.62 1.62 1999 22 7.14 8.77 2000 30 9.74 18.51 2001 25 8.12 26.62 2002 13 4.22 30.84 2003 15 4.87 35.71 2004 26 8.44 44.16 2005 26 8.44 52.60 2006 32 10.39 62.99 2007 29 9.42 72.44 2008 11 3.57 75.97 2009 24 7.79 83.77 2010 19 6.17 89.94 2011 12 3.90 93.93 2012 19 6.17 100 Total 308 100
Panel B: Sample GICS distribution
Industry Bidder Target
Number % of sample Number % of sample
Consumer Discretionary 46 14.94 40 12.99
Consumer Staples 22 7.14 17 5.52
Energy 29 9.42 25 8.12
Financials 49 15.91 49 15.90
Health Care 16 5.19 16 5.19
Industrial 31 10.06 32 10.39
Information Technology 11 3.57 17 5.52
Materials 87 28.25 101 32.80
Telecommunication 12 3.90 7 2.27
Utilities 5 1.62 4 1.30
Total 308 100 308 100

33
Table 3 Descriptive statistics
Panel A: This table presents descriptive statistics for the variables included in regression model (1) for bidding firms reporting no goodwill and bidding firms reporting positive goodwill. A test of statistical difference for each variable is also shown. A t-test is used for continuous variables and a χ2-test for binary variables. All variables are defined in Appendix 1.
Goodwill = 0 (129 observations) Goodwill >0 (179 observations) Statistical difference Mean Std. Dev. Min Max Mean Std. Dev. Min Max
GW ($m) 0.000 0.000 0.000 0.000 364 1,250 25,000 14000 -3.301*** GW_DV 0.000 0.000 0.000 0.000 0.563 0.472 0.000 3.227 -13.555*** IFRS 0.535 0.501 0.000 1.000 0.553 0.499 0.000 1.000 -0.316 B_LEV 1.272 4.044 0.011 41.691 2.082 3.839 -3.109 22.455 -1.786* BONUS 0.442 0.499 0.000 1.000 0.631 0.484 0.000 1.000 13.509*** BONUS($000) 219.77 775.434 0.000 8,072.93 366.097 653.682 0.000 3,757 -1.792* BIG4 0.698 0.461 0.000 1.000 0.849 0.359 0.000 1.000 17.555*** RELSIZE 0.457 0.684 0.001 4.304 0.555 1.300 0.000 11.004 -0.784 TOEHOLD 0.158 0.199 0.000 0.880 0.142 0.187 0.000 0.865 0.716 FRIENDLY 0.868 0.340 0.000 1.000 0.838 0.369 0.000 1.000 0.013 PREMIUM 0.462 0.984 -1.000 7.341 0.451 2.459 -0.969 31.500 0.049 SAMEIND 0.698 0.461 0.000 1.000 0.575 0.496 0.000 1.000 8.172*** T_GW_DV 0.078 0.321 0.000 2.820 0.162 0.604 0.000 7.749 -1.444 T_PPE_DV 0.466 1.646 0.000 13.658 0.412 1.428 0.000 15.876 0.306 T_IIA_DV 0.047 0.183 0.000 1.691 0.087 0.194 0.000 1.202 -1.843* T_MB 2.964 5.306 -0.171 36.776 2.349 2.816 -0.171 15.969 1.315 B_MB 2.940 4.657 0.210 42.690 3.213 5.008 0.180 42.690 -0.487 PAYCASH 0.217 0.414 0.000 1.000 0.413 0.494 0.000 1.000 14.157*** IIA ($m) 15.3 51.4 0.000 404 127 464 0.000 4,300 -2.720*** IIA_DV 0.143 0.361 0.000 1.862 0.148 0.258 0.000 1.313 -0.144
* Significant at the 1% level; ** significant at the 5% level; *** significant at the 10% level

34
Table 3 Descriptive statistics
Panel B: This table presents descriptive statistics for the variables included in regression model (1) pre- and post- IFRS adoption (Panel B). A test of statistical difference before and after the adoption of IFRS for each variable is also shown. A t-test is used for continuous variables and a χ2-test for binary variables. All variables are defined in Appendix 1.
IFRS = 0
(140 observations) IFRS = 1
(168 observations)
Statistical difference Mean Std. Dev. Min Max Mean Std. Dev. Min Max
GW ($m) 97.9 269 0.000 1,800 306 1,290 0.000 14,000 -1.886* GW_DV 0.305 0.475 0.000 3.227 0.346 0.437 0.000 1.850 -0.793
B_LEV 1.308 2.232 0.022 16.295 2.106 4.909 -3.109 41.691 -1.777* BONUS 0.514 0.502 0.000 1.000 0.583 0.494 0.000 1.000 0.701 BONUS($000) 258,363 806.563 0.000 8,072.93 343.517 617.372 0.000 3,757 -1.049 BIG4 0.786 0.412 0.000 1.000 0.786 0.412 0.000 1.000 0.782 RELSIZE 0.439 0.666 0.000 4.304 0.576 1.337 0.000 11.004 -1.097 TOEHOLD 0.176 0.213 0.000 0.880 0.125 0.170 0.000 0.865 2.340** FRIENDLY 0.800 0.401 0.000 1.000 0.893 0.310 0.000 1.000 4.577** PREMIUM 0.287 0.607 -0.969 3.932 0.596 2.615 -1.000 31.500 -1.368 SAMEIND 0.707 0.457 0.000 1.000 0.560 0.498 0.000 1.000 12.560*** T_GW_DV 0.157 0.714 0.000 7.749 0.102 0.211 0.000 1.078 0.954 T_PPE_DV 0.368 0.759 0.000 6.492 0.491 1.940 0.000 15.876 -0.710 T_IIA_DV 0.074 0.183 0.000 1.202 0.067 0.196 0.000 1.691 0.328 T_MB 2.136 4.077 0.000 36.776 2.998 4.003 -0.171 25.955 -1.867* B_MB 2.191 2.194 0.210 18.240 3.855 6.173 0.180 42.690 -3.034*** PAYCASH 0.371 0.485 0.000 1.000 0.298 0.459 0.000 1.000 4.724** IIA ($m) 44.9 156 0.000 1,000 110 463 0 4,300 -1.589 IIA_DV 0.146 0.339 0.000 1.862 0.146 0.275 0.000 1.506 -0.010
* Significant at the 1% level; ** significant at the 5% level; *** significant at the 10% level

35
Table 3 Descriptive statistics
Panel C: This table presents descriptive statistics for the variables included in regression model (1) for bidding firms with and without an accounting based CEO bonus plan in place. A test of statistical difference for firms with and without a CEO bonus for each variable is also shown. A t-test is used for continuous variables and a χ2-test for binary variables. All variables are defined in Appendix 1.
BONUS = 0 (138 observations) BONUS = 1 (170 observations) Statistical difference Mean Std. Dev. Min Max Mean Std. Dev. Min Max
GW ($m) 192 1,240 0.000 14000 228 688 0.000 5,100 -0.327 GW_DV 0.289 0.482 0.000 3.227 0.358 0.430 0.000 2.234 -1.331 IFRS 0.507 0.502 0.000 1.000 0.576 0.496 0.000 1.000 -1.212 B_LEV 1.399 4.096 0.009 41.691 2.022 3.798 -3.109 22.455 -1.382 BONUS($000) 0.000 0.000 0.000 0.000 552.245 881.773 0.000 8,072.93 -7.355*** BIG4 0.645 0.480 0.000 1.000 0.900 0.301 0.000 1.000 31.515*** RELSIZE 0.544 0.758 0.004 4.304 0.489 1.293 0.000 11.004 0.440 TOEHOLD 0.147 0.198 0.000 0.877 0.150 0.188 0.000 0.880 -0.128 FRIENDLY 0.862 0.346 0.000 1.000 0.841 0.367 0.000 1.000 0.213 PREMIUM 0.481 2.729 -0.883 31.500 0.434 1.033 -1.000 9.333 0.208 SAMEIND 0.609 0.490 0.000 1.000 0.641 0.481 0.000 1.000 0.498 T_GW_DV 0.143 0.717 0.000 7.749 0.114 0.218 0.000 1.078 0.494 T_PPE_DV 0.429 1.425 0.000 13.658 0.440 1.598 0.000 15.876 -0.060 T_IIA_DV 0.042 0.115 0.000 0.696 0.093 0.231 0.000 1.691 -2.354** T_MB 2.686 4.563 -0.171 36.776 2.542 3.599 -0.171 25.955 0.311 B_MB 3.190 5.866 0.210 42.690 3.025 3.867 0.180 38.790 0.296 PAYCASH 0.268 0.445 0.000 1.000 0.382 0.487 0.000 1.000 5.471** IIA ($m) 48.8 368 0.000 4,300 106 350 0.000 2,500 -1.383 IIA_DV 0.142 0.337 0.000 1.862 0.150 0.277 0.000 1.313 -0.234
* Significant at the 1% level; ** significant at the 5% level; *** significant at the 10% level

36
Table 4 Correlation matrix
This table presents a Pearson correlation matrix amongst the variables included in regression model (1). All variables are defined in Appendix 1.
1 2 3 4 5 6 7 8 9 10 11 12 13 14 15 16 17 18 19 20
1 GW ($m) 1.00
2 GW_DV 0.17 1.00
3 IFRS 0.11 0.05 1.00
4 B_LEV 0.12 0.11 0.10 1.00
5 BONUS 0.02 0.08 0.07 0.08 1.00
6 BONUS($000) 0.13 0.06 0.06 0.33 0.39 1.00
7 BIG4 0.10 0.06 0.00 0.09 0.31 0.21 1.00
8 RELSIZE 0.06 -0.04 0.06 0.01 -0.03 -0.09 -0.16 1.00
9 TOEHOLD -0.07 -0.10 -0.13 -0.08 0.01 -0.03 0.11 -0.13 1.00
10 FRIENDLY -0.05 0.03 0.13 0.04 -0.03 -0.05 -0.15 0.04 -0.11 1.00
11 PREMIUM -0.03 0.11 0.08 -0.02 -0.01 -0.03 0.01 -0.05 -0.07 0.05 1.00
12 INDSAME -0.08 -0.14 -0.15 -0.22 0.03 -0.11 -0.11 0.02 0.13 -0.06 -0.02 1.00
13 T_GW_DV -0.02 0.42 -0.05 -0.02 -0.03 -0.02 -0.06 0.06 -0.08 0.04 -0.04 -0.06 1.00
14 T_PPE_DV -0.04 0.12 0.04 0.08 0.00 0.05 -0.04 -0.03 0.04 0.01 -0.06 0.08 0.05 1.00
15 T_IIA_DV -0.02 0.09 -0.02 -0.02 0.13 0.24 0.07 -0.05 -0.03 -0.03 0.04 -0.03 0.03 -0.05 1.00
16 T_MB 0.04 0.01 0.11 -0.07 -0.02 -0.01 -0.11 0.06 -0.06 -0.02 0.04 -0.03 -0.06 -0.11 -0.09 1.00
17 B_MB 0.03 0.08 0.17 0.31 -0.02 -0.01 0.08 -0.06 -0.09 0.05 0.40 -0.09 -0.04 -0.05 -0.02 0.09 1
18 PAYCASH -0.06 0.18 -0.08 -0.02 0.12 0.18 0.12 -0.10 0.26 -0.28 -0.08 -0.03 -0.01 0.08 0.14 -0.07 -0.07 1.00
19 IIA ($m) 0.01 -0.05 0.00 -0.05 0.01 0.05 -0.01 0.00 -0.14 -0.01 0.05 0.03 0.12 -0.05 0.35 0.01 0.03 0.07 1.00
20 IIA_DV 0.80 0.04 0.09 0.15 0.08 0.20 0.09 0.05 -0.07 0.00 -0.03 -0.14 -0.02 -0.04 0.07 0.02 0.01 -0.01 0.20 1
Bold text denotes significance at 10% or lower
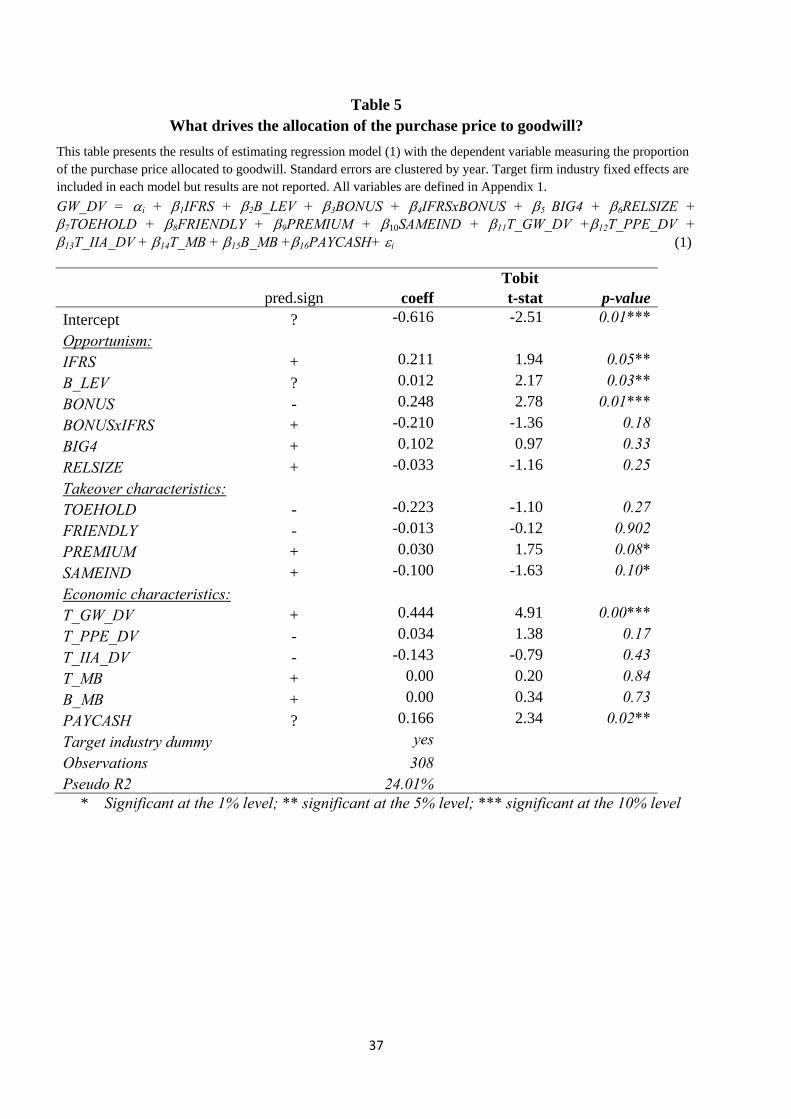
37
Table 5 What drives the allocation of the purchase price to goodwill?
This table presents the results of estimating regression model (1) with the dependent variable measuring the proportion of the purchase price allocated to goodwill. Standard errors are clustered by year. Target firm industry fixed effects are included in each model but results are not reported. All variables are defined in Appendix 1.
GW_DV = i + 1IFRS + 2B_LEV + 3BONUS + 4IFRSxBONUS + 5 BIG4 + 6RELSIZE + 7TOEHOLD + 8FRIENDLY + 9PREMIUM + 10SAMEIND + 11T_GW_DV +12T_PPE_DV + 13T_IIA_DV + 14T_MB + 15B_MB +16PAYCASH+ i (1)
Tobit pred.sign coeff t-stat p-value
Intercept ? -0.616 -2.51 0.01***
Opportunism:
IFRS + 0.211 1.94 0.05**
B_LEV ? 0.012 2.17 0.03**
BONUS - 0.248 2.78 0.01***
BONUSxIFRS + -0.210 -1.36 0.18
BIG4 + 0.102 0.97 0.33
RELSIZE + -0.033 -1.16 0.25
Takeover characteristics:
TOEHOLD - -0.223 -1.10 0.27
FRIENDLY - -0.013 -0.12 0.902
PREMIUM + 0.030 1.75 0.08*
SAMEIND + -0.100 -1.63 0.10*
Economic characteristics:
T_GW_DV + 0.444 4.91 0.00***
T_PPE_DV - 0.034 1.38 0.17
T_IIA_DV - -0.143 -0.79 0.43
T_MB + 0.00 0.20 0.84
B_MB + 0.00 0.34 0.73
PAYCASH ? 0.166 2.34 0.02**
Target industry dummy yes
Observations 308
Pseudo R2 24.01% * Significant at the 1% level; ** significant at the 5% level; *** significant at the 10% level
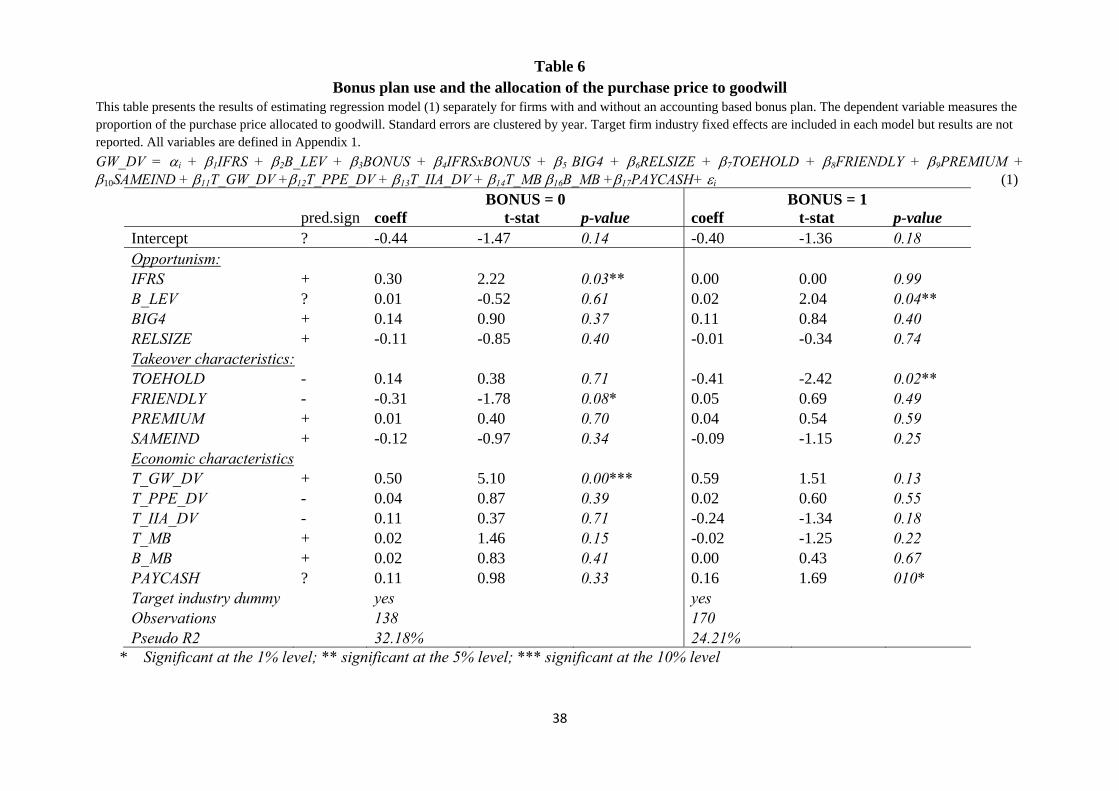
38
Table 6 Bonus plan use and the allocation of the purchase price to goodwill
This table presents the results of estimating regression model (1) separately for firms with and without an accounting based bonus plan. The dependent variable measures the proportion of the purchase price allocated to goodwill. Standard errors are clustered by year. Target firm industry fixed effects are included in each model but results are not reported. All variables are defined in Appendix 1.
GW_DV = i + 1IFRS + 2B_LEV + 3BONUS + 4IFRSxBONUS + 5 BIG4 + 6RELSIZE + 7TOEHOLD + 8FRIENDLY + 9PREMIUM + 10SAMEIND + 11T_GW_DV +12T_PPE_DV + 13T_IIA_DV + 14T_MB 16B_MB +17PAYCASH+ i (1)
BONUS = 0 BONUS = 1 pred.sign coeff t-stat p-value coeff t-stat p-value Intercept ? -0.44 -1.47 0.14 -0.40 -1.36 0.18 Opportunism: IFRS + 0.30 2.22 0.03** 0.00 0.00 0.99 B_LEV ? 0.01 -0.52 0.61 0.02 2.04 0.04** BIG4 + 0.14 0.90 0.37 0.11 0.84 0.40 RELSIZE + -0.11 -0.85 0.40 -0.01 -0.34 0.74 Takeover characteristics: TOEHOLD - 0.14 0.38 0.71 -0.41 -2.42 0.02** FRIENDLY - -0.31 -1.78 0.08* 0.05 0.69 0.49 PREMIUM + 0.01 0.40 0.70 0.04 0.54 0.59 SAMEIND + -0.12 -0.97 0.34 -0.09 -1.15 0.25 Economic characteristics T_GW_DV + 0.50 5.10 0.00*** 0.59 1.51 0.13 T_PPE_DV - 0.04 0.87 0.39 0.02 0.60 0.55 T_IIA_DV - 0.11 0.37 0.71 -0.24 -1.34 0.18 T_MB + 0.02 1.46 0.15 -0.02 -1.25 0.22 B_MB + 0.02 0.83 0.41 0.00 0.43 0.67 PAYCASH ? 0.11 0.98 0.33 0.16 1.69 010* Target industry dummy yes yes Observations 138 170 Pseudo R2 32.18% 24.21%
* Significant at the 1% level; ** significant at the 5% level; *** significant at the 10% level

39
Table 7 What drives the allocation of the purchase price to IIAs?
This table presents the results of estimating regression model (1) with the dependent variable measuring the proportion of the purchase price allocated to identifiable intangible assets. Standard errors are clustered by year. Target firm industry fixed effects are included in each model but results are not reported. All variables are defined in Appendix 1.
IIA_DV = i + 1IFRS + 2B_LEV + 3BONUS + 4IFRSx BONUS + 5 BIG4 + 6RELSIZE + 7TOEHOLD + 8FRIENDLY + 9PREMIUM + 10SAMEIND + 11T_GW_DV +12T_PPE_DV + 13T_IIA_DV + 14T_MB + 16B_MB +17PAYCASH+ i (1)
coeff t-stat p-value Intercept -0.07 -0.33 0.74
Opportunism:
IFRS 0.04 0.34 0.74
B_LEV 0.01 1.11 0.27
BONUS -0.06 -0.53 0.59
BONUSxIFRS 0.12 0.89 0.37
BIG4 0.03 0.20 0.84
RELSIZE 0.01 0.29 0.77
Takeover characteristics:
TOEHOLD -0.64 -2.87 0.00***
FRIENDLY -0.13 -1.16 0.25
PREMIUM 0.00 0.22 0.82
SAMEIND 0.07 1.36 0.18
Economic characteristics
T_GW_DV 0.10 0.98 0.33
T_PPE_DV -0.07 -2.26 0.03**
T_IIA_DV 0.76 2.32 0.02**
T_MB 0.00 0.28 0.78
B_MB 0.01 0.95 0.34
PAYCASH 0.09 1.22 0.22
Target industry dummy yes
Observations 308
Pseudo R2 17.35% * Significant at the 1% level; ** significant at the 5% level; *** significant at the 10% level

40
Appendix 1
Variable names and definitions
Variable name Definition
GW The dollar value in thousands of the amount initially allocated to goodwill GW_DV The amount initially allocated to goodwill scaled by deal value
IFRS An indicator variable denoting takeovers in which the first year of consolidation of the takeover is after Australia’s adoption of IFRS in 2005
B_LEV Bidding firm ratio of debt to equity at the end of the financial year prior to the takeover announcement
BONUS An indicator variable denoting takeovers in which the bidding firm CEO is compensated using a bonus plan based on accounting numbers
BONUSxIFRS An interaction variable between BONUS and IFRS
BIG4 An indicator variable denoting takeovers in which the bidding firm auditor is a Big Four firm for the first year of consolidation
RELSIZE The natural logarithm of target firm to acquiring firm market capitalisation two months before the takeover announcement
TOEHOLD The toehold stake of the bidder in the target firm at the announcement of the takeover
FRIENDLY An indicator variable denoting target firms where the initial recommendation of the target firm board is takeover acceptance
PREMIUM The takeover premium calculated as the offer price minus the target share price two months prior to the takeover announcement, divided by the price two months prior to the takeover announcement
SAMEIND An indicator variable denoting takeovers in which the target and bidder firm have an identical two digit GICS code
T_GW_DV The amount of recorded target firm goodwill for the year prior to the takeover scaled by deal value
T_PPE_DV The amount of recorded target firm property plant and equipment for the year prior to the takeover scaled by deal value
T_IIA_DV The amount of recorded target firm identifiable intangible assets for the year prior to the takeover scaled by deal value
T_MB Target firm market-to-book ratio calculated two months prior to the

41
takeover announcement
B_MB Bidding firm market-to-book ratio calculated two months prior to the takeover announcement
PAYCASH An indicator variable denoting takeovers in which the method of payment is exclusively cash
IIA The dollar value in thousands of the amount initially allocated to identifiable intangible assets
IIA_DV The amount initially allocated to identifiable intangible assets scaled by deal value