Embed Size (px)
Citation preview
What Goes Into a Data Center?
Albert Greenberg, David A. Maltz

2
What’s a Cloud Service Data Center?
• Electrical power and economies of scale determine total data center
size: 50,000 – 200,000 servers today
• Servers divided up among hundreds of different services
• Scale-out is paramount: some services have 10s of servers, some
have 10s of 1000s
Fig
ure
by A
dva
nce
d D
ata
Ce
nte
rs

3
Tutorial Goal:
A data center is a factory that transforms and stores bits
We’ll seek to understand them by
• Surveying what runs inside data centers
• Looking at what demands these applications place on the
physical plant
• Examining architectures for the factory infrastructure
• Surveying components for building that infrastructure

4
Agenda – Part 1
• Applications
– How are they structured, provisioned and managed?
• Traffic and Load Patterns
– What is the load on the infrastructure that results from
the applications?

Agenda – Part 1
Applications
– How are they structured, provisioned and managed?
Traffic and Load Patterns
– What is the load on the infrastructure that results from the
applications?

Cloud Services?
Software as a Service (SaaS)
– Search, Email, Social Networking, Data Mining, Utility Computing
The Cloud is the infrastructure
– Data Center hardware and software

Hoping You Take Away
What cloud services look like
Core challenges
A better way?

Cloud Components
Data Centers
CDNs, ECNs
InternetUsers
10GD/2 ports
D/2 ports
. . .
. . .
D switches
D/2 switches
Bouncer
switches
for VLBD ports
Top of Rack switch
[D2/4] * 20 Servers
20
ports

Cloud Service Components
Internet | Front Ends | Back Ends
– Front Ends may be in small satellite data centers or Content
Distribution Networks
– Back Ends may be in large data centers hosting service specific
and shared resources
FEs
BE service specific resources
BE shared resources

Challenges
High scale
– 10’s to 100’s of thousands of servers
Geo-distribution
– 10s to 100s of DCs, CDN or satellite data center sites
Stringent high reliability and perf requirements
– 99.9th percentile SLAs
– Cost per transaction / cost per data “unit”
– Inexpensive components, stripped of internal redundancy
Complexity
– Plethora of components: Load Balancers, DNS, BGP, operating
system, middleware, servers, racks …
– Plethora of SW and HW failures

Hoping You Take Away
What cloud services look like
– Example: Contact List Service
A better way?
– Example: Microsoft’s Autopilot
– Example: Google File System

Hoping You Take Away
What cloud services look like
– Example: Contact List Service
A better way?
– Example: Microsoft’s Autopilot
– Example: Google File System

Contact List Service
Why?
– Email, IM, Sync, Gaming, Music, ….
What?
– Contacts, social network info, auth info, invitations, notifications
How big?
– Order 1B contact lists, 100K transactions per sec (TPS)
Reliability and Perf?
– At the heart of popular interactive services

Observations
Transactions Per Second (TPS)
– Correlates with revenue
– Correlates with infrastructure spend
100K TPS is not too large
– Cannot afford to throw memory at the problem
– Have to go to disk, which is less than ideal
Takes an eternity
Failure prone, slow and complicated
– Hard to model, non-deterministic with congestion effects
Databases offer little help
– Not relational data
– Expensive and hard to maintain referential integrity

Architecture
Front End Tier
– Servers fronted by load balancers
– Partitioned by Access partner and access method
Fast Lookup Tier
– Partitioning by User ID mapping user to storage
Storage Tier
– Business Logic + Blob Store
Blob = Binary large object
– Blob Store a shared component
– Identity and authentication service another shared component

Solution Characteristics
Significant work on deloading storage
– Affinitizing clusters of FEs, BEs, Stores
– Client side caching, delta synchronization
– DB optimization
– In memory compressed data structures
Significant work on systems resilient to storage failures
Significant work on operations automation
A mix of enterprise and purpose built software

Hoping You Take Away
What cloud services look like
– Example: Contact List Service
Is there a better way?
– Example: Microsoft’s Autopilot
– Example: Google File System

Cloud Operating System?
No cloud operating system
– Handling discovery, deployment, repair, storage, resource
management, ….
– All service developers grabbling with switches, routers, NICs, load
balancing, network protocols, databases, disks
Creating one is a huge challenge
– Will we have 4?
Werner Vogel’s remark regarding SaaS dev: fraction of time spent on
getting the infrastructure right, versus creating new features:
70% of time, energy, and dollars on undifferentiated heavy lifting

Building it Better?
Two General, Useful Building Blocks
– Autopilot – Microsoft’s Recovery Oriented Computing System,
supporting Live Search (Bing)
– GFS – Google’s Distributed File System

Building it Better?
Two General, Useful Building Blocks
– Autopilot – Microsoft’s Recovery Oriented Computing System,
supporting Live Search (Bing)
– GFS – Google’s Distributed File System
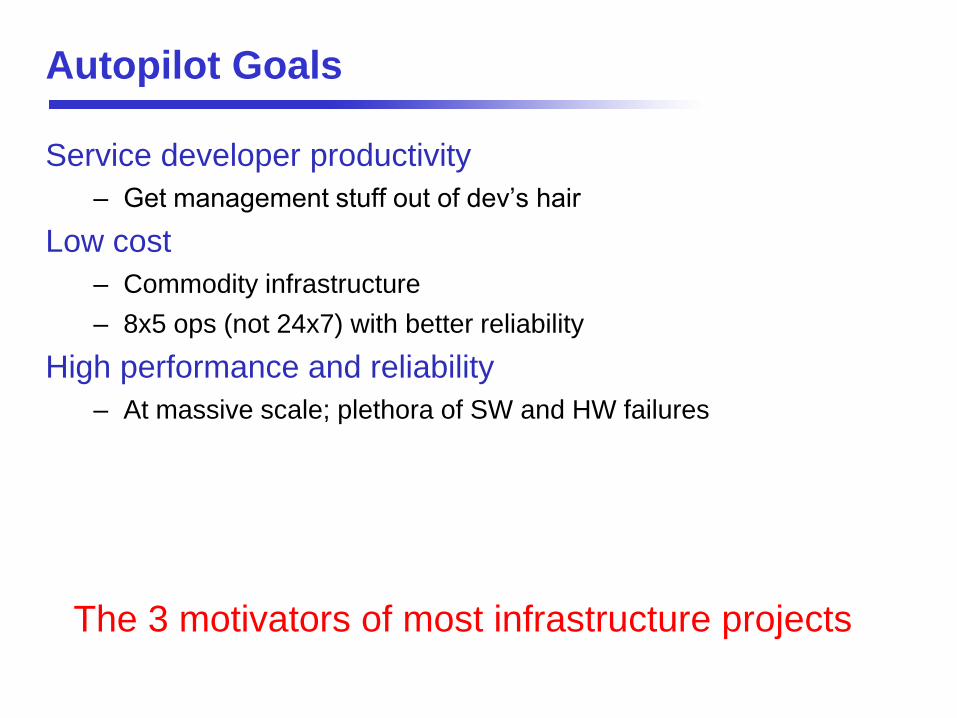
Autopilot Goals
Service developer productivity
– Get management stuff out of dev’s hair
Low cost
– Commodity infrastructure
– 8x5 ops (not 24x7) with better reliability
High performance and reliability
– At massive scale; plethora of SW and HW failures
The 3 motivators of most infrastructure projects

How?
Automated data center management platform covering
– Provisioning
– Deployment
– Fault Monitoring
– Recovery
Fundamental, and fundamentally different than how
enterprises and networks are managed today

Autopilot Approach
Fault tolerance philosophy
– Recovery Oriented Computing (RoC)
– Crash-only software methodology
Service developer expectation
– OK to crash any component anytime (for example, by autopilot
itself), without warning
Not
– Autonomic computing
– Statistical machine learning
– Byzantine fault tolerant

Fault tolerant services
Applications written to tolerate failure with
– No user impact, no data loss, no human interaction
– Ability to continue with some proportion of servers down or
misbehaving
– Capacity to run on low cost, commodity infrastructure
Autopilot incents good habits for distributed systems dev

Autopilot Software Architecture
• Device Mgr
– Small strongly consistent
shared state (the truth)
• Satellite Servers
– Watchdog, Provisioning,
Deployment, Repair
Use replicated weakly
consistent state
Monitors alignment of the data
center intent: roles and
behaviors with data center
reality

Automation
• Health Monitoring • Fault Recovery
•Service roles, manifests enforced•Where misalignment is detected,
Autopilot fixes it. Makes it so!
•Repair escalation: Ignore, Reboot,
Reimage, RMA
•Replicate data, migrate sessions
before reboot
• Ignore?
•RMA?
•Return to Manufacturer
•Data Centers make us rethink
supply chain mgt

Autopilot Lessons Learned
Ask of the service developer is large, but the return is huge
(more profound than the automation…)
– Reliability and high perf at scale
– Refactoring of applications for autopilot increased overall reliability
Guard rails needed
– Over sensitive watchdogs or busted logic can trigger too much
repair (false positives)
Failing limits (repair should not be not worse than the disease)
Autopilot is “slow twitch”
– Detection and repair in 10s of minutes
Transient spurious failures more likely than real ones
There are places where this doesn’t work…
Building it Better?
Two General, Useful Building Blocks
– Autopilot – Microsoft’s Recovery Oriented Computing System,
supporting Live Search (Bing)
– GFS – Google’s Distributed File System

Distributed File Systems
Cosmos (MSFT), GFS* (GOOG), Hadoop (Apache)
– 100s of clusters
– PBs of data on disk
Goals (again)
– Service developer productivity
Get storage management out of their hair
– Very low cost
SATA as opposed to SCSI drives
– High performance and reliability
At massive scale, ongoing HW failures
– SW relatively stable
Every disk is somewhere in the midst of corrupting its data and
failing
*SOSP 2003

But First…What About SANs?
Storage Area Networks
– The Good
Virtualized Storage
API: read, write small fixed size blocks (e.g., what SQL sever
expects)
– The Bad
Specialized hardware
Fiberchannel, Infiniband 0 loss networking
– The Ugly
Head nodes– special machines blessed to access the SAN
Good abstraction, expensive execution
– Popular in the enterprise
– Unpopular in the cloud

GFS
Designed to meet common case workload
– Very large file (multi-GBs) processing
E.g., search logs, web documents, click streams
– Reads to large contiguous regions
– Writes that append to rather than overwrite data
Familiar API
– create, delete, open, close, read, and write files

GFS Architecture
One giant file system
– A network share (append only)
How to write good apps on GFS
– Move work to the storage (access local replicas)
Great sequential IO on SATA drives
– Map Reduce

Observations
Large Chunk Size
– Reduced frequency of client:master, client:chunkserver interaction
– Increased IO efficiency
Decouple flow of data from flow of control
– Single master for metadata, reliably persisting a log
Centralized system-wide decisions (optimized chunk
placement)
– Single master (chunkserver) for each chunk, serializing updates to
the chunk
Heavy lifting done by the chunk servers
Simplicity
– Appending more efficient and resilient to failures than overwriting
– Just a file system that works; optimized for the common case
GFS abstracts data reliability and data distribution

Lessons Learned
Within the trust domain, devs still step on each other
– Solutions: ACLs, copy on write (can roll back), encryption
Silent data corruption GFS level checksums
– Hard to drive out weird corner case bugs
OS drivers, firmware
Will spend significant time on these
Big win not just the technology but the habits that comes with
– Optimizing for serial IO (Map Reduce, Big Table)

Perspective
What cloud services look like– User -> DC traffic management
– Front ends, DOS/DDOS protection, load balancing, etc
– Back end processing
– Storage
Some of the core challenges– Reliability
– Performance
– Cost per transaction / cost per data “unit”
Is there a better way?– High scale is the way out
– Lights out operations + fault tolerant software
– Amortized storage, redundancy
– Loosely coupled services
– Aggressive timeouts and “optional” elements
Agenda – Part 1
Applications
– How are they structured, provisioned and managed?
Traffic and Load Patterns
– What is the load on the infrastructure that results from the
applications?

Measuring Traffic in Today’s Data Centers
80% of the packets stay inside the data center
– Data mining, index computations, back end to front end
– Trend is towards even more internal communication
Detailed measurement study of data mining cluster
– 1,500 servers, 79 ToRs
– Logged: 5-tuple and size of all socket-level R/W ops
– Aggregated in flows – all activity separated by < 60 s
– Aggregated into traffic matrices every 100 s
Src, Dst, Bytes of data exchange
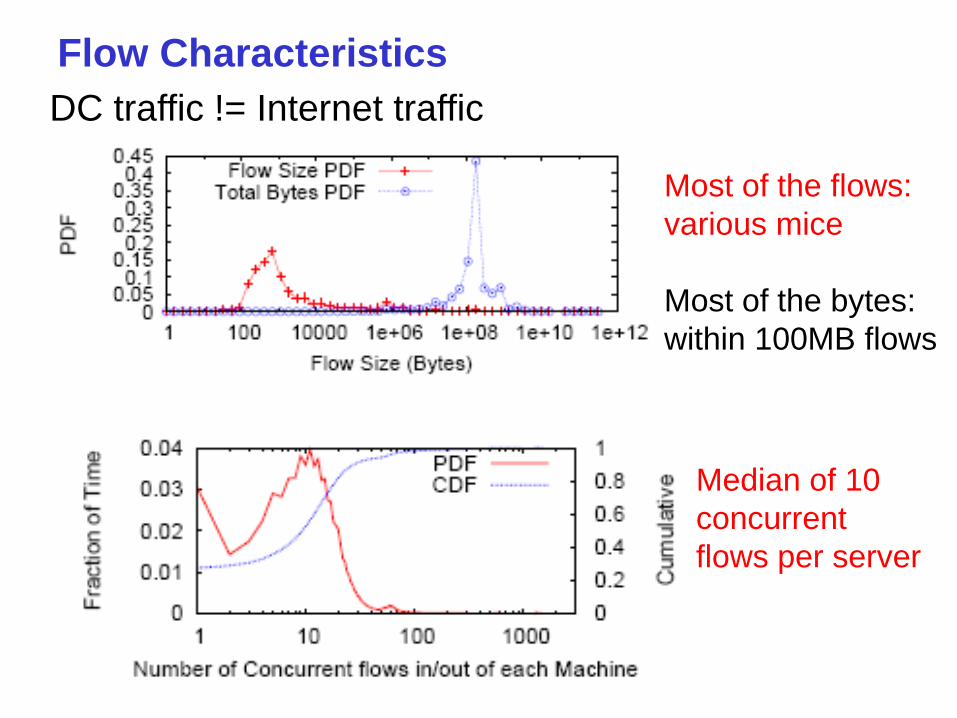
Flow Characteristics
Median of 10
concurrent
flows per server
Most of the flows:
various mice
Most of the bytes:
within 100MB flows
DC traffic != Internet traffic

Traffic Matrix Volatility
- Traffic pattern changes
nearly constantly
- Run length is 100s to
80% percentile; 99th is
800s
- Collapse similar traffic
matrices (over 100sec)
into “clusters”
- Need 50-60 clusters to
cover a day’s traffic

Today, Computation Constrained by Network*
*Kandula, Sengupta, Greenberg,Patel
Figure: ln(Bytes/10sec) between servers in operational cluster
Great efforts required to place communicating servers under the same
ToR Most traffic lies on the diagonal
Stripes show there is need for inter-ToR communication

Latency
Propagation delay in the data center is essentially 0
– Light goes a foot in a nanosecond; 1000’ = 1 usec
End to end latency comes from
– Switching latency
10G to 10G:~ 2.5 usec (store&fwd); 2 usec (cut-thru)
– Queueing latency
Depends on size of queues and network load
Typical times across a quiet data center: 10-20usec
Worst-case measurement (from our testbed, not real DC, with all2all
traffic pounding and link util > 86%): 2-8 ms
Comparison:
– Time across a typical host network stack is 10 usec
– Application developer SLAs > 1 ms granularity

What Do Data Center Faults Look Like?
Need very high reliability near top
of the tree
– Very hard to achieve
Example: failure of a
temporarily unpaired core switch
affected ten million users for four
hours
– 0.3% of failure events knocked out
all members of a network
redundancy groupRef: Data Center: Load Balancing Data Center Services ,
Cisco 2004
CR CR
AR AR AR AR…
SSLB LB
SS
…
SS
…
…

Congestion: Hits Hard When it Hits*
*Kandula, Sengupta, Greenberg, Patel

But Wait There’s More

45
Agenda – Part 2
• Components for Building Networks
– Switches
– Links
• Requirements
– What does the DC infrastructure need to provide to
best support the applications?
• Network Architectures
– Conventional
– Modern Proposals
• Physical Plant & Resource Shaping
– Power provisioning and utilization

46
Agenda – Part 2
• Components for Building Networks
– Switches
– Links
• Requirements
– What does the DC infrastructure need to provide to
best support the applications?
• Network Architectures
– Conventional
– Modern Proposals
• Physical Plant & Resource Shaping
– Power provisioning and utilization

47
Conventional Networking Equipment
Ports
– 8 port 10G-X - $25K
– 1GB buffer memory
– Max ~120 ports of 10G
per switch
Integrated Top of Rack
switches
– 48 port 1GBase-T
– 2-4 ports 1 or 10G-x
– $7K
Load Balancers
– Spread TCP connections
over servers
– $50-$75K each
– Used in pairs
Modular routers
– Chassis $20K
– Supervisor card $18K
Total price in common configurations: $150-200K (+SW&maint)
Power: ~2-5KW

48
Switch on Chip ASICs
• 24 ports 10G Eth (CX4 or SFP+) - $4K to $10K
– 2MB of buffer memory, 16K IPv4 fwd entries
– ~100W power
General purpose CPU
for control plane
Switch-on-a-chip ASIC

49
Factors Driving ASIC Design
• For the future expect that:
– Optimal point on the price/port count/port speed curve will continue
to move out rapidly
– Trend seems to be more ports, faster port speed --- not more
buffer memory, more forwarding entries, or more forwarding
primitives
• Current design points
– 24 port 10G Eth, 16K IPv4
fwd entries, 2 MB buff
– 24 port 1G, 4 10G 16K IPv4
fwd entries, 2 MB buff
• Near future
– 48 port 10G, 16k fwd
entries, 4 MB buff
– 48 port 1 G, 4 10G, 16k fwd
chip floorplan
X-c
eiv
er
(Se
rDe
s)
Packet buffer
Memory
Forwarding tables
Forwarding pipeline
50
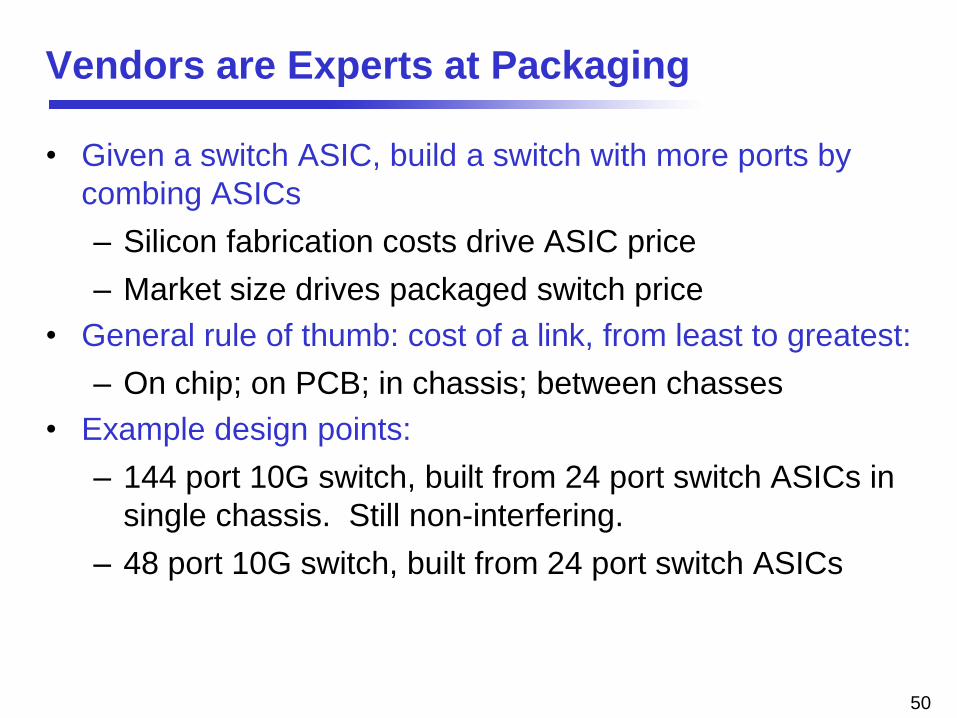
Vendors are Experts at Packaging
• Given a switch ASIC, build a switch with more ports by
combing ASICs
– Silicon fabrication costs drive ASIC price
– Market size drives packaged switch price
• General rule of thumb: cost of a link, from least to greatest:
– On chip; on PCB; in chassis; between chasses
• Example design points:
– 144 port 10G switch, built from 24 port switch ASICs in
single chassis. Still non-interfering.
– 48 port 10G switch, built from 24 port switch ASICs

51
NetFPGA – Reconfigurable HW Switches
• NetFPGA uses a high-end FPGA as the forwarding plane
for a switch
– PCI card with large Xilinx FPGA
– 4 Gigabit Ethernet ports
– SRAM/DDR2 DRAM
– Host computer often used for SW tasks
• More details: http://www.netfpga.org/

52
Programmable Switches
• Several vendors pursuing “network processor” designs
– Off-chip memory allowing deep buffers
– Extensive function modules
QoS, encryption, tunneling
– Some have multiple cores enabling very flexible
“software” based data-plane primitives
• Cost per port significantly higher than switch-on-chip ASIC
• Typically fewer ports and lower speeds
• Best examples are still proprietary; public examples
include Broadcom 88020, QE-2000, SE-4000

53
Link Technologies: Modules
• Some switches have CX4 connectors
• Dominant trend is towards SFP+ (Small Form-factor
Pluggable)
– Module is simpler, as SerDes and Clock/Data recovery
moved elsewhere (e.g., into ASIC)
– Small size allows many ports on a 1U box (48?)
– LC connectors for Fiber
• Cost is $100 module for MM fiber (300m reach)

54
Link Technologies: Copper or Fiber?
• Fiber
– Cheaper per unit distance
– Low weight (10g/m)
– Max distance for 10G: 300m (with
cheap optics)
– Typically multi-mode fiber (MMF)
• Copper
– Cheaper for short runs (< 8m)
– Heavier (100g/m), larger size cable
– Max distance for 10G : ~8m (real) 15m
(spec) 30m (future?)
– Typically Twin-axial cable

55
Link Technologies: Copper or Fiber?
• Cost model for fiber:
– $100 module + $13 LC + $XXX/m + $13 LC + $100 module
Type Length Cost
Fiber 1m $226
Copper 1m $50
Fiber 8m $230
Copper 8m $90
Fiber 15m $250
Copper 15m $250

56
Higher Density/Higher Speed Ports
• QSFP (Quad SFP)
– 40G port available today
– 4 10G links bound together
• Fiber “ribbon cables”
– Up to 72 fibers per cable, to a single MT connector
Figures from Quad Small Form-
factor Pluggable (QSFP)
Transceiver Specification

57
Agenda – Part 2
• Components for Building Networks
– Switches
– Links
• Requirements
– What does the DC infrastructure need to provide to
best support the applications?
• Network Architectures
– Conventional
– Modern Proposals
• Physical Plant & Resource Shaping
– Power provisioning and utilization

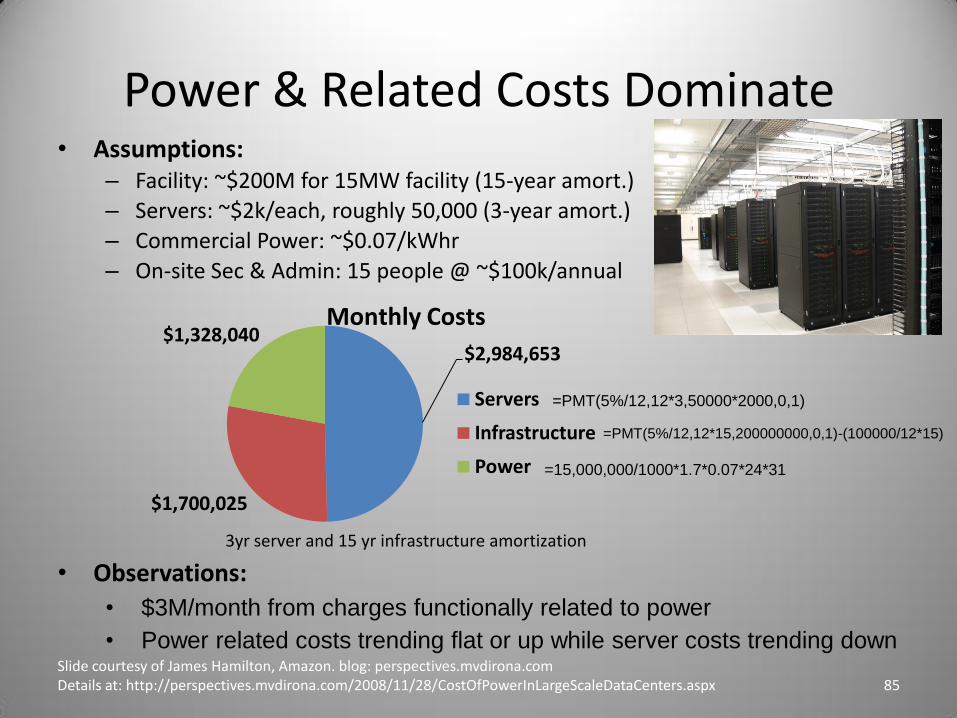
Power & Related Costs Dominate• Assumptions:
– Facility: ~$200M for 15MW facility (15-year amort.)
– Servers: ~$2k/each, roughly 50,000 (3-year amort.)
– Commercial Power: ~$0.07/kWhr
– On-site Sec & Admin: 15 people @ ~$100k/annual
58Slide courtesy of James Hamilton, Amazon. blog: perspectives.mvdirona.comDetails at: http://perspectives.mvdirona.com/2008/11/28/CostOfPowerInLargeScaleDataCenters.aspx
$2,984,653
$1,700,025
$1,328,040
Servers
Infrastructure
Power
Monthly Costs
3yr server and 15 yr infrastructure amortization
=PMT(5%/12,12*3,50000*2000,0,1)
=PMT(5%/12,12*15,200000000,0,1)-(100000/12*15)
=15,000,000/1000*1.7*0.07*24*31
• Observations:
• $3M/month from charges functionally related to power
• Power related costs trending flat or up while server costs trending down

59
Another Breakdown of Data Center Costs
• Data centers have large upfront costs
– Total cost varies from $200M to almost $1B
• We amortize everything to a monthly cost for fair
comparisons
• Assumptions:
– 3 yr amortization for servers, 15 yr for infrastructure
– 5% cost of money
Amortized Cost Component Sub-Components
~45% Servers CPU, memory, disk
~25% Infrastructure UPS, cooling, power distribution
~15% Power draw Electrical utility costs
~15% Network Switches, links, transit

60
Server Costs
Ugly secret: 10% to 30% utilization considered “good” in DCs
Causes:
• Uneven application fit:
– Each server has CPU, memory, disk: most applications exhaust
one resource, stranding the others
• Long provisioning timescales:
– New servers purchased quarterly at best
• Uncertainty in demand:
– Demand for a new service can spike quickly
• Risk management:
– Not having spare servers to meet demand brings failure just when
success is at hand
If each service buys its own servers, the natural response is hoarding

61
Improving Server ROI: Need Agility
Agility: Any server, any service
• Turn the servers into a single large fungible pool
– Let services “breathe” : dynamically expand and contract their
footprint as needed
• Requirements for implementing agility
– Means for rapidly installing a service’s code on a server
Virtual machines, disk images
– Means for a server to access persistent data
Data too large to copy during provisioning process
Distributed filesystems (e.g., blob stores)
– Means for communicating with other servers, regardless of where
they are in the data center
Network

62
Objectives for the Network
Developers want a mental model where all their servers, and
only their servers, are plugged into an Ethernet switch
• Uniform high capacity
– Capacity between two servers limited only by their NICs
– No need to consider topology when adding servers
• Performance isolation
– Traffic of one service should be unaffected by others
• Layer-2 semantics
– Flat addressing, so any server can have any IP address
– Server configuration is the same as in a LAN
– Legacy applications depending on broadcast must work

63
Agenda – Part 2
• Components for Building Networks
– Switches
– Links
• Requirements
– What does the DC infrastructure need to provide to
best support the applications?
• Network Architectures
– Conventional
– Modern Proposals
• Physical Plant & Resource Shaping
– Power provisioning and utilization

64
The Network of a Modern Data Center
• Hierarchical network; 1+1 redundancy
• Equipment higher in the hierarchy handles more traffic, more
expensive, more efforts made at availability scale-up design
• Servers connect via 1 Gbps UTP to Top of Rack switches
• Other links are mix of 1G, 10G; fiber, copper
Ref: Data Center: Load Balancing Data Center Services , Cisco 2004
InternetCR CR
AR AR AR AR…
SSLB LB
Data Center
Layer 3
Internet
SS
…
SS
…
…
Layer 2
Key:
• CR = L3 Core Router
• AR = L3 Access Router
• S = L2 Switch
• LB = Load Balancer
• A = Rack of 20 servers
with Top of Rack switch
~ 4,000 servers/pod

65
Internal Fragmentation Prevents Applications from
Dynamically Growing/Shrinking
• VLANs used to isolate properties from each other
• IP addresses topologically determined by ARs
• Reconfiguration of IPs and VLAN trunks painful, error-
prone, slow, often manual
InternetCR CR
…AR AR
SSLB LB
SS
…
SS
…
…
AR AR
SSLB LB
SS
…
SS
…

66
No Performance Isolation
• VLANs typically provide reachability isolation only
• One service sending/recving too much traffic hurts all
services sharing its subtree
InternetCR CR
…AR AR
SSLB LB
SS
…
SS
…
…
AR AR
SSLB LB
SS
…
SS
…
Collateral
damage

67
Network has Limited Server-to-Server Capacity,
and Requires Traffic Engineering to Use What It Has
• Data centers run two kinds of applications:
– Outward facing (serving web pages to users)
– Internal computation (computing search index – think HPC)
InternetCR CR
…AR AR
SSLB LB
SS
…
SS
…
…
AR AR
SSLB LB
SS
…
SS
…
10:1 over-subscription or worse (80:1, 240:1)

68
Network Needs Greater Bisection BW,
and Requires Traffic Engineering to Use What It Has
• Data centers run two kinds of applications:
– Outward facing (serving web pages to users)
– Internal computation (computing search index – think HPC)
InternetCR CR
…AR AR
SSLB LB
SS
…
SS
…
…
AR AR
SSLB LB
SS
…
SS
…
Dynamic reassignment of servers and
Map/Reduce-style computations mean
traffic matrix is constantly changing
Explicit traffic engineering is a nightmare

69
Monsoon: Distinguishing Design Principles
• Randomizing to Cope with Volatility
– Tremendous variability in traffic matrices
• Separating Names from Locations
– Any server, any service
• Embracing End Systems
– Leverage the programmability & resources of servers
– Avoid changes to switches
• Building on Proven Networking Technology
– We can build with parts shipping today
– Leverage low cost, powerful merchant silicon ASICs,
though do not rely on any one vendor

70
What Enables a New Solution Now?
• Programmable switches with high port density
– Fast: ASIC switches on a chip (Broadcom, Fulcrum, …)
– Cheap: Small buffers, small forwarding tables
– Flexible: Programmable control planes
• Centralized coordination
– Scale-out data centers are
not like enterprise networks
– Centralized services already
control/monitor health and
role of each server (Autopilot)
– Centralized directory and
control plane acceptable (4D) 20 port 10GE switch. List price: $10K

71
An Example Monsoon Topology: Clos Network
10GD/2 ports
D/2 ports
Aggregation
switches
. . .
. . .
D switches
D/2 switches
Intermediate
node switches
in VLBD ports
Top Of Rack switch
[D2/4] * 20 Servers
20 ports
Node degree (D) of
available switches &
# servers supported
D # Servers in pool
4 80
24 2,880
48 11,520
144 103,680
• A scale-out design with broad layers
• Same bisection capacity at each layer no oversubscription
• Extensive path diversity Graceful degradation under failure

72
Use Randomization to Cope with Volatility
• Valiant Load Balancing
– Every flow “bounced” off a random intermediate switch
– Provably hotspot free for any admissible traffic matrix
– Servers could randomize flow-lets if needed
10GD/2 ports
D/2 ports
. . .
. . .
D switches
D/2 switches
Intermediate
node switches
in VLBD ports
Top Of Rack switch
[D2/4] * 20 Servers
20 ports
Node degree (D) of
available switches &
# servers supported
D # Servers in pool
4 80
24 2,880
48 11,520
144 103,680
Aggregation
switches

73
Separating Names from Locations:
How Smart Servers Use Dumb Switches
• Encapsulation used to transfer complexity to servers
– Commodity switches have simple forwarding primitives
– Complexity moved to computing the headers
• Many types of encapsulation available
– IEEE 802.1ah defines MAC-in-MAC encapsulation; VLANs; etc.
Source (S)
ToR (TS)Dest: N Src: S
Dest: TD Src: S
Dest: D Src: S
Payload
Intermediate Node (N)
Dest (D)
ToR (TD)
1
2 3
4
Dest: TD Src: S
Dest: D Src: S
Payload…
Payload…
Dest: D Src: S
Dest: N Src: S
Dest: TD Src: S
Dest: D Src: S
Payload…
Headers

74
Embracing End Systems
• Data center OSes already heavily modified for VMs,
storage clouds, etc.
– A thin shim for network support is no big deal
• No change to applications or clients outside DC
TCP
IP
NIC
ARP
EncapsulatorMAC
Resolution Cache
Monsoon Agent
User
Kernel
ResolveremoteIP
DirectorySystem
ServerRole
ServerHealth
NetworkHealth
Server machine

75
• Two-layer Clos network seems optimal for our current
environment, but …
• Other topologies can be used with Monsoon
– Ring/Chord topology makes organic growth easier
– Multi-level fat tree, parallel Clos networks
The Topology Isn’t the Most Important Thing
. . .
. . .
n1 = 144 switches
n2 = 72 switches
TOR
Number of servers = 2 x 144 x 36 x 20 = 207,360
. . .
. . .
n1 = 144 switches
n2 = 72 switches
144 ports
TOR
A B BA
n/(d1-2)
positions
n/(d1-2) positions
i
d2 = 100 ports
d1= 40 ports
layer 1 links
layer 1 or 2 links
Type (2)
switches
Type (1)
switches
76
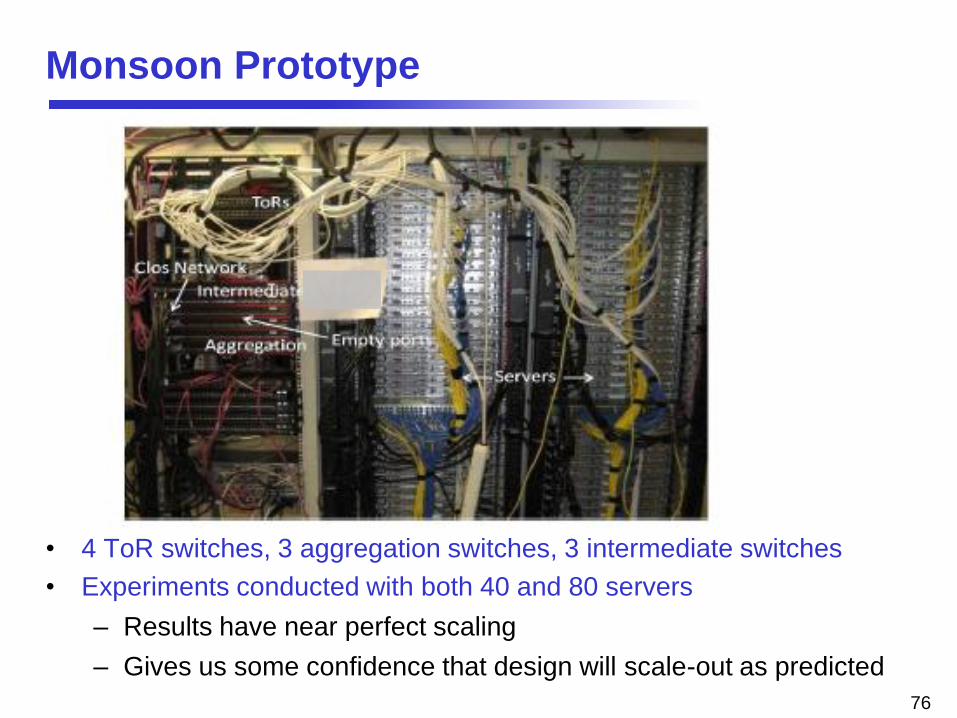
Monsoon Prototype
• 4 ToR switches, 3 aggregation switches, 3 intermediate switches
• Experiments conducted with both 40 and 80 servers
– Results have near perfect scaling
– Gives us some confidence that design will scale-out as predicted

77
Monsoon Achieves Uniform High Throughput
• Experiment: all-to-all shuffle of 500 MB among 75 servers – 2.7 TB
• Excellent metric of overall efficiency and performance
• All2All shuffle is superset of other traffic patterns
• Results:
• Ave goodput: 58.6 Gbps; Fairness index: .995; Ave link util: 86%
• Perfect system-wide efficiency would yield aggregate goodput of 75G
– Monsoon efficiency is 78% of perfect
– 10% inefficiency due to duplexing issues; 7% header overhead
– Monsoon efficiency is 94% of optimal

78
Monsoon Provides Performance Isolation
- Service 1
unaffected by
service 2’s activity

79
Monsoon is resilient to link failures
- Performance degrades and recovers gracefully as
links are failed and restored

80
VLB vs. Adaptive vs. Best Oblivious Routing
- VLB does as well as adaptive routing (traffic engineering
using an oracle) on Data Center traffic
- Worst link is 20% busier with VLB, median is same

81
Traffic Engineering and TCP
• Results from Monsoon testbed show VLB offers good
mixing when randomizing by flows on this DC traffic
– Fairness index at the A-switches > 0.98
– But traffic workloads change…
• Open questions:
– Would TCP modifications make it better suited to multi-
path topologies?

82
Fat-Tree Networks
• Links of fabric have same speed as links to servers
– Mapping of flows to links critical –collision of even two
flows enough to cause persistent congestion
– Fat-Tree work includes a global flow placement system
• Fat-tree operates at L3, PortLand at L3
Al-
Fa
res, e
t a
l., “
A S
ca
lab
le, C
om
mo
dity
Da
ta C
en
ter
Ne
two
rk A
rch
ite
ctu
re”

83
Higher Dimensional Fabrics: Dcell
• Idea: use servers themselves
to forward packets
– Allows custom routing
protocol, cheap switches
• Fractal topology
– Servers connect to hub
– Servers have multiple NICs,
each connects to server in
different cell
– # NICs =dimension of Dcell
– Extensive path diversity
• Cabling difficult to wire in DC? C. Guo, et al., “DCell: A Scalable and Fault-
Tolerant Network Structure for Data Centers”

84
Agenda – Part 2
• Components for Building Networks
– Switches
– Links
• Requirements
– What does the DC infrastructure need to provide to
best support the applications?
• Network Architectures
– Conventional
– Modern Proposals
• Physical Plant & Resource Shaping
– Power provisioning and utilization
Power & Related Costs Dominate• Assumptions:
– Facility: ~$200M for 15MW facility (15-year amort.)
– Servers: ~$2k/each, roughly 50,000 (3-year amort.)
– Commercial Power: ~$0.07/kWhr
– On-site Sec & Admin: 15 people @ ~$100k/annual
85Slide courtesy of James Hamilton, Amazon. blog: perspectives.mvdirona.comDetails at: http://perspectives.mvdirona.com/2008/11/28/CostOfPowerInLargeScaleDataCenters.aspx
$2,984,653
$1,700,025
$1,328,040
Servers
Infrastructure
Power
Monthly Costs
3yr server and 15 yr infrastructure amortization
=PMT(5%/12,12*3,50000*2000,0,1)
=PMT(5%/12,12*15,200000000,0,1)-(100000/12*15)
=15,000,000/1000*1.7*0.07*24*31
• Observations:
• $3M/month from charges functionally related to power
• Power related costs trending flat or up while server costs trending down

86
Where do the Power and the Dollars Go?
13.2kv
115kv
13
.2k
v
13.2kv 480V
208V
0.3% loss
99.7%
efficient
0.3% loss
99.7% efficient
0.3% loss
99.7% efficient
6% loss
94% efficient,
>97% available
~1% loss in switch
gear and conductors
UPS:
Rotary or Battery
2.5MW Generator
~180 Gallons/hour
IT LOAD

87
Where do the Power and the Dollars Go?
13.2kv
115kv
13
.2k
v
13.2kv 480V
208V
0.3% loss
99.7%
efficient
0.3% loss
99.7% efficient
0.3% loss
99.7% efficient
6% loss
94% efficient,
>97% available
~1% loss in switch
gear and conductors
UPS:
Rotary or Battery
2.5MW Generator
~180 Gallons/hour
IT LOAD
20% of DC cost is in power redundancy
$2M each
n+2 redundant
Wastes ~900kW in a 15MW DC
(could power 4,500 servers)

88
Where do the Power and the Dollars Go?
• Pretty good data centers have efficiency of 1.7
– 0.7 Watts lost for each 1W delivered to the servers
• Breakdown:
– Servers: 59%
– Distribution losses: 8%
– Cooling: 33%

89
How to Reduce Power Costs?
• Create servers that use less power!
– Conventional server uses 200 to 500W
– Reductions have ripple effects across entire data center
– Mostly a problem for EEs to tackle?
• Eliminate power redundancy
– Allow entire data centers to fail
– Requires middleware that eases these transitions
• Reduce power usage of network gear? Not so much…
– Total power consumed by switches amortizes to 10-
20W per server
90
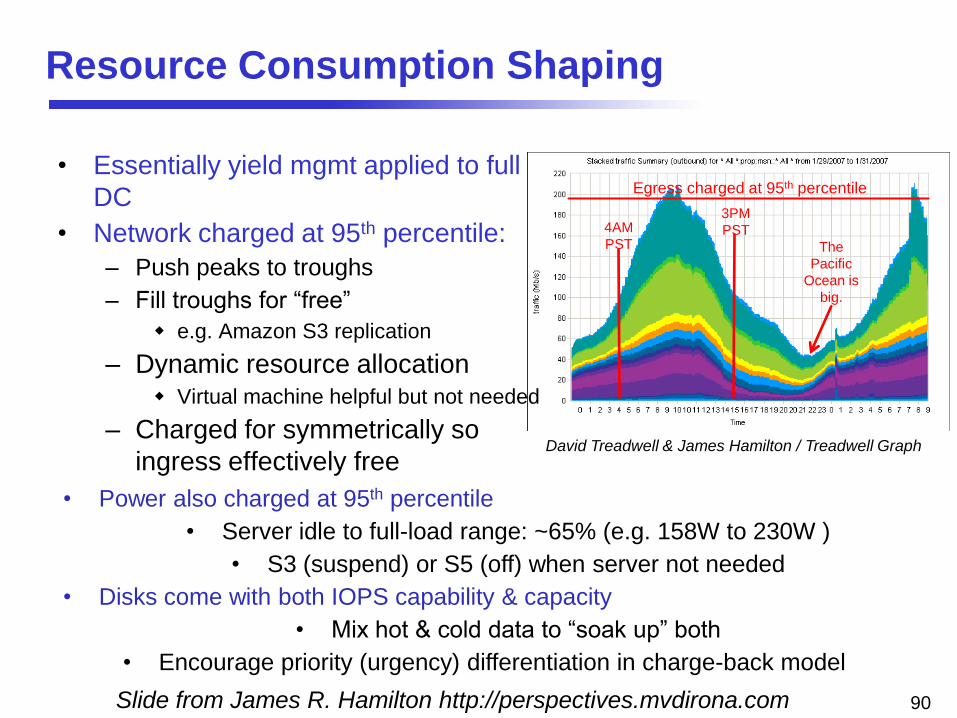
Resource Consumption Shaping
• Essentially yield mgmt applied to full
DC
• Network charged at 95th percentile:
– Push peaks to troughs
– Fill troughs for “free”
e.g. Amazon S3 replication
– Dynamic resource allocation Virtual machine helpful but not needed
– Charged for symmetrically so
ingress effectively free
4AM
PST
3PM
PST
The
Pacific
Ocean is
big.
Egress charged at 95th percentile
• Power also charged at 95th percentile
• Server idle to full-load range: ~65% (e.g. 158W to 230W )
• S3 (suspend) or S5 (off) when server not needed
• Disks come with both IOPS capability & capacity
• Mix hot & cold data to “soak up” both
• Encourage priority (urgency) differentiation in charge-back model
David Treadwell & James Hamilton / Treadwell Graph
Slide from James R. Hamilton http://perspectives.mvdirona.com

91
Leveraging Variations in Resource Prices
Figures from A. Qureshi, “Cutting the Electric Bill for Internet-Scale Systems”, SIGCOMM09

92
Incentive Design
• How to get data center tenants to leverage agility?
– Need to be financially incented
• Tensions:
– Should be cheap to add servers, as workload prediction
is poor so want to add capacity early
– Should be expensive to keep idle servers (ideally above
the cost of simply having a server)
Need to make sure customers give servers back
Without this, customers hoard, free pool depletes, &
DC owner ends up in the hosted server biz – only
profit comes from the economies of scale of big
deployments

93
Summary

94
Data Centers are Like Factories
• Number 1 Goal:
Maximize useful work per dollar spent
• Must think like an economist/industrial engineer as well as
a computer scientist
– Understand where the dollar costs come from
– Use computer science to reduce/eliminate the costs