Embed Size (px)
Citation preview

Oxera Draft for Comment: Strictly Confidential i
What is the economic impact of Geo services?
Prepared for Google
January 2013

Oxera Consulting Ltd is registered in England No. 2589629 and in Belgium No. 0883.432.547. Registered offices at Park Central, 40/41 Park End Street, Oxford, OX1 1JD, UK, and Stephanie Square Centre, Avenue Louise 65, Box 11, 1050 Brussels, Belgium. Although every effort has been made to ensure the accuracy of the material and the integrity of the analysis presented herein, the Company accepts no liability for any actions taken on the basis of its contents.
Oxera Consulting Ltd is not licensed in the conduct of investment business as defined in the Financial Services and Markets Act 2000. Anyone considering a specific investment should consult their own broker or other investment adviser. The Company accepts no liability for any specific investment decision, which must be at the investor’s own risk.
© Oxera, 2013. All rights reserved. Except for the quotation of short passages for the purposes of criticism or review, no part may be used or reproduced without permission.

Oxera What is the economic impact of Geo services? i

Oxera What is the economic impact of Geo services? ii

Oxera What is the economic impact of Geo services? iii
Executive summary
People are increasingly accessing and using geographic mapping and location-based services (‘Geo services’). In the five largest European economies, 50% of Internet users access maps online and 35% of smartphone users do so on their handsets.1 In addition to this regular use of Geo services, a whole range of systems has been, and is being, designed to put Geo services to use in innovative ways. For example, there are systems that use Geo services to help coordinators of search-and-rescue operations determine which areas rescue dogs have searched; to log the location of ship crew members if they fall overboard; to impose directions on a smartphone video stream; to help predict natural disasters; and to provide feeds-up displays with translucent location guidance.2
Some of the more everyday uses for mapping and location-based services include local governments helping residents find their nearest community services, such as leisure facilities, schools, transport and recycling.3 Spatial information is also increasingly being used to link consumers and businesses through location-based services, which combine geographic data from a mobile device with maps and other data to help link consumers to local services such as dentists, hairdressers and coffee shops. From an economic perspective, these services help businesses and consumers connect with each other more easily, increasing welfare for consumers by reducing the cost of searching, and increasing competition and choice in many markets.
This study aims to quantify the impact of Geo services on the world economy and consumer welfare. For the purposes of the study, this impact has been divided into three broad categories:
– direct effects—the footprint of the Geo services measured according to the revenue generated by firms developing and providing Geo services and the value that they add;
– consumer effects—the benefits that accrue to consumers, businesses and government from using Geo services, over and above the value that may be paid for any services (ie, the revenue accounted for under the direct effects category); and
– wider economic effects—the benefits that accrue from Geo services improving efficiency elsewhere in the economy, by creating new products and services and creating cost savings that cannot be generated by other sectors.
Estimating global impacts is not a precise science and relies on combining data from multiple sources. As such, the estimates should be considered indicative of the likely magnitude of impacts rather than precise estimates of individual effects. Indeed, it is at least as important to understand the mechanisms through which Geo services affect the economy, as the precise estimates themselves.
For this study, Geo services are defined as all interactive digital mapping and location-based services. These include providers of satellite imagery, digital maps, satellite positioning signals, and navigation devices. Digital maps are defined to include both online maps and locally stored digital maps (such as satellite navigation systems used in cars). Traditional
1 Comscore (2012), ‘EU5 Map Usage via smartphone growing 7× faster than classic web’, May.
2 Each of these ideas has been a winner of the European Space Agency’s European Satellite Navigation Competition since
2006. See European Satellite Navigation Competition (2011), ‘The results 2011’. 3 See, for example, the London Borough of Camden’s service finder, available at http://maps.camden.gov.uk/.

Oxera What is the economic impact of Geo services? iv
hard-copy map publishers are not included in the estimates, although they may use data from some parts of the Geo value chain.
What are the direct effects of Geo?
Direct effects refer to the economic presence or footprint of those companies directly involved in producing Geo services (eg, companies that are part of the value chain described in section 2, such as Google, Carifact, and Garmin), and the value that they create.
These effects can be measured in various ways: by the revenues that are generated; by market capitalisation; by gross value added (GVA); or by the jobs involved in producing these services.
This report has adopted a number of approaches, and estimates that the Geo services sector generates $150–$270 billion of revenue globally. This range is based on two different forms of calculation that jointly give an indication of the likely order of magnitude estimate rather than a precise value. By way of comparison, this is greater than the $25 billion of revenues generated by the video games industry,4 broadly equivalent to the $140 billion of revenues from the global security services industry,5 or around one-third of the global airline industry’s revenues of $594 billion.6
Revenue estimates provide an indication of the size of the transactions that are occurring, but do not capture the full economic contribution of a sector. An alternative method of quantifying the impact of a sector is to look at its GVA. This accounts for any costs of inputs incurred. GVA can be broken down into the profits accruing to Geo services providers and the wages paid to those working in Geo services.
This report estimates that the Geo services sector has a global GVA of $113 billion. By way of comparison, global GVA is approximately $70 trillion,7 suggesting that Geo services account for roughly 0.2% of global gross domestic product (GDP). In comparison to other industries, the global airline industry has a GVA of approximately $221 billion8 and the global video games industry a GVA of approximately $22 billion.9
How do consumers benefit from Geo?
Geo services are wide in scope, as reflected in the range of uses that consumers have for these services. All these uses generate benefits for consumers in different ways, and these benefits are in turn partly captured in the revenue impacts illustrated under the direct effects. This shows that consumers are willing to pay to use these services. Moreover, they derive benefits from services that are not captured via revenues. This is apparent when considering that many Geo services are free at the point of use (eg, Michelin maps).
Geo services are typically an intermediate good—ie, they are not normally valuable in themselves, but help consumers engage in other activities. Thus, the consumer benefit from Geo services is derived from the value to the consumer of the activities they facilitate (eg, visiting a new destination). Examples of the consumer welfare benefits that Geo services generate include the following.
4 Entertainment Software Association (2011), ‘Essential facts about the computer and video game industry’.
5 Central Association of Private Security Industry (2011), ‘Security services a sunrise industry’.
6 International Air Transport Association (2011), ‘Weak Economy, Weak Profits—2012 Looking Even Tougher’, September. 7 World Bank Global Development Indicators.
8 Based on International Air Transport Association (2006), ‘The value added by airlines’, scaled up to current level by growth in
industry revenues as reported in International Air Transport Association (2011), ‘The Impact of September 11 2001 on Aviation’. 9 Based on Entertainment Software Association (2010), ‘Video games in the 21st century’, scaled up from US to global GVA
estimate by ratio of US to global GDP.

Oxera What is the economic impact of Geo services? v
– Journey time and fuel savings from more efficient navigation—drivers using navigation devices can reduce travel time and fuel consumption on some journeys by optimising their route, reducing the risk of getting lost, and, on occasion, by avoiding congestion. This impact could be worth around $22 billion per year to consumers.
– Educational benefit—Geo services can provide users with an educational value beyond their conventional use in navigation. Geographic information systems can be considered a useful information technology tool for promoting higher-order thinking, decision-making and problem-solving skills.10 Geo services can also provide individuals with better access to information about the location of countries, cities and places of interest, leading to a more informed population. This educational impact could be worth around $12 billion a year.
What are the wider economic effects of Geo?
Wider economic (or supply-side) effects are the effects of a sector that are driven by the use of Geo in the economy which help to increase overall productivity and potential output. In the short term, the output of an economy can depend on changes on the demand side—ie, the level of goods and services demanded by consumers and businesses. However, in the long term, the output of an economy—using standard measures of output, such as GVA, or the prosperity of the population living in an economy (eg, measured using GVA per head)—is determined by the underlying productive potential or supply side of the economy.
Because Geo services facilitate the functioning of businesses, they help to drive efficiency gains throughout the economy. These can be observed in industries such as logistics, where the Global Positioning System (GPS) has been estimated to generate at least $10 billion in cost savings.
Geo services also affect the wider economy by helping to change the breadth of markets and thereby promote consumer choice. By reducing transport costs and increasing information to consumers, Geo services can broaden both product and geographic markets. Making markets wider is not typically seen as a goal in itself, but it can help to promote efficiency and cost savings through increased competition in many markets. This ultimately drives prices down towards costs, benefiting consumers.
Some of the wider economic and consumer impacts created by Geo are summarised in the figure below. This list of effects is by no means exhaustive, and there will be various interactions between them. Nevertheless, the analysis indicates the magnitude of the value that Geo creates, which is not captured in market and financial transactions.
10
Yap, L.Y. (2008), ‘An Assessment of the Use of Geographical Information Systems (GIS) in Teaching Geography in
Singapore Schools’, Journal of Geography, 107:2, pp. 52–60.

Oxera What is the economic impact of Geo services? vi
Estimates of various consumer effects
Source: Oxera.
Overall conclusion
This report presents an estimate of the current impact of Geo. However, it also recognises that the industry is growing rapidly—at a rate of 30% per annum globally. Hence, many of the estimates presented here will quickly become underestimates, as Geo services become more widespread.
Overall, the benefits of Geo services are varied; for some consumers, they can literally be life-saving; while for others, they simply take away some of the hassles of daily life. This report demonstrates that these benefits are real and their order of magnitude can be estimated. Geo services are making an important contribution to the global economy and to future productivity. The efficiency gains they create are helping to facilitate economic activity and generate additional consumer welfare.
0
2
4
6
8
10
12
14
16
18
20
Time savings Fuel savings Emergency response
Education Competition
We
lfare
eff
ect (
$ b
illio
n)
Mechanisms of Geo’s impact
Upper estimate
Lower estimate
Oxera What is the economic impact of Geo services?
Contents
1 Introduction 1
2 What are Geo services? 2
2.1 Value chain 2
2.2 What are the economic characteristics of Geo? 5
3 Approach to quantifying the impact of Geo services 6
3.1 Framework 6
3.2 Direct effects 7
3.3 Indirect effects 8
3.4 Wider supply-side effects 8
3.5 Consumer perspective 8
4 Global direct effects 9
4.1 Revenues 9
4.2 Gross value added 12
4.3 Summary 13
5 Consumer effects 15
5.1 Consumer benefits 15
5.2 Journey time savings 16
5.3 Educational benefit 21
5.4 Reduced search costs 25
5.5 Increased consumer choice 26
6 Wider economic effects 27
6.1 Why are wider economic effects important? 27
6.2 How do wider economic effects arise? 28
6.3 Improving market outcomes 28
6.4 Impacts on specific industries: some examples 30
7 Summary 31
List of tables Table 5.1 Quantifying time and fuel savings from the use of Geo services: global
estimate 19 Table 5.2 Graduate degrees in GIS 24 Table 5.3 GIS-related jobs in the USA: median pay 2010 25
List of figures Figure 2.1 Stylised value chain for Geo services 3 Figure 3.1 Stylised explanation of the economic impact of Geo services 6 Figure 4.1 Scaling up the Geo services revenues in the USA 11 Figure 4.2 Summary of estimation of direct effects 14 Figure 7.1 Estimates of various consumer effects 31

Oxera What is the economic impact of Geo services?
List of boxes Box 5.1 Comparing welfare across countries 16 Box 5.2 Emergency services 20 Box 5.3 Illustrative calculation of educational value of Geo services 23 Box 6.1 Illustrative effects: economy-wide benefits 29

Oxera What is the economic impact of Geo services? 1
1 Introduction
The term ‘Geo services’ is used to capture a range of services that provide digital mapping and location data to consumers, businesses and governments. It incorporates online maps, navigation devices, satellite imagery and other services. All of these services are increasingly being used to aid travel and travel planning, and to locate places.
Understanding and navigating around our immediate environment is a vital part of daily life and economic activity. A key part of this is the ability to understand what facilities are available at other locations and how we can most effectively move between places. Equally, as travel costs have fallen and people travel further and more often, the ability to plan and make journeys easily is crucial. These are essential components of the impact of Geo services.
This report, prepared by Oxera for Google, analyses the global economic impact of Geo services, in order to understand the importance of the sector and how it compares in size with other industries. The study considers both the current total contribution of the sector and the marginal contribution over and above that of other sectors. The estimates presented in the report include all Geo services, regardless of provider type or nationality.
The study takes an economic approach to quantifying the impact of Geo. It therefore contains different estimates which represent different components of the full economic impact. It examines activities that form part of market transactions—and hence can be used to estimate direct financial impacts—and the indirect welfare benefits that consumers gain from Geo services. The framework used to analyse the impact is described in section 3.
Where possible, the report provides quantified estimates of the impact of Geo, which rely on a number of sources and assumptions. At least as important to understand as the estimates themselves are the mechanisms highlighted by this report. Finally, the pace of developments and change in the Geo industry is also rapid, and hence the mechanisms are more likely to be future-proof than the estimates themselves.
The report is structured as follows:
– section 2 defines what services are included in the definition of Geo used in this report; – section 3 outlines the approach to quantifying the impact of Geo; – section 4 describes the direct effects of Geo; – section 5 evaluates the consumer effects of Geo; – section 6 analyses the wider economic effects of Geo; – section 7 summarises the main findings of the report.

Oxera What is the economic impact of Geo services? 2
2 What are Geo services?
The term ‘Geo services’ is relatively new, with limited precedent in existing studies. This term is useful for the report because it encompasses a very broad ranges of services that are all to a greater or lesser extent related and share some common inputs (eg, base maps).
Geo services incorporate a wide range of services, including maps, satellite images, location services and combinations of these. Therefore, for the purposes of this report, this section defines boundaries for the services that are included within the category of Geo. These services have been grouped because they use some of the same inputs and share the common goal of helping businesses and consumers to plan and make journeys, and to locate destinations.
2.1 Value chain
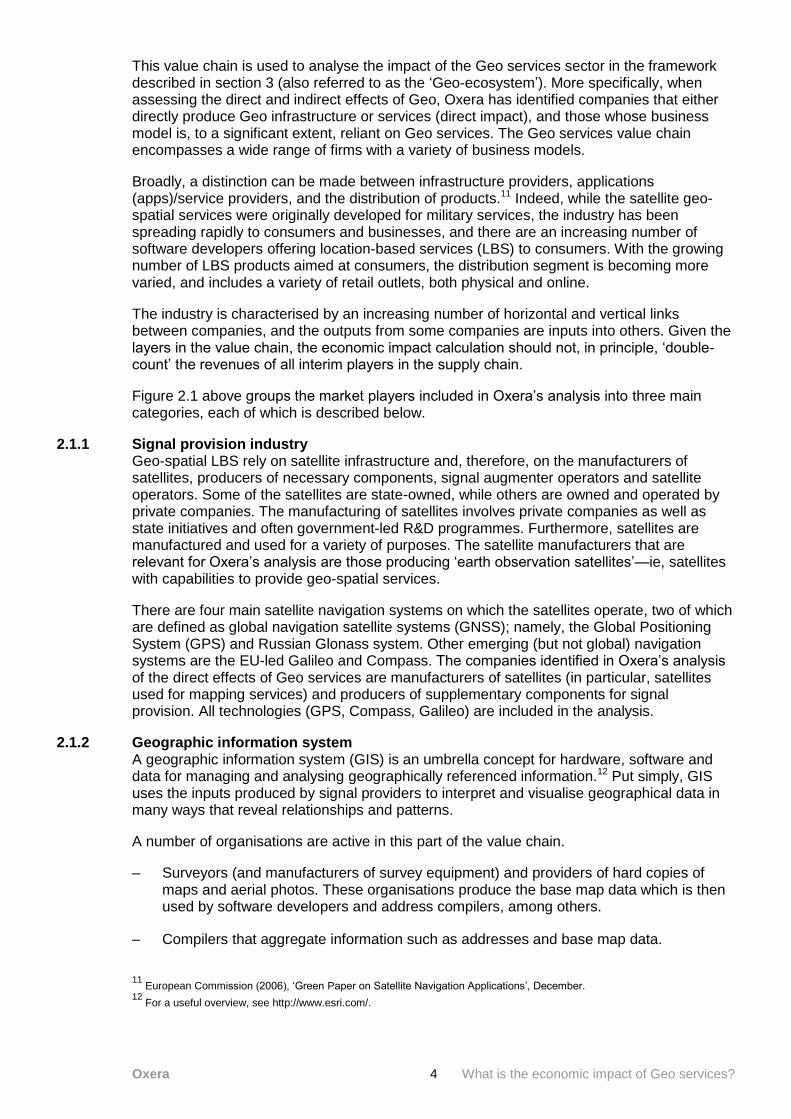
To provide a clear explanation of the services and companies that can be considered part of Geo services, Figure 2.1 depicts a stylised value chain for the industry. A value chain describes the flow of interactions between companies and how they ultimately contribute to the provision of services that are used by businesses and end-consumers.
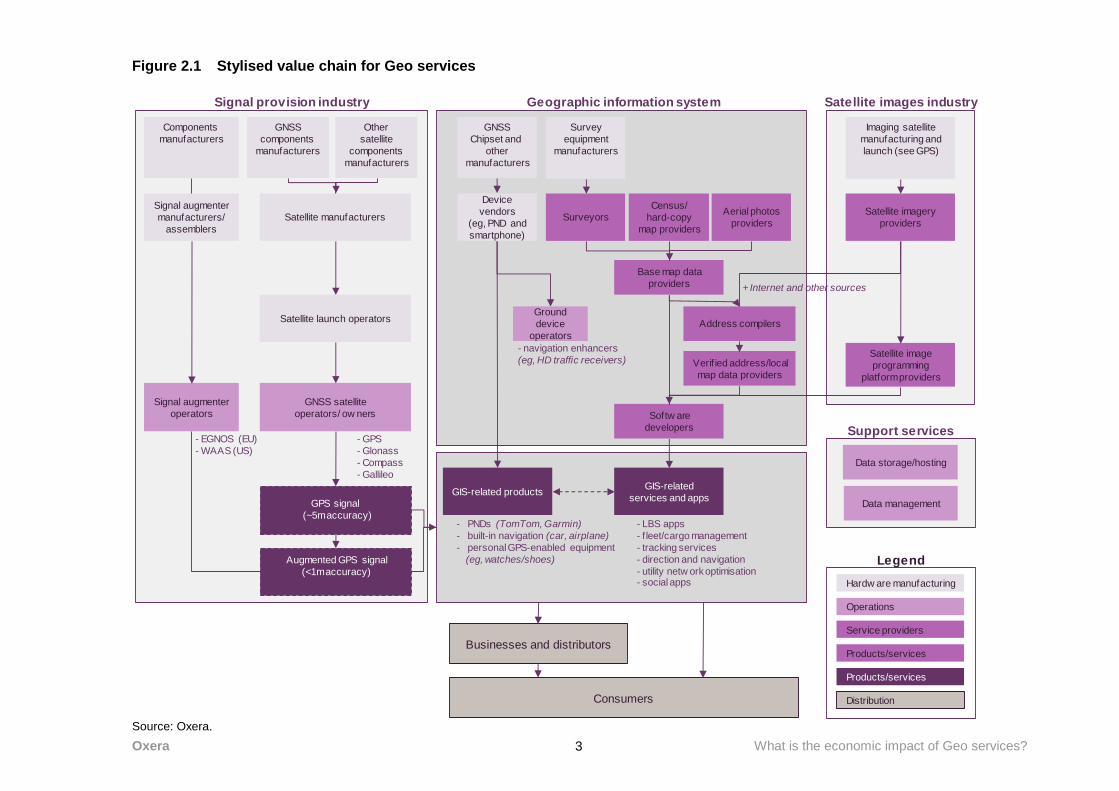
Oxera What is the economic impact of Geo services? 3
Figure 2.1 Stylised value chain for Geo services
Source: Oxera.
Signal provision industry Geographic information system Satellite images industry
Components
manufacturers
Other
satellite
components
manufacturers
GNSS
components
manufacturers
Satellite manufacturers
Satellite launch operators
GNSS satellite
operators/ ow ners
Signal augmenter
operators
Signal augmenter
manufacturers/
assemblers
GNSS
Chipset and
other
manufacturers
Device
vendors
(eg, PND and
smartphone)
SurveyorsCensus/
hard-copy
map providers
Aerial photos
providers
Base map data
providers
Verif ied address/local
map data providers
Softw are
developers
GIS-related
services and appsGIS-related products
Imaging satellite
manufacturing and
launch (see GPS)
Satellite imagery
providers
Satellite image
programming
platform providers
Data storage/hosting
Data management
Support services
GPS signal
(~5m accuracy)
Augmented GPS signal
(<1m accuracy)
- EGNOS (EU)
- WAAS (US)
- GPS
- Glonass
- Compass
- Gallileo
- PNDs (TomTom, Garmin)
- built-in navigation (car, airplane)
- personal GPS-enabled equipment
(eg, watches/shoes)
- LBS apps
- fleet/cargo management
- tracking services
- direction and navigation
- utility netw ork optimisation- social apps
Survey
equipment
manufacturers
Address compilers
+ Internet and other sources
Businesses and distributors
Legend
Hardw are manufacturing
Operations
Ground
device
operators
- navigation enhancers
(eg, HD traffic receivers)
Service providers
Products/services
Products/services
DistributionConsumers
Oxera What is the economic impact of Geo services? 4
This value chain is used to analyse the impact of the Geo services sector in the framework described in section 3 (also referred to as the ‘Geo-ecosystem’). More specifically, when assessing the direct and indirect effects of Geo, Oxera has identified companies that either directly produce Geo infrastructure or services (direct impact), and those whose business model is, to a significant extent, reliant on Geo services. The Geo services value chain encompasses a wide range of firms with a variety of business models.
Broadly, a distinction can be made between infrastructure providers, applications (apps)/service providers, and the distribution of products.11 Indeed, while the satellite geo-spatial services were originally developed for military services, the industry has been spreading rapidly to consumers and businesses, and there are an increasing number of software developers offering location-based services (LBS) to consumers. With the growing number of LBS products aimed at consumers, the distribution segment is becoming more varied, and includes a variety of retail outlets, both physical and online.
The industry is characterised by an increasing number of horizontal and vertical links between companies, and the outputs from some companies are inputs into others. Given the layers in the value chain, the economic impact calculation should not, in principle, ‘double-count’ the revenues of all interim players in the supply chain.
Figure 2.1 above groups the market players included in Oxera’s analysis into three main categories, each of which is described below.
2.1.1 Signal provision industry Geo-spatial LBS rely on satellite infrastructure and, therefore, on the manufacturers of satellites, producers of necessary components, signal augmenter operators and satellite operators. Some of the satellites are state-owned, while others are owned and operated by private companies. The manufacturing of satellites involves private companies as well as state initiatives and often government-led R&D programmes. Furthermore, satellites are manufactured and used for a variety of purposes. The satellite manufacturers that are relevant for Oxera’s analysis are those producing ‘earth observation satellites’—ie, satellites with capabilities to provide geo-spatial services.
There are four main satellite navigation systems on which the satellites operate, two of which are defined as global navigation satellite systems (GNSS); namely, the Global Positioning System (GPS) and Russian Glonass system. Other emerging (but not global) navigation systems are the EU-led Galileo and Compass. The companies identified in Oxera’s analysis of the direct effects of Geo services are manufacturers of satellites (in particular, satellites used for mapping services) and producers of supplementary components for signal provision. All technologies (GPS, Compass, Galileo) are included in the analysis.
2.1.2 Geographic information system A geographic information system (GIS) is an umbrella concept for hardware, software and data for managing and analysing geographically referenced information.12 Put simply, GIS uses the inputs produced by signal providers to interpret and visualise geographical data in many ways that reveal relationships and patterns.
A number of organisations are active in this part of the value chain.
– Surveyors (and manufacturers of survey equipment) and providers of hard copies of maps and aerial photos. These organisations produce the base map data which is then used by software developers and address compilers, among others.
– Compilers that aggregate information such as addresses and base map data.
11
European Commission (2006), ‘Green Paper on Satellite Navigation Applications’, December. 12
For a useful overview, see http://www.esri.com/.

Oxera What is the economic impact of Geo services? 5
– In addition to software and apps, there is a large and growing market for GIS devices. This category encompasses producers of navigation devices (eg, TomTom, Garmin), and of multifunctional devices, such as mobile phone manufacturers. As explained below, only a fraction of revenue of the latter group is attributable to Geo.
– The distribution layer of the GIS supply chain includes all online and physical retailers of devices and software.
2.1.3 Satellite imagery services and support services The remaining firms in the Geo value chain are producers of satellite imagery services and other support services. These companies provide geo-spatial data based on satellite images for a variety of purposes, such as mapping and delivery services supporting the logistics and transport sectors. Further support functions are provided by data storage and hosting companies.
2.2 What are the economic characteristics of Geo?
As shown in section 2.1 Geo services comprise several distinct elements. However, when treated as a combined category and considered as a sole ‘good’, one question that arises is how do they affect the rest of the economy? This question is relevant because it has implications for the rationale for public funding of certain parts of the value chain and for the market structure of other parts.
2.2.1 Positive externalities In general, where the production or consumption of a service or good has an impact on a third party, the service or good can be said to give rise to externalities. If third parties are positively affected by an economic activity then it can lead to private consumers and firms under-consuming that service or good since they do not necessarily take into account the wider impact of their consumption.
Private consumption of Geo services has many positive externalities,13 some of which are explored in more detail in section 6. For example, if the use of a personal navigation device linked to road traffic updates allows a driver to avoid an area of congestion, this benefits not only the driver but also those caught up in the congestion, since the driver does not add to the congestion and make it worse. An individual who increases their education and, in turn, their productivity through familiarity with Geo may create an externality by being more productive for their employer.14
2.2.2 Implications for funding As will be shown in section 3, a large proportion of Geo services are provided by the private sector. However, certain aspects rely on public funding; tor example, the EU’s Galileo satellite radio navigation and positioning programme received funding of €3.4 billion until 2011, with an expectation of a further €1.9 billion being required to complete the deployment phase. This funding came primarily from the EU’s budget, which is in turn funded by Member States and ultimately EU taxpayers.
The implications of some of the economic characteristics of Geo services described above are that there may well be components of these services that merit public funding from an economic perspective—in particular, in order to unlock the positive externalities that these services can provide.
13
An externality is an impact on a third party resulting from a transaction between a separate consumer and producer. 14
The extent to which the employee is able to benefit from their increased productivity through higher wages will depend on the
functioning of the labour market.

Oxera What is the economic impact of Geo services? 6
3 Approach to quantifying the impact of Geo services
There are many metrics that can be used to quantify the economic impact of a sector, each of which provides a different way of examining the impact. The different approaches are not equivalents since they can estimate different concepts of the size of an industry. To this end, section 3.1 sets out a framework, within which the various approaches can be categorised. The framework permits both estimation of the benefit to the economy as realised in market transactions (gross value added, GVA) but also consideration of consumer welfare effects that are not entirely captured through GVA. Many of these benefits are obvious—the very fact that consumers use some of these services as a matter of routine should illustrate how fundamental these effects are. There have therefore been a number of previous attempts to estimate the impact of various parts of the value chain. The contribution of this report is to look at Geo services as a group on a global basis and to provide an order of magnitude of the impacts.
3.1 Framework
The impact of Geo services on the economy involves several related components, including the impact of the production of the sector’s outputs and, more importantly, the longer-term benefits that the sector brings to the economy through the consumption by businesses or consumers of those outputs (see Figure 3.1 below).
Figure 3.1 Stylised explanation of the economic impact of Geo services
Source: Oxera.
Employment in Geo service
provision—eg, employees of
online mapping companies
GVA of geo service providers
Sup
ply
-sid
e
imp
acts
Full economic
effects
Direct impact
Reduced
administration
Lower
search costs
Better
information
Geo services sector
Wider economy
Facilitates
competition
Eff
icie
ncy fo
r
the
end
-use
r
Net
effects
Gross
effects
Difference in inter-sector
productivity of factors of
production—eg, productivity of
online mapping employees
compared with average worker
Economic
footprint
Consumer perspective
Better
information
Lower
search costs
Reduced
navigation time
Choice

Oxera What is the economic impact of Geo services? 7
For clarity, the key components of Figure 3.1 are explained in more detail below.
3.2 Direct effects
Direct effects are those generated by companies directly involved in producing Geo services (eg, those that form part of the value chain described in section 2, such as TomTom, Carifact and Garmin) and the value that they create.
These effects can be measured in various ways: by the revenues that are received; by market capitalisation; by GVA; or by the jobs involved in producing these services.
3.2.1 Revenues versus GVA GVA measures the contribution of a sector to the economy in terms of the value of output (ie, revenue from sales) less the costs of the (non-employment) inputs purchased and other costs incurred.15 Therefore, GVA measures provide a way of analysing the importance of a sector in terms of the value it adds to an economy. However, obtaining accurate estimates of the GVA for a specific industry at the national or international level can be challenging. National statistics offices tend to keep records of output produced, but disaggregating these into sectors that could begin to identify Geo services is not easy.
Revenues are a more readily accessible estimate of the direct effect of a sector, providing an indication of the scale of market transactions that occur. However, if adding revenues across a value chain, there is a risk that the economic value is double-counted, since the revenues to one layer of a firm contain the revenues to the layer above it.
Market capitalisation is another direct financial measure. It gives an indication of the total value of a company based on its listed share price and the outstanding number of shares. This measure is more dynamic since it takes into account the expected future earnings of the sector, as investors will factor these into the share price. It also abstracts from the issue that revenues may be high, in order to cover high input costs, since market capitalisation is fundamentally driven by expected profits rather than expected revenues. Therefore, the level of market capitalisation can be considered as the total level of investment in the industry.
Other important indicators include the tax revenue generated and employment.
3.2.2 Gross versus net In looking at the economic impacts of the production of a sector’s outputs, it is common to treat these effects in isolation from what else might be happening in the economy (ie, gross effects). These gross effects can be an appropriate measure to consider. However, with the exception of very short time periods, there is a risk that this approach fails to account for the fact that resources in the economy (eg, labour and capital) that are not used in the Geo services sector would be used elsewhere and produce some other output. For example, a Geo app programmer may switch to producing non-Geo-based apps.
In some cases, it is more appropriate to estimate the difference in the impact on the economy if resources are, on the one hand, used in Geo services, and, on the other, redeployed somewhere else in the economy. This would give the net effect. The net effects can be calculated by taking into account the impact of substitution of resources employed in, for example, the aviation sector to other sectors of the economy. In this case, the main impact relates to the difference in productivity between Geo services employees (a high-productivity sector), and the average across the economy as a whole.
15
GVA is calculated mainly by reference to wages paid and profits arising from the activity in question. This is broadly
equivalent to the revenue generated by sales, minus the non-wage costs incurred in making those sales.

Oxera What is the economic impact of Geo services? 8
3.3 Indirect effects
The impact of Geo services is not limited to the producers of these services. Geo services also have an indirect effect on the economy through its supply chain, either upstream (eg, jobs in the mining sector that produce the materials for use in satellites) or downstream (eg, companies that rely on Geo services). This will include offline companies such as TomTom and Garmin, and online property search companies such as Rightmove and Zoopla.
Establishing the links between different sectors of the economy would typically rely on input–output matrices as provided by statistical authorities. However, given the breadth of the Geo services sector, identifying the classifications used in such matrices and mapping them to this sector would be complicated.
Instead, the approach taken in this report is to categorise all effects as either direct or wider supply-side effects. The definition of Geo used for the purposes of this study is sufficiently broad that most of the upstream inputs are included in the direct effects (eg, satellite companies are included), while the downstream users of Geo services are captured in the wider supply-side effects.
3.4 Wider supply-side effects
The wider, or ‘supply-side’, mechanisms are those by which the use of the Geo services sector increases productivity and potential output throughout the economy. For example, because taxi drivers can use Geo services they are able to save a certain amount of time each day, enabling them to reduce prices and carry more passengers.16
The key characteristic of these mechanisms is that they do not simply divert labour and capital from other parts of the economy to produce Geo services, which may or may not imply higher aggregate productivity and output—the use of these services increases efficiency and therefore output across the economy.
Wider supply-side effects are analysed in more detail in section 6.
3.5 Consumer perspective
Closely related to the wider supply-side effects is the consumer perspective. Since many consumers access Geo services at no cost, the efficiency and welfare impact of these services is likely to be significant. These measures are likely to include—but not be limited to—the following:
– time/financial savings from not getting lost during a journey; – better planning as people can measure distances and expected drive times; – educational value from the availability of maps even when not used for navigation; – the use of Microsoft’s Streetside or Google’s Streetview to reduce search costs, for
example when assessing holiday destinations or buying a house (eg, a user can look at a neighbourhood in advance without travelling to each house);
– the use of ‘local search’ to reduce search costs when looking for a supplier or service provider.
Consumer effects are analysed in more detail in section 5.
16
This example assumes that the taxi market is competitive and that any cost savings would be passed through to consumers.

Oxera What is the economic impact of Geo services? 9
4 Global direct effects
Key messages Direct effects refer to the economic presence or footprint of those companies directly involved in producing Geo services (eg, companies that are part of the value chain, such as Google, Carifact, Garmin) and the value they create.
These effects can be measured by the revenues that are received; by market capitalisation; by GVA; or by the jobs involved in producing these services.
This report has adopted a number of approaches, and estimates that the Geo services sector generates $170–$250 billion of revenue globally. By way of comparison, this is greater than the $25 billion of revenues generated by the video games industry,17 broadly equivalent to the $140 billion of revenues from the global security services industry,18 or around one-third of the global airline industry’s revenues of $594 billion.19
Direct effects are the most tangible when it comes to quantification because they are realised in market transactions, and hence in the revenues and capitalisation of Geo services companies. However, many of these companies provide a range of services and they do not necessarily have sufficient transparency to report what are or are not Geo services.
4.1 Revenues
4.1.1 Bottom-up approach One approach to measuring revenue/to estimating the global direct effect of Geo services is to examine the self-reported financial results of companies that provide Geo services. This can be done by looking at the accounts of all companies that can be classified as having an element of Geo services. Oxera has used Bloomberg to collect data on these companies.20
The relevant companies were included based on their position in the value chain which was identified using the Bloomberg Industry Classification Standard (BICS) and keyword searches in company descriptions. This approach provides a reasonably global picture and an objective basis to estimate the size of the industry. It is based on company accounts and hence actual transactions. One disadvantage of this method is that the classification is necessarily imperfect; it cannot capture unlisted companies, and can therefore be considered to yield a conservative estimate. In addition, some parts of the value chain cannot be accounted for using this method. The distribution channel and the non-navigation LBS app sector are not accounted for.
Bloomberg classifies all listed companies using BICS. This provided the list of companies for the parts in the value chain covering GPS devices (eg, Chengdu GoldTel Electronical Technology Co or Garmin), navigation software (eg, BCI Navigation or Nokia), and mobile phone devices (eg, Samsung or ZTE). The relevant satellite manufacturing, operating and imaging companies (eg, China Aerospace Times Electronics Technology Co, Egyptian Satellites or DigitalGlobe Inc.) were identified based on a keyword search.
17
Entertainment Software Association (2011), ‘Essential facts about the computer and video game industry’. 18
Central Association of Private Security Industry (2011), ‘Security services a sunrise industry’. 19 International Air Transport Association (2011), ‘Weak Economy, Weak Profits–2012 Looking Even Tougher’, September. 20
Bloomberg is a multinational company that provides specialist financial software tools and databases.

Oxera What is the economic impact of Geo services? 10
In order to determine the proportion (based on both revenue and market capitalisation) of these companies that provide Geo services, Oxera examined the reported revenue shares by BICS category (that is, revenue generated by the relevant activity) to approximate the extent of their activities in the relevant segments. Missing revenue share data for these categories and the companies identified by the keyword search were imputed using the averages for multi-product firms. Where information on revenue share was not available for the large technology conglomerates (eg, Sony or Panasonic), further adjustments were made to account for the fact that the proportion of revenue share owing to Geo-related activities was likely to be lower because of the extent of their other businesses. Therefore, their share was approximated with the revenue share of the one similar company available (Fujitsu).
Revenue shares were not available for the satellite manufacturing, operating and imaging companies, so a proxy based on the number of relevant satellites currently orbiting the earth has been used to capture the relevant proportion.
Mobile manufacturers’ revenues rely directly on Geo-related services only to a small extent. Therefore, further assumptions have been made to take this into account. The additional revenue generated by having built GPS-enabled smartphones compared with non-GPS-enabled smartphones was estimated as follows. First, only the share of the revenue (market cap) associated with smartphone sales was taken into account. Second, the ratio of the GPS receiver’s cost to the total material cost of the average smartphone was used to scale down the total smartphone-related revenue to arrive at an estimate of the additional benefit.
The bottom-up approach yielded a total market capitalisation of around $98 billion, and total revenue of around $149 billion. These figures inevitably involve an element of double-counting owing to the vertical nature of the supply chain (eg, some of the revenues gained by companies providing apps to consumers will flow straight through to the revenues of the Application Programming Interface (API) provider and hence appear at least twice). The market capitalisation number is not an annual flow, but rather an indication of the value of the current stock of investment in the Geo services sector, since it represents all the equity that investors have put into Geo services firms.
4.1.2 Scaling up other estimates Another approach to estimating the global direct effect of Geo services is to scale up estimates available for specific countries. Management consulting firm, Boston Consulting Group (BCG), estimated that Geo revenues in the USA in 2011 were $73 billion, which can be allocated to various activities in the value chain: $17 billion is generated in the satellite navigation sector, and $56 billion is generated by the rest of the industry.21
Oxera employed a two-step approach to scale up the estimate available for the USA. First, countries that are unlikely to have any companies in a high-tech industry such as Geo services were excluded entirely. This exclusion was based on the fact that these countries did not report any R&D expenditure in the last five years of available data (2006–10), and were thus assumed not to have a significant high-tech industry.22 Countries with relatively low R&D expenditure were excluded from the satellite navigation sector and were taken into account only in scaling up the rest of the industry.23
21
This estimate is total revenue, not value added, so is not directly comparable with other estimates. Boston Consulting Group
(2012), ‘Geospatial Services: A $1.6 Trillion Growth Engine for the U.S. Economy’, December. 22
Based on United Nations World Development Indicators (WDI) data. 23
There are a large number of countries with limited or no R&D expenditure (measured as percentage of GDP), and it is likely
that only the few most advanced countries have significant activities in the sector; therefore the upper 20% was included in this sector.

Oxera What is the economic impact of Geo services? 11
The second step was to assume that the Geo revenue:GDP ratio is the same across countries for the two sets of Geo activities.24 Having calculated this ratio for the USA, it can be applied to the other countries’ GDP to arrive at a global number. The steps of the calculations and the results are presented in Figure 4.1 for the example of the US market.
Figure 4.1 Scaling up the Geo services revenues in the USA
Source: Oxera analysis based on BCG and WDI data.
This approach estimates the worldwide revenues of Geo services to be around $274 billion.
4.1.3 Other global estimates The economic contribution of Geo has been recognised in the policy context. While there are no previous studies estimating the economic contribution on a global scale including both direct and indirect impacts, estimates have been presented on the market size of the sector. For example, the European Commission has stated that ‘the [navigation infrastructure and services] market in products and services has been forecast to reach €400 billion by 2025.’25
There are also studies analysing the value of certain sub-sectors of the Geo value chain. Examples include the following.
– The global value of GPS networks and services was forecast to rise from $263m in 2009 to $504m by 2013, according to a report by Position One Consulting.26
– Another study by ndp consulting estimated the direct economic benefits of GPS technology for commercial GPS users to be $67.6 billion per year in the USA, with the potential to grow to $122.4 billion per year with 100% GPS penetration in GPS-intensive industries. In addition, according to the study, GPS technology creates direct and indirect positive spillover effects (similar to those analysed by Oxera), such as emission reductions from fuel savings, health and safety gains, time savings, job creation, tax revenues, and improved safety and national defence.27
24
GDP or income can be considered a sensible measure to scale up with, since the take-up Geo services is likely to be in line
with income. It is also worth noting that the R&D-based exclusion implicitly gives less weight to countries with lower GDP because of the correlation that can be observed between GDP and R&D expenditure. 25 European Commission (2006), ‘Green Paper on Satellite Navigation Applications’, December 12th. 26
Position One Consulting (2009), ‘The Global Market for GNSS Augmentation Infrastructure and Services 2009–2013’ March. 27 ndp consulting (2011), ‘The Economic Benefits of Commercial GPS Use in the U.S. and The Costs of Potential Disruption’,
June.
$56bnUS revenue of other
Geo-related industry
$17bnUS revenue of
satellite industry
0.12%of US GDP
0.38%of US GDP
$60,347bnGDP of countries with
assumed other
Geo-related industry
$36,145bnGDP of countries with
assumed satellite
industry$42bn
Estimated global
revenue of the
satellite industry
$232bnEstimated revenue of
other Geo-related
industry
$274bnTotal global
Geo revenues

Oxera What is the economic impact of Geo services? 12
– Market research firm, Strategy Analytics, has estimated that consumer and advertiser expenditure on LBS will approach $10 billion by 2016.28 According to the study, there is an increasing demand by consumers for LBS services, which is driven by the take-up of smartphones and other devices supporting such services. Consumer take-up, in turn, provides opportunities for advertisers that can include location information as part of online advertising. This aggregate estimate is broadly consistent with the estimate of another market research company, Market Research, which expects the total revenue of the industry to reach $10.3 billion by 2015.29
– IE Market Research estimated in 2010 that the global market for GPS navigation and LBS would reach a revenue level of $13.4 billion by 2014 (with a compound annual growth rate (CAGR) of 51.3%). IE considered that the growth was driven largely by the strong take-up of devices with navigation capabilities and advanced mobile apps on iOX and Android operating systems.30 IE’s research suggests that the revenues will be less reliant on voice-guided in-car navigation, and significantly more driven by voice-guided pedestrian navigation.
– ndp consulting has estimated that the direct economic benefits of GPS are $67.6 billion per year in the USA.31
It is beyond the scope of this study to assess the validity of these estimates. Indeed, it is not fully clear how the aggregate numbers are calculated, and the methodology may not be fully consistent across the reviewed studies, or with this study. Nevertheless, these studies provide useful benchmarks for Oxera’s analysis and are used as cross-checks for the values calculated in this report.
4.1.4 Non-navigation location-based services An example of how Geo services can foster innovation and the development of new markets is the existence of the non-navigation LBS. These are smartphone apps which depend entirely on the provision of Geo services, and include local social networking apps such as Foursquare or local search apps.
This sector is in its infancy and its business model is still being developed. One study estimated the global revenue from non-navigation LBS to be around $1.1 billion in 2010,32 reaching around $3–$4 billion by 2013.33
4.2 Gross value added
GVA measures the contribution of a sector to the economy. Essentially, it can be understood as GDP minus taxes plus subsidies. One way to approximate it is to calculate the sum of total profits and total compensation of employees of the Geo services industry.
Industry profits can be estimated using an approach similar to the bottom-up approach based on Bloomberg data. Therefore, the same limitations apply, and it is likely to be a conservative estimate. Based on the companies’ accounts, total industry profits are approximately $22.8 billion.
28
Strategy Analytics (2011), ‘The $10 Billion Rule: Location, Location, Location’, May. 29
Pyramid Research (2011), ‘Location-Based Services: Market Forecast, 2011-2015’, May. 30
IE Market Research (2010), ‘3Q.2010 Global and Regional GPS Navigation and Location Based Services Forecast’, July. 31
ndp consulting (2011), ‘The Economic Benefits of Commercial GPS use in US and the Costs of Potential Disruption’, June. 32
Enterprise Mobility Experts (2010), ‘Location Based Services market and Trend Analysis’, available at
http://www.emobilityxperts.com/Location_Based_Services_Analysis.pdf. 33 Ibid., and ABI research (2008), ‘Location-based Mobile Social Networking Will Generate Global Revenues of $3.3 Billion by
2013’, August, available at http://www.abiresearch.com/press/1204-Location-based+Mobile+Social+Networking+Will+Generate +Global+Revenues+of+$3.3+Billion+by+2013.

Oxera What is the economic impact of Geo services? 13
The total compensation of employees is estimated by scaling up BCG’s employment estimate for the USA for all relevant countries, in the same way as was described for the revenue direct effect.34 This therefore allows for lower, or zero, proportionate employment in some countries where the provision of Geo services is low, resulting in an estimate of the total global employment in Geo services of approximately 4m.
In order to convert the employment figure into a total employee wage, an estimate of Geo-specific wages has been used. The US Bureau of Labor Statistics has estimates available of median wages for workers in the US Geo services sector (see section 5.3.2). These estimates were applied directly for employment in Geo in the USA. For other countries, average wages in the whole economy were scaled up by the US ratio of Geo to average wages in order to provide an estimate of Geo-specific wages. This estimate therefore gives an overall approximation of $73 billion for the labour remuneration of Geo employees.
This method gives an estimate of $90 billion for the labour component of GVA. Thus, the total GVA of the global Geo services industry is estimated to be around $113 billion.
4.2.1 Net effect The net effect of a sector is a concept that illustrates the value added by a sector that cannot be reproduced by other sectors. It is a hypothetical measure of the difference between current output with Geo services and the counterfactual of the output of the economy without Geo services. Although estimating this effect is essentially a thought experiment, it provides an indication of the productivity of the sector relative to the rest of the economy.
To calculate a rough estimate of the net effect, Oxera has taken the above approach to the quantification of the value added by labour and compared this with an approach where only the average value of labour in the economy is used. This provides an estimate of $40 billion:
4.3 Summary
The various approaches outlined above have provided a range of estimates for the global direct effect of Geo services, and are summarised in Figure 4.2 below. They should be considered as only the start of estimating the impact of Geo as there are other effects not captured through these market transactions. These other effects are considered in sections 5 and 6.
34
Boston Consulting Group (2012), op. cit.

Oxera What is the economic impact of Geo services? 14
Figure 4.2 Summary of estimation of direct effects
Source: Oxera.
0
50,000
100,000
150,000
200,000
250,000
0
100,000
200,000
300,000
400,000
500,000
600,000
700,000
Geo services Other sectors Geo services Other sectors
Revenue Output
Se
cto
r o
utp
ut
($m
)
Se
cto
r re
ve
nu
es (
$m
)
Bottom-up estimate Scaling up BCG’s US estimate Demand-side estimate
Security services Aviation Video games

Oxera What is the economic impact of Geo services? 15
5 Consumer effects
Key messages Geo services are wide in scope, as reflected in the range of uses that consumers have for them. These uses generate benefits for consumers in different ways. The fact that consumers benefit from Geo services is partly captured in the revenue impacts illustrated under the direct effects, showing that consumers are willing to pay to use these services. Moreover, consumers derive benefits from services that are not captured via revenues. This is apparent when considering that many Geo services are free at the point of use (eg, Michelin maps).
Geo services are typically an intermediate good—ie, they are not typically valuable in themselves, but are instead used to help consumers engage in other activities. Thus, the benefit to consumers (described in economics terms as the ‘consumer surplus’) from Geo services is a derived consumer surplus, but this can still be significant. Some examples of the consumer welfare benefits that Geo services generate include:
– journey time and fuel savings from more efficient navigation—this impact could be worth around $22 billion per year to consumers;
– faster emergency response to cardiac arrests—potentially saving 152 lives per year in the UK;
– educational benefit—worth around $12 billion per year to individuals.
The discussion in the preceding sections focused on quantifying the impact of Geo services by examining financial data, and therefore considered evidence from market transactions (or, in the case of market capitalisation, the expectations of future transactions). However, the benefit for consumers often goes beyond what they pay for a service. This section discusses the various ways in which consumers can benefit from Geo services and provides estimates for these.
5.1 Consumer benefits
Consumers benefit from the multiple ways in which they can use Geo services. Typically, consumers are willing to pay a certain amount in exchange for any good or service and if they are able to obtain the product for less than this amount, they have benefited from the transaction. In economic terms, the difference between the price paid and the maximum they were willing to pay is called ‘consumer surplus’.
In the context of Geo services the consumer surplus will often be equivalent to the full benefit received by the consumer since many services are available free of charge at the point of delivery (eg, Sohu maps, popular in China, is free to use). In addition, even where consumers must pay for some element of the service—such as purchasing a satellite navigation device—the ongoing marginal use of the purchased product tends to be free of charge.
In addition, in the context of Geo the normal consumer surplus approach needs to be considered in a wider perspective. Geo services are typically an intermediate good—ie, they are not normally valuable in themselves, but rather are used to help consumers engage in other activities. Thus, in some ways the benefit to consumers from Geo services is a derived consumer surplus. For example, shortening the time to find a local Greek restaurant is valuable because it effectively reduces the overall cost (measured as the cost of the meal and the time spent at the restaurant) of having Greek cuisine that evening. Thus, while the

Oxera What is the economic impact of Geo services? 16
core benefit still derives from the experience in the restaurant, the net benefit is greater because of the added convenience of finding the venue without wasting time looking for it.
The benefits described in this section typically accrue in some form other than direct financial transfer to consumers. Therefore, in order to compare these benefits, it is necessary to translate them into a monetary value. This is done separately in each individual calculation, depending on the base unit that needs to be monetised. This monetisation also allows a comparison of welfare affects across countries (see Box 5.1).
Box 5.1 Comparing welfare across countries
The conversion of monetary estimates by nominal exchange rates is not necessarily the most appropriate method of comparing welfare across countries. This is because nominal rates do not necessarily capture the different amounts of goods and services in each country that any given amount of a particular currency can buy. For example, $1 in the USA will typically buy fewer non-tradeable goods than $1 in Indonesia. Given that the intention is to measure welfare, the level of goods and services that can be bought is a more meaningful comparison than the amount of money held by an individual.
An alternative approach to comparing monetary values across countries is to use ‘purchasing power parity’ (PPP) exchanges rates. These exchanges rates account for differences in the purchasing power of currencies by considering how much money is needed to purchase the same basket of goods and services across countries.
Source: See, for example, World Bank, International Comparison Programme (2011), ‘What is Purchasing Power Parity?’.
5.2 Journey time savings
5.2.1 How time savings from Geo arise Navigation systems, or GPS devices, help guide individuals to their final destinations through the fastest and/or shortest routes. These devices may be built into vehicles, or purchased separately as portable navigation systems and used while cycling or hiking, for example. Many mobile phones also contain GPS capabilities.
While there is global data on the sales of GPS devices, there are few estimates of the percentage of journeys which use them for directional purposes. Some studies have estimated that approximately 20% of passenger vehicles have navigation devices.35 More recent estimates from the UK suggest that an increasing number of drivers may have navigation systems in their cars, in line with the rise in sales of these devices. Based on a 2010 household survey of travel patterns, the UK Department for Transport (DfT) estimated that 32% of cars either had integrated (4%) or hand-held (28%) navigation devices.36
The use of navigation systems in cars leads to time savings. These time savings could arise as individuals make fewer stops, stop for less time and turn around less frequently when attempting to reach their final destination, compared with individuals using conventional navigation tools. Some navigation systems can also take account of current road traffic and recommend the fastest route given the road conditions.
A study by Dutch research institute TNO (Netherlands Organisation for Applied Scientific Research), undertaken on behalf of TomTom, estimated that using a navigation system can lead to a 16% reduction, on average, in the number of kilometres driven, and an 18%
35
Institute for Road Safety Research (2010), ‘SWOV Fact Sheet: Safety effects of navigation systems’, Netherlands,
December. Note that this study found that 60% of goods vehicles had these devices. 36
Department for Transport (2010), ‘National Travel Survey’, Table NTS0907. This was an increase from 31% in 2009.

Oxera What is the economic impact of Geo services? 17
reduction in journey time when driving in an unfamiliar area to an unfamiliar destination.37 For example, when drivers used navigation systems as opposed to conventional maps, average recorded journey time was 26 minutes as opposed to 32 minutes, and 18.1km rather than 21.5km.38 This reduction in driving time and distance also leads to fuel savings. A study undertaken on behalf of Navteq in Germany found that drivers with navigation devices experienced a 12% increase in fuel efficiency, as measured by litres of fuel/100km.39
5.2.2 Why time savings are valuable Travel time, particularly time spent driving in cars, is often considered to be unproductive. Therefore, time saved is of economic benefit to individuals as they can either reallocate this time to more productive activity (ie, work) or more pleasurable leisure activities. In addition to the time-saving benefits of shorter journey times, there may be other beneficial impacts that are more difficult to quantify, such as a reduction in discomfort and stress. While these lead to increases in consumer surplus, the reallocation of travel time from unproductive to productive activities also creates economy-wide benefits in terms of increased output.
There is a large body of theoretical and empirical literature which discusses the appropriate ways of measuring the value of travel time savings. Broadly speaking, if a trip is undertaken during work time, a significant measure of the value of time is the wage paid for the productive work that is sacrificed to travel. Even if time saved is reallocated to leisure activities, travellers still consider some fraction of their wage rate as an approximate standard of what they are willing to pay, since, at the margin, individuals tend to decide between either working for one more hour or taking one more hour of leisure.
5.2.3 Estimation of global time (and fuel) savings from Geo services Oxera has estimated the global time and fuel savings resulting from the use of navigation devices. While time savings may also accrue to individuals using portable GPS devices while cycling or walking, owing to data availability the calculation focuses on benefits for drivers.
The steps in the calculation and the assumptions made are described below. Where country-level data is not available, variables are assumed to remain constant across countries. Most data used in the calculation is for 2009, although data from other years was used in some cases. Neither of these features is expected to have a significant impact on the calculation. In total, 151 countries were included in the calculation for both fuel and time savings, 11 for just time savings and one for only fuel savings.
In order to estimate time savings, the first step is to determine the number of cars with navigation devices. It is assumed that 20% of motor vehicles in each country have navigation devices, in line with the estimate from the TNO study described above. While there are some countries for which the percentage of cars with GPS devices may be less than 20%, there are also developed countries where the take-up of these devices is likely to be higher. Therefore, this is considered to be a reasonable estimate, on average, across countries. The calculation also implicitly assumes that the load factor of each car is one, or that benefits only accrue to drivers. Given that passengers may be able to use their journey time efficiently, time savings may not have the same benefits for passengers as they would for drivers in any case.
Even if individuals have GPS devices, it is unlikely that they are used on every journey. Indeed, most individuals use navigation systems on unfamiliar business and recreational journeys. A 2010 study considered the frequency of use of navigation devices, estimating that 35% of drivers with navigation systems use them on 20% of their trips, and that 15% of
37
TNO (2007), ‘Independent research by Dutch research institute TNO shows that satellite navigation systems have a positive
influence on road safety’, Key Findings, February. This is based on a study of 36 people driving in realistic traffic conditions. 38
Ibid. 39
NAVTEQ (2009), ‘NAVTEQ Study Shows Traffic-Enabled Navigation Can Save Drivers 4 days per Year: Results build upon
fuel and carbon emission savings previously reported’, August 27th.

Oxera What is the economic impact of Geo services? 18
drivers use them on 80% of their trips.40 This distribution of frequency of use was combined with estimates of the average number of journeys made by individuals each year to determine the total number of journeys made using Geo services.41
Data for the average journey duration, and the average reduction in journey time resulting from the use of GPS devices, was then used to determine the total number of minutes/hours saved.42 In order to convert this into a value of time, average annual wages were divided by average yearly working hours. (Where wage data was not available for countries, GDP per capita was used and adjusted, based on the ratio of wage to GDP per capita for countries where wage data was available.) All wage data was converted to PPP to ensure comparability of consumer benefits across countries. Although the value of time can differ between uses of time (eg, leisure time is typically less valuable than working time), this distinction is driven primarily by tax rates and the indivisibility of labour (ie, full-time jobs usually have fixed contracted hours).43A theoretical approach would suggest that the marginal values of leisure and work time should be equal; otherwise, individuals would substitute between them until they became equal. Thus, for ease of calculation, it has been assumed that the wage rate is an appropriate approximation to the value of time.
The global value of time savings is estimated at $17.3 billion (in international dollars44). The benefits for individual countries vary considerably according to the value of the inputs described above. For example, Oxera estimates the benefits in the USA at approximately $5.5 billion, $73m in Argentina, $77.5m in Malaysia, and $684,000 in Zimbabwe.
Furthermore, time savings also lead to consumer (and environmental) benefits in the form of motor fuel savings. While fuel savings seemingly come at a loss of output in the economy, instead of spending money on fuel, individuals will direct this expenditure towards other, possibly more welfare-enhancing, goods. Therefore, fuel savings can be added to time savings to determine the total economy-wide benefit of using GPS devices in cars.
The number of miles saved as a result of using navigation devices was calculated by dividing the number of hours saved in each country by average speed, which was assumed to be constant across countries.45 Fuel savings were determined by multiplying the miles saved by average fuel consumption per mile (which is also held constant) and the price of fuel (in PPP) in each country.46 The total estimate for fuel savings is approximately $4.9 billion.
The fuel and time savings in each country can then be summed to generate a total benefit for each country, as well as a global benefit of approximately $22 billion from the use of Geo services in cars. The estimated values for each stage of the calculation are presented in Table 5.1.
40
Institute for Road Safety Research (2010), op. cit. This study found that, on average, individuals with navigation systems
drive more kilometres per year than those without such devices. 41
The estimate of the average number of journeys per year is taken from the DfT (2010), ‘National Transport Survey’ for
car/van drivers, and is applied to all countries. The estimate of 405 journeys/person/year implies that people make on average 1.1 journeys per day. 42
The average number of minutes per journey is assumed to be 21 based on data from the DfT (2010), ‘National Transport
Survey’, and this is applied to all countries. The reduction in journey time is assumed to be 18% based on TNO (2007), op. cit. 43
For example, the UK DfT estimates the average value of time of working time for persons as £28.68 compared with £5.71 for
non-working time. See DfT (2012), ‘TAG Unite 3.5.6: Values of time and operating costs’, October. 44
An international dollar is a hypothetical unit of account that has the same purchasing power over gross national income as a
US dollar has in the USA. 45
The average speed of 25 miles/hour is taken from the UK DfT (2010), ‘National Travel Survey 2010’ and is based on peak
time in London. Therefore, this is likely to be a conservative assumption. 46
International Energy Agency (2011), ‘International comparison of light-duty vehicle fuel economy and related characteristics’,
Revised draft, May 10th.

Oxera What is the economic impact of Geo services? 19
Table 5.1 Quantifying time and fuel savings from the use of Geo services: global estimate
Steps Calculation
Number of motor vehicles1 1,030m
Number of people with navigation devices2 20% × 1,030m = 206m
Average number of journeys each person makes3 405
Total number of journeys taken with Geo services/year4 17,934m
35% of people with navigation devices use them on 20% of their trips (35% × 206m) + (20% × 405)
15% of people with navigation devices use them on 80% of their trips (15% × 206m)+(80% × 405)
50% of people with navigation devices use them on 5% of their trips (50% × 206m)+(5% × 405)
Average number of minutes/journey5 21
Total number of minutes for journeys taken with Geo services/year 17,934m × 21 = 376,623m
Average reduction in journey time from using Geo services6 18%
Number of minutes saved 18% × 376,623m = 67,792m
Number of hours saved 1,130m
Value of time saved 17,373m
Number of miles saved7 28,360m
Fuel saved (litres)8 3,501m
Price of fuel saved9 4,924m
Total time and fuel savings 22,297m
Notes:
1 The number of motor vehicles in each country includes cars, buses and freight vehicles. The number of
motor vehicles is determined by multiplying the number of motor vehicles/1,000 population by the population in each country. In most cases data is from 2009, but where this data was not available, the most recently available data was used (in all cases this is after 2005.) There are a few countries for which data was not available and these countries are excluded from the calculation.
2 The percentage of people with GPS devices in their cars is
assumed to be 20% across all countries. This may be an underestimate in some countries and an overestimate in others; however, overall it is likely to be a reasonable estimate given that individuals may also use mobile phones with GPS capabilities in their cars, and approximately 60% of goods vehicles have GPS devices.
3 The average
number of trips/person/year for car/van drivers is taken from the 2010 UK DfT National Travel Survey and is applied to all countries.
4 There was no frequency-of-use data available for 50% of individuals with GPS devices,
so an assumption is made that these devices are used on 5% of their journeys. 5
This figure is the average trip duration, in minutes, for car/van drivers from the UK DfT National Travel Survey, and it is applied to all countries.
6 This is assumed to be the same across countries.
7 The number of hours saved are divided by average
miles/hour to calculate the number of miles saved. Average miles/hour are taken from the 2010 UK DfT National Travel Survey and applied to all countries.
8 The number of miles saved is multiplied by average fuel saved/mile
to calculate total fuel savings. The average fuel savings/mile are taken from the International Energy Agency’s estimated global average for fuel economy (litres of gasoline equivalent/100km) for 2008 and converted from kilometres to miles.
9 The fuel savings are multiplied by the price of fuel/litre in international dollars for each
country. Sources: World Development Indicators Database. UK Department for Transport (2010), ‘National Travel Survey’, Tables NTS0409 and NTS0311; TNO (2007), ‘Independent research by Dutch research institute TNO shows that satellite navigation systems have a positive influence on road safety’, Key Findings; International Energy Agency (2011), ‘International comparison of light-duty vehicle fuel economy and related characteristics’, Revised draft, May 10th; Department for Transport (2011), ‘TSGB 2011: Roads and traffic’, December 15th.
There are a number of other potential benefits of using GPS devices which have not been captured by the calculation above. For example, there may be benefits to other road users if the use of GPS devices leads to improved traffic flows, which creates shorter journey times

Oxera What is the economic impact of Geo services? 20
for drivers without GPS devices.47 There may also be time-saving benefits for emergency services, as described in Box 5.2.
Navigation devices may also have a positive effect on traffic safety. In one study over 65% of drivers surveyed in six countries considered that navigation systems increased driver awareness and alertness, making it easier for them to keep their attention on the road.48 However, there may also be some unintended negative effects of using navigation devices, such as drivers being distracted by the device or attempting to operate it while driving.
Box 5.2 Emergency services
Since emergency services can use Geo services to locate and reach an emergency, they can typically arrive at the scene more quickly than without Geo. The impact of this may be vital since small time savings can make the difference between life and death in some emergency situations.
Some emergency response units use automatic vehicle location (AVL) to aid their fleet management. In this case, a centralised control centre continually monitors the location of a vehicle, allowing the optimal assignment of vehicles to each incident. AVL can also be used to monitor and tweak the scheduling of public transport.
Oxera has calculated an estimate for one element of emergency response: medical emergencies involving a cardiac arrest. Based on the time savings calculation described above, it is estimated that the presence of Geo could reduce an ambulance’s journey time by 18%.
Response times to emergencies will differ substantially according to the precise location, the number and competency of the emergency response team, and the severity of the incident. Oxera has assumed that the response time for a ‘typical community’ is nine minutes.
49
Based on the assumption that this estimate is for a fleet equipped with Geo technology, the average response time without Geo would therefore be 11 minutes.
A number of studies have estimated the impact of improved response times on survival rates from cardiac arrests. One such study suggests that cutting one minute off the response time can improve
survival rates by around 7–10%.50
Other studies show estimates in a similar range.51
Around 17,900 patients are treated for out-of-hospital cardiac arrest by the emergency services each
year in England, and the survival rate is currently around 6%, or 1,075 people.52
This survival rate is assumed to make use of Geo services.
Therefore, taking a conservative approach, and based on the
estimated impact of Geo on response times and the impact of response times on survival rates, the use of Geo services in England may save around 152 lives each year.
There is a large body of literature on, and several approaches to, quantifying the economic value of life. One commonly adopted approach is based on lifetime earnings; in the UK the current estimate
for value of life is £1,585,510 or $2,420,626 PPP.53
This would imply that the economic benefit from
this mechanism for the UK is $437m.
47
It is possible that individuals may choose to travel farther or undertake additional journeys in response to the reduction in
journey time associated with Geo services. 48
TomTom (2008), ‘Independent research proves the positive influence of satellite navigation devices on driving and traffic
safety’, June. The countries surveyed are Germany, UK, France, USA, Spain, and Italy. 49
Cardiac Science: AED Usage: Statistics. Available at: www.cardiacscience.com/assets/012/6382.pdf. 50
Ibid. 51
For example, O'Keeffe et al. (2010) show an estimate of 5.5%. O'Keeffe, C., Nicholl, J., Turner, J. and Goodacre, S. (2010),
‘Role of ambulance response times in the survival of patients with out-of-hospital cardiac arrest’, June, Emergency Medical Journal, available at http://emj.bmj.com/content/early/2010/08/25/emj.2009.086363.abstract; whereas Pell et al. (2001) provide an estimate of 24%. Pell, J., Sirel, J., Marsden, A., Ford, I. and Cobbe, S. (2001), ‘Effect of reducing ambulance response times on deaths from out of hospital cardiac arrest: cohort study‘, British Medical Journal, 322, March, available at: http://www.bmj.com/content/322/7299/1385. 52
Berdowski, J., Berg, R., Tijssen, J. and Koster, R. (2010), ‘Global incidences of out-of-hospital cardiac arrest and survival
rates: systematic review of 67 prospective studies’, Resuscitation, 81:11, pp. 1479–87, Epub 2010 September 9th, available at http://www.ncbi.nlm.nih.gov/pubmed/20828914 53
UK Department of Transport (2011), ‘Transport Analysis Guidance’, available at
http://www.dft.gov.uk/webtag/documents/expert/pdf/unit3.4.1.pdf.

Oxera What is the economic impact of Geo services? 21
Many factors relating to this calculation will vary across countries, including the availability and competency of the emergency services and the incidence of cardiac arrests. However, if the UK estimate is scaled up in proportion with the previous time-saving estimate, the global impact could be between $9 billion and $13 billion.
5.3 Educational benefit
Geo services can provide educational value beyond their conventional use in navigation. Geographic information systems (GIS) are any system that involves storing, analysing and displaying geo-spatial data. They are generally considered to be a useful information technology tool for promoting higher-order thinking, decision-making and problem-solving skills.54 These types of skill are essential for use in the high-value jobs associated with Geo services, which require sufficient training and expertise to utilise the, typically sophisticated, Geo services tools efficiently. In addition, using Geo services can provide individuals with better access to information about the location of countries, cities and places of interest, leading to a more informed population. While many of these benefits can arise in the economy more widely, the following discussion focuses on classrooms, degree courses, and GIS-related jobs, since this is the most straightforward way to consider and quantify the impact of GIS.
5.3.1 GIS use in secondary education GIS has been integrated into school curricula across countries and in diverse disciplines, such as geography, science and mathematics. Many studies demonstrate that GIS is a useful educational tool that can lead to improvements in students’ attitudes towards technology, academic achievement and motivation. In turn, these benefits may contribute to enhanced career prospects, higher productivity and larger consumer surplus for individuals.
The potential benefits of GIS have been acknowledged by a number of national authorities which have recommended a greater focus on GIS in classrooms. For example, in 2005, the Turkish Ministry of National Education set an objective for at least 20 GIS-based course activities at all levels of secondary education.55 Similarly, from 2003 to 2006, the European Commission funded a project focused on incorporating GIS technology into geography and environmental education in European secondary schools.56
Some of the most frequently cited educational benefits of GIS include:
– improvement in students’ spatial thinking, mapping and science process skills, which allows them to analyse spatial data and make inferences from it more effectively;57
– that it supports data collection and extends student research by making additional maps and information readily available;
– its positive effects on students’ computer and technological skills, and on attitudes towards technology more generally;58
– improvement in geographic content knowledge;59
54
Yap, L.Y. (2008), ‘An Assessment of the Use of Geographical Information Systems (GIS) in Teaching Geography in
Singapore Schools’, Journal of Geography, 107:2, pp. 52–60. 55
Incekara, S. (2010), ‘The place of geographic information systems (GIS) in the new geography curriculum of Turkey and
relevant textbooks: Is GIS contributing to the geography education in secondary schools?’, Scientific Research and Essays, 5:6, March 18th, pp. 551–59. 56
The Geographical Information Systems Applications for Schools was included in schools in Belgium, Finland, France,
Greece, Hungary, Italy, Latvia and Sweden. See Johansson, T. and Pellikka, P. (2006), ‘GISAS – Geographical Information Systems Applications for Schools’, 9th AGILE Conference on Geographic Information Science. 57
Incekara (2010), op. cit. 58
Demirci, A. (2008), ‘Evaluating the Implementation and Effectiveness of GIS-Based Application in Secondary School
Geography Lessons’, American Journal of Applied Sciences, 5:3, pp. 169–78. 59
Shin, E. (2006), ‘Using Geographic Information System (GIS) to Improve Fourth Graders’ Geographic Content Knowledge
and Map Skills’, Journal of Geography, 105:3, pp. 106–20.

Oxera What is the economic impact of Geo services? 22
– that it helps inform decision-making about real-world problems, for example by applying this technology to the environment, agriculture, land-use management, and infrastructure development.
There may also be some negative effects of implementing GIS-based education in classrooms. Cognitive skills, such as orienteering and map reading, may suffer. However, as the importance of these skills has declined in recent years, there is still likely to be a net benefit from gaining the capabilities and skills associated with GIS-based education. Those skills that are in decline can instead be replaced by new skills, such as software programming, which can be used to create and use Geo services.
There is a great deal of literature describing the benefits of GIS-based learning, but only a few studies provide quantitative estimates. One such study suggests that the use of GIS mapping compared with traditional paper-based mapping explained 2% of the variance in student performance on exams.60 In a similar study, students’ test scores were reported to increase by 38% as a result of using GIS technology, with a particular improvement in map skill-oriented questions.61
These gains in academic performance may translate into improved career and salary prospects. There is a large body of literature which has established a relationship between academic achievement and earnings, although the precise cause and size of the rate of return to education is often debated.62 For example, individuals with higher grades may be more likely to pass pre-employment screenings for interviews, or gain access to better education opportunities, potentially leading to more highly paid jobs.63 Regardless of the precise relationship, better academic achievement as a result of the use of GIS-technologies in classrooms may have long-term effects on an individual’s income, allowing them to unlock more consumer surplus benefits, in addition to broader effects on economy-wide productivity.
Despite the potential for the use of GIS in classrooms, practical difficulties in implementation—including technological barriers, lack of training for teachers and absence of support material—have prevented more widespread use of this technology and have led to differing rates of adoption across countries.64 In 2003, fewer than 5% of US secondary schools owned GIS software, and more than half of the schools that did own the software did not use it.65 In contrast, in the same year, more than 40% of schools in Singapore reported having GIS software. This is likely, in large part, to be the result of the subsidies provided to schools in 2002 by the Ministry of Education to purchase GIS software.66 While there are few more recent estimates, the use of GIS in classrooms may be higher today, evidenced by the growing number of university courses in GIS and the growth in sales of this technology more generally.
The educational benefits of using Geo services in classrooms can be quantified using the calculation set out in Box 5.3. Given the lack of data required for a robust estimate, an illustrative calculation is provided, which gives an indication of the magnitude of the effect.
60
These results are based on a small sample, from a quasi-experiment conducted in a school in Kansas. Baker, T. and White,
S. (2003), ‘The Effects of G.I.S. on Students’ Attitudes, Self-efficacy, and Achievement in Middle School Science Classrooms’, Journal of Geography, 102 6, pp. 243–54. 61
Demirci (2008), op. cit. 62
See, for example, Jones, E. and Jackson, J. (1990), ‘College Grades and Labour Market Rewards’, The Journal of Human
Resources’, 25:2, pp. 253–66. 63
This may in part be a result of the signals associated with high academic achievement, such as motivation. See, for example,
Roth, P. and Clarke, R. (1998), ‘Meta-analyzing the Relation between Grades and Salary’, Journal of Vocational Behaviour, 53, pp. 386–400. 64
Demirci, A. and Karaburun, A. (2009), ‘How to make GIS a Common Education Tool in Schools: Potentials and Implications
of the GIS for Teachers Book for Geography Education in Turkey’, Ozean Journal of Applied Sciences, 2:2, pp. 205–15. 65
Kerski, J. (2003), ‘The Implementation and Effectiveness of Geographic Information Systems Technology and Methods in
Secondary Education’, Journal of Geography, 102, pp. 128–37. 66
Yap (2008), op. cit.

Oxera What is the economic impact of Geo services? 23
Box 5.3 Illustrative calculation of educational value of Geo services
The educational value of Geo services could be determined by carrying out the following calculation:
Number of students with access to GIS-based technologies × improvement in exam results × effect of better exam results on qualifications and earnings
There are various estimates of the percentage of classrooms which use or have access to GIS software, although there are few recent estimates. A study from New Zealand in 2002 estimated that as many as 8% of secondary school classrooms may use or have access to GIS software, which is a
midpoint of available estimates.67
Applying this figure to the number of secondary school pupils in
each country leads to an estimate that more than 41m students may have access to this
technology.68
In practice, the numbers affected will grow as each new intake of students moves up
through the educational system.
To quantify the impact of access to this technology, an estimate of the effect of using GIS on test scores is combined with an estimate of the effect of improvement in student performance on career prospects/salary.
As part of their study conducted in US science classrooms, Baker and White (2007) identified a 3% increase in student performance as a result of using GIS versus traditional paper mapping (an
improvement from 13.2 to 13.6 Grade Point Average, or GPA).69
This estimate is more conservative than other studies that have sought to identify this effect. This estimated benefit is applied to all students with access to GIS technology in order to determine the total effect on test scores.
In turn, these gains in student performance may lead to enhanced career prospects and, accordingly, higher salaries, as well as improved productivity and consumer surplus. One study has indicated that
a one point rise in GPA leads to an 8.9% increase in annual earnings.70
Using this estimate implies
that a 3% increase in test scores may lead to an increase of around 2.67% in wages for each of these students approximately five years after graduation. Applying this percentage increase to average annual wages (in PPP) for each country suggests that there may be a $12.1 billion benefit of using GIS in classrooms.
It is important to note that this calculation considers future benefits to the current generation of secondary school pupils. The currently realised benefit may be smaller if the working generation had less access to Geo services when they were in secondary school. In addition, this calculation estimates the effect on annual wages five years after graduation. The lifetime effect on wages will differ if the effect of better test scores on wages is different to 2.67% within or after the five-year period after graduation.
5.3.2 GIS use in higher education In addition to integrating GIS into school curricula, a number of universities and colleges offer degree courses in GIS. These courses typically teach skills which can be used in GIS-related occupations such as applied geography, cartography, data analysis, remote sensing and spatial analysis. As set out in Table 5.2 below, there are more than 200 graduate GIS degree programmes available internationally, with more than half of these in the USA. There are also 76 US colleges that offer bachelor’s degrees in GIS-related subjects.71
67
Olsen, A. (2002), ‘Using GIS Software in School Teaching Programmes: an Initial Survey’, New Zealand
Journal of Geography, April. 68
2010/11 data was used from the WDI where available. Where this data was not available, the most recent data was used. In
all cases, this is after 2007. 160 countries were included in the calculation. 69
Baker, T. and White, S. (2007), ‘The Effects of G.I.S. on Students’ Attitudes, Self-efficacy, and Achievement in Middle School
Science Classrooms’, Journal of Geography, 102:6, pp. 243–54. 70
Jones, E. and Jackson, J. (1990), ‘College Grades and Labor Market Rewards’, The Journal of Human Resources, 25:2, pp.
253–66. 71
Data collected in July 2012 from the National Center for Education Statistics of Institute of Education Sciences’ College
navigator, available at http://nces.ed.gov/collegenavigator/.

Oxera What is the economic impact of Geo services? 24
Table 5.2 Graduate degrees in GIS
Certificate Masters Doctorate Total
Australia 2 3 1 6
Canada 8 7 4 19
Cyprus – – 1 1
Germany – 7 – 7
Ireland – 1 – 1
Japan – 1 1 2
Korea – 2 2 4
Malaysia – 1 – 1
Netherlands 1 6 – 7
New Zealand 1 2 1 4
Sweden – 1 – 1
Thailand – 1 – 1
Trinidad & Tobago 1 1 – 2
USA 40 64 21 125
UK 8 17 1 26
Zimbabwe – 1 – 1
Total 61 115 32 208
Note: This includes campus, hybrid, and online accredited graduate degree programmes in GIS-related subjects at the certificate, doctorate and masters levels from all types of institutions. Source: www.GradSchools.com.
These higher education programmes help to provide the supply of skilled labour that is needed to meet the requirements of GIS-related jobs. These jobs often require specialised skills that are not easily transferable from other disciplines, and that are typically obtained from higher education in a relevant degree, certification and proficient computer skills.
As demonstrated in Table 5.3 below, in the USA these jobs tend to have higher median pay than the median pay for all occupations, possibly due to their high skill requirement. This indicates that, on average, these jobs add greater value to the economy than the median job. One exception is survey and mapping technicians; while their median pay per hour is higher than that for all occupations, their median pay per annum is lower. This could be explained by the employment being more part-time than full-time.

Oxera What is the economic impact of Geo services? 25
Table 5.3 GIS-related jobs in the USA: median pay 2010
All
occupations Cartographers/
photogrammetrists Surveying/mapping
technicians Geographers
Median pay per annum ($) 44,410 54,510 37,900 72,800
Median pay per hour ($) 16.27 26.21 18.22 35.00
Number of jobs – 13,800 56,900 1,600
Job outlook (%), 2010–20 14.3 22 16 35
Note: The Bureau of Labor Statistics classifies GIS analysts into different occupations. GIS analysts who specialise in mapmaking are classified as cartographers; those who focus on solving problems with geography are classified as geographers. Photogrammetrists collect, analyse and interpret information provided by aerial photographs, geodetic surveys and satellite images, concentrating on areas that are difficult to survey by other methods. Survey technicians operate survey instruments (eg, electronic distance-measuring equipment) and visit sites to take measurements. Mapping technicians use information from databases to calculate mapmaking information, updating maps to ensure accuracy. ‘Job outlook’ refers to the projected increase in employment over the ten-year timeframe between 2010 and 2020. Source: Bureau of Labor Statistics, U.S. Department of Labor (2012), ‘Occupational Outlook Handbook, 2012-13 Edition’, April.
There is also a positive job outlook for GIS-related jobs in the USA over the next decade, which may be mirrored in other countries owing to the growth in this technology.72 Employment of cartographers/photogrammetrists, survey/mapping technicians, and geographers is predicted to grow faster than the average job growth in the USA, at 22%, 16% and 35% respectively between 2010 and 2020.73 This may lead to benefits in terms of increased earnings for individuals and increased productivity for society as a whole.
This indicates that the demand for GIS-skilled labour is set to grow. In order to meet this growing demand, the supply of skilled labour will need to increase, which will in turn depend on the availability of appropriate courses, training and educational resources.
5.4 Reduced search costs
By using Geo services consumers are able to locate businesses more effectively than they otherwise would. Consumers derive benefits from reduced search costs in two main ways:
– they are likely to find what they are looking for in less time—the value of search using Geo services therefore corresponds with the value of time saved by using Geo service instead of an alternative method;
– by having access to Geo services, consumers may identify services that are not easy to find. For example, mobile phones with maps apps often provide consumers with options of different services located nearby, some of which could be found easily, while others are not so visibly located. Thus, consumers derive benefits from finding niche offerings they would otherwise not find—in this respect, Geo services complement search engine services, the economic impact of which has been studied elsewhere.74
The economic surplus derived from reduced search costs accrues to consumers through the mechanisms explained above. The overall economic benefit is, however, smaller than the increased consumer surplus. This is because the reduced search costs mean that more retailers can compete for the same consumers—not only the high-profile ‘high-street’ retailers or shops (or any other services), for example. Increased competition would be expected to result in lower prices, and consequently part of the consumer benefits represents
72
Bureau of Labor Statistics, U.S. Department of Labor (2012), ‘Occupational Outlook Handbook, 2012–13 Edition’, April. 73
Ibid. 74 McKinsey & Company (2011), ‘The impact of Internet technologies: Search’, July.
Oxera What is the economic impact of Geo services? 26
a transfer of surplus from producers to consumers. That said, the amount of consumption is not fixed and LBS can provide a basis for completely new offerings, thereby increasing the net output in the market.
Therefore, the benefits of reduced search costs are captured by the ‘competition’ effects described in section 6.3 below (the Salop model), and quantifying a separate estimate would lead to double-counting of benefits.
5.5 Increased consumer choice
In part through the reduction in search costs, Geo services help promote individuals’ awareness of the options available. While section 5.4 considered the wider economic benefits of this increase in choice, such as more competition between firms, this section focuses on the benefits to consumers in terms of increases in consumer surplus.
Individuals’ decision-making proceeds through various stages: identification of the options, drawing up a shortlist based on the pros and cons of each, and making final choice. Geo services provide a channel for consumers to collect and compare information from a variety of online sources at once, offering a broader and more information-rich set of choices in less time than would otherwise be possible.75 These benefits are in terms of gaining information before making a purchase, both about different providers of the same product/service (eg, hotels in a particular area) and about the range of products/services that are available (eg, finding out that there is a local tennis club).76
Economic theory suggests that more choice must be better because it provides additional, potentially preferable, alternatives, while at a minimum allowing individuals to retain their original choice.77 A greater variety of options will therefore provide consumers with more flexibility by imposing fewer constraints on decision-making, and will improve the match between consumers’ preferences/needs and the alternatives available. It could also allow consumers to re-optimise their time and budget constraints—for example, by trading off price against other costs, quality and convenience—by selecting products that they prefer to their initial choice.
There are further mechanisms through which Geo services benefit consumers, some of which may overlap with those described here, but this section has given an indication that the benefits for consumers are substantial and that, when taken together, they are possibly larger than the direct effect.
75
Wan, Y., Menon, S. and Ramaprasad, A. (2003), ‘How it Happens: A Conceptual Explanation of Choice Overload in Online
Decision-Making by Individuals’, Ninth Americas Conference on Information Systems. 76
UK Department for Business, Information and Skills and Cabinet Office Behavioural Insights Team (2012), ‘Better Choices:
Better Deals—Consumers Powering Growth’. 77
Varian, H. (2006), Intermediate Microeconomics: A Modern Approach, Seventh Edition, John Wiley & Sons.

Oxera What is the economic impact of Geo services? 27
6 Wider economic effects
Key messages Wider economic (or supply-side) effects of Geo services are those that help to change the overall productivity and potential output of the economy. In the short term, the output of an economy can depend on changes on the demand side—ie, the level of goods and services demanded by consumers and businesses. In the long term, however, the output of an economy—using standard measures of output, such as GVA, or the prosperity of the population living in an economy (eg, measured using GVA per head)—is determined by the productive potential or supply side of the economy.
Because Geo services help businesses to function, they also help to drive efficiency gains throughout the economy. These can be observed in industries such as logistics, where GPS has been estimated to generate $10 billion in cost savings.78
Geo services also affect the wider economy by helping to promote competition. This is not normally seen as a goal in itself; rather, it is considered to help generate efficiency and cost savings. By reducing transport costs and increasing information, Geo services can broaden product and geographic markets. This helps to promote competition, which ultimately drives prices down towards costs.
Wider economic (or supply-side) effects of Geo services are those that help to change the overall productivity and potential output of the economy They help to bring about changes in the overall productivity of the economy. In assessing these wider effects, the focus is on gross effects.
6.1 Why are wider economic effects important?
In the short term, the output of an economy can depend on changes on the demand side—that is, the level of goods and services demanded by consumers and businesses. The demand side of an economy can be influenced in the short term by various measures, such as monetary policy and the fiscal measures implemented to stimulate economic activity.
However, in the long term, the output of an economy, using standard measures of output such as GVA, or the prosperity of the population living in an economy (eg, measured using GVA per head), is determined by the productive potential or supply side of the economy.
The supply side depends on the size of the workforce and the productivity with which labour is used in the production of output (growth in the size of the workforce increases the level of employment, and growth in productivity delivers growth in average incomes).
Sources of productivity growth can be divided into:
– intra-sectoral productivity improvements, perhaps due to investment in physical and human capital (eg, in technology and education);
– improvements in average productivity, brought about by changing inter-sectoral resource allocation; or
– the emergence of new technologies or sectors in the economy with higher-than-average productivity that displaces lower-productivity activities.
78
ndp consulting (2011), ‘The Economic Benefits of Commercial GPS Use in the U.S. and The Costs of Potential Disruption’,
June, available at: http://www.saveourgps.org/pdf/GPS-Report-June-22-2011.pdf.

Oxera What is the economic impact of Geo services? 28
As discussed in this study, Geo services can result in supply-side changes as the structure of the economy adjusts to the presence of the sector, or to changes in its size.
6.2 How do wider economic effects arise?
There are two main ways through which wider economic effects can arise.
– Businesses acting like consumers—these effects occur where businesses use Geo services themselves (eg, a secretary using an online map to obtain directions to a business meeting). In this case, businesses may be able to realise productivity gains by reducing costs that they would otherwise have incurred—eg, a secretary may save time on administration and use this time on other activities.
– Businesses changing behaviour in response to consumer changes—in this case businesses may become aware that consumers have adapted their behaviour and hence adapt their own behaviour in response.
Businesses may gain some of the benefits of these mechanisms through higher profits. However, they are unlikely to retain all of the benefits since some, or all, of these cost savings would be expected to be passed through to consumers. The expected level of pass-through depends primarily on the competitiveness of the market in question.79
6.3 Improving market outcomes
Encouraging competition among firms can create a number of benefits for the economy. In itself, competition is not normally a benefit in itself, but rather it contributes to lower prices, greater efficiency, increased consumer choice and innovative new services. By facilitating competition between firms, prices can be driven down towards costs.
In many markets firms differentiate their offerings from those of their competitors another along several dimensions. Differentiation reduces head-to-head competition among firms in the market, which allows them to increase their prices. One dimension along which firms can be differentiated is their location, which is an important determinant of consumer decision-making in local markets. The transportation time savings that arise for consumers using Geo services can have the additional benefit of facilitating competition in such markets.
Clearly, consumers are unlikely to use their GPS device to buy their daily newspaper or visit their usual supermarket; these benefits are more likely to arise with infrequent, one-off purchases. For example, consumers may wish to travel to unfamiliar locations to look for a second-hand car or to buy a piece of furniture.
Geo services can reduce transport costs by offering efficient navigation (or by suggesting a shop closer to the consumer). That is, consumers can reach the same shop in less time or can travel further. This intensifies competition within the same geographic area, but can also widen the area to include more firms. In a world where transport costs are lower but all other parameters of competition are the same, companies would attempt to poach consumers closer to their rivals or attract consumers who are further away. This more intense competition ultimately results in lower prices for consumers.
The economics literature includes many articles examining the effects of transport costs on competition in specific markets that set out frameworks to illustrate this effect. These can be used to give an indication of the magnitude of the likely effect. One such economic model, developed by Salop, is straightforward but takes into account the mechanism explained
79
For a discussion of expected pass-on rates, see Kate, A. ten and Niels, G (2005), ‘To What Extent are Cost Savings Passed
on to Consumers? An Oligopoly Approach’, European Journal of Law and Economics, 20:3.

Oxera What is the economic impact of Geo services? 29
above.80 This model examines a market in which firms sell homogeneous products to homogeneous consumers who buy exactly one unit of good and incur different transport costs depending on their location. The only dimension of competition is price (that is, firms do not vary in location, quality or any other aspect).
The firms’ prices are determined by the following formula, which can be calibrated with real-world data to estimate the magnitude of downward price pressure and the change in consumer surplus from more intense competition:
price = (marginal cost) + (transport cost)/(number of firms)
where marginal cost is the cost of producing one additional input.
Box 6.1 provides an estimate of the competition benefit.
Box 6.1 Illustrative effects: economy-wide benefits
With some additional assumptions, the Salop model can be calibrated on an economy-wide level for a generic good to illustrate the extent of the benefit of improved competition. The sum of total intermediate purchases and total labour costs in the economy can be used to approximate marginal cost. As an estimate of transport cost, the total value of time spent travelling in a year can be used (see section 5.2.3). The time savings from using Geo services can be thought of as a change in this transport cost. Therefore, comparing the prices with and without Geo services can indicate the magnitude of the average price effect in the economy.
To calculate the magnitude of the economy-wide total benefits arising from having more intense local competition, the relevant share of total spending (final and intermediate) can be multiplied by the price change. As the amount of total spending was not available, gross output (the sum of GDP and intermediate purchases) was used as a proxy. The relevant share was approximated using the weights of the retail price index (RPI) shopping basket that can be associated with infrequent purchases (see note to table below). Three different assumptions are made on the number of firms present in the average local market: 4, 10 and 15 firms.
The calculations indicate that the downward pricing pressure is in the region of 0.002%. For countries where data is available (ie, those representing the majority of the world’s consumption—see note to table below), the total yearly consumer benefit is in the region of $0.3–$1 billion, and globally the impact could be in the range of $0.5–$2 billion.
Local markets
with 4 firms Local markets with 10 firms
Local markets with 15 firms
Price decrease due to Geo (%) 0.0079 0.0032 0.0021
Consumer benefit for selected countries (PPP $m) 1,060 426 284
Global consumer benefit (PPP $m) 1,754 702 470
Note: Countries for which data was available are Australia, Austria, Belgium, Cyprus, Czech Republic, Denmark, Spain, Estonia, Finland, France, Germany, Greece, Hungary, Ireland, Italy, Japan, South Korea, Latvia, Lithuania, Luxembourg, Malta, Netherlands, Poland, Slovak Republic, Slovenia, Sweden, UK and the USA. Calculations based on 2007 data available from the EU KLEMS database. Infrequent purchases include household goods (eg, furniture, electrical appliances), clothing and footwear, and motoring expenditure (eg, second-hand cars or spare parts), representing 23.8% of the RPI shopping basket in 2012, according to the UK Office of National Statistics. Source: http://www.euklems.net/; Office of National Statistics; and Oxera.
80
Salop, S. (1979).’Monopolistic competition with outside goods’. The Bell Journal of Economics 10:1, pp. 141–56.

Oxera What is the economic impact of Geo services? 30
6.4 Impacts on specific industries: some examples
6.4.1 Logistics By moving goods between locations, the logistics and freight industry helps the rest of the economy to function. It is therefore an obvious candidate that can benefit from Geo services. Geo products enable logistics firms to optimise their fleet deployment owing to the real-time information they can obtain on fleet location. This can lead to lower labour, fuel and capital costs for these firms.
One study has assessed the benefits arising using Geo services in the USA’s commercial surface transportation sector. Assuming 67.9% penetration of GPS devices, and average savings of labour, fuel and capital investment of around 11–13%, the study estimated the saving to be $10.3 billion per year.81
6.4.2 Agriculture Agriculture is a sector that has seen large changes in its productivity over the years as technology innovations have been put to use to maximise the output potential of land. The introduction of Geo services has provided further potential to make use of large areas of land.
One aspect of agriculture that Geo services could affect is irrigation. Irrigation is critical to the success of both arable and pastoral farming. Different areas of a particular farm may require different amounts of water based on different conditions across relatively small areas. Specialised technology systems can use Geo services to conduct variable-rate irrigation, requiring a high-resolution topographical map of the farm land. This can then be used in conjunction with a positioning signal to monitor the position of each sprinkler head and adjust it in real time to direct the optimal amount of water to the crops as required.
This technology can create substantive cost savings, through reduced water usage and enhanced crop yields. Some estimates have suggested that these systems could save between $40 and $110 per hectare.82
Currently, on average 14.6% of arable land is irrigated,83 and there are approximately 1,381m hectares of arable land worldwide.84 Thus, if this system were implemented globally, the magnitude of the benefits could be in the region of $8–$22 billion.
81
ndp consulting (2011), op. cit. 82
The Economist Technology Quarterly (2012), ‘Dribbles and bits’, June 2nd. 83
Based on the weighted average of the 69 countries where data was available for at least one year during the period 2006–09
in the WDI database. 84
WDI database, 2009.

Oxera What is the economic impact of Geo services? 31
7 Summary
Figure 7.1 summarises some of the wider economic and consumer impacts that Geo services can create. This is by no means an exhaustive list of the possible effects, and there will be various interactions between each effect. Nevertheless, the analysis indicates the magnitude of the value created that is not captured in market/financial transactions.
Figure 7.1 Estimates of various consumer effects
Source: Oxera.
This report has presented an estimate of the current impact of Geo services. However, the industry is growing rapidly—worldwide revenues are expected to grow at a rate of 13% per annum until 201685—and many of these estimates could therefore quickly become underestimates as Geo services are used more.
Overall, this report demonstrates that Geo services generate revenues and value added that are comparable to those in a range of other significant sectors. In addition, Geo services create significant efficiency gains for other business, which help to facilitate economic activity. They also enhance consumer welfare through a range of everyday and exceptional uses.
85
European GNSS Agency (2012), ‘GNSS Market Report issue 2’, May.
0
2
4
6
8
10
12
14
16
18
20
Time savings Fuel savings Emergency response
Education Competition
We
lfare
eff
ect (
$ b
illio
n)
Mechanisms of Geo’s impact
Upper estimate
Lower estimate

www.oxera.com
Park Central 40/41 Park End Street
Oxford OX1 1JD United Kingdom
Tel: +44 (0) 1865 253 000 Fax: +44 (0) 1865 251 172
Stephanie Square Centre Avenue Louise 65, Box 11
1050 Brussels Belgium
Tel: +32 (0) 2 535 7878 Fax: +32 (0) 2 535 7770
200 Aldersgate 14th Floor
London EC1A 4HD United Kingdom
Tel: +44 (0) 20 7776 6600 Fax: +44 (0) 20 7776 6601