Embed Size (px)
Citation preview
What we are looking at
Capital Markets - StructuringDesk Rates InflationCristiana Corno +39 02 72612754
Trading the Italian electoral cycle
All data are derived from Bloomberg database and elaborated by Banca IMI
Published and data as of: 1 February, 2013
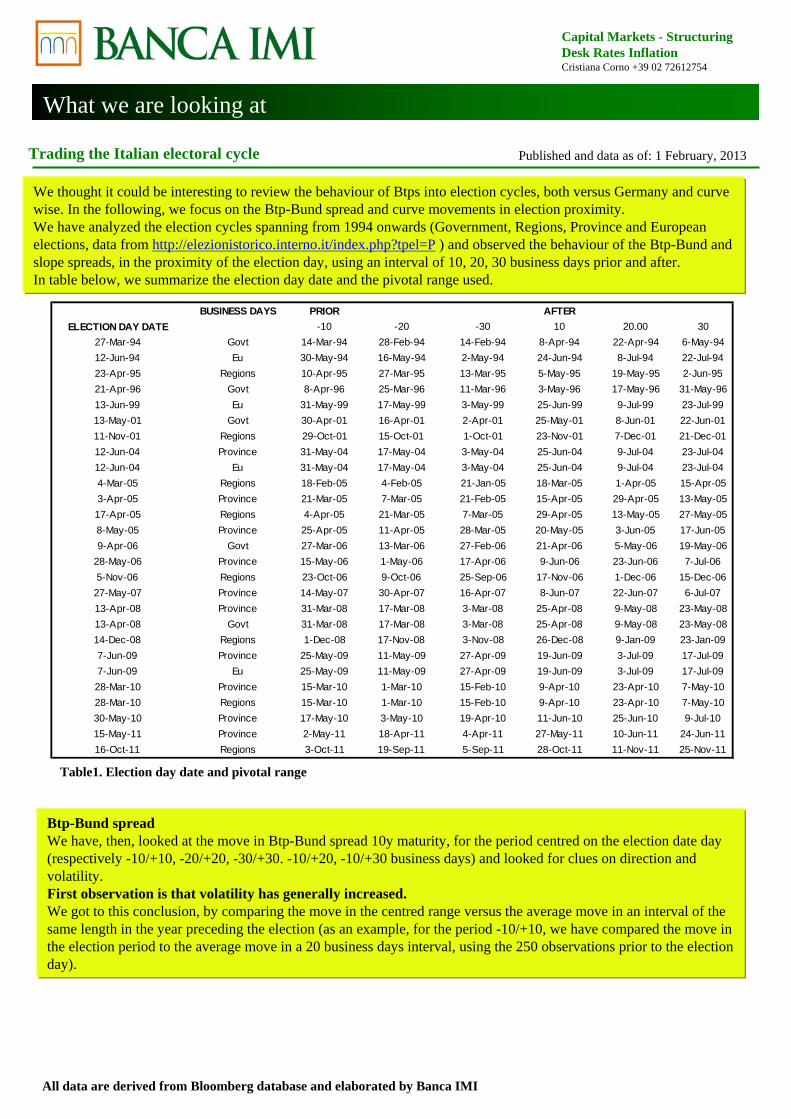
We thought it could be interesting to review the behaviour of Btps into election cycles, both versus Germany and curve wise. In the following, we focus on the Btp-Bund spread and curve movements in election proximity. We have analyzed the election cycles spanning from 1994 onwards (Government, Regions, Province and European elections, data from http://elezionistorico.interno.it/index.php?tpel=P ) and observed the behaviour of the Btp-Bund and slope spreads, in the proximity of the election day, using an interval of 10, 20, 30 business days prior and after.In table below, we summarize the election day date and the pivotal range used.
Btp-Bund spreadWe have, then, looked at the move in Btp-Bund spread 10y maturity, for the period centred on the election date day (respectively -10/+10, -20/+20, -30/+30. -10/+20, -10/+30 business days) and looked for clues on direction and volatility.First observation is that volatility has generally increased. We got to this conclusion, by comparing the move in the centred range versus the average move in an interval of the same length in the year preceding the election (as an example, for the period -10/+10, we have compared the move in the election period to the average move in a 20 business days interval, using the 250 observations prior to the election day).
BUSINESS DAYS PRIOR AFTERELECTION DAY DATE -10 -20 -30 10 20.00 30
27-Mar-94 Govt 14-Mar-94 28-Feb-94 14-Feb-94 8-Apr-94 22-Apr-94 6-May-9412-Jun-94 Eu 30-May-94 16-May-94 2-May-94 24-Jun-94 8-Jul-94 22-Jul-9423-Apr-95 Regions 10-Apr-95 27-Mar-95 13-Mar-95 5-May-95 19-May-95 2-Jun-9521-Apr-96 Govt 8-Apr-96 25-Mar-96 11-Mar-96 3-May-96 17-May-96 31-May-9613-Jun-99 Eu 31-May-99 17-May-99 3-May-99 25-Jun-99 9-Jul-99 23-Jul-9913-May-01 Govt 30-Apr-01 16-Apr-01 2-Apr-01 25-May-01 8-Jun-01 22-Jun-0111-Nov-01 Regions 29-Oct-01 15-Oct-01 1-Oct-01 23-Nov-01 7-Dec-01 21-Dec-0112-Jun-04 Province 31-May-04 17-May-04 3-May-04 25-Jun-04 9-Jul-04 23-Jul-0412-Jun-04 Eu 31-May-04 17-May-04 3-May-04 25-Jun-04 9-Jul-04 23-Jul-044-Mar-05 Regions 18-Feb-05 4-Feb-05 21-Jan-05 18-Mar-05 1-Apr-05 15-Apr-053-Apr-05 Province 21-Mar-05 7-Mar-05 21-Feb-05 15-Apr-05 29-Apr-05 13-May-0517-Apr-05 Regions 4-Apr-05 21-Mar-05 7-Mar-05 29-Apr-05 13-May-05 27-May-058-May-05 Province 25-Apr-05 11-Apr-05 28-Mar-05 20-May-05 3-Jun-05 17-Jun-059-Apr-06 Govt 27-Mar-06 13-Mar-06 27-Feb-06 21-Apr-06 5-May-06 19-May-06
28-May-06 Province 15-May-06 1-May-06 17-Apr-06 9-Jun-06 23-Jun-06 7-Jul-065-Nov-06 Regions 23-Oct-06 9-Oct-06 25-Sep-06 17-Nov-06 1-Dec-06 15-Dec-0627-May-07 Province 14-May-07 30-Apr-07 16-Apr-07 8-Jun-07 22-Jun-07 6-Jul-0713-Apr-08 Province 31-Mar-08 17-Mar-08 3-Mar-08 25-Apr-08 9-May-08 23-May-0813-Apr-08 Govt 31-Mar-08 17-Mar-08 3-Mar-08 25-Apr-08 9-May-08 23-May-0814-Dec-08 Regions 1-Dec-08 17-Nov-08 3-Nov-08 26-Dec-08 9-Jan-09 23-Jan-097-Jun-09 Province 25-May-09 11-May-09 27-Apr-09 19-Jun-09 3-Jul-09 17-Jul-097-Jun-09 Eu 25-May-09 11-May-09 27-Apr-09 19-Jun-09 3-Jul-09 17-Jul-0928-Mar-10 Province 15-Mar-10 1-Mar-10 15-Feb-10 9-Apr-10 23-Apr-10 7-May-1028-Mar-10 Regions 15-Mar-10 1-Mar-10 15-Feb-10 9-Apr-10 23-Apr-10 7-May-1030-May-10 Province 17-May-10 3-May-10 19-Apr-10 11-Jun-10 25-Jun-10 9-Jul-1015-May-11 Province 2-May-11 18-Apr-11 4-Apr-11 27-May-11 10-Jun-11 24-Jun-1116-Oct-11 Regions 3-Oct-11 19-Sep-11 5-Sep-11 28-Oct-11 11-Nov-11 25-Nov-11
Table1. Election day date and pivotal range
What we are looking at
Capital Markets - StructuringDesk Rates InflationCristiana Corno +39 02 72612754
Trading the Italian electoral cycle
All data are derived from Bloomberg database and elaborated by Banca IMI
Published and data as of: 1 February, 2013
Table2. Election intervals and Btp_bund 10y spread historical behaviour
0.00%
2.00%
4.00%
6.00%
8.00%
10.00%
12.00%
14.00%
16.00%
0.00
1.00
2.00
3.00
4.00
5.00
6.00
7.00
8.00
9.00
10.00
11.00
12.00
13.00
14.00
15.00
16.00
17.00
18.00
19.00
20.00
21.00
22.00
23.00
24.00
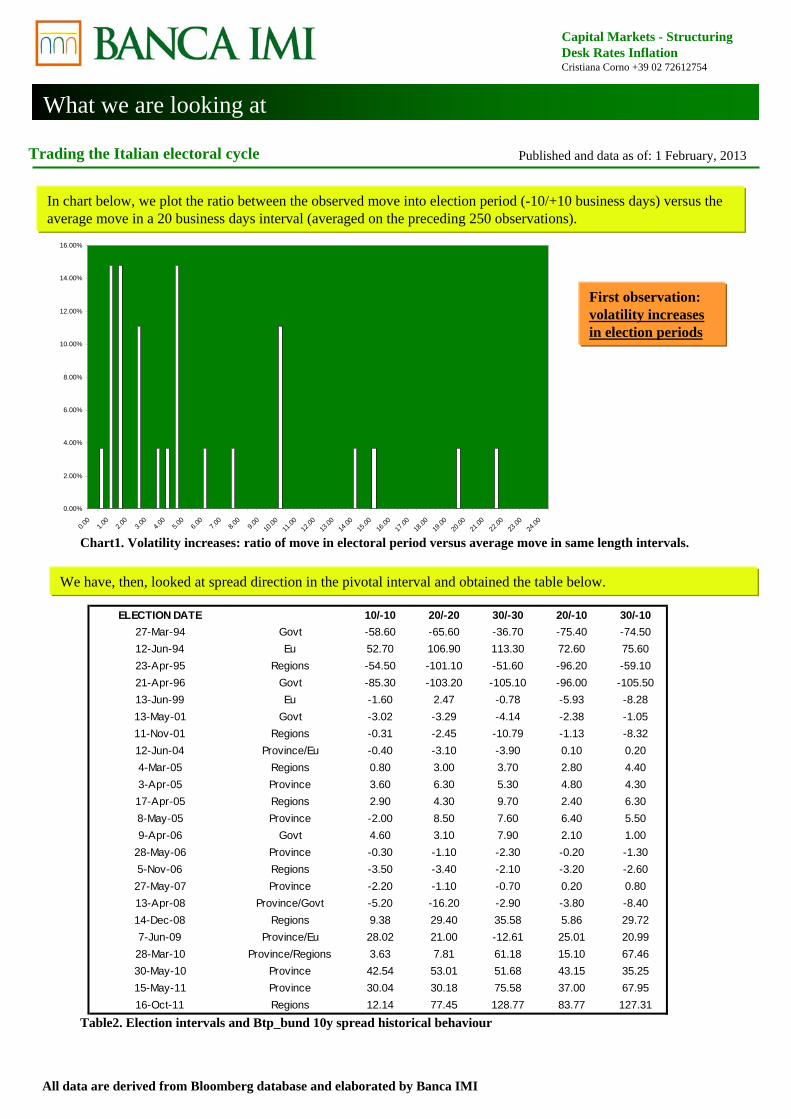
In chart below, we plot the ratio between the observed move into election period (-10/+10 business days) versus the average move in a 20 business days interval (averaged on the preceding 250 observations).
First observation: volatility increases in election periods
We have, then, looked at spread direction in the pivotal interval and obtained the table below.
ELECTION DATE 10/-10 20/-20 30/-30 20/-10 30/-1027-Mar-94 Govt -58.60 -65.60 -36.70 -75.40 -74.5012-Jun-94 Eu 52.70 106.90 113.30 72.60 75.6023-Apr-95 Regions -54.50 -101.10 -51.60 -96.20 -59.1021-Apr-96 Govt -85.30 -103.20 -105.10 -96.00 -105.5013-Jun-99 Eu -1.60 2.47 -0.78 -5.93 -8.2813-May-01 Govt -3.02 -3.29 -4.14 -2.38 -1.0511-Nov-01 Regions -0.31 -2.45 -10.79 -1.13 -8.3212-Jun-04 Province/Eu -0.40 -3.10 -3.90 0.10 0.204-Mar-05 Regions 0.80 3.00 3.70 2.80 4.403-Apr-05 Province 3.60 6.30 5.30 4.80 4.3017-Apr-05 Regions 2.90 4.30 9.70 2.40 6.308-May-05 Province -2.00 8.50 7.60 6.40 5.509-Apr-06 Govt 4.60 3.10 7.90 2.10 1.00
28-May-06 Province -0.30 -1.10 -2.30 -0.20 -1.305-Nov-06 Regions -3.50 -3.40 -2.10 -3.20 -2.6027-May-07 Province -2.20 -1.10 -0.70 0.20 0.8013-Apr-08 Province/Govt -5.20 -16.20 -2.90 -3.80 -8.4014-Dec-08 Regions 9.38 29.40 35.58 5.86 29.727-Jun-09 Province/Eu 28.02 21.00 -12.61 25.01 20.9928-Mar-10 Province/Regions 3.63 7.81 61.18 15.10 67.4630-May-10 Province 42.54 53.01 51.68 43.15 35.2515-May-11 Province 30.04 30.18 75.58 37.00 67.9516-Oct-11 Regions 12.14 77.45 128.77 83.77 127.31
Chart1. Volatility increases: ratio of move in electoral period versus average move in same length intervals.
What we are looking at
Capital Markets - StructuringDesk Rates InflationCristiana Corno +39 02 72612754
Trading the Italian electoral cycle
All data are derived from Bloomberg database and elaborated by Banca IMI
Published and data as of: 1 February, 2013
Table3. Election intervals and Btp 10s-2s spread.
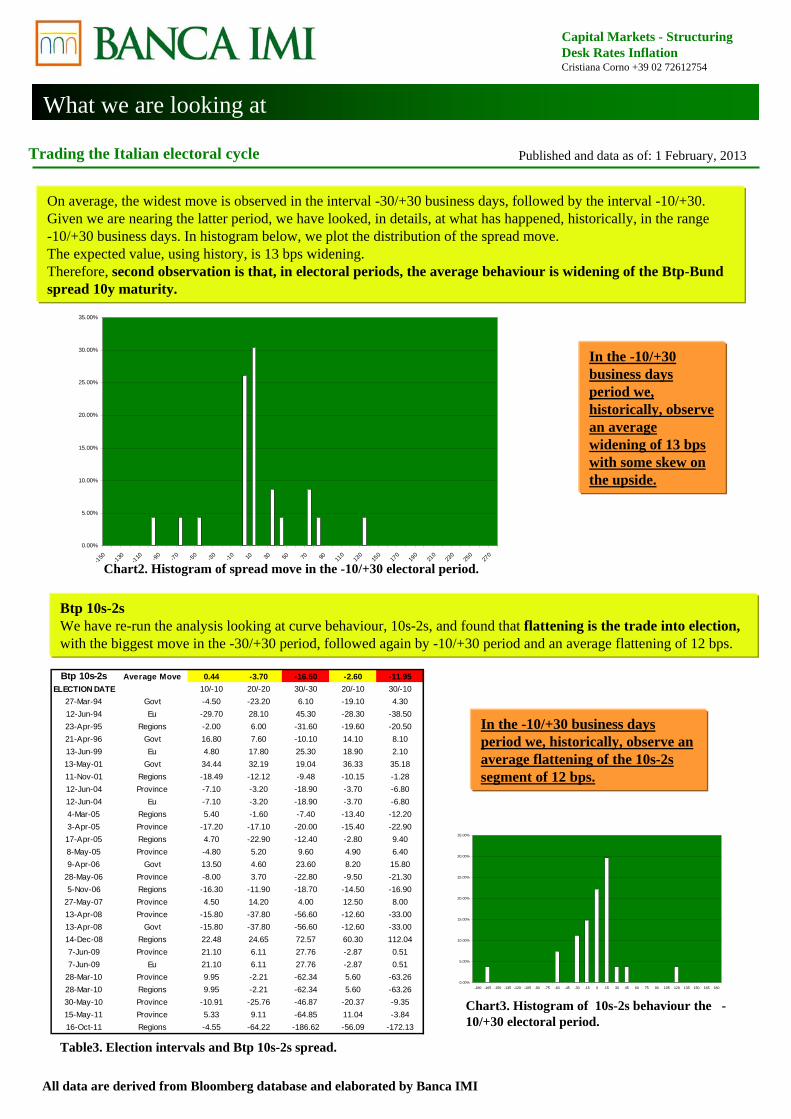
On average, the widest move is observed in the interval -30/+30 business days, followed by the interval -10/+30. Given we are nearing the latter period, we have looked, in details, at what has happened, historically, in the range -10/+30 business days. In histogram below, we plot the distribution of the spread move. The expected value, using history, is 13 bps widening. Therefore, second observation is that, in electoral periods, the average behaviour is widening of the Btp-Bund spread 10y maturity.
In the -10/+30 business days period we, historically, observe an average widening of 13 bps with some skew on the upside.
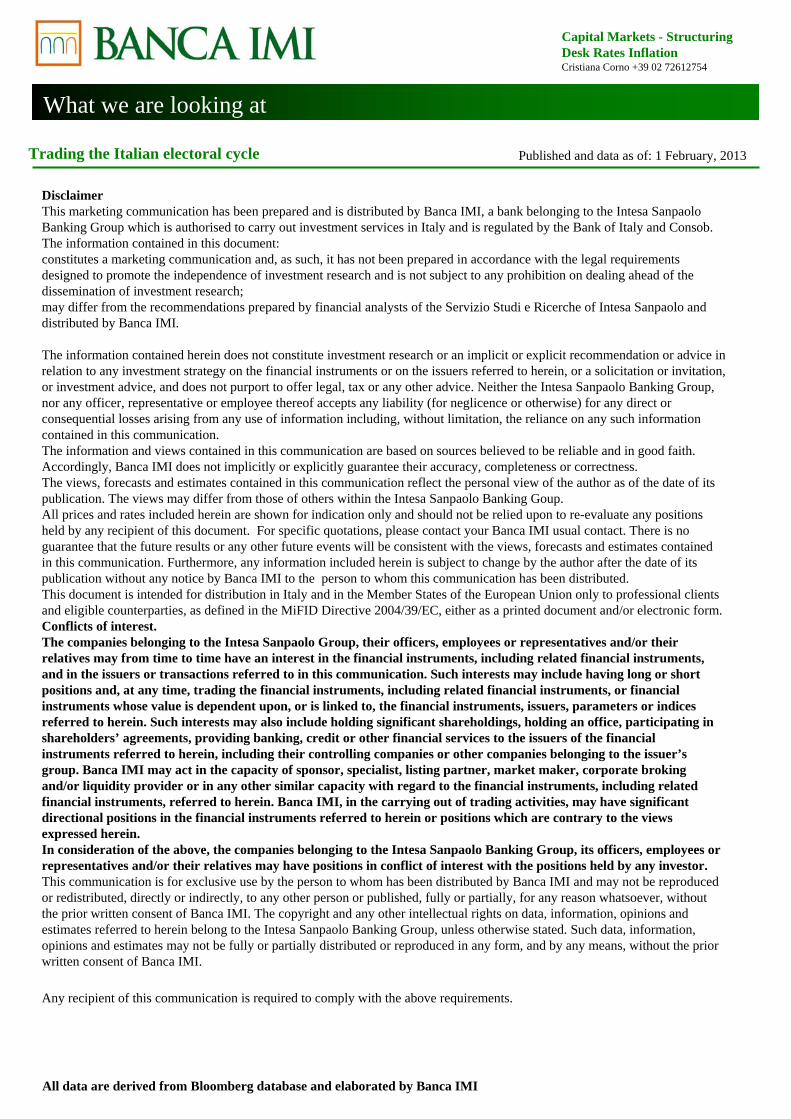
Btp 10s-2sWe have re-run the analysis looking at curve behaviour, 10s-2s, and found that flattening is the trade into election,with the biggest move in the -30/+30 period, followed again by -10/+30 period and an average flattening of 12 bps.
0.00%
5.00%
10.00%
15.00%
20.00%
25.00%
30.00%
35.00%
-150 -130 -110 -90 -70 -50 -30 -10 10 30 50 70 90 110
130
150
170
190
210
230
250
270
Chart2. Histogram of spread move in the -10/+30 electoral period.
Btp 10s-2s Average Move 0.44 -3.70 -16.50 -2.60 -11.95ELECTION DATE 10/-10 20/-20 30/-30 20/-10 30/-10
27-Mar-94 Govt -4.50 -23.20 6.10 -19.10 4.3012-Jun-94 Eu -29.70 28.10 45.30 -28.30 -38.5023-Apr-95 Regions -2.00 6.00 -31.60 -19.60 -20.5021-Apr-96 Govt 16.80 7.60 -10.10 14.10 8.1013-Jun-99 Eu 4.80 17.80 25.30 18.90 2.1013-May-01 Govt 34.44 32.19 19.04 36.33 35.1811-Nov-01 Regions -18.49 -12.12 -9.48 -10.15 -1.2812-Jun-04 Province -7.10 -3.20 -18.90 -3.70 -6.8012-Jun-04 Eu -7.10 -3.20 -18.90 -3.70 -6.804-Mar-05 Regions 5.40 -1.60 -7.40 -13.40 -12.203-Apr-05 Province -17.20 -17.10 -20.00 -15.40 -22.9017-Apr-05 Regions 4.70 -22.90 -12.40 -2.80 9.408-May-05 Province -4.80 5.20 9.60 4.90 6.409-Apr-06 Govt 13.50 4.60 23.60 8.20 15.80
28-May-06 Province -8.00 3.70 -22.80 -9.50 -21.305-Nov-06 Regions -16.30 -11.90 -18.70 -14.50 -16.90
27-May-07 Province 4.50 14.20 4.00 12.50 8.0013-Apr-08 Province -15.80 -37.80 -56.60 -12.60 -33.0013-Apr-08 Govt -15.80 -37.80 -56.60 -12.60 -33.0014-Dec-08 Regions 22.48 24.65 72.57 60.30 112.047-Jun-09 Province 21.10 6.11 27.76 -2.87 0.517-Jun-09 Eu 21.10 6.11 27.76 -2.87 0.51
28-Mar-10 Province 9.95 -2.21 -62.34 5.60 -63.2628-Mar-10 Regions 9.95 -2.21 -62.34 5.60 -63.2630-May-10 Province -10.91 -25.76 -46.87 -20.37 -9.3515-May-11 Province 5.33 9.11 -64.85 11.04 -3.8416-Oct-11 Regions -4.55 -64.22 -186.62 -56.09 -172.13
In the -10/+30 business days period we, historically, observe an average flattening of the 10s-2s segment of 12 bps.
0.00%
5.00%
10.00%
15.00%
20.00%
25.00%
30.00%
35.00%
-180 -165 -150 -135 -120 -105 -90 -75 -60 -45 -30 -15 0 15 30 45 60 75 90 105 120 135 150 165 180
Chart3. Histogram of 10s-2s behaviour the -10/+30 electoral period.

What we are looking at
Capital Markets - StructuringDesk Rates InflationCristiana Corno +39 02 72612754
Trading the Italian electoral cycle
All data are derived from Bloomberg database and elaborated by Banca IMI
Published and data as of: 1 February, 2013
Rerunning the analysis on the 10s-5s segment, we get that the average move is flattening of around 6 bps, while the 30s-10s segment has been, on average, unchanged.
Summarizing, looking at past behaviour into election cycles, we found that in the period -10/+30 business days centred on election day date:
1. Volatility generally increased;
2. The move in the Btp-Bund spread 10y maturity, in electoral periods, exacerbated the trend in place, but, on average, widened;
3. Flattening was the move, REGARDLESS OF DIRECTION, and it was mainly concentrated on the 10s-2s segment.
What we are looking at
Capital Markets - StructuringDesk Rates InflationCristiana Corno +39 02 72612754
Trading the Italian electoral cycle
All data are derived from Bloomberg database and elaborated by Banca IMI
Published and data as of: 1 February, 2013
Disclaimer This marketing communication has been prepared and is distributed by Banca IMI, a bank belonging to the Intesa Sanpaolo Banking Group which is authorised to carry out investment services in Italy and is regulated by the Bank of Italy and Consob. The information contained in this document:constitutes a marketing communication and, as such, it has not been prepared in accordance with the legal requirements designed to promote the independence of investment research and is not subject to any prohibition on dealing ahead of the dissemination of investment research;may differ from the recommendations prepared by financial analysts of the Servizio Studi e Ricerche of Intesa Sanpaolo and distributed by Banca IMI.
The information contained herein does not constitute investment research or an implicit or explicit recommendation or advice in relation to any investment strategy on the financial instruments or on the issuers referred to herein, or a solicitation or invitation, or investment advice, and does not purport to offer legal, tax or any other advice. Neither the Intesa Sanpaolo Banking Group, nor any officer, representative or employee thereof accepts any liability (for neglicence or otherwise) for any direct or consequential losses arising from any use of information including, without limitation, the reliance on any such information contained in this communication. The information and views contained in this communication are based on sources believed to be reliable and in good faith. Accordingly, Banca IMI does not implicitly or explicitly guarantee their accuracy, completeness or correctness. The views, forecasts and estimates contained in this communication reflect the personal view of the author as of the date of itspublication. The views may differ from those of others within the Intesa Sanpaolo Banking Goup. All prices and rates included herein are shown for indication only and should not be relied upon to re-evaluate any positions held by any recipient of this document. For specific quotations, please contact your Banca IMI usual contact. There is no guarantee that the future results or any other future events will be consistent with the views, forecasts and estimates contained in this communication. Furthermore, any information included herein is subject to change by the author after the date of its publication without any notice by Banca IMI to the person to whom this communication has been distributed.This document is intended for distribution in Italy and in the Member States of the European Union only to professional clients and eligible counterparties, as defined in the MiFID Directive 2004/39/EC, either as a printed document and/or electronic form.Conflicts of interest.The companies belonging to the Intesa Sanpaolo Group, their officers, employees or representatives and/or their relatives may from time to time have an interest in the financial instruments, including related financial instruments, and in the issuers or transactions referred to in this communication. Such interests may include having long or short positions and, at any time, trading the financial instruments, including related financial instruments, or financial instruments whose value is dependent upon, or is linked to, the financial instruments, issuers, parameters or indices referred to herein. Such interests may also include holding significant shareholdings, holding an office, participating in shareholders’ agreements, providing banking, credit or other financial services to the issuers of the financial instruments referred to herein, including their controlling companies or other companies belonging to the issuer’s group. Banca IMI may act in the capacity of sponsor, specialist, listing partner, market maker, corporate broking and/or liquidity provider or in any other similar capacity with regard to the financial instruments, including related financial instruments, referred to herein. Banca IMI, in the carrying out of trading activities, may have significant directional positions in the financial instruments referred to herein or positions which are contrary to the views expressed herein.In consideration of the above, the companies belonging to the Intesa Sanpaolo Banking Group, its officers, employees or representatives and/or their relatives may have positions in conflict of interest with the positions held by any investor. This communication is for exclusive use by the person to whom has been distributed by Banca IMI and may not be reproduced or redistributed, directly or indirectly, to any other person or published, fully or partially, for any reason whatsoever, without the prior written consent of Banca IMI. The copyright and any other intellectual rights on data, information, opinions and estimates referred to herein belong to the Intesa Sanpaolo Banking Group, unless otherwise stated. Such data, information, opinions and estimates may not be fully or partially distributed or reproduced in any form, and by any means, without the prior written consent of Banca IMI.
Any recipient of this communication is required to comply with the above requirements.