Embed Size (px)
Citation preview
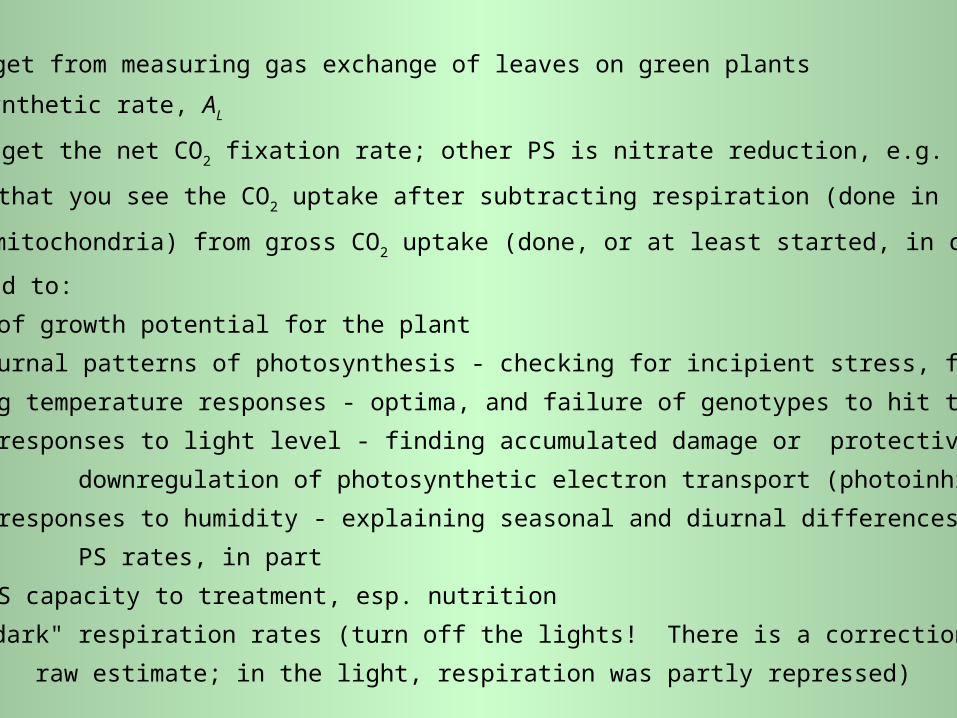
What you can get from measuring gas exchange of leaves on green plants
Leaf photosynthetic rate, AL
Caveat: you get the net CO2 fixation rate; other PS is nitrate reduction, e.g.
Net means that you see the CO2 uptake after subtracting respiration (done in
mitochondria) from gross CO2 uptake (done, or at least started, in chloroplasts)
This can lead to:
Estimates of growth potential for the plant
Finding diurnal patterns of photosynthesis - checking for incipient stress, for one
Determining temperature responses - optima, and failure of genotypes to hit them
Measuring responses to light level - finding accumulated damage or protective
downregulation of photosynthetic electron transport (photoinhibition)
Measuring responses to humidity - explaining seasonal and diurnal differences in
PS rates, in part
Relating PS capacity to treatment, esp. nutrition
Leaf "dark" respiration rates (turn off the lights! There is a correction to this
raw estimate; in the light, respiration was partly repressed)
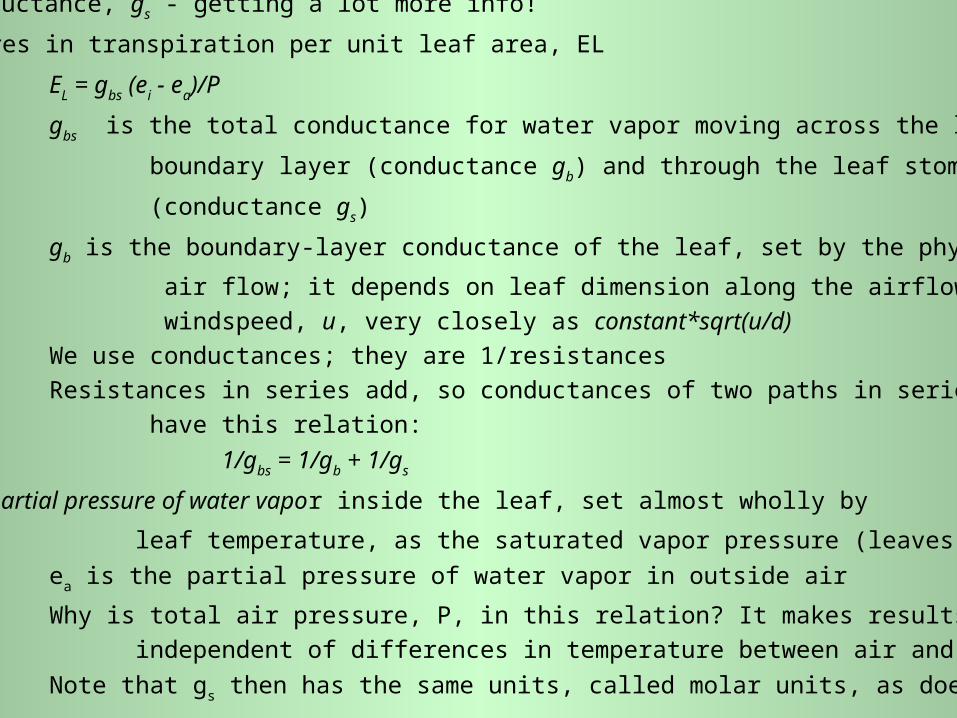
Stomatal conductance, gs - getting a lot more info!
How gs figures in transpiration per unit leaf area, EL
EL = gbs (ei - ea)/P
gbs is the total conductance for water vapor moving across the leaf
boundary layer (conductance gb) and through the leaf stomata
(conductance gs)
gb is the boundary-layer conductance of the leaf, set by the physics of
air flow; it depends on leaf dimension along the airflow, d, and on
windspeed, u, very closely as constant*sqrt(u/d)
We use conductances; they are 1/resistances
Resistances in series add, so conductances of two paths in series
have this relation:
1/gbs = 1/gb + 1/gs
ei is the partial pressure of water vapor inside the leaf, set almost wholly by
leaf temperature, as the saturated vapor pressure (leaves are very wet)
ea is the partial pressure of water vapor in outside air
Why is total air pressure, P, in this relation? It makes results almost
independent of differences in temperature between air and leaf
Note that gs then has the same units, called molar units, as does PS rate, AL
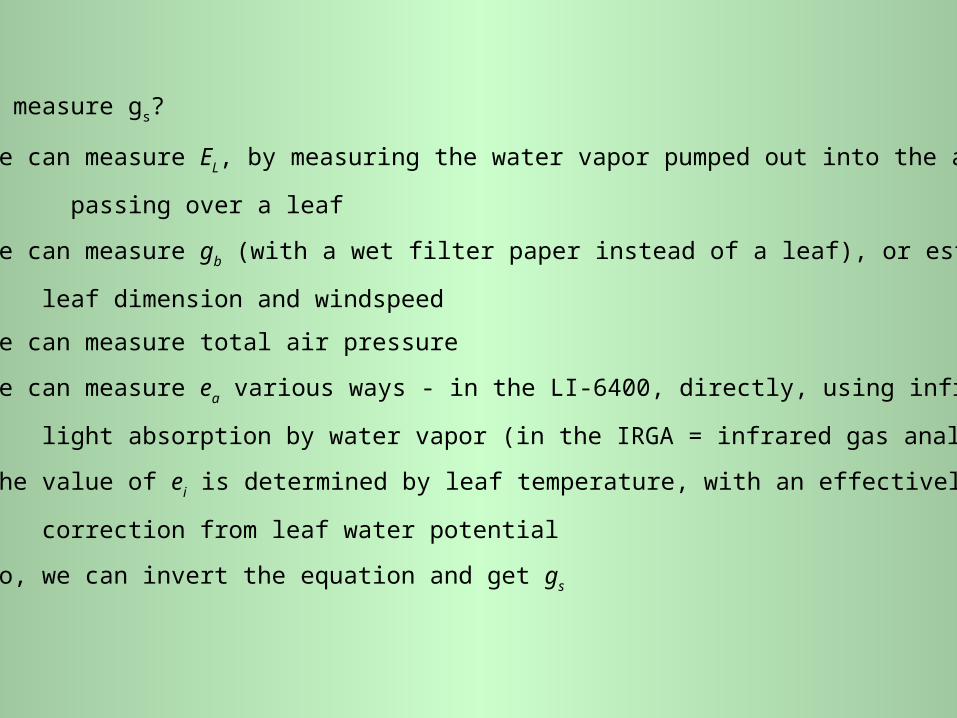
How can we measure gs?
We can measure EL, by measuring the water vapor pumped out into the air
passing over a leaf
We can measure gb (with a wet filter paper instead of a leaf), or estimate it from
leaf dimension and windspeed
We can measure total air pressure
We can measure ea various ways - in the LI-6400, directly, using infrared
light absorption by water vapor (in the IRGA = infrared gas analyzer)
The value of ei is determined by leaf temperature, with an effectively negligible
correction from leaf water potential
So, we can invert the equation and get gs
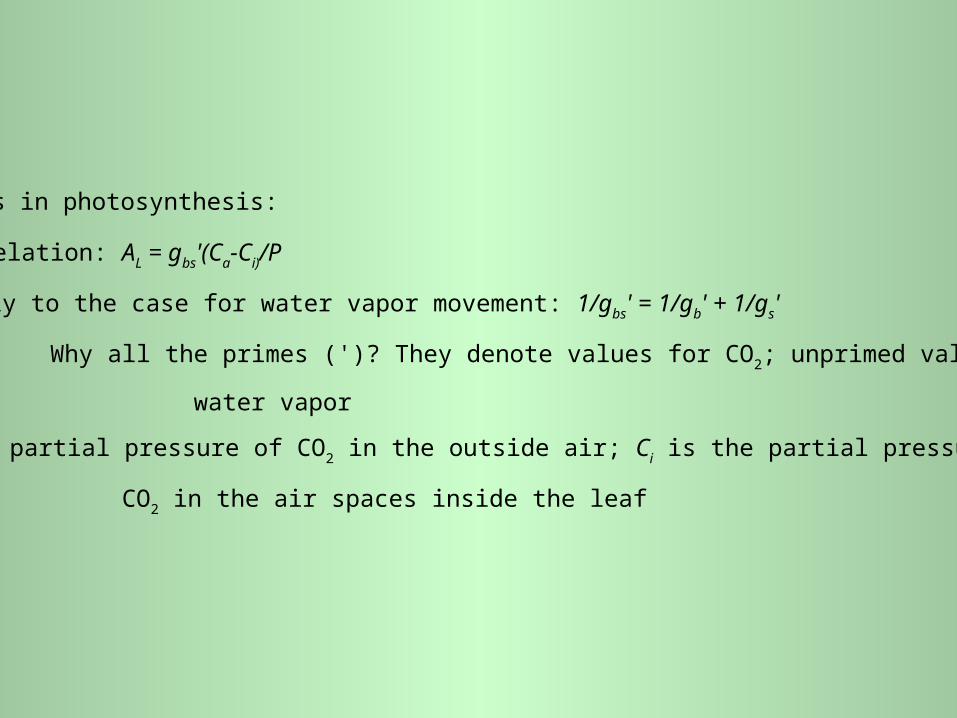
How gs figures in photosynthesis:
Transport relation: AL = gbs'(Ca-Ci)/P
Similarly to the case for water vapor movement: 1/gbs' = 1/gb' + 1/gs'
Why all the primes (')? They denote values for CO2; unprimed values are for
water vapor
Ca is the partial pressure of CO2 in the outside air; Ci is the partial pressure of
CO2 in the air spaces inside the leaf
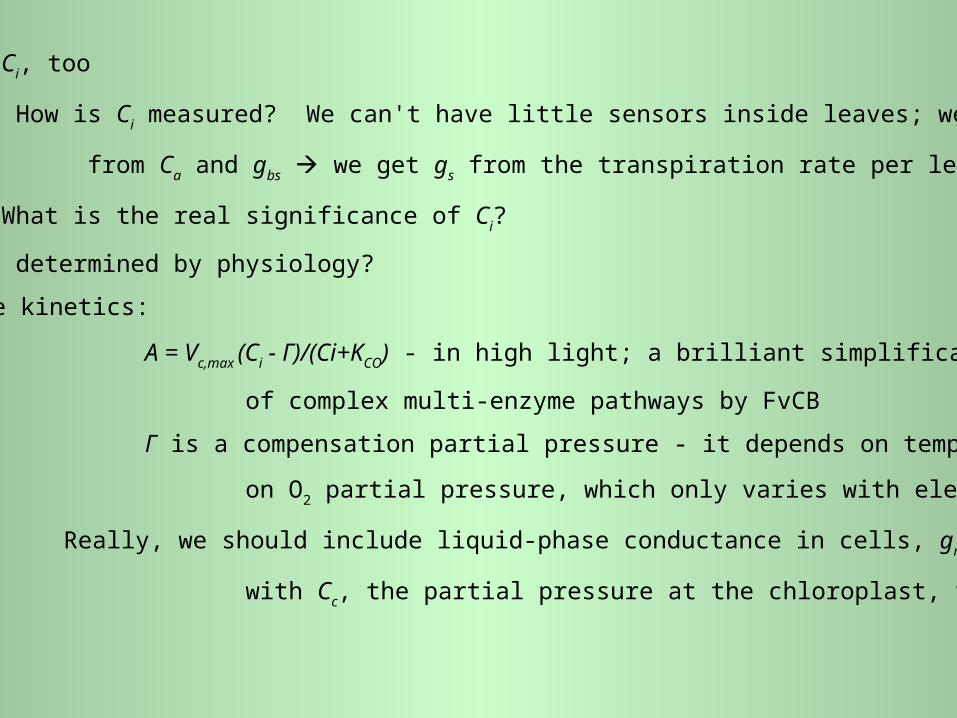
A focus on Ci, too
How is Ci measured? We can't have little sensors inside leaves; we compute it
from Ca and gbs we get gs from the transpiration rate per leaf area, EL
What is the real significance of Ci?
How is it determined by physiology?
Enzyme kinetics:
A = Vc,max (Ci - Γ)/(Ci+KCO) - in high light; a brilliant simplification
of complex multi-enzyme pathways by FvCB
Γ is a compensation partial pressure - it depends on temperature (and
on O2 partial pressure, which only varies with elevation)
Really, we should include liquid-phase conductance in cells, gm; replace Ci
with Cc, the partial pressure at the chloroplast, vs. in air spaces
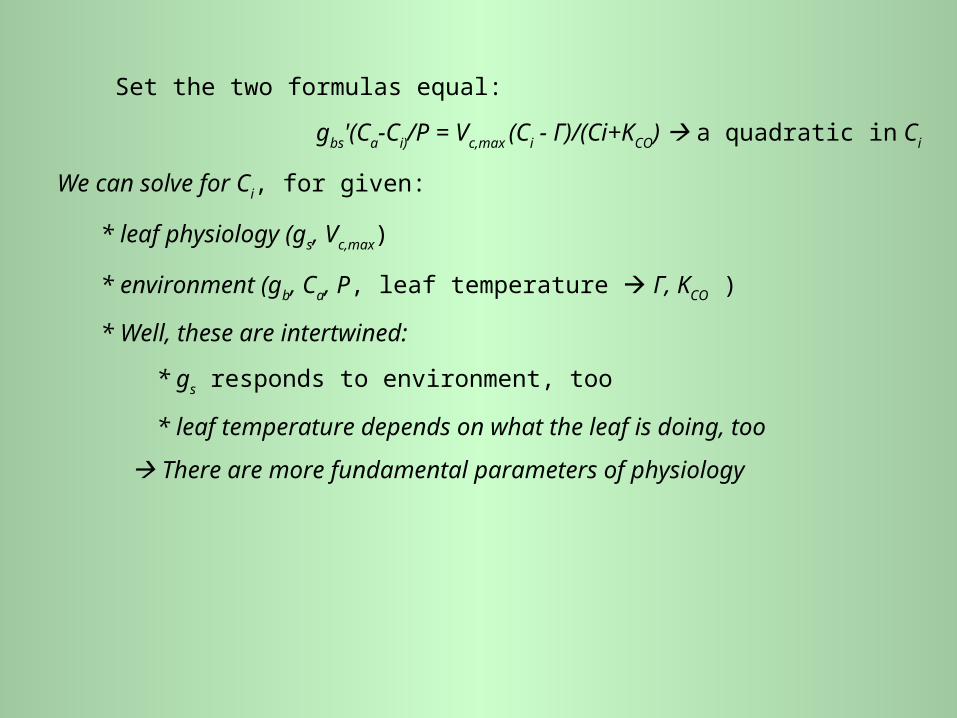
Set the two formulas equal:
gbs'(Ca-Ci)/P = Vc,max (Ci - Γ)/(Ci+KCO) a quadratic in Ci
We can solve for Ci, for given:
* leaf physiology (gs, Vc,max)
* environment (gb, Ca, P, leaf temperature Γ, KCO )
* Well, these are intertwined:
* gs responds to environment, too
* leaf temperature depends on what the leaf is doing, too
There are more fundamental parameters of physiology
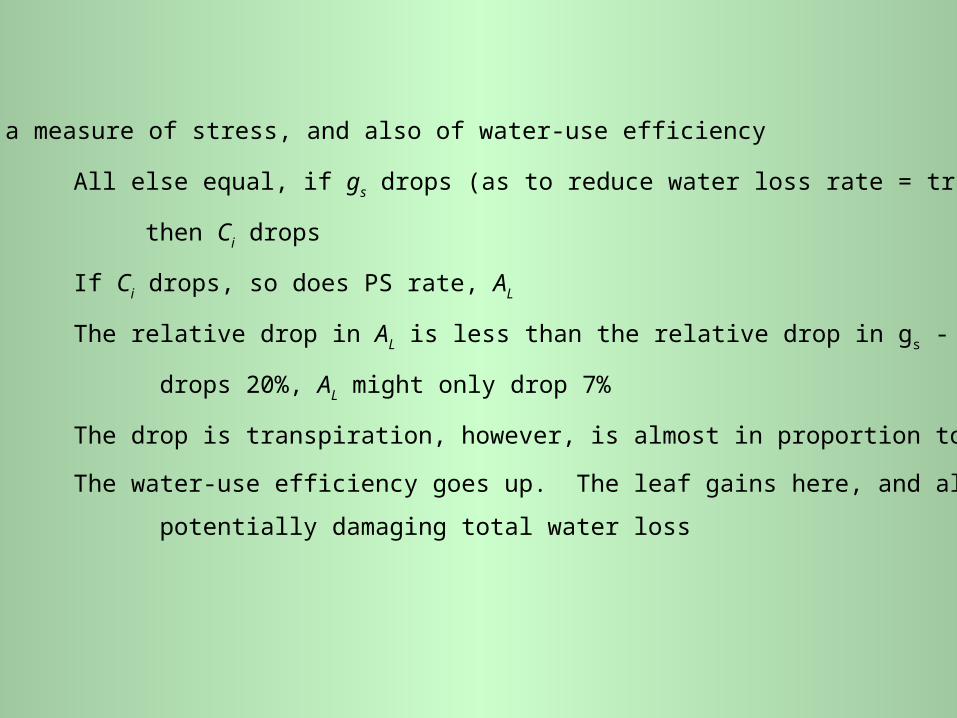
Ci is a measure of stress, and also of water-use efficiency
All else equal, if gs drops (as to reduce water loss rate = transpiration),
then Ci drops
If Ci drops, so does PS rate, AL
The relative drop in AL is less than the relative drop in gs - e.g., if gs
drops 20%, AL might only drop 7%
The drop is transpiration, however, is almost in proportion to that in gs
The water-use efficiency goes up. The leaf gains here, and also in delaying
potentially damaging total water loss
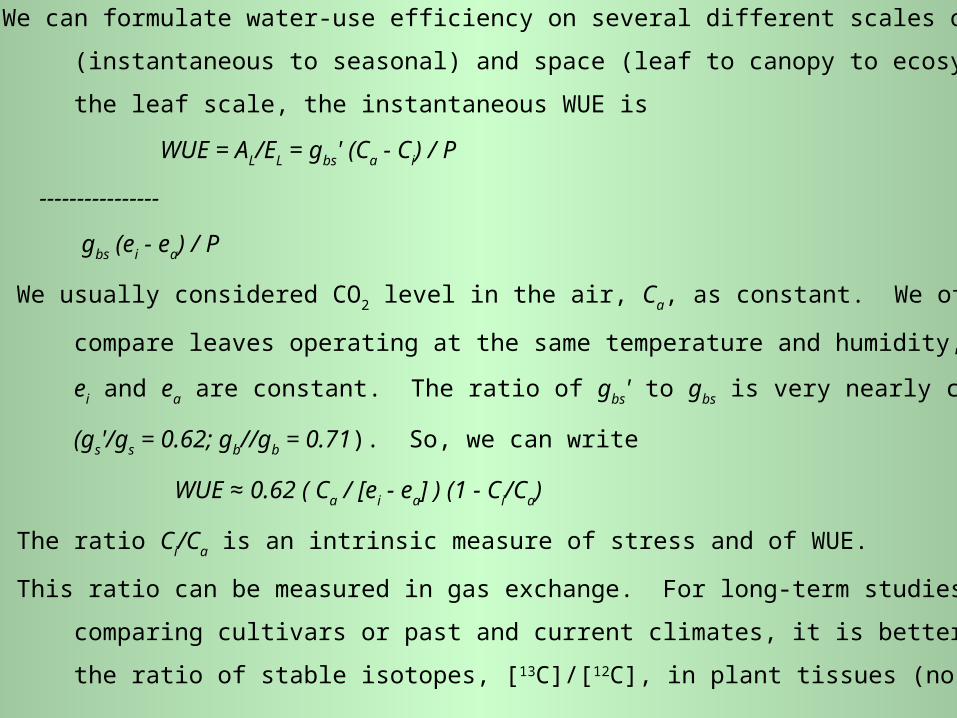
We can formulate water-use efficiency on several different scales of time
(instantaneous to seasonal) and space (leaf to canopy to ecosystem). On
the leaf scale, the instantaneous WUE is
WUE = AL/EL = gbs' (Ca - Ci) / P
----------------
gbs (ei - ea) / P
We usually considered CO2 level in the air, Ca, as constant. We often
compare leaves operating at the same temperature and humidity, so that
ei and ea are constant. The ratio of gbs' to gbs is very nearly constant
(gs'/gs = 0.62; gb//gb = 0.71). So, we can write
WUE ≈ 0.62 ( Ca / [ei - ea] ) (1 - Ci/Ca)
The ratio Ci/Ca is an intrinsic measure of stress and of WUE.
This ratio can be measured in gas exchange. For long-term studies, as in
comparing cultivars or past and current climates, it is better measured by
the ratio of stable isotopes, [13C]/[12C], in plant tissues (no details here)
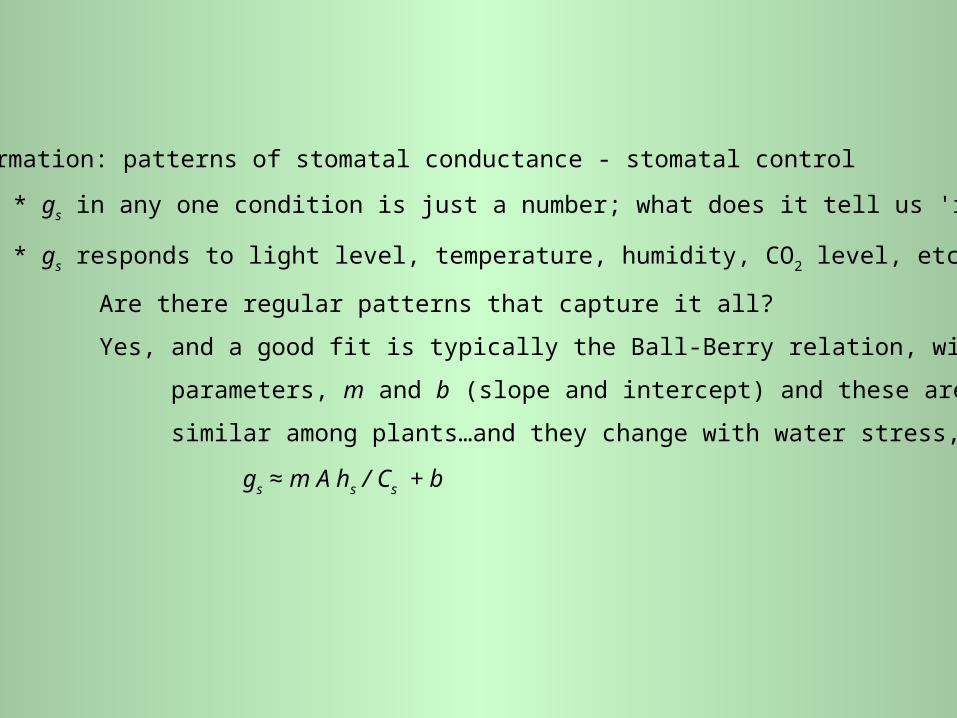
More information: patterns of stomatal conductance - stomatal control
* gs in any one condition is just a number; what does it tell us 'in the large'?
* gs responds to light level, temperature, humidity, CO2 level, etc.
Are there regular patterns that capture it all?
Yes, and a good fit is typically the Ball-Berry relation, with only two
parameters, m and b (slope and intercept) and these are often very
similar among plants…and they change with water stress, primarily
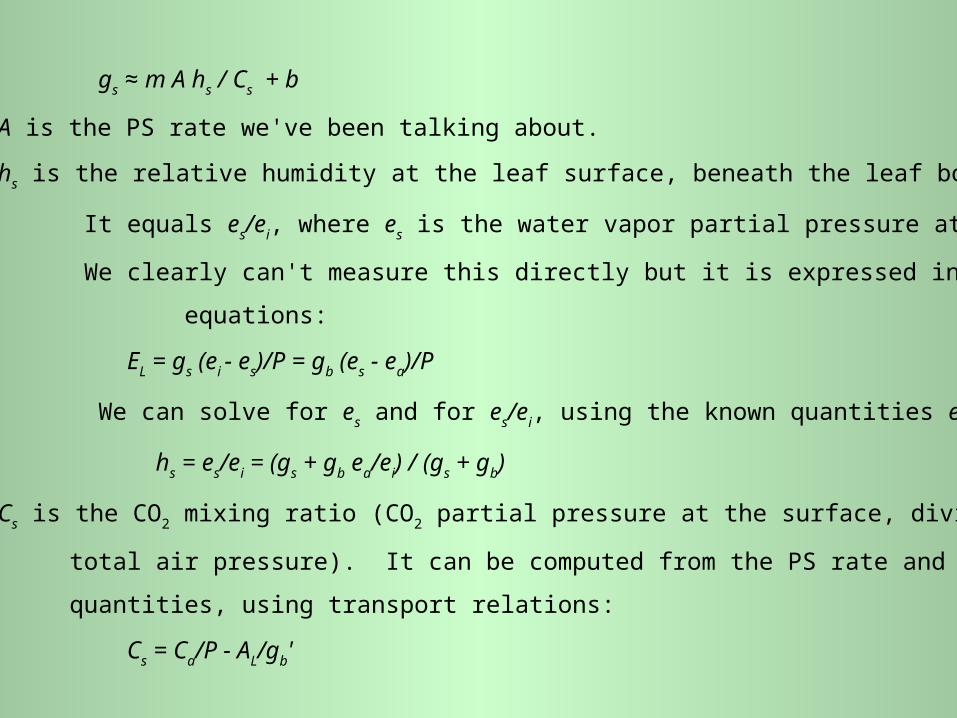
gs ≈ m A hs / Cs + b
gs ≈ m A hs / Cs + b
A is the PS rate we've been talking about.
hs is the relative humidity at the leaf surface, beneath the leaf boundary layer.
It equals es/ei, where es is the water vapor partial pressure at the surface.
We clearly can't measure this directly but it is expressed in transport
equations:
EL = gs (ei - es)/P = gb (es - ea)/P
We can solve for es and for es/ei, using the known quantities ei, ea, gs, gb:
hs = es/ei = (gs + gb ea/ei) / (gs + gb)
Cs is the CO2 mixing ratio (CO2 partial pressure at the surface, divided by
total air pressure). It can be computed from the PS rate and other known
quantities, using transport relations:
Cs = Ca/P - AL/gb'
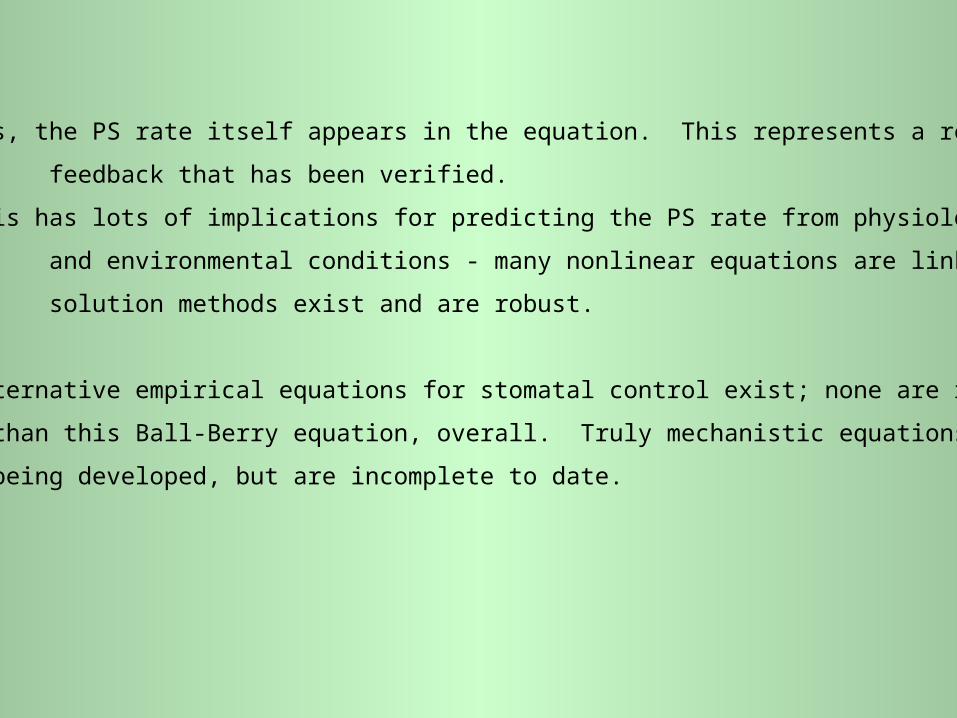
Yes, the PS rate itself appears in the equation. This represents a real physiological
feedback that has been verified.
This has lots of implications for predicting the PS rate from physiological
and environmental conditions - many nonlinear equations are linked, but the
solution methods exist and are robust.
Alternative empirical equations for stomatal control exist; none are really better
than this Ball-Berry equation, overall. Truly mechanistic equations are
being developed, but are incomplete to date.
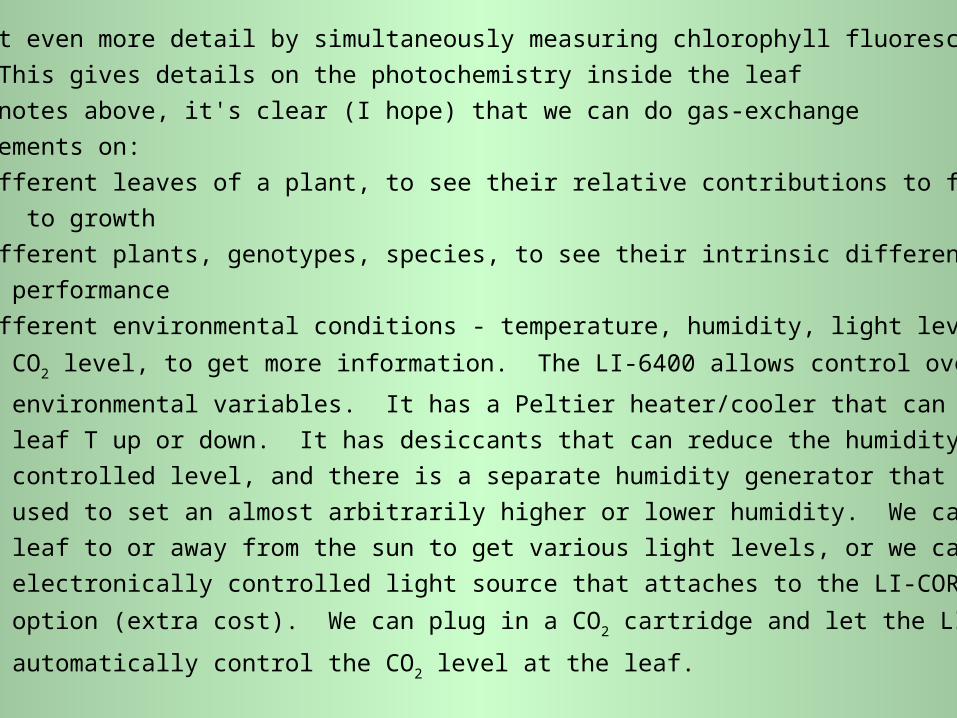
We can get even more detail by simultaneously measuring chlorophyll fluorescence.
This gives details on the photochemistry inside the leaf
From the notes above, it's clear (I hope) that we can do gas-exchange
measurements on:
* Different leaves of a plant, to see their relative contributions to fluxes and
to growth
* Different plants, genotypes, species, to see their intrinsic differences in
performance
* Different environmental conditions - temperature, humidity, light level, even
CO2 level, to get more information. The LI-6400 allows control over all these
environmental variables. It has a Peltier heater/cooler that can change
leaf T up or down. It has desiccants that can reduce the humidity to a
controlled level, and there is a separate humidity generator that can be
used to set an almost arbitrarily higher or lower humidity. We can angle the
leaf to or away from the sun to get various light levels, or we can use an
electronically controlled light source that attaches to the LI-COR as an
option (extra cost). We can plug in a CO2 cartridge and let the LI-COR
automatically control the CO2 level at the leaf.
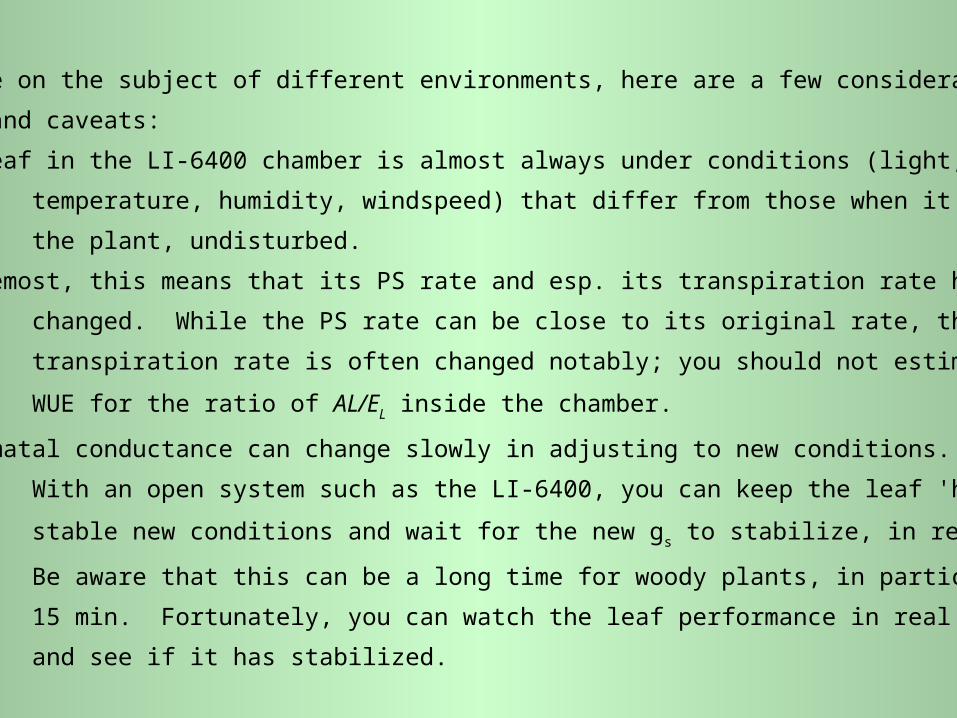
While we're on the subject of different environments, here are a few considerations
and caveats:
* A leaf in the LI-6400 chamber is almost always under conditions (light,
temperature, humidity, windspeed) that differ from those when it was on
the plant, undisturbed.
* Foremost, this means that its PS rate and esp. its transpiration rate have
changed. While the PS rate can be close to its original rate, the
transpiration rate is often changed notably; you should not estimate
WUE for the ratio of AL/EL inside the chamber.
* Stomatal conductance can change slowly in adjusting to new conditions.
With an open system such as the LI-6400, you can keep the leaf 'happy' in
stable new conditions and wait for the new gs to stabilize, in response.
Be aware that this can be a long time for woody plants, in particular - up to
15 min. Fortunately, you can watch the leaf performance in real time
and see if it has stabilized.
More about responses of leaves to light levels (and to physiological limitations):
* The expression used earlier is very good for high light - at so-called light saturation.
Let's call this value Asat
* At low light levels, the PS rate is linearly proportional to light level, measured as
a quantum flux density, IL, in the photosynthetically active radiation (PAR) band,
between 400 and 700 nm in wavelength (essentially the visible spectrum).
Call this the light-limited rate,
ALL = Q0 IL
Here, Q0 is called the initial quantum yield. It depends on temperature and
O2 level. In normal ranges of both, it is near 0.05 (as mol CO2 fixed per mol
of light intercepted).
* At any intermediate light level, IL, there is a transition between the two rates,
well expressed using a "convexity" parameter, θ:
θA2 - A(ALL+Asat) + ALLAsat = 0
A = [0.5/ θ][ Asat + ALL - sqrt( {Asat + ALL}2 - 4 θ Asat ALL) ]
Fortunately, θ is about 0.8 for many different plants.
There is one more potential internal limitation to PS rates - from maximal rates of
triose phosphate utilization (shipping sugars out of the chloroplast). This can
be fitted into a generalization of the above equation.
Finally, another topic in PS rates is the transient behavior. Sudden changes of light
level can occur (a leaf find itself in a sunfleck); the steady-state biochemical models
don't apply; they have been extended to cover this case, such as in the work by
Bob Pearcy and his group.
Other transients occur in stomatal control. A leaf shocked by a sudden drop in humidity
can go into stomatal oscillation, or even close up for extended times. You don't
learn anything useful from causing these kinds of transients, so you should avoid
them by not imposing sudden changes on the leaf, esp. changes in humidity.
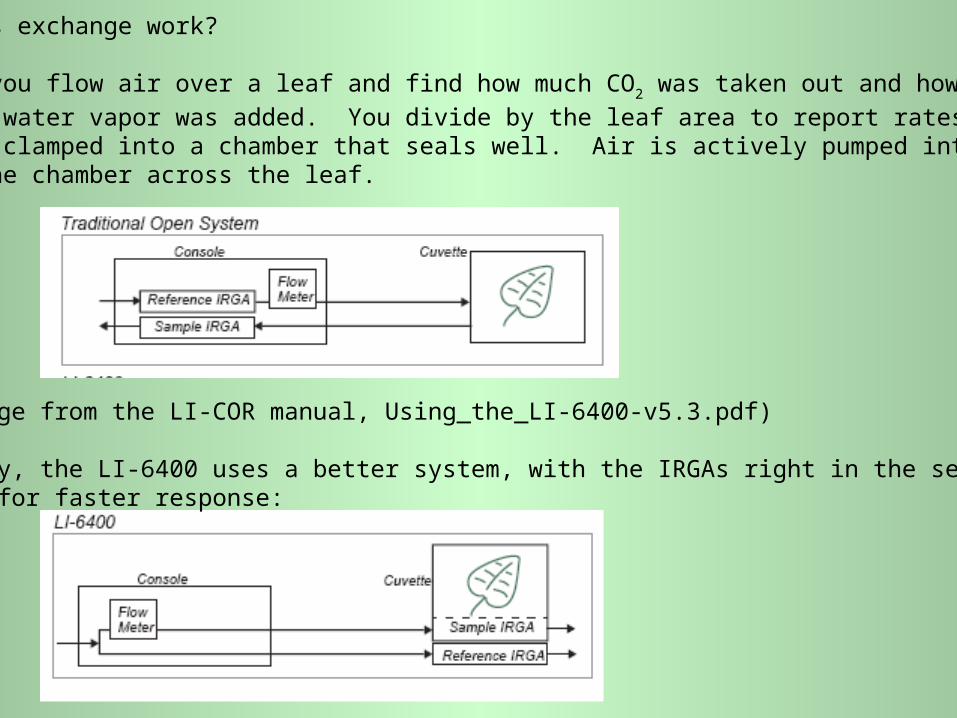
How does gas exchange work?
Basically, you flow air over a leaf and find how much CO2 was taken out and how
much water vapor was added. You divide by the leaf area to report rates per area.The leaf is clamped into a chamber that seals well. Air is actively pumped into and out of the chamber across the leaf.
(Image from the LI-COR manual, Using_the_LI-6400-v5.3.pdf) Actually, the LI-6400 uses a better system, with the IRGAs right in the sensor head, for faster response:
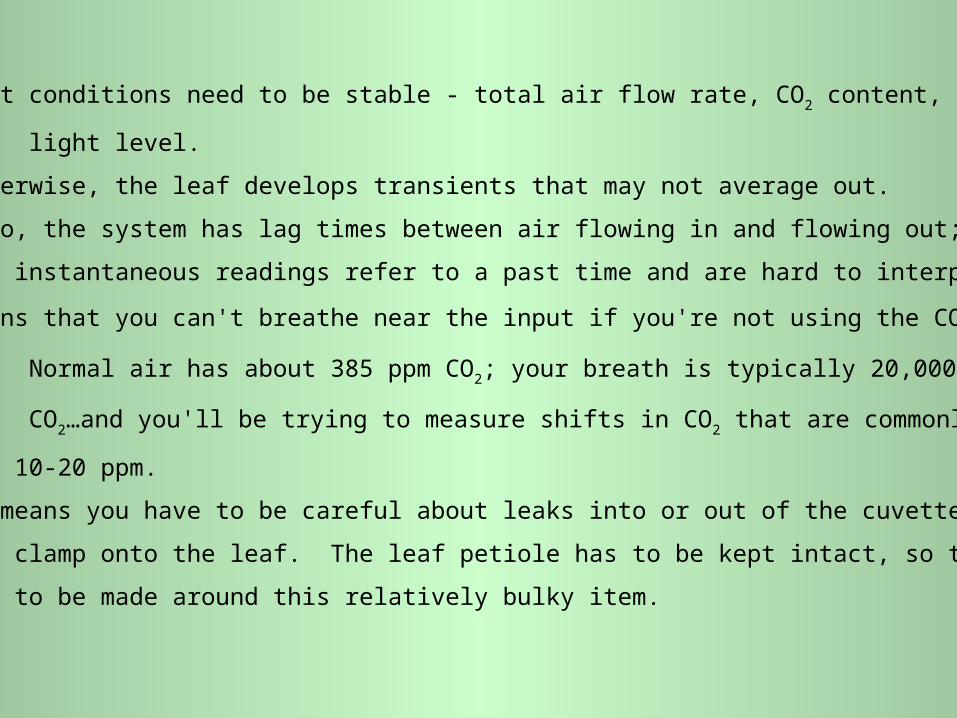
The input conditions need to be stable - total air flow rate, CO2 content, humidity,
light level.
Otherwise, the leaf develops transients that may not average out.
Also, the system has lag times between air flowing in and flowing out; the
instantaneous readings refer to a past time and are hard to interpret.
This means that you can't breathe near the input if you're not using the CO2 control.
Normal air has about 385 ppm CO2; your breath is typically 20,000 ppm
CO2…and you'll be trying to measure shifts in CO2 that are commonly
10-20 ppm.
It also means you have to be careful about leaks into or out of the cuvette that you
clamp onto the leaf. The leaf petiole has to be kept intact, so the seal has
to be made around this relatively bulky item.
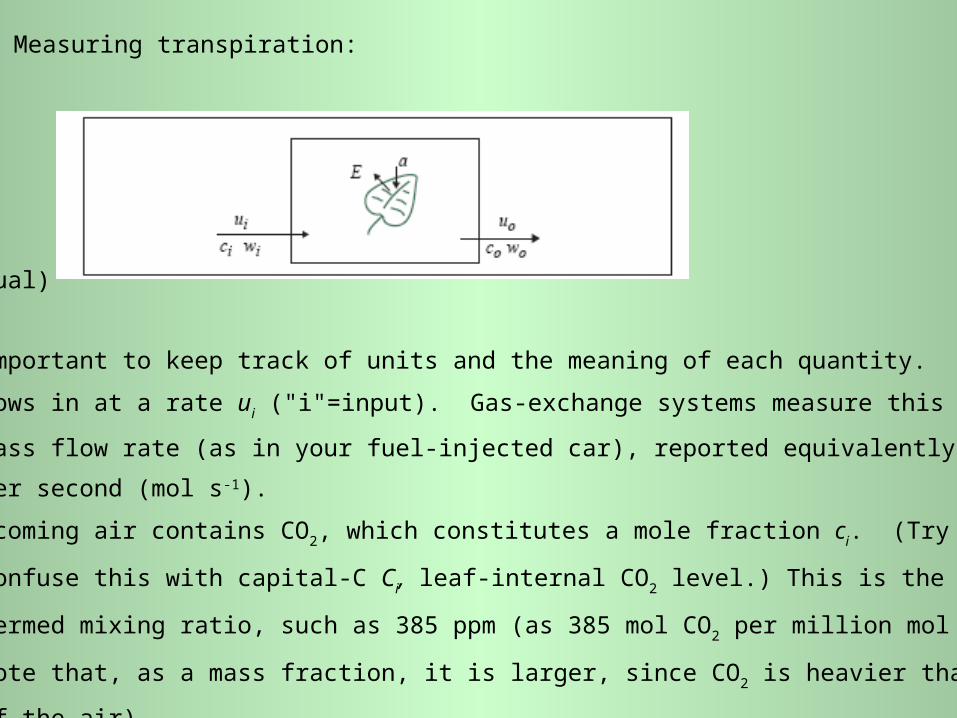
Measuring transpiration:
(LI-COR manual)
It's important to keep track of units and the meaning of each quantity.
Air flows in at a rate ui ("i"=input). Gas-exchange systems measure this as a
mass flow rate (as in your fuel-injected car), reported equivalently as moles
per second (mol s-1).
The incoming air contains CO2, which constitutes a mole fraction ci. (Try not to
confuse this with capital-C Ci, leaf-internal CO2 level.) This is the commonly
termed mixing ratio, such as 385 ppm (as 385 mol CO2 per million mol air.
Note that, as a mass fraction, it is larger, since CO2 is heavier than the rest
of the air).
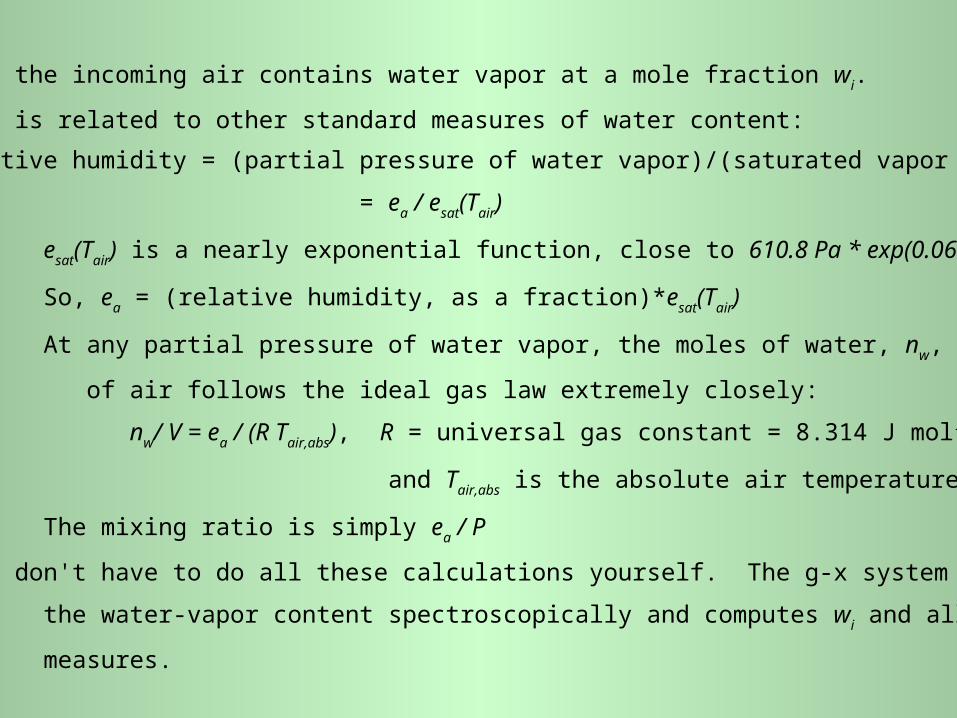
Similarly, the incoming air contains water vapor at a mole fraction wi.
This is related to other standard measures of water content:
Relative humidity = (partial pressure of water vapor)/(saturated vapor pressure)
= ea / esat(Tair)
esat(Tair) is a nearly exponential function, close to 610.8 Pa * exp(0.065 Tair)
So, ea = (relative humidity, as a fraction)*esat(Tair)
At any partial pressure of water vapor, the moles of water, nw, per volume V
of air follows the ideal gas law extremely closely:
nw/ V = ea / (R Tair,abs), R = universal gas constant = 8.314 J mol-1 K-1
and Tair,abs is the absolute air temperature, Tair(ºC)+273.2K
The mixing ratio is simply ea / P
You don't have to do all these calculations yourself. The g-x system measures
the water-vapor content spectroscopically and computes wi and all other
measures.
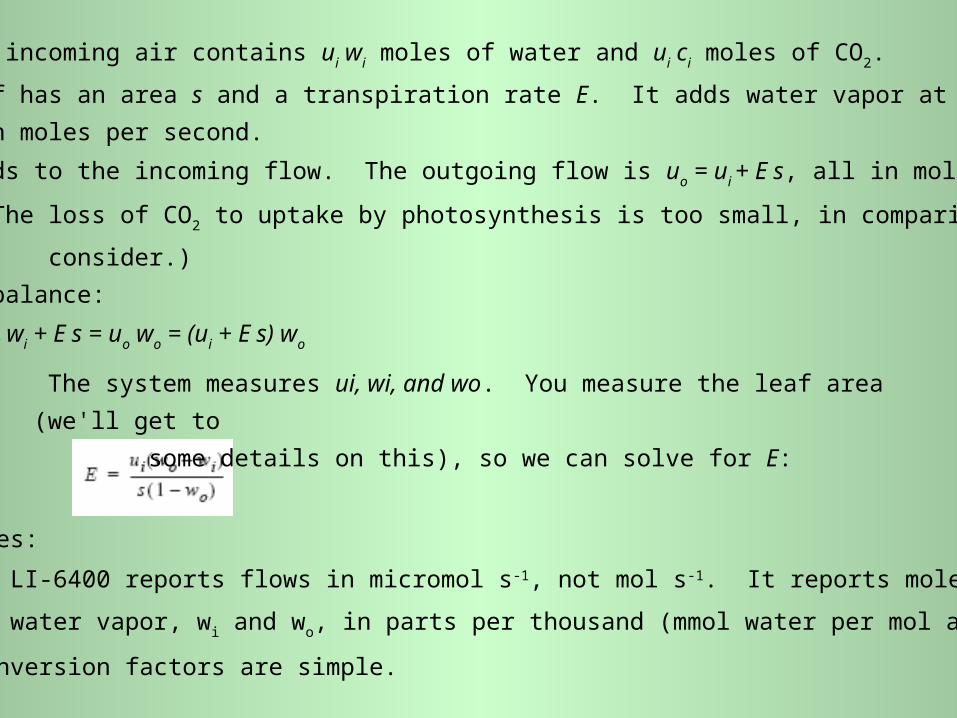
So, the incoming air contains ui wi moles of water and ui ci moles of CO2.
The leaf has an area s and a transpiration rate E. It adds water vapor at a rate E s,
in moles per second.
This adds to the incoming flow. The outgoing flow is uo = ui + E s, all in mol s-1.
(The loss of CO2 to uptake by photosynthesis is too small, in comparison, to
consider.)
By mass balance:
ui wi + E s = uo wo = (ui + E s) wo
A few notes:
The LI-6400 reports flows in micromol s-1, not mol s-1. It reports mole fractions
of water vapor, wi and wo, in parts per thousand (mmol water per mol air). The
conversion factors are simple.
The system measures ui, wi, and wo. You measure the leaf area (we'll get to
some details on this), so we can solve for E:
Computing stomatal conductance
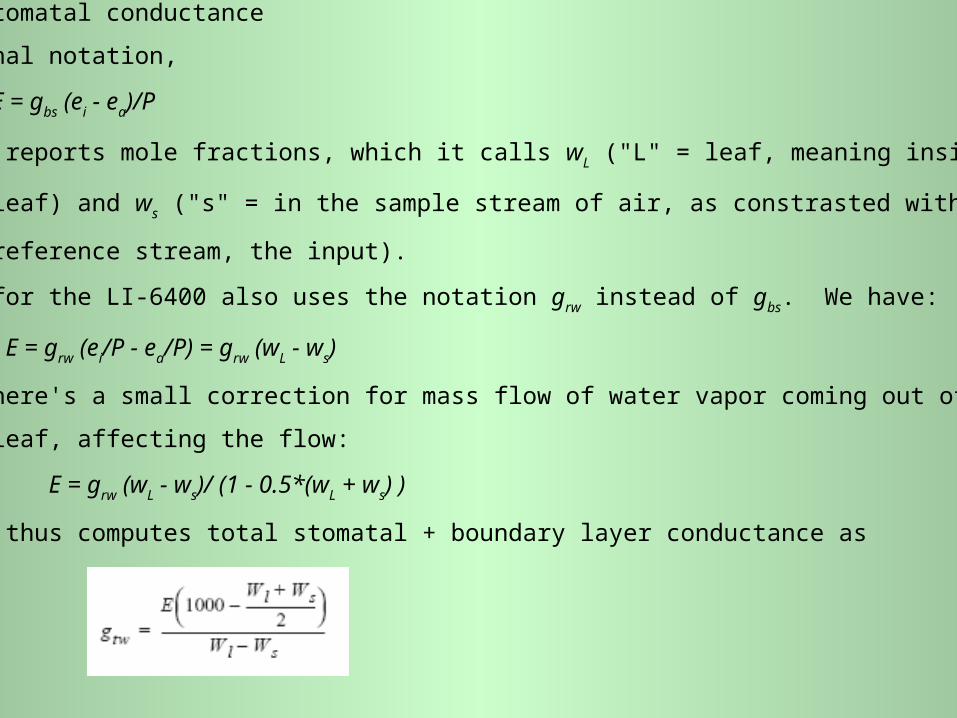
In my original notation,
E = gbs (ei - ea)/P
The LI-6400 reports mole fractions, which it calls wL ("L" = leaf, meaning inside the
leaf) and ws ("s" = in the sample stream of air, as constrasted with the
reference stream, the input).
The manual for the LI-6400 also uses the notation grw instead of gbs. We have:
E = grw (ei/P - ea/P) = grw (wL - ws)
Actually, there's a small correction for mass flow of water vapor coming out of the
leaf, affecting the flow:
E = grw (wL - ws)/ (1 - 0.5*(wL + ws) )
The LI-6400 thus computes total stomatal + boundary layer conductance as
brw
s
gg
g11
1
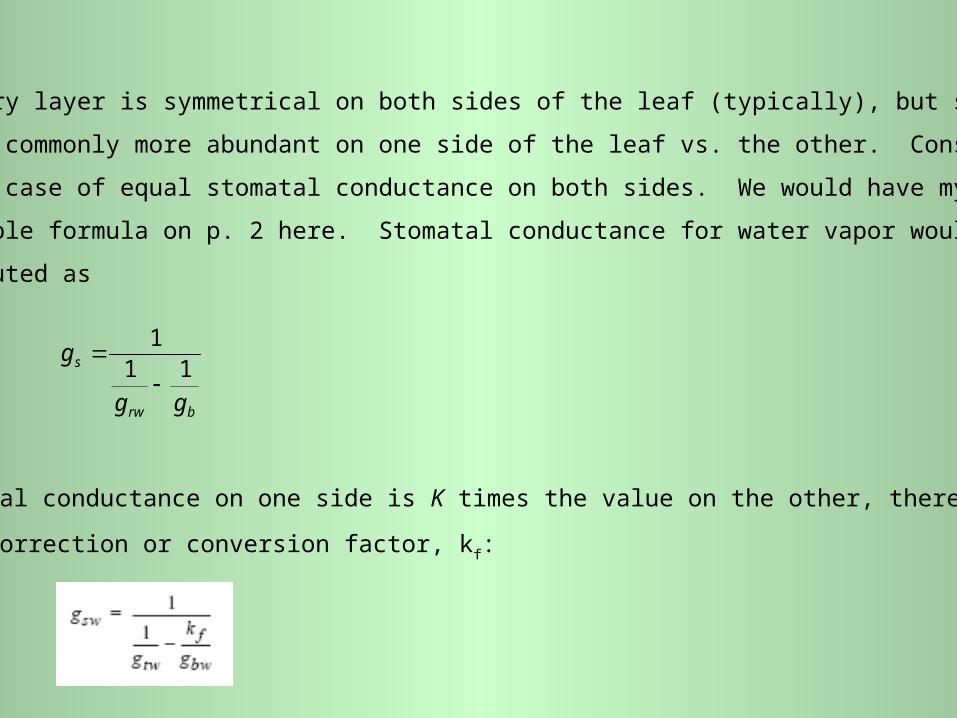
The boundary layer is symmetrical on both sides of the leaf (typically), but stomata
are commonly more abundant on one side of the leaf vs. the other. Consider first
the case of equal stomatal conductance on both sides. We would have my
simple formula on p. 2 here. Stomatal conductance for water vapor would be
computed as
If stomatal conductance on one side is K times the value on the other, there is a
correction or conversion factor, kf:
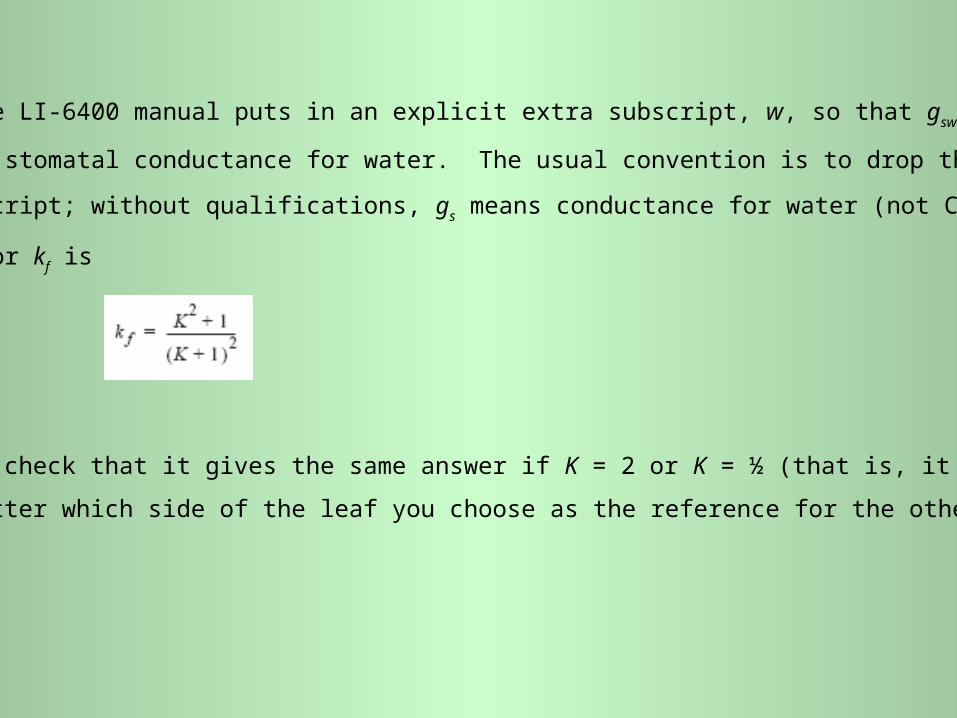
Here, the LI-6400 manual puts in an explicit extra subscript, w, so that gsw means
the stomatal conductance for water. The usual convention is to drop this extra
subscript; without qualifications, gs means conductance for water (not CO2).
The factor kf is
You can check that it gives the same answer if K = 2 or K = ½ (that is, it doesn't
matter which side of the leaf you choose as the reference for the other side).
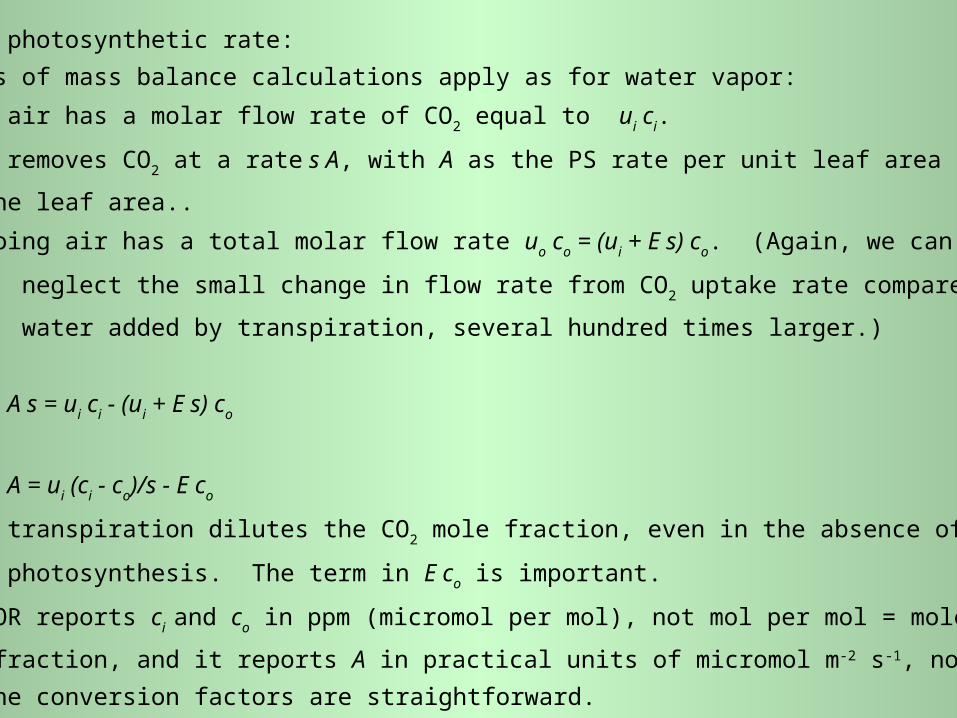
Computing the photosynthetic rate:
The same kinds of mass balance calculations apply as for water vapor:
Incoming air has a molar flow rate of CO2 equal to ui ci.
The leaf removes CO2 at a rate s A, with A as the PS rate per unit leaf area and s as
the leaf area..
The outgoing air has a total molar flow rate uo co = (ui + E s) co. (Again, we can
neglect the small change in flow rate from CO2 uptake rate compared to the
water added by transpiration, several hundred times larger.)
We get:
A s = ui ci - (ui + E s) co
Or:
A = ui (ci - co)/s - E co
Note how transpiration dilutes the CO2 mole fraction, even in the absence of
photosynthesis. The term in E co is important.
The LI-COR reports ci and co in ppm (micromol per mol), not mol per mol = mole
fraction, and it reports A in practical units of micromol m-2 s-1, not mol m-2 s-1.
The conversion factors are straightforward.
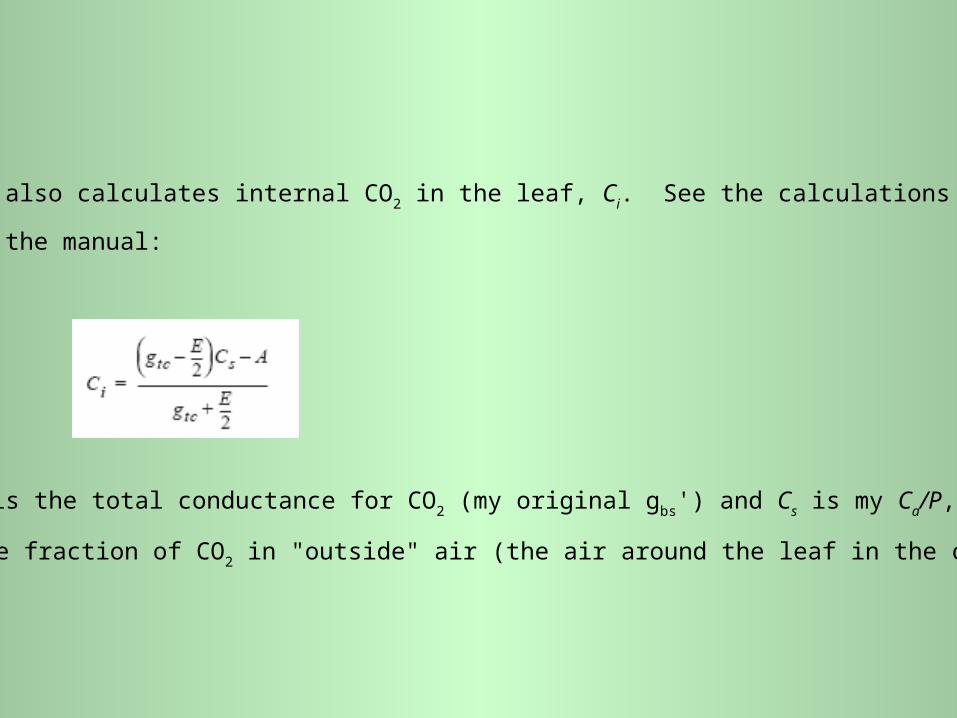
The LI-6400 also calculates internal CO2 in the leaf, Ci. See the calculations on p. 40
of the manual:
Here, gtc is the total conductance for CO2 (my original gbs') and Cs is my Ca/P, the
mole fraction of CO2 in "outside" air (the air around the leaf in the chamber).
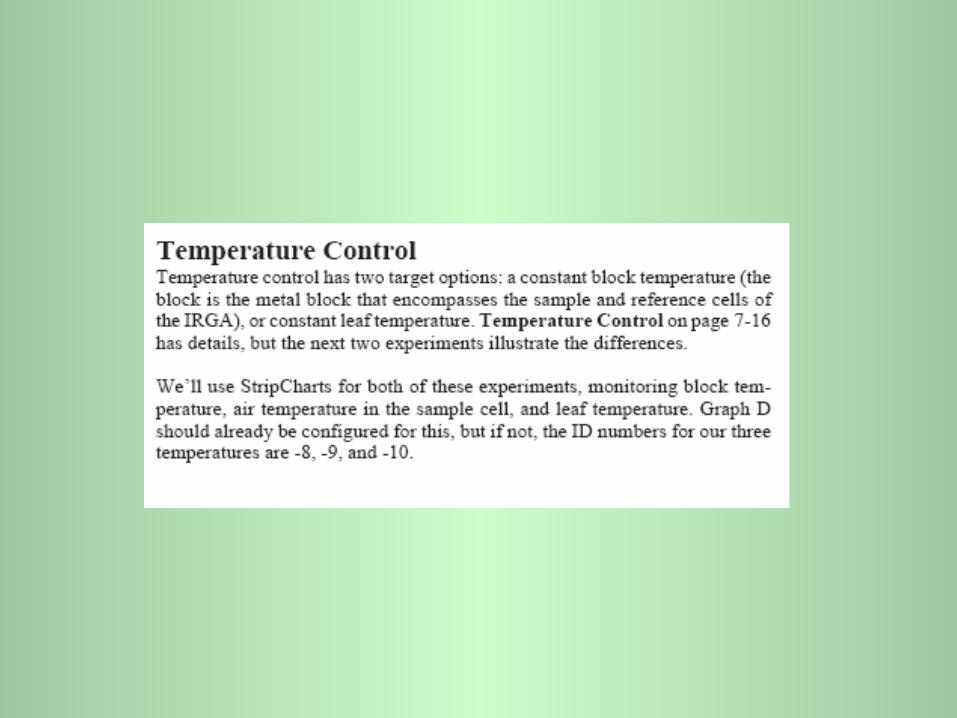
Setting up the physical system, configuring the software, and running the system
These topics are extensive. They are described in the manual in full detail. One needs
hands-on experience over a few hours to really learn this. LI-COR also makes
available software that simulates the operation of the LI-6400.
There are a number of checks to go through. These assure that:
* The IRGA sensors that measure water and CO2 on the sample and reference sides
are balanced, to that the differences recorded between the two side truly
represent the action of leaves (A and E) and not systematic offsets.
* There are no leaks into or out of the cuvette.
* The subsystems to remove water vapor and CO2 are working. To get accurate
readings of the full spans of water vapor and CO2 content, you are asked to
switch in tubes containing magnesium perchlorate (desiccant, to remove water
vapor) or soda lime (scrubber, to remove CO2). If the system fails to read zero
on either water vapor or CO2, then it is likely that the desiccant or the scrubber
is exhausted and must be replaced.
* Electrical connections are good.
* All the sensors are working, such as leaf temperature (not all the checks are
automatic; I found a broken leaf-T sensor once, suspecting it from data readings
and verifying it by touching the thermocouple sensor with my finger to warm it up).
You need to verify that the sensors you have attached are the ones whose
calibration data are stored in the system memory.
* Data are recorded properly.
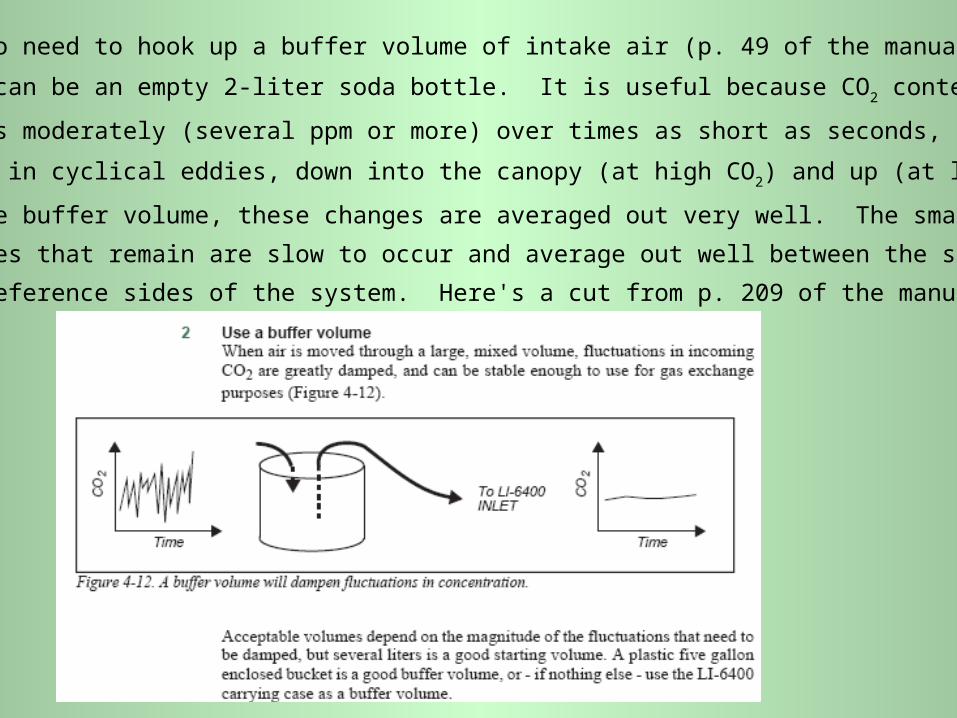
You may also need to hook up a buffer volume of intake air (p. 49 of the manual).
This can be an empty 2-liter soda bottle. It is useful because CO2 content of air
varies moderately (several ppm or more) over times as short as seconds, as air
moves in cyclical eddies, down into the canopy (at high CO2) and up (at lower CO2).
In the buffer volume, these changes are averaged out very well. The small
changes that remain are slow to occur and average out well between the sample
and reference sides of the system. Here's a cut from p. 209 of the manual):
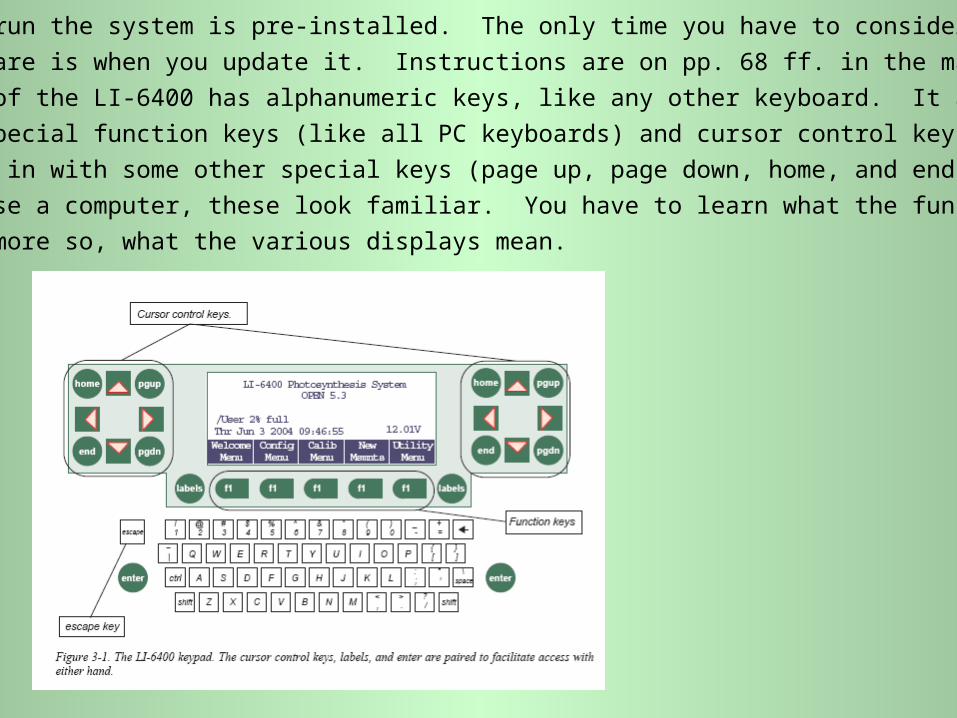
Software to run the system is pre-installed. The only time you have to consider installing
software is when you update it. Instructions are on pp. 68 ff. in the manual.
The console of the LI-6400 has alphanumeric keys, like any other keyboard. It also
has special function keys (like all PC keyboards) and cursor control keys that are
mixed in with some other special keys (page up, page down, home, and end). If
you use a computer, these look familiar. You have to learn what the functions are,
and, more so, what the various displays mean.
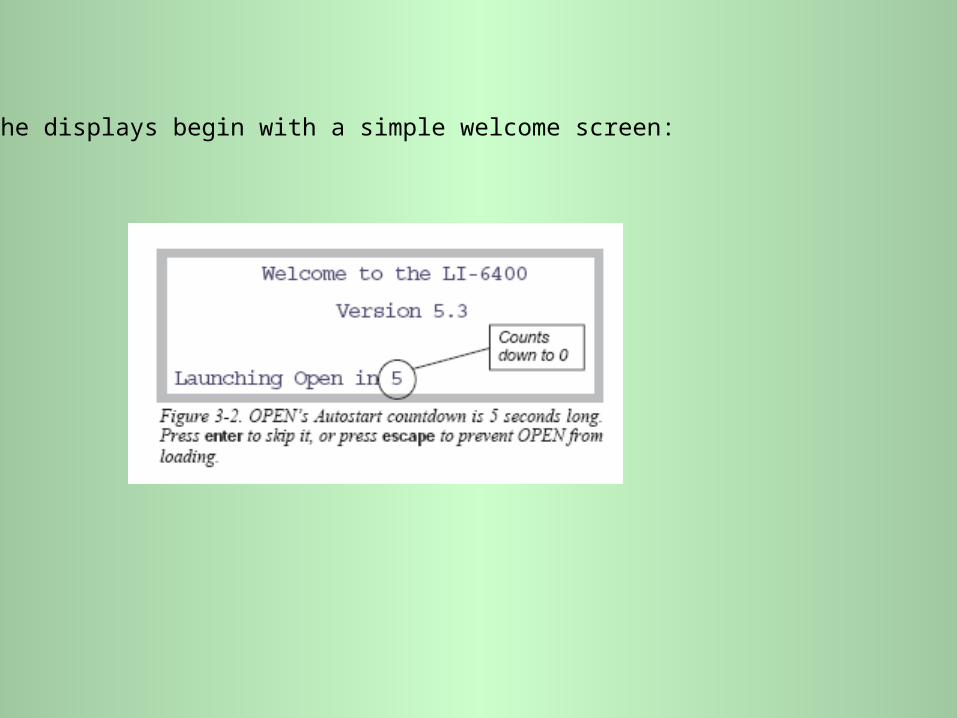
The displays begin with a simple welcome screen:
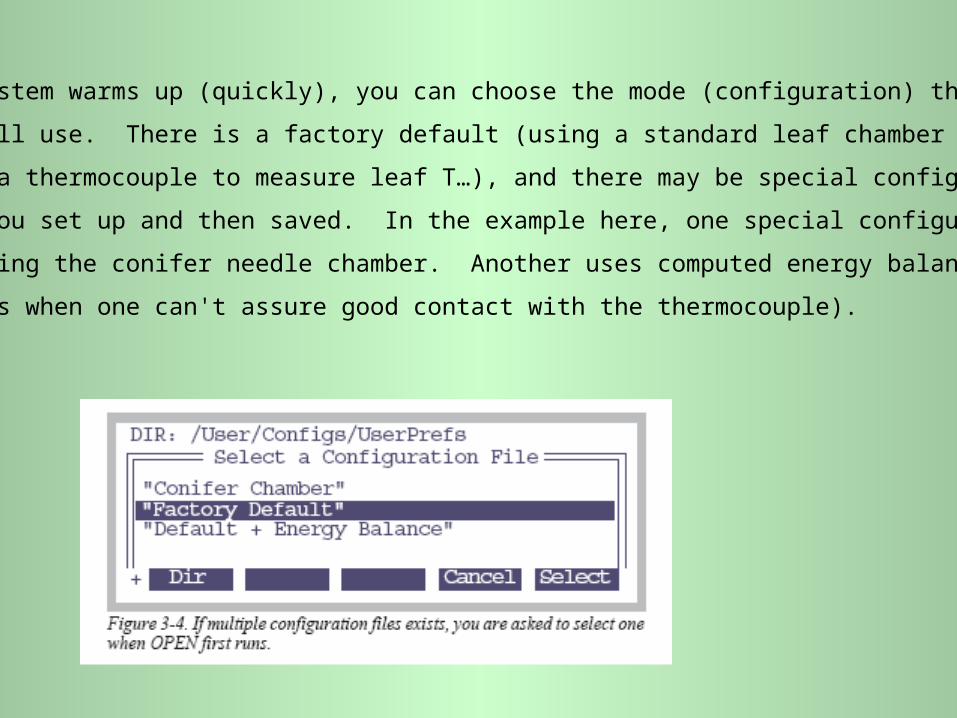
After the system warms up (quickly), you can choose the mode (configuration) that
you will use. There is a factory default (using a standard leaf chamber or cuvette;
using a thermocouple to measure leaf T…), and there may be special configurations
that you set up and then saved. In the example here, one special configuration is
for using the conifer needle chamber. Another uses computed energy balance on
leaves when one can't assure good contact with the thermocouple).
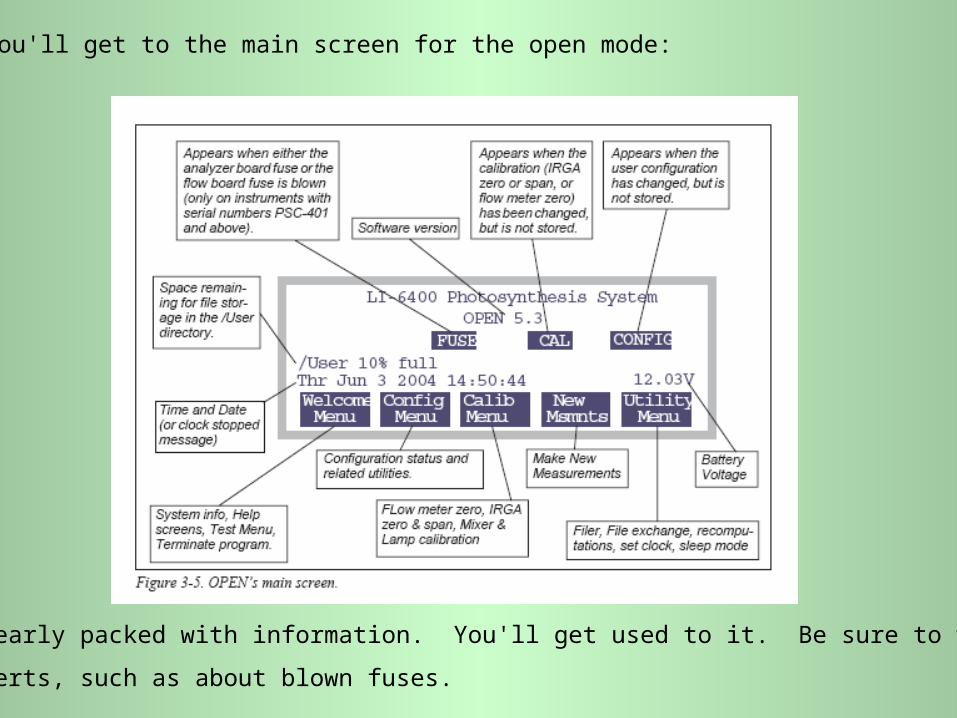
You'll get to the main screen for the open mode:
It is clearly packed with information. You'll get used to it. Be sure to watch for
alerts, such as about blown fuses.
The welcome menu isn't used often, but it tells you about service dates, etc.
The configuration menu lets you set up any special items, such as a different leaf
chamber. Se p. 81 in the manual.
The calibration menu is used every time you start. You have to zero the readings
of the flowmeter, the IRGAs, and any auxiliary devices, such as a CO2 control
system. See p. 82 in the manual.
The utility menu (p. 84) lets you set up communication ports, export and import data,
recalculate data, etc.
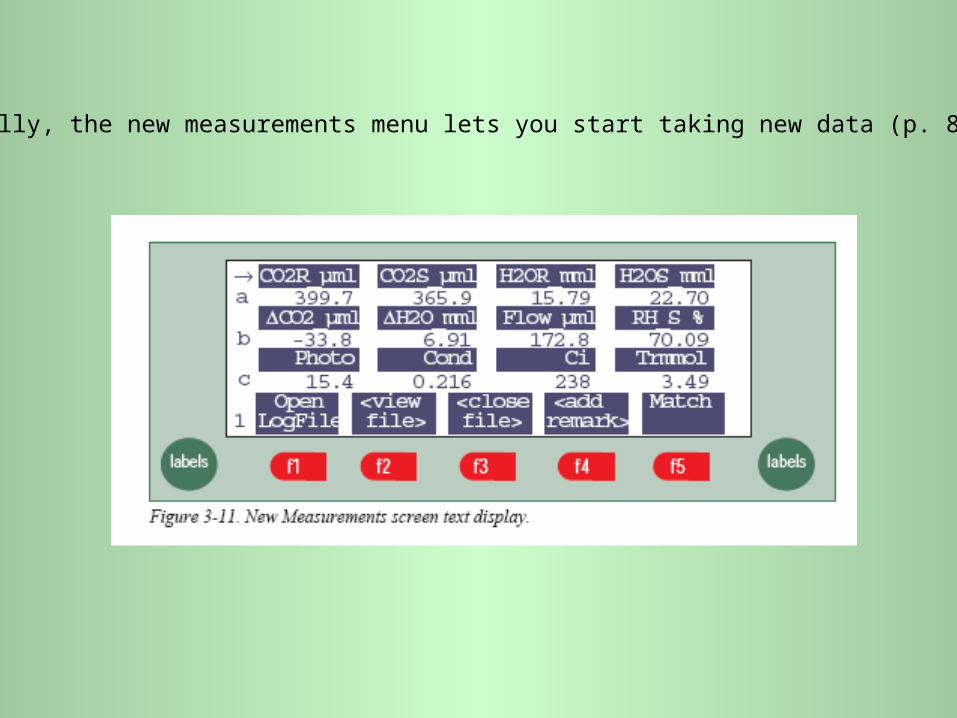
Finally, the new measurements menu lets you start taking new data (p. 85):
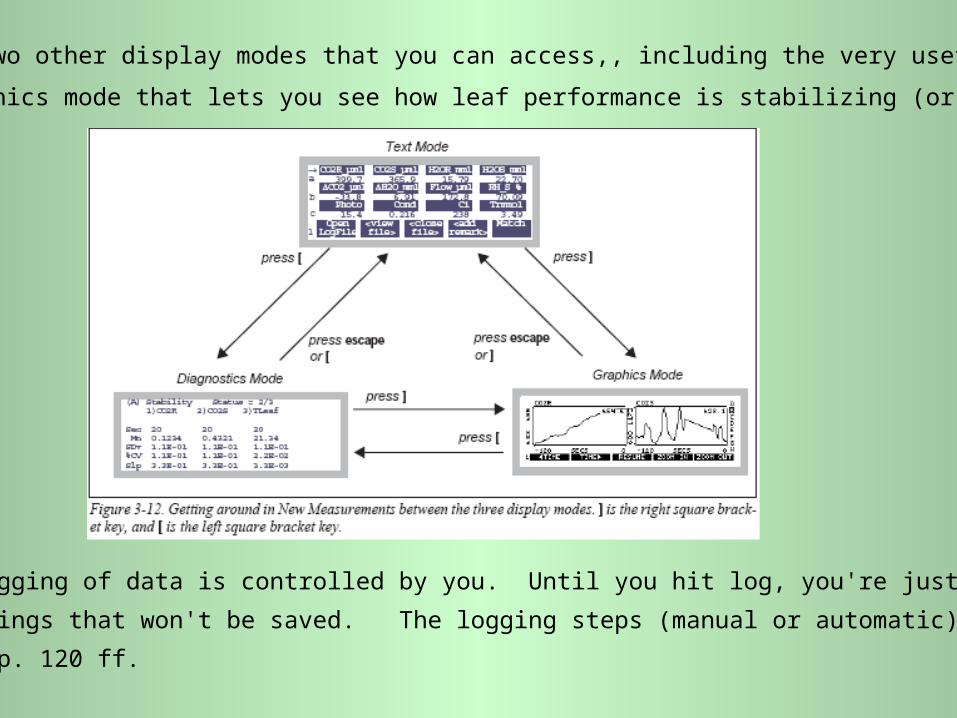
There are two other display modes that you can access,, including the very useful
graphics mode that lets you see how leaf performance is stabilizing (or not!):
Actual logging of data is controlled by you. Until you hit log, you're just monitoring
readings that won't be saved. The logging steps (manual or automatic) are given
on pp. 120 ff.
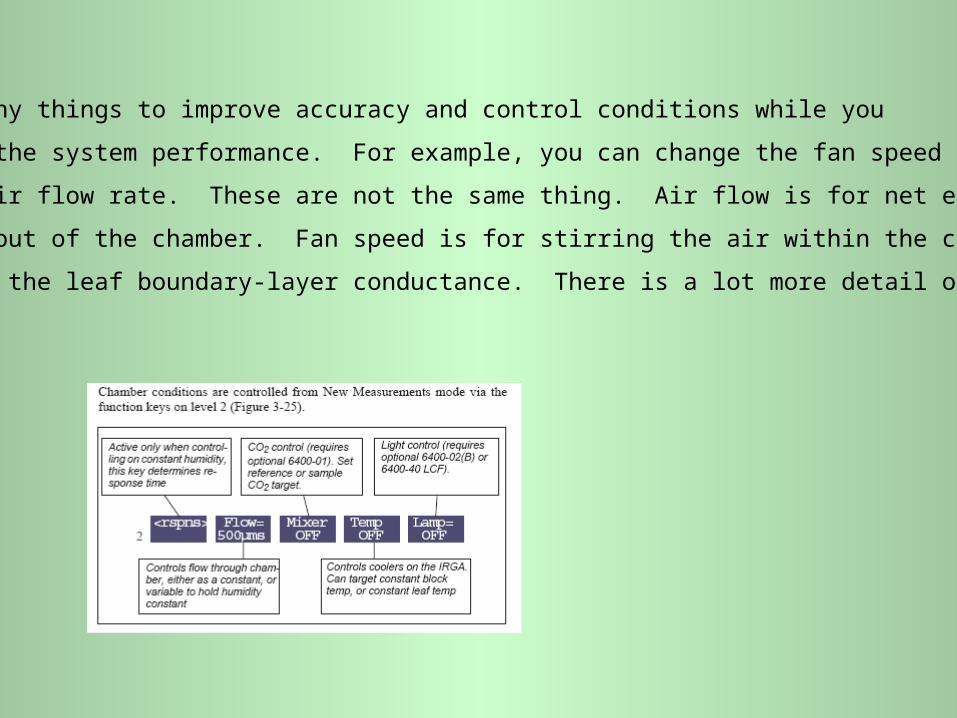
You can do many things to improve accuracy and control conditions while you
examine the system performance. For example, you can change the fan speed
or the air flow rate. These are not the same thing. Air flow is for net exchange
of air, out of the chamber. Fan speed is for stirring the air within the chamber,
to alter the leaf boundary-layer conductance. There is a lot more detail on pp. 99 ff.
You can change which measurements you are viewing and the order in which they
are displayed. For example, you may be most interested in the CO2 difference,
to be sure that it is large enough to be measured accurately but small enough
so that the leaf is operating near the free-air conditions. You can save the
display groups (p. 91).
Finally, you'll have data that you can view, graph, export, and manipulate. See
pp. 122 ff.
The options for further calculations and graphs are remarkable. You even write
programs in LPL language to process data, including from multiple data files
(e.g., you want to determine the Ball-Berry parameters by plotting gs against
the index A hs / Cs from runs under different conditions).
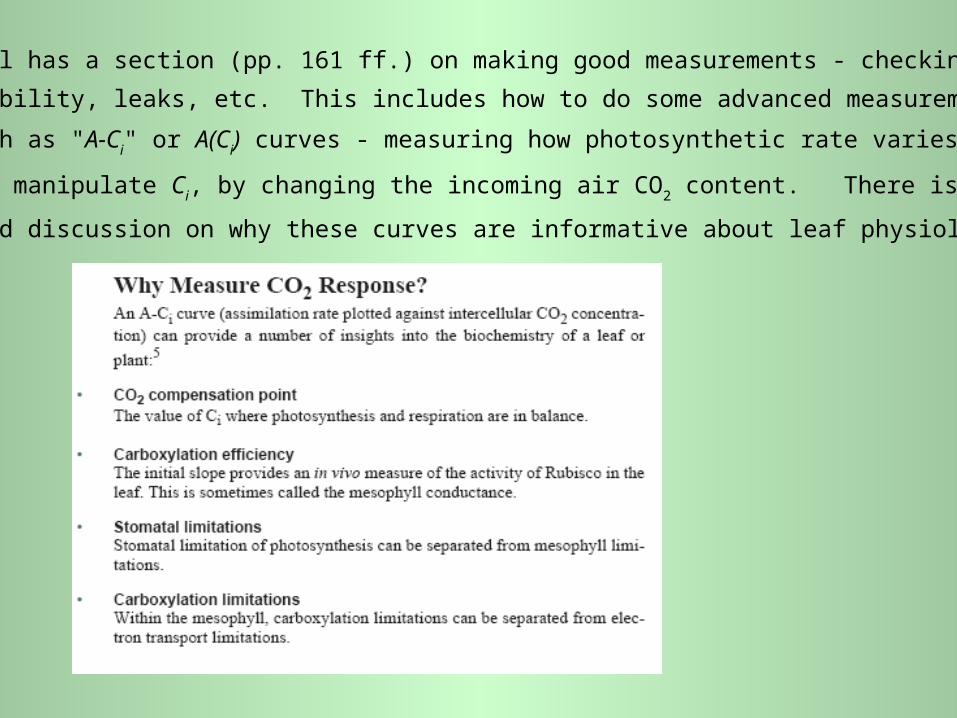
The manual has a section (pp. 161 ff.) on making good measurements - checking
stability, leaks, etc. This includes how to do some advanced measurements,
such as "A-Ci" or A(Ci) curves - measuring how photosynthetic rate varies as
you manipulate Ci, by changing the incoming air CO2 content. There is also a
good discussion on why these curves are informative about leaf physiology:
Another section describes how to measure light response curves, including giving
the leaf time to stabilize at each new light level.
Other details include how the system can correct for remaining diffusive leaks into
or out of the cuvette seals (pp. 203 ff.)
The manual goes on for many more pages, covering everything you need to know.
LI-COR is famous for its great support, in the manuals and on the phone. The
length of the manual (1106 pp.) is an indication that gas exchange is a rich field,
as well as one that needs care in setting up and taking measurements.