Embed Size (px)
Citation preview
WHAT YOU SEE IS WHAT YOU GET: ON VISUALIZING MUSIC
Eric IsaacsonIndiana University School of Music
Department of Music TheoryBloomington, IN 47405 [email protected]
ABSTRACTThough music is fundamentally an aural phenomenon, weoften communicate about music through visual means.The paper examines a number of visualization techniquesdeveloped for music, focusing especially on those devel-oped for music analysis by specialists in the field, but alsolooking at some less successful approaches. It is hopedthat, by presenting them in this way, those in the MIRcommunity will develop a greater awareness of the kindsof musical problems music scholars are concerned with,and might lend a hand toward addressing them
Keywords: visualization, analysis, harmony
1 INTRODUCTIONThough music is fundamentally an aural phenomenon,we very often communicate about music through visualmeans. A musical picture converts the unidirectional timeof a piece of music into a spatially represented dimension.This allows us to view a musical work as if it were a phys-ical object–we can examine it in any order, at any pace,comparing temporally detached events with a simple flitof the eye.
Used in conjunction with a music-theoretically soundconcept of musical structure, pictures can be effectivetools for both discovering and conveying musical infor-mation. Different methods allow us to view snapshots ofa musical work taken from different vantage points. Notool can provide a complete picture of a work, however,so researchers must keep in mind what their goals are, andwhat tools are most appropriate to achieve them.
This has implications for Music Information Retrieval(MIR), because musical visualizations are often direct re-flections of an underlying musical representation, and thechoice of a representation impacts directly on what mu-sical features can be searched. It is important, therefore,
Permission to make digital or hard copies of all or part of thiswork for personal or classroom use is granted without fee pro-vided that copies are not made or distributed for profit or com-mercial advantage and that copies bear this notice and the fullcitation on the first page.
c©2005 Queen Mary, University of London
that researchers consider carefully the underlying repre-sentation and its outwardly expressed visualization whenimplementing music IR tasks. Visual representations havegreat explanatory power. It is also important, however,that they be properly grounded in both musical knowledgeand an understanding of human cognition. When poorlydesigned, or based on an incorrect understanding of theunderlying musical structure, however, they can mislead.
The purpose of this paper is to consider some waysin which musicians and scholars have proposed we pic-ture music and what role they might play in MIR tasks.The paper will focus on visualization approaches that in-volve music analysis, whose aim is to explain or illumi-nate characteristics of a musical work. The techniques dis-cussed touch on several musical features, including pitchand rhythm, form, texture, and structural hierarchies. Thefocus is on Western music–and primarily on art music,though the principles generalize readily to popular mu-sics. Some visualization techniques will be found to beless effective than others. Some of the techniques arealready technology-based, others are carried out strictlymanually. It is hoped that, by presenting them in this way,those in the MIR community will develop a greater aware-ness of the kinds of musical problems music scholars areconcerned with, and might lend a hand toward addressingthem.
2 COMMON MUSIC NOTATIONAlthough not itself analytical, because so much musicanalysis is derived from music notation in some way, itis worth considering first what Western notation does anddoes not represent. So-called Common Music Notation(CMN) traces its origins to the Middle Ages, with a num-ber of important refinements taking place in the Renais-sance, and additional incremental modifications occurringsince then. It developed to more easily preserve the exten-sive plainchant repertoire of the Roman Catholic church,which was previously carried on through oral tradition.The primary purpose of CMN was thus, and in fact stillremains, to facilitate the performance of a musical com-position, by serving as a guide to performers. In much thesame way that the written word allowed languages to becodified and for literature to emerge, the development ofmusic notation facilitated the emergence of the concept ofa musical work–an artefact that could be reliably passed
389
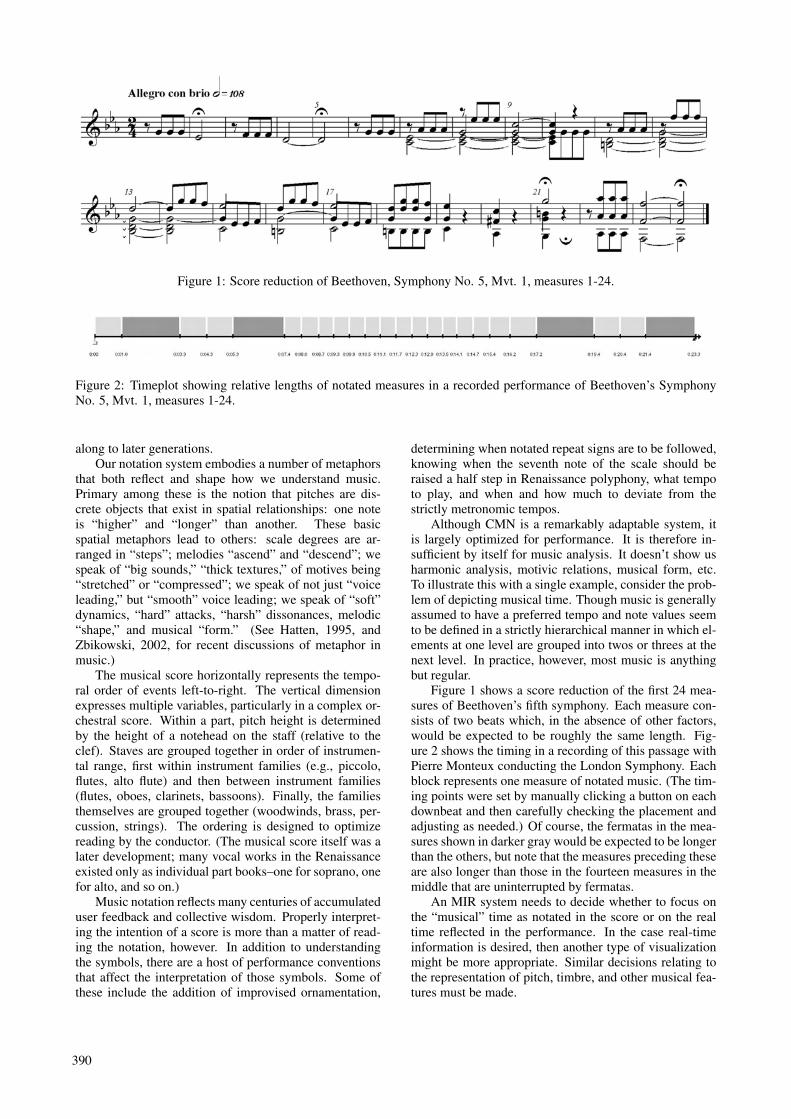
Figure 1: Score reduction of Beethoven, Symphony No. 5, Mvt. 1, measures 1-24.
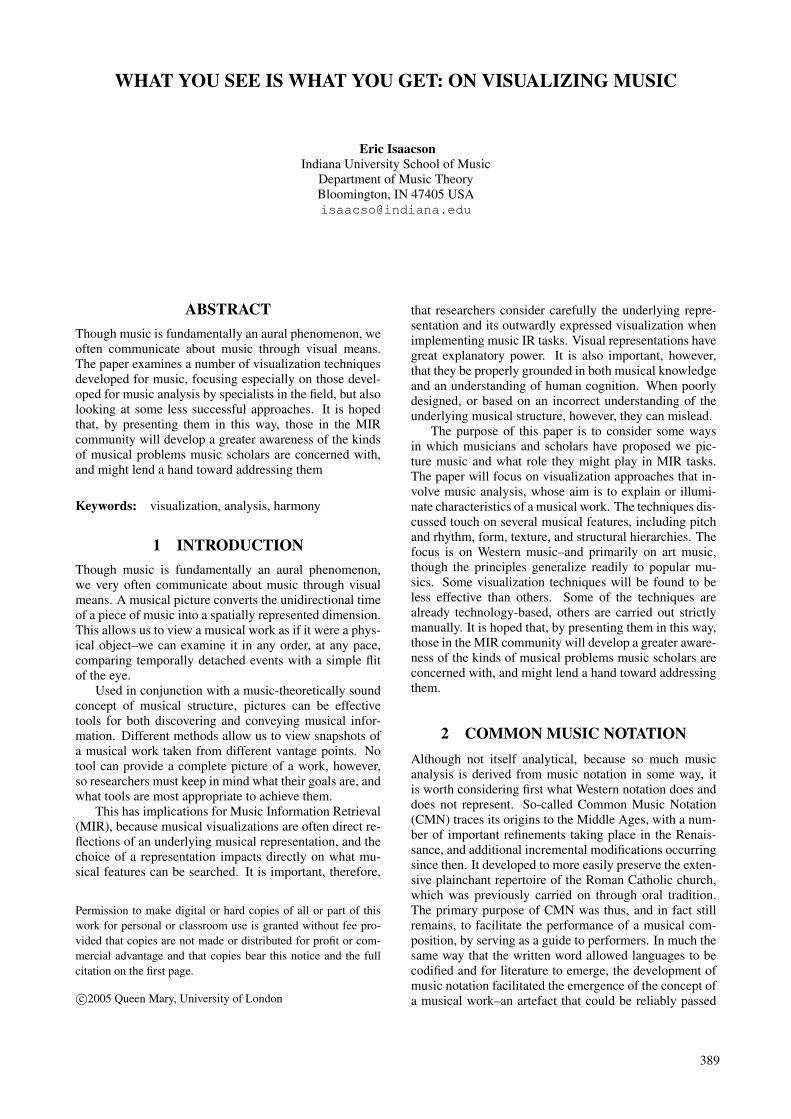
Figure 2: Timeplot showing relative lengths of notated measures in a recorded performance of Beethoven’s SymphonyNo. 5, Mvt. 1, measures 1-24.
along to later generations.Our notation system embodies a number of metaphors
that both reflect and shape how we understand music.Primary among these is the notion that pitches are dis-crete objects that exist in spatial relationships: one noteis “higher” and “longer” than another. These basicspatial metaphors lead to others: scale degrees are ar-ranged in “steps”; melodies “ascend” and “descend”; wespeak of “big sounds,” “thick textures,” of motives being“stretched” or “compressed”; we speak of not just “voiceleading,” but “smooth” voice leading; we speak of “soft”dynamics, “hard” attacks, “harsh” dissonances, melodic“shape,” and musical “form.” (See Hatten, 1995, andZbikowski, 2002, for recent discussions of metaphor inmusic.)
The musical score horizontally represents the tempo-ral order of events left-to-right. The vertical dimensionexpresses multiple variables, particularly in a complex or-chestral score. Within a part, pitch height is determinedby the height of a notehead on the staff (relative to theclef). Staves are grouped together in order of instrumen-tal range, first within instrument families (e.g., piccolo,flutes, alto flute) and then between instrument families(flutes, oboes, clarinets, bassoons). Finally, the familiesthemselves are grouped together (woodwinds, brass, per-cussion, strings). The ordering is designed to optimizereading by the conductor. (The musical score itself was alater development; many vocal works in the Renaissanceexisted only as individual part books–one for soprano, onefor alto, and so on.)
Music notation reflects many centuries of accumulateduser feedback and collective wisdom. Properly interpret-ing the intention of a score is more than a matter of read-ing the notation, however. In addition to understandingthe symbols, there are a host of performance conventionsthat affect the interpretation of those symbols. Some ofthese include the addition of improvised ornamentation,
determining when notated repeat signs are to be followed,knowing when the seventh note of the scale should beraised a half step in Renaissance polyphony, what tempoto play, and when and how much to deviate from thestrictly metronomic tempos.
Although CMN is a remarkably adaptable system, itis largely optimized for performance. It is therefore in-sufficient by itself for music analysis. It doesn’t show usharmonic analysis, motivic relations, musical form, etc.To illustrate this with a single example, consider the prob-lem of depicting musical time. Though music is generallyassumed to have a preferred tempo and note values seemto be defined in a strictly hierarchical manner in which el-ements at one level are grouped into twos or threes at thenext level. In practice, however, most music is anythingbut regular.
Figure 1 shows a score reduction of the first 24 mea-sures of Beethoven’s fifth symphony. Each measure con-sists of two beats which, in the absence of other factors,would be expected to be roughly the same length. Fig-ure 2 shows the timing in a recording of this passage withPierre Monteux conducting the London Symphony. Eachblock represents one measure of notated music. (The tim-ing points were set by manually clicking a button on eachdownbeat and then carefully checking the placement andadjusting as needed.) Of course, the fermatas in the mea-sures shown in darker gray would be expected to be longerthan the others, but note that the measures preceding theseare also longer than those in the fourteen measures in themiddle that are uninterrupted by fermatas.
An MIR system needs to decide whether to focus onthe “musical” time as notated in the score or on the realtime reflected in the performance. In the case real-timeinformation is desired, then another type of visualizationmight be more appropriate. Similar decisions relating tothe representation of pitch, timbre, and other musical fea-tures must be made.
390
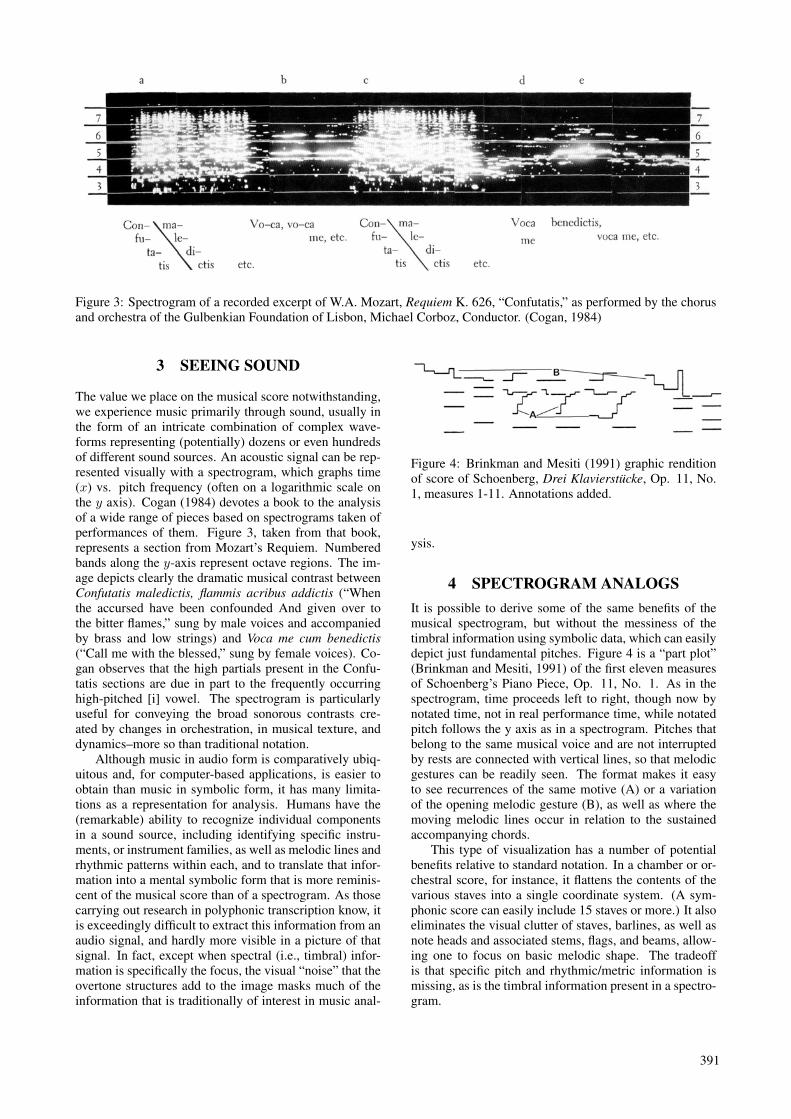
Figure 3: Spectrogram of a recorded excerpt of W.A. Mozart, Requiem K. 626, “Confutatis,” as performed by the chorusand orchestra of the Gulbenkian Foundation of Lisbon, Michael Corboz, Conductor. (Cogan, 1984)
3 SEEING SOUND
The value we place on the musical score notwithstanding,we experience music primarily through sound, usually inthe form of an intricate combination of complex wave-forms representing (potentially) dozens or even hundredsof different sound sources. An acoustic signal can be rep-resented visually with a spectrogram, which graphs time(x) vs. pitch frequency (often on a logarithmic scale onthe y axis). Cogan (1984) devotes a book to the analysisof a wide range of pieces based on spectrograms taken ofperformances of them. Figure 3, taken from that book,represents a section from Mozart’s Requiem. Numberedbands along the y-axis represent octave regions. The im-age depicts clearly the dramatic musical contrast betweenConfutatis maledictis, flammis acribus addictis (“Whenthe accursed have been confounded And given over tothe bitter flames,” sung by male voices and accompaniedby brass and low strings) and Voca me cum benedictis(“Call me with the blessed,” sung by female voices). Co-gan observes that the high partials present in the Confu-tatis sections are due in part to the frequently occurringhigh-pitched [i] vowel. The spectrogram is particularlyuseful for conveying the broad sonorous contrasts cre-ated by changes in orchestration, in musical texture, anddynamics–more so than traditional notation.
Although music in audio form is comparatively ubiq-uitous and, for computer-based applications, is easier toobtain than music in symbolic form, it has many limita-tions as a representation for analysis. Humans have the(remarkable) ability to recognize individual componentsin a sound source, including identifying specific instru-ments, or instrument families, as well as melodic lines andrhythmic patterns within each, and to translate that infor-mation into a mental symbolic form that is more reminis-cent of the musical score than of a spectrogram. As thosecarrying out research in polyphonic transcription know, itis exceedingly difficult to extract this information from anaudio signal, and hardly more visible in a picture of thatsignal. In fact, except when spectral (i.e., timbral) infor-mation is specifically the focus, the visual “noise” that theovertone structures add to the image masks much of theinformation that is traditionally of interest in music anal-
Figure 4: Brinkman and Mesiti (1991) graphic renditionof score of Schoenberg, Drei Klavierstucke, Op. 11, No.1, measures 1-11. Annotations added.
ysis.
4 SPECTROGRAM ANALOGSIt is possible to derive some of the same benefits of themusical spectrogram, but without the messiness of thetimbral information using symbolic data, which can easilydepict just fundamental pitches. Figure 4 is a “part plot”(Brinkman and Mesiti, 1991) of the first eleven measuresof Schoenberg’s Piano Piece, Op. 11, No. 1. As in thespectrogram, time proceeds left to right, though now bynotated time, not in real performance time, while notatedpitch follows the y axis as in a spectrogram. Pitches thatbelong to the same musical voice and are not interruptedby rests are connected with vertical lines, so that melodicgestures can be readily seen. The format makes it easyto see recurrences of the same motive (A) or a variationof the opening melodic gesture (B), as well as where themoving melodic lines occur in relation to the sustainedaccompanying chords.
This type of visualization has a number of potentialbenefits relative to standard notation. In a chamber or or-chestral score, for instance, it flattens the contents of thevarious staves into a single coordinate system. (A sym-phonic score can easily include 15 staves or more.) It alsoeliminates the visual clutter of staves, barlines, as well asnote heads and associated stems, flags, and beams, allow-ing one to focus on basic melodic shape. The tradeoffis that specific pitch and rhythmic/metric information ismissing, as is the timbral information present in a spectro-gram.
391
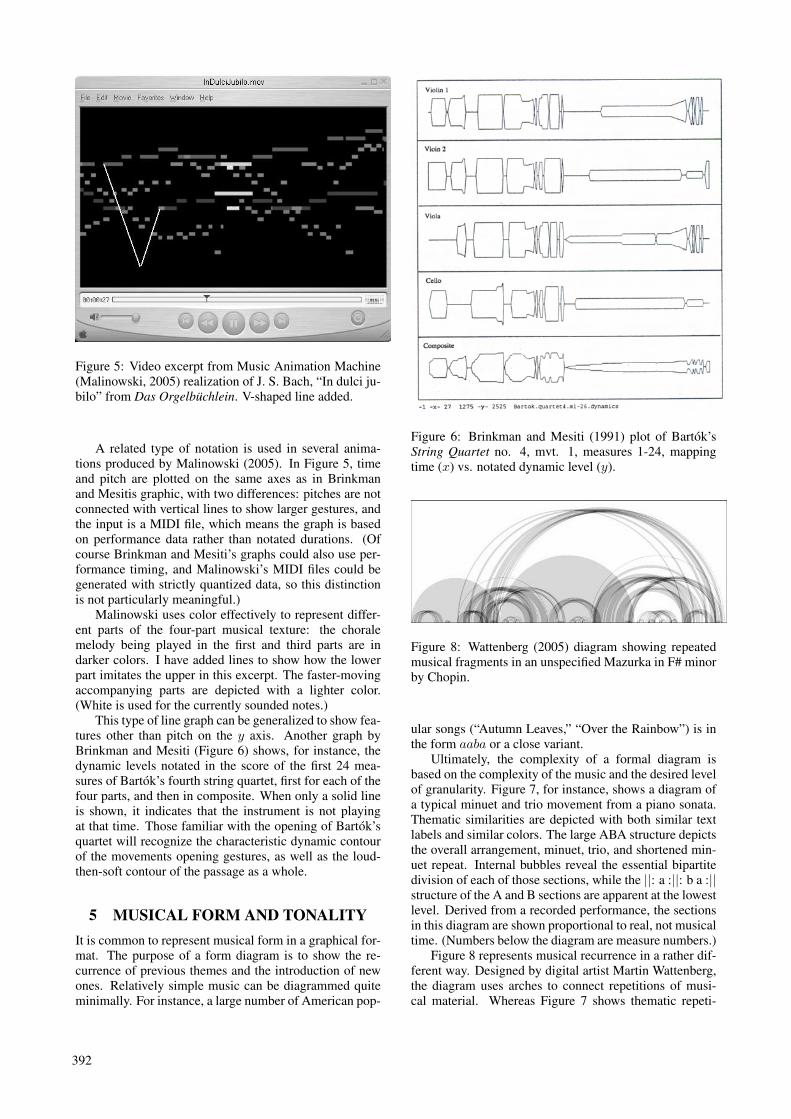
Figure 5: Video excerpt from Music Animation Machine(Malinowski, 2005) realization of J. S. Bach, “In dulci ju-bilo” from Das Orgelbuchlein. V-shaped line added.
A related type of notation is used in several anima-tions produced by Malinowski (2005). In Figure 5, timeand pitch are plotted on the same axes as in Brinkmanand Mesitis graphic, with two differences: pitches are notconnected with vertical lines to show larger gestures, andthe input is a MIDI file, which means the graph is basedon performance data rather than notated durations. (Ofcourse Brinkman and Mesiti’s graphs could also use per-formance timing, and Malinowski’s MIDI files could begenerated with strictly quantized data, so this distinctionis not particularly meaningful.)
Malinowski uses color effectively to represent differ-ent parts of the four-part musical texture: the choralemelody being played in the first and third parts are indarker colors. I have added lines to show how the lowerpart imitates the upper in this excerpt. The faster-movingaccompanying parts are depicted with a lighter color.(White is used for the currently sounded notes.)
This type of line graph can be generalized to show fea-tures other than pitch on the y axis. Another graph byBrinkman and Mesiti (Figure 6) shows, for instance, thedynamic levels notated in the score of the first 24 mea-sures of Bartok’s fourth string quartet, first for each of thefour parts, and then in composite. When only a solid lineis shown, it indicates that the instrument is not playingat that time. Those familiar with the opening of Bartok’squartet will recognize the characteristic dynamic contourof the movements opening gestures, as well as the loud-then-soft contour of the passage as a whole.
5 MUSICAL FORM AND TONALITYIt is common to represent musical form in a graphical for-mat. The purpose of a form diagram is to show the re-currence of previous themes and the introduction of newones. Relatively simple music can be diagrammed quiteminimally. For instance, a large number of American pop-
Figure 6: Brinkman and Mesiti (1991) plot of Bartok’sString Quartet no. 4, mvt. 1, measures 1-24, mappingtime (x) vs. notated dynamic level (y).
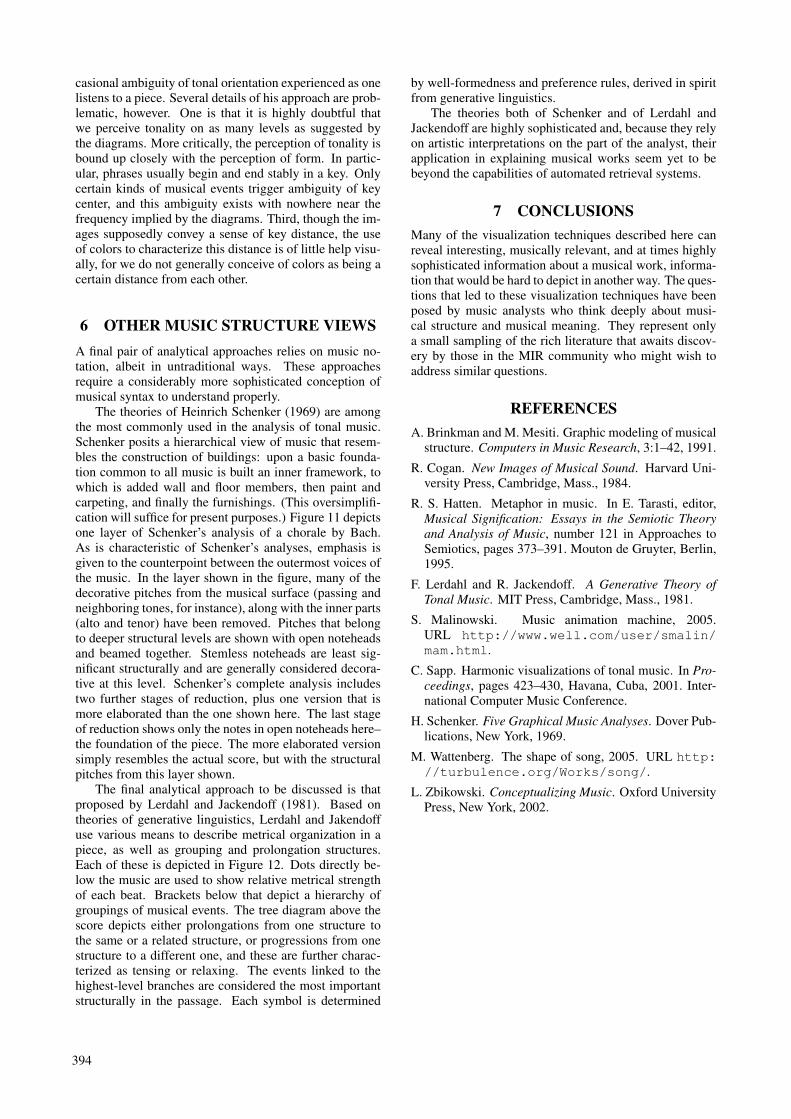
Figure 8: Wattenberg (2005) diagram showing repeatedmusical fragments in an unspecified Mazurka in F# minorby Chopin.
ular songs (“Autumn Leaves,” “Over the Rainbow”) is inthe form aaba or a close variant.
Ultimately, the complexity of a formal diagram isbased on the complexity of the music and the desired levelof granularity. Figure 7, for instance, shows a diagram ofa typical minuet and trio movement from a piano sonata.Thematic similarities are depicted with both similar textlabels and similar colors. The large ABA structure depictsthe overall arrangement, minuet, trio, and shortened min-uet repeat. Internal bubbles reveal the essential bipartitedivision of each of those sections, while the ||: a :||: b a :||structure of the A and B sections are apparent at the lowestlevel. Derived from a recorded performance, the sectionsin this diagram are shown proportional to real, not musicaltime. (Numbers below the diagram are measure numbers.)
Figure 8 represents musical recurrence in a rather dif-ferent way. Designed by digital artist Martin Wattenberg,the diagram uses arches to connect repetitions of musi-cal material. Whereas Figure 7 shows thematic repeti-
392
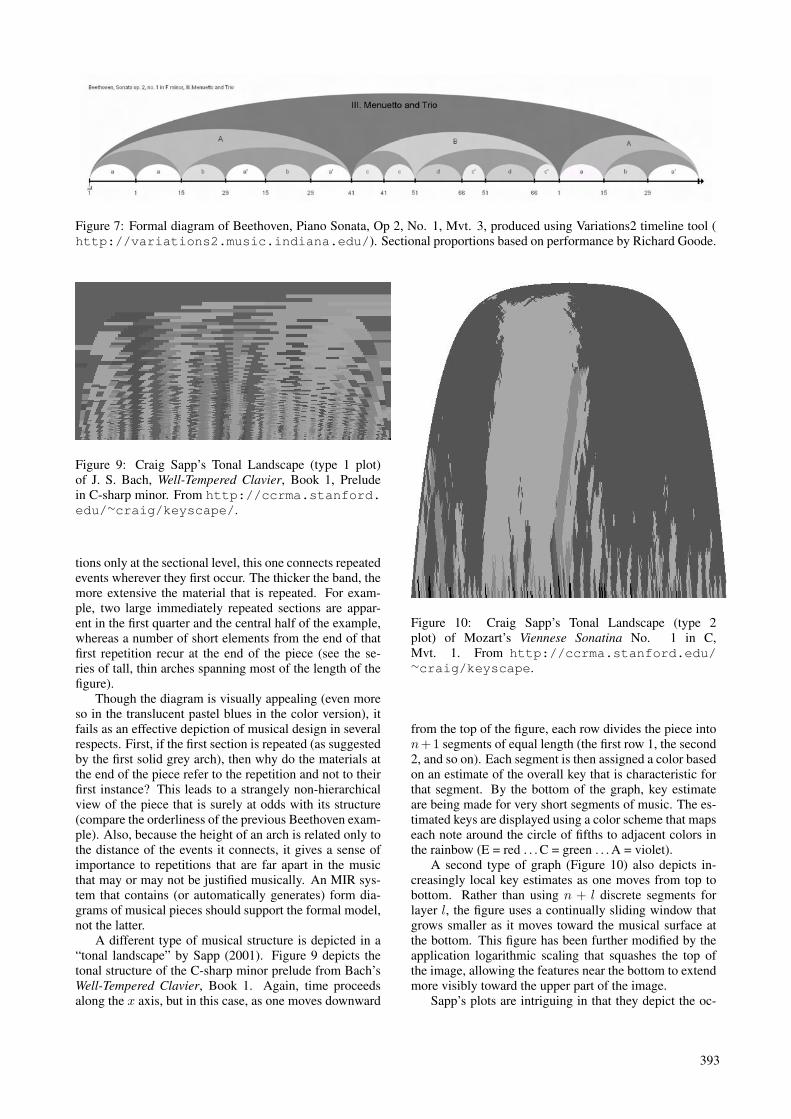
Figure 7: Formal diagram of Beethoven, Piano Sonata, Op 2, No. 1, Mvt. 3, produced using Variations2 timeline tool (http://variations2.music.indiana.edu/). Sectional proportions based on performance by Richard Goode.
Figure 9: Craig Sapp’s Tonal Landscape (type 1 plot)of J. S. Bach, Well-Tempered Clavier, Book 1, Preludein C-sharp minor. From http://ccrma.stanford.edu/∼craig/keyscape/.
tions only at the sectional level, this one connects repeatedevents wherever they first occur. The thicker the band, themore extensive the material that is repeated. For exam-ple, two large immediately repeated sections are appar-ent in the first quarter and the central half of the example,whereas a number of short elements from the end of thatfirst repetition recur at the end of the piece (see the se-ries of tall, thin arches spanning most of the length of thefigure).
Though the diagram is visually appealing (even moreso in the translucent pastel blues in the color version), itfails as an effective depiction of musical design in severalrespects. First, if the first section is repeated (as suggestedby the first solid grey arch), then why do the materials atthe end of the piece refer to the repetition and not to theirfirst instance? This leads to a strangely non-hierarchicalview of the piece that is surely at odds with its structure(compare the orderliness of the previous Beethoven exam-ple). Also, because the height of an arch is related only tothe distance of the events it connects, it gives a sense ofimportance to repetitions that are far apart in the musicthat may or may not be justified musically. An MIR sys-tem that contains (or automatically generates) form dia-grams of musical pieces should support the formal model,not the latter.
A different type of musical structure is depicted in a“tonal landscape” by Sapp (2001). Figure 9 depicts thetonal structure of the C-sharp minor prelude from Bach’sWell-Tempered Clavier, Book 1. Again, time proceedsalong the x axis, but in this case, as one moves downward
Figure 10: Craig Sapp’s Tonal Landscape (type 2plot) of Mozart’s Viennese Sonatina No. 1 in C,Mvt. 1. From http://ccrma.stanford.edu/∼craig/keyscape.
from the top of the figure, each row divides the piece inton+1 segments of equal length (the first row 1, the second2, and so on). Each segment is then assigned a color basedon an estimate of the overall key that is characteristic forthat segment. By the bottom of the graph, key estimateare being made for very short segments of music. The es-timated keys are displayed using a color scheme that mapseach note around the circle of fifths to adjacent colors inthe rainbow (E = red . . . C = green . . . A = violet).
A second type of graph (Figure 10) also depicts in-creasingly local key estimates as one moves from top tobottom. Rather than using n + l discrete segments forlayer l, the figure uses a continually sliding window thatgrows smaller as it moves toward the musical surface atthe bottom. This figure has been further modified by theapplication logarithmic scaling that squashes the top ofthe image, allowing the features near the bottom to extendmore visibly toward the upper part of the image.
Sapp’s plots are intriguing in that they depict the oc-
393
casional ambiguity of tonal orientation experienced as onelistens to a piece. Several details of his approach are prob-lematic, however. One is that it is highly doubtful thatwe perceive tonality on as many levels as suggested bythe diagrams. More critically, the perception of tonality isbound up closely with the perception of form. In partic-ular, phrases usually begin and end stably in a key. Onlycertain kinds of musical events trigger ambiguity of keycenter, and this ambiguity exists with nowhere near thefrequency implied by the diagrams. Third, though the im-ages supposedly convey a sense of key distance, the useof colors to characterize this distance is of little help visu-ally, for we do not generally conceive of colors as being acertain distance from each other.
6 OTHER MUSIC STRUCTURE VIEWSA final pair of analytical approaches relies on music no-tation, albeit in untraditional ways. These approachesrequire a considerably more sophisticated conception ofmusical syntax to understand properly.
The theories of Heinrich Schenker (1969) are amongthe most commonly used in the analysis of tonal music.Schenker posits a hierarchical view of music that resem-bles the construction of buildings: upon a basic founda-tion common to all music is built an inner framework, towhich is added wall and floor members, then paint andcarpeting, and finally the furnishings. (This oversimplifi-cation will suffice for present purposes.) Figure 11 depictsone layer of Schenker’s analysis of a chorale by Bach.As is characteristic of Schenker’s analyses, emphasis isgiven to the counterpoint between the outermost voices ofthe music. In the layer shown in the figure, many of thedecorative pitches from the musical surface (passing andneighboring tones, for instance), along with the inner parts(alto and tenor) have been removed. Pitches that belongto deeper structural levels are shown with open noteheadsand beamed together. Stemless noteheads are least sig-nificant structurally and are generally considered decora-tive at this level. Schenker’s complete analysis includestwo further stages of reduction, plus one version that ismore elaborated than the one shown here. The last stageof reduction shows only the notes in open noteheads here–the foundation of the piece. The more elaborated versionsimply resembles the actual score, but with the structuralpitches from this layer shown.
The final analytical approach to be discussed is thatproposed by Lerdahl and Jackendoff (1981). Based ontheories of generative linguistics, Lerdahl and Jakendoffuse various means to describe metrical organization in apiece, as well as grouping and prolongation structures.Each of these is depicted in Figure 12. Dots directly be-low the music are used to show relative metrical strengthof each beat. Brackets below that depict a hierarchy ofgroupings of musical events. The tree diagram above thescore depicts either prolongations from one structure tothe same or a related structure, or progressions from onestructure to a different one, and these are further charac-terized as tensing or relaxing. The events linked to thehighest-level branches are considered the most importantstructurally in the passage. Each symbol is determined
by well-formedness and preference rules, derived in spiritfrom generative linguistics.
The theories both of Schenker and of Lerdahl andJackendoff are highly sophisticated and, because they relyon artistic interpretations on the part of the analyst, theirapplication in explaining musical works seem yet to bebeyond the capabilities of automated retrieval systems.
7 CONCLUSIONSMany of the visualization techniques described here canreveal interesting, musically relevant, and at times highlysophisticated information about a musical work, informa-tion that would be hard to depict in another way. The ques-tions that led to these visualization techniques have beenposed by music analysts who think deeply about musi-cal structure and musical meaning. They represent onlya small sampling of the rich literature that awaits discov-ery by those in the MIR community who might wish toaddress similar questions.
REFERENCESA. Brinkman and M. Mesiti. Graphic modeling of musical
structure. Computers in Music Research, 3:1–42, 1991.
R. Cogan. New Images of Musical Sound. Harvard Uni-versity Press, Cambridge, Mass., 1984.
R. S. Hatten. Metaphor in music. In E. Tarasti, editor,Musical Signification: Essays in the Semiotic Theoryand Analysis of Music, number 121 in Approaches toSemiotics, pages 373–391. Mouton de Gruyter, Berlin,1995.
F. Lerdahl and R. Jackendoff. A Generative Theory ofTonal Music. MIT Press, Cambridge, Mass., 1981.
S. Malinowski. Music animation machine, 2005.URL http://www.well.com/user/smalin/mam.html.
C. Sapp. Harmonic visualizations of tonal music. In Pro-ceedings, pages 423–430, Havana, Cuba, 2001. Inter-national Computer Music Conference.
H. Schenker. Five Graphical Music Analyses. Dover Pub-lications, New York, 1969.
M. Wattenberg. The shape of song, 2005. URL http://turbulence.org/Works/song/.
L. Zbikowski. Conceptualizing Music. Oxford UniversityPress, New York, 2002.
394
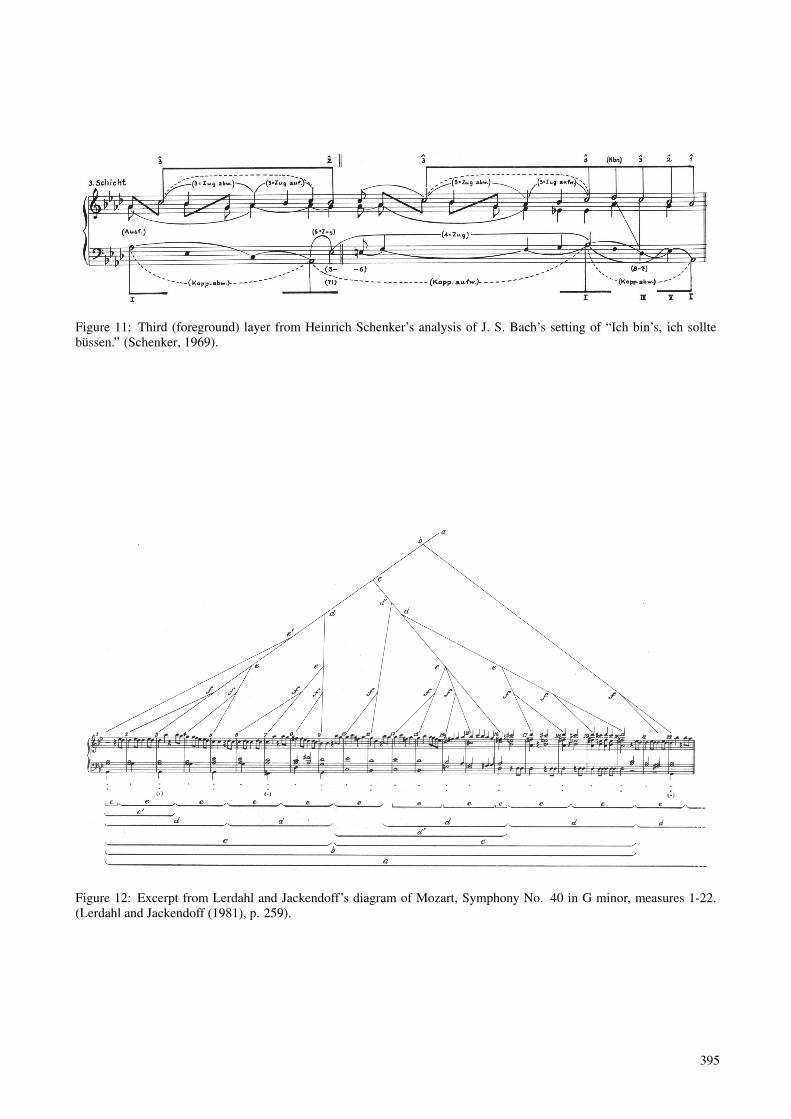
Figure 11: Third (foreground) layer from Heinrich Schenker’s analysis of J. S. Bach’s setting of “Ich bin’s, ich solltebussen.” (Schenker, 1969).
Figure 12: Excerpt from Lerdahl and Jackendoff’s diagram of Mozart, Symphony No. 40 in G minor, measures 1-22.(Lerdahl and Jackendoff (1981), p. 259).
395