Embed Size (px)
Citation preview

April 2015 PIIE Briefi ng 15-2
RAISING LOWER-LEVEL WAGES:
WHEN AND WHY IT MAKES ECONOMIC SENSE
CONTENTS
INTRODUCTION 3
US COMPANIES PAY WELL AND DO BETTER 4ADAM S. POSEN
HIGHER WAGES FOR LOW-INCOME WORKERS LEAD TO HIGHER PRODUCTIVITY 6JUSTIN WOLFERS AND JAN ZILINSKY
EFFECT OF LARGE CORPORATIONS RAISING WAGES OF LOW-PAID WORKERS 9TOMAS HELLEBRANDT
RAISING THE US WAGE FLOOR: THE INTERNATIONAL PERSPECTIV E 11JACOB FUNK KIRKEGAARD AND TYLER MORAN
HOW RAISING WAGES OF LOW-PAID WORKERS AT LARGE CORPORATIONS WOULD AFFECT 16 INCOME INEQUALITYTOMAS HELLEBRANDT
THE EFFECTS OF A WAGE INCREASE BY LARGE CORPORATIONS ON THE MACROECONOMY 19MICHAEL JARAND
INCOME INEQUALITY DEVELOPMENTS IN THE GREAT RECESSION 21TOMAS HELLEBRANDT
JOB CREATION AND A HEALTHY US ECONOMY 40JUSTIN WOLFERS
Copyright © 2015 by the Peterson Institute for International Economics.
The Peterson Institute for International Economics is a private, nonprofi t institution for rigorous, intellectually open, and indepth study and discussion of international economic policy. Its purpose is to identify and analyze important issues to make globalization benefi cial and sustainable for the people of the United States and the world, and then to develop and communicate practical new approaches for dealing with them. The Institute is widely viewed as nonpartisan. Its work is funded by a highly diverse group of philanthropic foundations, private corporations, and interested individuals, as well as income on its capital fund. About 35 percent of the Institute’s resources in its latest fi scal year were provided by contributors from outside the United States. A list of all fi nancial supporters for the preceding four years is posted at http://piie.com/supporters.cfm. This PIIE Briefi ng is part of the Institute’s project on Inequality and Inclusive Capitalism, which is partially supported by a major grant from the ERANDA Foundation.
Aetna, a company that voluntarily raised the pay of its lowest-wage workers in January 2015, is a supporter of the Peterson Institute for International Economics, and its CEO, Mark Bertolini, is a member of the Institute’s Board of Directors. None of this research is intended to address the implications for Aetna itself or for any specifi c company or sector. In keeping with Institute research practices, Aetna has not participated in the preparation of this research and analysis. Neither Aetna nor its employees reviewed its conclusions prior to publication.

3 PIIE BRIEFING 15-2
INTRODUCTION
As the United States emerges from the Great Recession, concern is rising nationally over the issues of income inequality, stagnation of workers’ wages, and especially the struggles of lower-skilled workers at the bottom end of the wage scale. While Washington deliberates legislation raising the minimum wage, a number of major American employers—for example, Aetna and Walmart—have begun to voluntarily raise the pay of their own lowest-paid employees.
In this collection of essays, economists from the Peterson Institute for International Economics analyze the potential benefi ts and costs of widespread wage increases, if adopted by a range of US private employers. They make this assessment for the workers, the companies, and for the US economy as a whole, including such an initiative’s effects on national competitiveness. These economists conclude that raising the pay of many of the lowest-paid US private-sector workers would not only reduce income inequality but also boost overall productivity growth, with likely minimal effect on employment in the current fi nancial context.
“It is possible to profi t from paying your employees well…and increasing lower-paid workers’ wages is the way forward for the United States,” argues Adam S. Posen in his lead essay (reprinted from the Financial Times). Justin Wolfers and Jan Zilinsky argue that higher wages can encourage low-paid workers to be more produc-tive and loyal to their employers and coworkers, reducing costly job turnover and the need for supervision and training of new workers. Tomas Hellebrandt estimates that if all large private sector corporations in the United States outside of sectors that intensively use low-skilled labor increased wages of their low-paid workers to $16 per hour, the pay of 6.2 percent of the $110 million private-sector workers in the United States would increase on average by 38.6 percent. The direct cost to employers would be $51 billion, only around 0.3 percent of GDP. Jacob Kirkegaard and Tyler Moran explore the experience of employers in other advanced countries, with im-plications for international competitiveness, and Michael Jarand assesses the impact of a wage increase on the near-term development of the US macroeconomy.

4 PIIE BRIEFING 15-2
US COMPANIES PAY WELL AND DO BETTER
ADAM S. POSEN
Op-ed in the Financial Times: The Exchange, February 20, 2015.
© Financial Times
Did Christmas come late? Yesterday, Walmart was the latest major American employer to voluntarily announce a raise for all of its lowest-paid employees. In mid-January, Aetna raised all of its employees’ wages to at least $16 an hour. Actually, these companies initiatives are more rational strategies than gifts of reformed Scrooges. It is possible to profi t from paying your employees well—and it is probable that increasing lower-paid workers› wages is the way forward for the United States .
For decades, labor economists have gathered evidence on the power of “effi ciency wages.” Higher wages can motivate employees to work harder, to treat customers better, make them more reluctant to leave their jobs, and help them to bring fewer worries and distractions to work. That can increase productivity and reduce an employer’s costs associated with worker supervision and turnover. Snobbery and current wage disparities favoring the highly-educated should not blind us to the fact that all jobs can be done better or worse, and that lower-paid workers respond to incentives other than just fear of losing their jobs.
It is possible to profi t from paying your employees well—and it is probable that increasing lower-paid workers wages is the way forward for the United States.
This is not just a relative wage story. Of course, companies that move fi rst to raise wages in a given indus-try or occupational class will attract the better employees out of those available. And companies with reputa-tional problems may improve their standing, and thus their sales, by being more humane. But the productivity impact of reducing turnover and shirking will hold even for the workforces of late adopters.
This is also not just a minimum wage story—though that applies somewhat in Walmart’s case. Most minimum wage employees in the United States are the very young, part-time, or sporadically employed. The effi ciency wage story is primarily about motivating and retaining the working poor, those who are longer-term employees who want a stable arrangement.
As a result, voluntary wage increases for the lower-skilled could be scalable for a wide range of companies, industries, and jobs. If done broadly, it would involve roughly six percent of the 110 million private-sector workers in the United States—all those paid low but above-minimum hourly wages, and those who work in larger companies where labor is not the only signifi cant production cost.
The Peterson Institute for International Economics estimates that the direct cost to employers of such a widespread wage increase to $16/hour would be only $51 billion, or 0.3 percent of GDP, as compared to the
ADAM S. POSEN is the president of the Peterson Institute for International Economics. This op-ed has been reprinted with permission.
5 PIIE BRIEFING 15-2
4.5 percent increase in the capital share of US GDP since 2000. For the six and a half million affected work-ers, however, that would still represent an increase in pay of over 38 percent, on average. The direct cost to employers, meanwhile, would be offset either entirely or in part by the increase in productivity and decrease in employee turnover—that’s why such initiatives are voluntary and would only be applied in industries for which the move makes sense—like the increasingly customer facing Aetna and Walmart.
Not being a Christmas miracle, effi cient wage increases will not solve all current economic problems. Fordist fantasies that paying a higher wage would meaningfully stimulate increased purchases, for example, have to be left aside, with the numbers involved too small to move aggregate demand much. Nor will such initiatives take the place of needed training to make sure workers have the profi ciencies to take advantage of the job opportunities that arise—motivation is no substitute for technical skills. The shortfall of long-term investment in the United States, public and private, cannot be made up for with low-skilled labor.
Yet, private sector leadership in increasing wages for the low-skilled will have a far greater benefi cial im-pact than the government legislating a higher minimum wage (though I support that, too, for simple human reasons). It will benefi t more workers and, because it will encourage higher productivity, it will have little or no cost in reduced employment. That may explain why countries whose lower-skilled workers are paid relatively better have higher (not lower) employment rates. As it will be undertaken voluntarily, it will be implemented only in those companies and industries where it makes sense for productivity. Most of all, it will increase the dignity and security of workers as workers directly, whereas post-tax redistribution can only improve income. We should encourage and expect more US companies to start doing well by paying well.
6 PIIE BRIEFING 15-2
Economists have long argued that increases in worker pay can lead to improvements in productivity—indeed, that it can actually be profi table to pay workers higher wages. As Alfred Marshall, the father of modern eco-nomics, argued almost 125 years ago, “any change in the distribution of wealth which gives more to the wage receivers and less to the capitalists is likely, other things being equal, to hasten the increase of material pro-duction.” Since then, economists have compiled rich data validating Marshall’s hypothesis that paying higher wages generates savings:
Higher wages motivate employees to work harder. Janet Yellen (1984) suggested that higher wages create the conditions for workers to be more productive, pointing to “reduced shirking by employees due to a higher cost of job loss; lower turnover; an improvement in the average quality of job applicants and improved mo-rale.” Among the studies documenting this point are Levine (1992), which analyzed a sample of large (mostly Fortune 500) manufacturing companies, and Holzer (1990), which used data from a national sample of fi rms fi nding that “high-wage fi rms can sometimes offset more than half of their higher wage costs through im-proved productivity and lower hiring and turnover cost.” Reich et al. (2003) surveyed employers at the San Francisco airport after a broad-based increase in wages and found that the employers of the majority of af-fected workers reported that their overall performance had improved. Mas (2006) analyzed the case of New Jersey police offi cers who were granted a wage increase of 17 percent, and who were 12 percent more productive in clearing cases than those who were refused the increase.
Higher wages attract more capable and productive workers. The evidence that higher wages attract more high quality applicants for new jobs is voluminous. Dal Bó et al. (2013) show that offering higher salaries yielded an applicant pool with a higher IQ and with personality scores and motivation that made them a bet-ter fi t for the advertised jobs. Moreover, the fi rst fi rm to offer higher wages is more likely to attract and retain more productive workers.
Higher wages lead to lower turnover, reducing the costs of hiring and training new workers. Reich et al. (2003) calculated that typical turnover costs exceed $4,000 for each worker and that an increase in wages at the San Francisco airport led to a decline in turnover of 34 percent, yielding turnover-related savings of $6.6 million per year. Dube et al. (2007) found that when a San Francisco living wage ordinance raised wages among low-paid workers, those workers were more likely to stay with their employers. Reich and his coauthors also documented a stunning turnover rate of nearly 95 percent per year among security screeners in mid-2000,
HIGHER WAGES FOR LOW-INCOME WORKERS LEAD TO HIGHER PRODUCTIVITY
JUSTIN WOLFERS AND JAN ZILINSKY
JUSTIN WOLFERS is senior fellow at the Peterson Institute for International Economics (PIIE) . JAN ZILINSKY is a research analyst at the Peterson Institute for International Economics. This article appeared on PIIE’s blog RealTime Economic Issues Watch, January 13, 2015.
7 PIIE BRIEFING 15-2
which fell to 18.7 percent when pay improved. Fairris et al. (2005) examined evidence from Los Angeles, fi nding that when employers were directed to offer higher wages, the decline in worker turnover yielded savings equal to around one-sixth of the cost incurred.
Higher wages enhance quality and customer service. The Reich et al. (2003) study also found that almost half of employers reported improvements in customer service following a wage rise for low-wage workers, and in-deed, higher wages at the San Francisco airport led to shorter airport lines. Cowherd and Levine (1992) found that an increase in the pay of lower-level employees relative to management increased the quality of produc-tion. Using data from more than 500 retail stores, Fisher et al. (2006) found a positive relationship between customer satisfaction and the payroll level of associates and managers in the store. Higher wages were also associated with employers having more knowledge about the inventory.
Higher wages reduce disciplinary problems and absenteeism. Cappelli and Chauvin (1991) documented that in plants where pay was higher relative to the local labor market, fewer disciplinary actions were required. Like-wise, nearly half of those employers surveyed by Reich et al. (2003) reported a decrease in disciplinary issues following a wage rise. Zhang et al. (2013) showed in a survey of Canadian fi rms that absenteeism was less likely when wages were higher. Pfeifer (2010) found a similar result in a large German survey.
Firms with higher wages need to devote fewer resources to monitoring. High-paying fi rms have been found to create a culture of hard work in which employees monitor their coworkers, reducing the need to hire su-pervisors. Rebitzer (1995) found that low-wage maintenance workers needed more supervision in the petro-chemical industry. Groshen and Krueger (1990) showed that more highly paid nurses were also supervised less. Georgiadis (2008) found that in residential care homes in the United Kingdom “higher wage costs were more than offset by lower monitoring costs.”
Workers excessively concerned about income security perform less well at work. A variety of recent experi-ments have demonstrated this proposition. Mani et al. (2013) recruited buyers in a shopping mall and asked them to think about their fi nances. Researchers observed that the performance of poor subjects on a cognitive test deteriorated if they were asked to imagine a large emergency expenditure (a $1,500 car repair), but no such deterioration was observed for well-off subjects. Mullainathan and Shafi r (2013) assessed a range of related experiments, fi nding that mental tasks that simulate the constant stress of poverty led people to act in com-pulsive and improper ways. Indeed, the World Bank World Development Report (2015), citing numerous fi eld studies, recognizes that poverty taxes people’s mental capacities and self-control.
Other mechanisms by which higher wages can yield offsetting benefits include:
Higher wages are associated with better health—less illness and more stamina, which enhance worker productivity.
Greater job satisfaction can result in less confl ict between employers and labor groups. Enhanced reputation with consumers.
All of these positive effects may interact to yield even larger aggregate effects, as the productivity of one worker often raises the productivity of their coworkers. Mas and Moretti (2009) offer persuasive data on this point, showing that productive cashiers motivate their coworkers to work faster.
8 PIIE BRIEFING 15-2
REFERENCESBó, Ernesto Dal, Frederico Finan, and Martín A. Rossi. 2013. Strengthening State Capabilities: The Role of Financial Incentives in the Call to Public Service. Quarterly Journal of Economics 128, no. 3: 1169–218.
Cappelli, Peter, and Keith Chauvin. 1991. An Interplant Test of the Effi ciency Wage Hypothesis. Quarterly Journal of Economics 106, no. 3: 769-87.
Cowherd, Douglas M., and David I. Levine. 1992. Product Quality and Pay Equity between Lower-Level Employees and Top Manage-ment: An Investigation of Distributive Justice Theory. Administrative Science Quarterly 37, no. 2: 302–320.
Dube, Arindrajit, Suresh Naidu, and Michael Reich. 2007. The Economic Effects of a Citywide Minimum Wage. Industrial and Labor Relations Review 60, no. 4: 522–43.
Fairris, David, David Runsten, Carolina Briones, and Jessica Goodheart. 2005. Examining the Evidence: The Impact of the Los Angeles Living Wage Ordinance on Workers and Businesses. UCLA Institute for Research on Labor and Employment. University of California, Los Angeles.
Fisher, Marshall L., Jayanth Krishnan, and Serguei Netessine. 2006. Retail Store Execution: An Empirical Study. Operations and Informa-tion Management Department, Wharton School, University of Pennsylvania.
Georgiadis, Andreas. 2008. Effi ciency Wages and the Economic Effects of the Minimum Wage: Evidence from a Low-Wage Labour Market. CEP Discussion Paper No. 857. London: Centre for Economic Performance, London School of Economics and Political Science.
Groshen, Erica L., and Alan B. Krueger. 1990. The Structure of Supervision and Pay in Hospitals. Industrial and Labor Relations Review 43, no. 3: 134-S–46-S.
Holzer, Harry J. 1990. Wages, Employer Costs, and Employee Performance in the Firm. Industrial and Labor Relations Review 43, no. 3: 147–64.
Levine, David I. 1992. Can Wage Increases Pay for Themselves? Test with a Production Function. Economic Journal 102: 1102–115.
Mani, Anandi, Sendhil Mullainathan, Eldar Shafi r, and Jiaying Zhao. 2013. Poverty Impedes Cognitive Function. Science 341, no. 6149: 976–80.
Mas, Alexandre. 2006. Pay, Reference Points, and Police Performance. Quarterly Journal of Economics 121, no. 3: 783–821.
Mas, Alexandre, and Enrico Moretti. 2009. Peers at Work. American Economic Review 99, no. 1: 112–45.
Mullainathan, Sendhil, and Eldar Shafi r. 2013. Scarcity: The New Science of Having Less and How It Defi nes Our Lives. New York: Picador.
Pfeifer, Christian. 2010. Impact of Wages and Job Levels on Worker Absenteeism. International Journal of Manpower31, no. 1: 59–72.
Rebitzer, James B. 1995. Is There a Trade-Off between Supervision and Wages? An Empirical Test of Effi ciency Wage Theory. Journal of Economic Behavior and Organization 28, no. 1: 107–129.
Reich, Michael, Peter Hall, and Ken Jacobs. 2003. Living Wages and Economic Performance: The San Francisco Airport Model. Institute of Industrial Relations, University of California, Berkeley.
World Bank. 2015. Poverty. In World Development Report 2015: Mind, Society, and Behavior. Washington: World Bank.
Yellen, Janet L. 1984. Effi ciency Wage Models of Unemployment. American Economic Review 74, no. 2: 200–205.
Zhang, Wei, Huiying Sun, Simon Woodcock, and Aslam Anis. 2013. Valuing Productivity Loss Due to Absenteeism: Firm-level Evidence from a Canadian Linked Employer-Employee Data. Paper presented at the 12th annual meeting of the Canadian Health Economists’ Study Group, Manitoba, Canada.
9 PIIE BRIEFING 15-2
EFFECT OF LARGE CORPORATIONS RAISING WAGES OF LOW-PAID WORKERS
TOMAS HELLEBRANDT
If all large private sector corporations in the United States outside of sectors that intensively use low-skilled labor increased wages of their low-paid workers to $16 per hour, the pay of 6.2 percent of the 110 million private-sector workers in the United States would increase, on average by 38.6 percent. The direct cost to em-ployers would be $51 billion, around 0.3 percent of GDP (table 1). Alternatively, if wages were raised to $12 per hour, the initiative would benefi t 2.8 percent of workers, increasing their wages on average by 23.9 percent. The direct cost to the employers would be $12 billion or around 0.07 percent of GDP.
Both scenarios would particularly benefi t women, blacks, and the young—groups that are disproportion-ately low-wage workers. Women and some racial minorities earn relatively less because of discrimination in the labor market or barriers to education. Young people also receive lower wages on average because they do not yet have the experience to earn higher pay. Table 1 and fi gure 1 illustrate that the $16 wage fl oor would boost the average wage of blacks, Hispanics, the young, and women the most. There is less variation across the groups in the percent increase in average wages for a $12 wage fl oor.
This analysis uses data on hourly earnings—including overtime, tips, and commission—to estimate how many workers receive less than a specifi ed wage fl oor—$16 and $12 an hour in this study. The data have been obtained from the 2013 Current Population Survey (CPS), the basis of the offi cial labor market statistics for the United States. It collects information from around 60,000 households each month and is designed to be representative of the US civilian population. The effect on the aggregate annual private sector wage bill (i.e., the direct cost to employers) can be calculated from converting the hourly pay increase for each affected worker into an annual pay increase using the usual hours worked per week reported in the CPS. These annual values are then aggregated across all affected individuals.
This study excludes public sector workers and employees of small and medium-sized fi rms (less than 1,000 employees). It also excludes workers employed in low-skill-intensive industries, which are defi ned as sec-tors where the share of workers working in large fi rms on less than $16 per hour exceeds 40 percent.1 Firms in these industries are unlikely to signifi cantly raise the pay of low-wage workers because it would be particularly costly for them. Finally, workers who report receiving less than the minimum wage of $7.25 per hour—about 1 percent of the employees of large private sector fi rms in the selected industries—are also excluded. They repre-sent around 1 percent of the employees of large private sector fi rms in the selected industries.
1. CPS data do not allow the matching of individuals to particular fi rms. It only contains information on the industry and size of the respondent’s employer. The analysis therefore excludes all workers in low-skill-intensive industries, even if their particular employer does not employ many low-wage workers.
TOMAS HELLEBRANDT has been a research fellow at the Peterson Institute for International Economics (PIIE) since January 2013.This article appeared on PIIE’s blog RealTime Economic Issues Watch, January 13, 2015.

10 PIIE BRIEFING 15-2
Table 1 Effect of increasing low wages in the private sector and by
demographic group (percent)$16 option $12 option
Group
Share of
private
sector
employees
Share who
get pay
raise
Average
percent
wage
increase
Share who
get pay
raise
Average
percent
wage
increase
Total (private sector) 100.0 6.2 38.6 2.8 23.9
Sex
Female 46.7 7.2 39.4 3.5 23.4
Male 53.3 5.2 37.6 2.2 24.5
Race
Black 10.4 10.3 44.1 5.9 23.8
Hispanic 16.4 6.2 41.3 3.1 23.3
White 65.7 5.7 36.4 2.3 23.6
Other 7.6 4.9 37.7 1.9 28.4
Age
Less than 30 24.4 8.3 43.1 4.3 25.0
30 to 50 44.5 5.4 36.5 2.3 23.1
Over 50 31.2 5.6 36.3 2.3 23.2
Source: Based on 2013 Current Population Survey.
0
5
10
15
20
25
30
35
40
45
50$16 option$12 option
percent
Sex Race Age
Figure 1 Average wage increase by demographic group
Source: Based on 2013 Current Population Survey.
FemaleMale
Black
Hispanic
WhiteOther
< 30
30 to 50
> 50

11 PIIE BRIEFING 15-2
RAISING THE US WAGE FLOOR: THE INTERNATIONAL PERSPECTIVE
JACOB FUNK KIRKEGAARD AND TYLER MORAN
JACOB KIRKEGAARD is senior fellow at the Peterson Institute for International Economics (PIIE). TYLER MORAN has been a research analyst at the Peterson Institute since June 2013. This article appeared on PIIE’s blog RealTime Economic Issues Watch, January 14, 2015.
Income inequality in the United States has increased in recent decades to levels exceeding those in comparable large advanced economies—and even more so in traditionally more equal smaller European economies. More-over, many studies have found that among advanced economies, paying higher wages to low-wage workers reduces inequality and increases economic growth.
Figure 1 shows the so-called 90/10 disposable income share ratio—the ratio of the average income of the top 10 percent of earners to that of the bottom 10 percent. Latest available data from 2012 re-veal that the top 10 percent of Americans earn 17 times more than the bottom 10 percent, while in the G-7 only Japan, Italy, and the United Kingdom have ratios above 10. Figure 1 further shows that the increase in US income inequality since 1990 has been unprecedented among large industrial nations. It is also noteworthy that in-come inequality in the United Kingdom, which was compara-ble to the United States in 1990 (a ratio of 11 at the time), has reduced slightly since then.
Income inequality rises with changes on both ends of
0
2
4
6
8
10
12
14
16
18
Sweden
Denmark
Switzerla
ndJapan
KoreaFrance
Germany
Italy
Australia
Canada
United Kingdom
United States
Around 19902012 or latest available
ratio
Figure 1 S90/S10 disposable income share ratio
Note: The 90/10 ratio is the share of all income received by the top decile divided by the share of the first decile, or the ratio of the average income of the top decile to that of the first decile.Source: OECD Income Distribution Data.

12 PIIE BRIEFING 15-2
the income range. The phenomenal rise in income enjoyed by the top earners in the United States has attracted substantial attention from economists and politicians. But slumping wage and income1 at the low end of the spectrum has garnered far less attention, especially in an international comparative context.
A widespread assumption in economics, generally attributed to Arthur Okun (1975), is that there is an inherent tradeoff between efforts to reduce inequality and economic effi ciency. According to this school of thought, raising taxes or expanding some types of government programs to promote wage and income equal-ity in an economy can impede growth and job creation. On the other hand, recent economic research from the International Monetary Fund (Ostry, Berg, and Tsangarides 2014) and the Organization for Economic Coop-eration and Development (OECD) (Cingano 2014) has examined a variety of countries and concluded that excessive income inequality is correlated with lower economic growth. Cross-country comparisons of income inequality and especially wage and income levels at the low end make it clear that paying higher wages to low-wage workers in fact creates jobs.
Figure 2 shows the most recent available average income levels for the fi rst and second income deciles2 in the United States, the G-7, other Anglo-Saxon countries, and smaller, traditionally more equal European econo-mies. The incomes of the bottom 10 percent in the United States are low compared with those in other English-speaking nations, Germany, France, smaller European economies, and the OECD-30 average but marginally higher than those in Japan, Korea, and Italy. For the second income decile earners, the United States is on par with the OECD average, Germany, France, and Australia but still below Canada, the United Kingdom, and the smaller European countries.
1. Low-income groups generally own no fi nancial assets, meaning that wage income accounts for essentially all income.2. The fi rst decile is the bottom 10 percent earners (those earning the lowest wages) and the second decile is the next 10 percent earners.
0
2,000
4,000
6,000
8,000
10,000
12,000
14,000
16,000
18,000First decile averageSecond decile average
US dollars, PPP
Figure 2 Average incomes at low end of income spectrum, mid-2000s
OECD = Organization for Economic Cooperation and Development; PPP = purchasing power parityNote: The data refer to equivalized household disposable income of people at different points of the distribution. Source: OECD (2008).
Sweden
Denmark
Switzerla
ndJapan
KoreaFrance
Germany
Italy
Australia
Canada
United Kingdom
United States
OECD-30

13 PIIE BRIEFING 15-2
Figure 3 illustrates that among advanced econo-mies generally comparable to the United States, there is a strong positive correla-tion between higher wage and income levels in the fi rst and second income de-ciles and subsequent years’ employment levels. In this group of economies, the more you pay your low-wage workers, the more jobs you create and the higher your employment rate tends to be. Countries like Italy, Ko-rea, Japan, and the United States, which have the low-est wage and income levels at the low end, also have the lowest employment rates,
while economies like Switzerland, Denmark, Sweden, Canada, and the United Kingdom, which pay low-wage workers better, also generate more jobs and have higher employment rates.
WOULD INTERNATIONAL COMPETITION UNDERMINE RAISING LOW-INCOME WAGES?
A separate issue with respect to comparisons between wage levels in the United States and other countries is whether increasing American wages, particularly at the lower end, might undermine the ability of US fi rms to compete overseas. As a result of higher wages, according to this concern, individual fi rms might opt to transfer a greater share of their inputs overseas, out of fear of losing markets both at home and abroad. The data, however, indicate these concerns are not well-founded.
First, the industries that would be most affected by an increase in low-end wages at large private cor-porations are generally not in manufacturing—those that face stiff foreign competition. Table 1 shows the top 10 industries that would be most affected by a shift from less than $12 an hour up to $12 an hour, and the average wage increase an affected worker would experience.
SwedenDenmark
Japan
Korea
Switzerland
France
Germany
Italy
AustraliaCanada United Kingdom
United States
SwedenDenmark
Japan
Korea
Switzerland
France
Germany
Italy
Australia Canada
United Kingdom
United States
y = 0.0019x + 55.351R² = 0.415
y = 0.0022x + 42.614R² = 0.6548
55
60
65
70
75
80
4,000 6,000 8,000 10,000 12,000 14,000 16,000 18,000
average 15–64y employment/population ratio, 2006–13
average income in decile, US dollars (PPP), mid-2000s
First decileSecond decile
Figure 3 Low income levels and job creation
PPP = purchasing power paritySources: OECD (2008); Labor Force Surveys.
Table 1 Top 10 industries that would be most
affected by wage increases of up to $12
an hour (percent)
Industry
Share of
workers
affected
Mean wage
increase
Motion picture and sound recording 10.8 33.6
Other information services* 7.3 19.0
Wood products 6.9 26.6
Transportation and warehousing 6.8 24.8
Educational services 6.7 29.1
Hospitals 6.0 20.3
Real estate 5.6 20.8
Beverage and tobacco products 5.6 22.6
Healthcare services 5.5 23.4
Wholesale trade 5.4 25.5
* Refers to all information services aside from publishing, motion picture and sound recording, and telecommunications.
Source: PIIE analysis.
14 PIIE BRIEFING 15-2
For comparison, the fi gure for machinery manufacturing is 2.8 percent of workers affected and a 14.9 percent mean wage increase, while electrical equipment manufacturers would increase wages for 4.5 percent of workers by an average of 19.7 percent per worker. Thus, the fear of offshoring or loss of competitiveness abroad should not stifl e increased wages in the industries with the greatest share of affected workers.
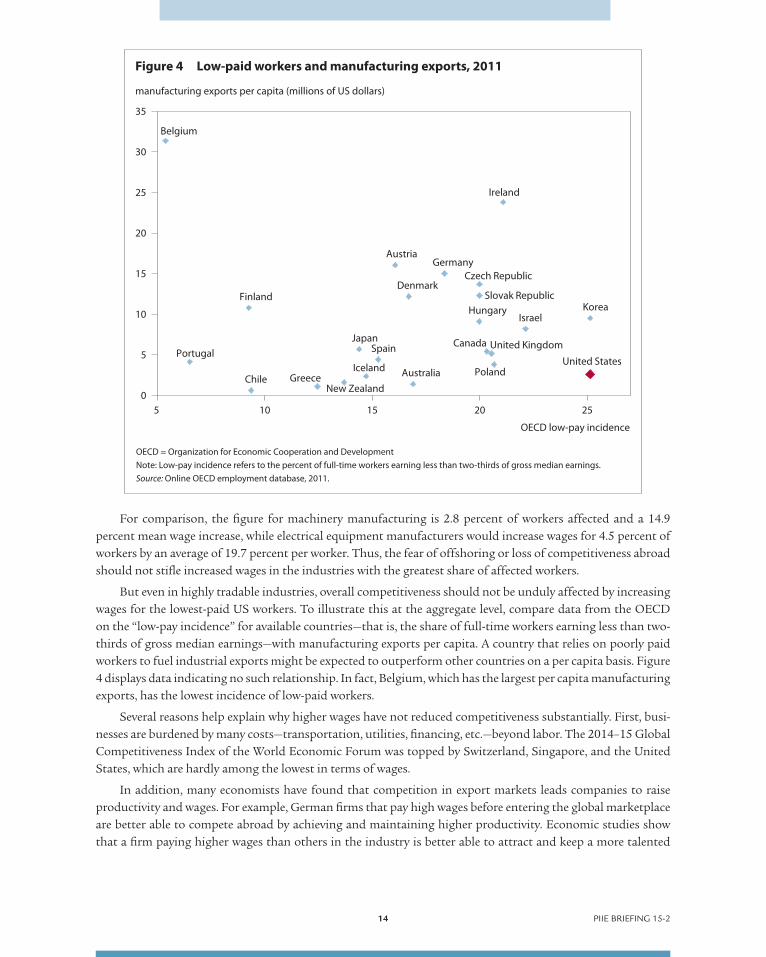
But even in highly tradable industries, overall competitiveness should not be unduly affected by increasing wages for the lowest-paid US workers. To illustrate this at the aggregate level, compare data from the OECD on the “low-pay incidence” for available countries—that is, the share of full-time workers earning less than two-thirds of gross median earnings—with manufacturing exports per capita. A country that relies on poorly paid workers to fuel industrial exports might be expected to outperform other countries on a per capita basis. Figure 4 displays data indicating no such relationship. In fact, Belgium, which has the largest per capita manufacturing exports, has the lowest incidence of low-paid workers.
Several reasons help explain why higher wages have not reduced competitiveness substantially. First, busi-nesses are burdened by many costs—transportation, utilities, fi nancing, etc.—beyond labor. The 2014–15 Global Competitiveness Index of the World Economic Forum was topped by Switzerland, Singapore, and the United States, which are hardly among the lowest in terms of wages.
In addition, many economists have found that competition in export markets leads companies to raise productivity and wages. For example, German fi rms that pay high wages before entering the global marketplace are better able to compete abroad by achieving and maintaining higher productivity. Economic studies show that a fi rm paying higher wages than others in the industry is better able to attract and keep a more talented
Australia
Austria
Belgium
Canada
Chile
Czech RepublicDenmark
Finland
Germany
Greece
Hungary
Iceland
Ireland
Israel
Japan
Korea
New Zealand
Poland
Portugal
Slovak Republic
Spain United Kingdom
United States5
10
15
20
25
30
35
5 10 15 20 25
manufacturing exports per capita (millions of US dollars)
OECD low-pay incidence
Figure 4 Low-paid workers and manufacturing exports, 2011
OECD = Organization for Economic Cooperation and DevelopmentNote: Low-pay incidence refers to the percent of full-time workers earning less than two-thirds of gross median earnings.Source: Online OECD employment database, 2011.
0

15 PIIE BRIEFING 15-2
and effective workforce. Workers who are paid more than they expect to earn elsewhere, or with greater potential for future raises, are also less likely to switch jobs, reducing expenses incurred to hire and train new employees.3
Continuing advances in automation pose a far greater concern than trade competition in keeping indus-trial jobs from disappearing. Increasing pay and demanding higher skills and commitment from workers is a better way to get ahead of the competition than keeping wages low, because more dedicated and productive workers can provide services that technology cannot.
REFERENCESCingano, F. 2014. Trends in Income Inequality and its Impact on Economic Growth. OECD Social, Employment and Migration Working Papers No. 163 (December). Paris: OECD Publishing.
OECD (Organization for Economic Cooperation and Development). 2008. Growing Unequal? Income Distribution in OECD Countries. Paris: OECD Publishing.
Okun, Arthur M. 1975. Equality and Effi ciency: The Big Trade-Off. Washington: Brookings Institution.
Ostry, Jonathan, Andrew Berg, and Charalambos Tsangarides. 2014. Redistribution, Inequality, and Growth. IMF Staff Discussion Note SDN/14/02 (February). Washington: International Monetary Fund.
3. See article by Justin Wolfers and Jan Zilinsky in this PIIE Briefi ng.

16 PIIE BRIEFING 15-2
HOW RAISING WAGES OF LOW-PAID WORKERS AT LARGE CORPORATIONS WOULD AFFECT INCOME INEQUALITY
TOMAS HELLEBRANDT
Any measure that increases the pay of low-wage workers would, by defi nition, produce a positive effect on the distribution of employee earnings, reducing inequality. This analysis focuses on new wage fl oors that would be implemented by the employers of a small minority of private sector workers, specifi cally large private sector fi rms operating in industries that are not highly intensive in low-skilled labor. As a consequence, the impact on the distribution of wages would be moderate. A $16 per hour wage fl oor would provide a small boost to real wages in the lower part of the distribution and would reduce earnings inequality to levels observed in the early 2000s.1
Real wages of workers in the lower part of the wage distribution—including overtime, tips, and commis-sion—have been broadly stagnant for 30 years (fi gure 1). This observation holds for both the 25th and 10th percentile of the distribution of real wages, which were at the same level in 2013 as in the early 1980s. The dots in the fi gure show what the real wage would be if the $16 wage fl oor were implemented by large private sector corporates in selected sectors. The effect on the 10th percentile would be small because large fi rms employ rela-tively few very low-wage workers, and so only a small proportion of workers in the bottom decile would benefi t from the scheme. The effect on the 25th percentile is larger, but even in this part of the distribution the wage fl oor would only bring the real wage back to the level of the early 2000s.
While lower level wages have stagnated, higher level wages have been growing signifi cantly, contributing to the widening gap between low-wage workers and all others. There are many ways of measuring earnings inequality. Figure 2 focuses on the lower half of the distribution. It shows that the ratio of the median wage to the wage at the 10th percentile has changed over recent decades for all employees and also separately for full-time employees.2 The gap between the worker in the middle of the distribution and the low-paid worker increased dramatically in the 1980s. The gap declined in the 1990s but has drifted back up in the past 10 years.
The effect of the $16 wage fl oor would be small when considering all employees. As noted above, much of the movement would occur above the 10th percentile. The effect would expand if measured only for the distribution of wages of full-time workers, who have higher hourly wage rates than part-timers. However even for this group the wage fl oor would only reverse the rise in the 50:10 ratio observed since 2004.
1. The alternative $12 wage fl oor was also considered in this analysis, but the effect was too small to show in fi gures 1 and 2.2. Full-timers are defi ned as those employees who report working 30 hours or more in the usual work week.
TOMAS HELLEBRANDT has been a research fellow at the Peterson Institute for International Economics (PIIE) since January 2013. This article appeared on PIIE’s blog RealTime Economic Issues Watch, January 15, 2015.

17 PIIE BRIEFING 15-2
1.7
1.8
1.9
2.0
2.1
2.2Full-time employeesAll employees
50:10 ratio in hourly earnings
Ratio assuming $16 wage floor implemented
Figure 2 Ratio of 50th to the 10th percentile of the wage distribution
Sources: Current Population Survey; author’s calculations.
19791981
19831985
19871989
19911993
19951997
19992001
20032005
20072009
20112013
7
8
9
10
11
12
1310th percentile25th percentile
2013 dollars per hour
Effect of $16 wage floor
Figure 1 Real wages in the lower part of the wage distribution
Sources: Current Population Survey; OECD; and author’s calculations.
19791981
19831985
19871989
19911993
19951997
19992001
20032005
20072009
20112013

18 PIIE BRIEFING 15-2
An alternative way of measuring inequality based on the whole distribution of earnings is using the Gini index. This widely used measure takes a value of 0 for perfect equality and a value of 1 for perfect inequality—i.e., if all earnings went to only one person. Figure 3 shows trends in the Gini index for all employees and full-timers separately. This measure of inequality has steadily risen over the past quarter century. Figure 3 shows separately the effect of the $12 and the $16 wage fl oors on this measure of inequality. The $12 wage fl oor would not do very much. The $16 wage fl oor would have a much larger effect, but even this measure would only return the Gini index to levels seen in the early 2000s.
0.29
0.30
0.31
0.32
0.33
0.34
0.35Full-time employeesAll employees
Gini index on earnings of employees
$12 wage floor
$16 wage floor
Figure 3 Gini index on hourly earnings
Sources: Current Population Survey; author’s calculations.
19891990
19911992
19931994
19951996
19971998
19992001
20022003
20042005
20062007
20082009
20102011
20122013
2000

19 PIIE BRIEFING 15-2
EFFECTS OF A WAGE INCREASE BY LARGE CORPORATIONS ON THE MACROECONOMY
MICHAEL JARAND
At fi rst glance, the $51 billion cost to large corporate employers arising from a hypothetical increase in low-wage pay to $16 per hour seems signifi cant.1 When compared to the $5.61 trillion total of private sector wages paid in 2013,2 the proposed increase amounts to a 0.9 percent increase in aggregate wages or 1.1 percent in-crease in average wages. There may be a 0.3 percent of GDP redistribution from corporate profi ts to labor and a small bump in aggregate demand—depending on whether increases result in productivity gains or are passed through into prices. Because this proposal would be undertaken voluntarily by larger corporations with small-er shares of low-income workers, it should not affect hiring at the margin, thereby leaving the unemployment rate unchanged.
The largest effects would be felt by US corporations in terms of their unit labor costs. (This analysis ex-cludes corporations that have more than 40 percent in the low-wage category. It also excludes the agriculture, retail, and food service sectors.) These effects may be thought of also in terms of labor compensation’s share of GDP. Movements in the ratio of labor compensation to GDP (and its analog, the corporate profi t share) can indicate the economies of substitution between labor and capital. In recent years corporations have shifted towards investment and away from labor in terms of their inputs.3 Figure 1 examines the effect of a 0.3 percent of GDP increase in labor compensation.
The cost of raising wages to $16 an hour for all low-paid workers, as Aetna has announced it will do, would likely be mitigated by any improvement in productivity that results, as indicated in the article by Justin Wolfers and Jan Zilinsky. In this scenario the productivity increase would offset fully or potentially even exceed the 0.3 percent of GDP increase in wages. A similar offset would occur if corporations raised prices to offset the wage increase. As a result labor’s share of GDP would either remain unchanged or potentially even decrease slightly. A second scenario demonstrates what would happen if there is no increase in productivity or in prices—the 0.3 percent of GDP is transferred from corporations to labor in the form of a real wage increase, so labor’s share of GDP increases by 0.3 percent. The very small grey band at the end of fi gure 1 shows these changes in a historical context.
1. This examination focuses on the $16 per hour option, as its effect on the wage bill is much larger than the $12 per hour option.2. Total Annual Wages, Private, All Industry Aggregations, US Total, 2013, Quarterly Census of Employment and Wages, Bureau of Labor Statistics. 3. There are numerous explanations of why this may be. See, for example, Dylan Matthews, Robots, trade, and four other things that might be keeping you from getting a raise, http://www.VoxEU.org, January 8, 2015.
MICHAEL JARAND is research analyst at the Peterson Institute for International Economics (PIIE). This article appeared on PIIE’s blog RealTime Economic Issues Watch, January 17, 2015.

20 PIIE BRIEFING 15-2
What of the effect on wages and infl ation? Their historical trends are presented in fi gure 2. Wage infl ation measured by average hourly earnings of pro-duction and nonsupervisory employees4—the type of employ-ees affected by this proposal—has been stable for 30 years, with 12-month changes in earn-ings between 1.3 percent and 4.4 percent, with an average of 3.0 percent. Prices paid by con-sumers, here represented by Per-sonal Consumption Expendi-tures (PCE) infl ation numbers, have also increased at a moder-ate rate. Both wage increases and consumer prices have been depressed for some time, con-sistently undershooting Fed tar-gets, and infl ation expectations have been well anchored throughout the crisis.5
Based on my colleague Tomas Hellebrandt’s calculations using Current Population Survey data, the proposal would increase average wag-es of all private workers by 1.1 percent, which would likely be phased in over time. Therefore, it is likely any price effects would be on the scale of 0.1 percent a month rather than a sudden jump. Considering the low infl ation environment now in existence, an additional 0.1 increase in wages or PCE infl ation in fi gure 2 does not look like a problem. And that effect would occur only if the labor costs are directly passed on to consumers by businesses, rather than being offset by pro-ductivity gains.
4. Average Hourly Earnings of Production and Nonsupervisory Employees: Total Private, Federal Reserve Bank of St. Louis. 5. See, for example, J. Scott Davis, Infl ation Expectations Have Become More Anchored Over Time, December 2012, Federal Reserve Bank of Dallas.
61
62
63
64
65
66
67
1985 1987 1989 1991 1993 1995 1997 1999 2001 2003 2005 2007 2009 2011
percent
Figure 1 Labor compensation as a share of GDP, 1985–2012
Source: Federal Reserve Bank of St. Louis FRED Database, http://research.stlouisfed.org/fred2/series/LABSHPUSA156NRUG.
–2
–1
0
1
2
3
4
5
6
7
8Wage increasesPCE inflation
percent
Figure 2 Wages and inflation, 1985–2013
PCE = personal consumption expendituresSource: Federal Reserve Bank of St. Louis FRED Database, http://research.stlouisfed.org/fred2/series/AHETPI and http://research.stlouisfed.org/fred2/series/PCEPI.
19851987
19891991
19931995
19971999
20012003
20052007
20092011
2013

21 PIIE BRIEFING 15-2
INCOME INEQUALITY DEVELOPMENTS IN THE GREAT RECESSION
TOMAS HELLEBRANDT
The Great Recession, which cost tens of millions of jobs, a collapse of asset values around the world, and threatened the global fi nancial system, has generated renewed concern over the long-standing issue of the fairness of the distribution of wealth and income in many societies. Economic inequality has increased in the United States and many other advanced economies over the past 20 to 30 years. This trend generated less worry in the boom years, when unemployment rates were low and cheap credit enabled consumers to borrow and maintain higher standards of living, masking the impact of growing income disparity on consumption patterns and perceptions of well-being.
By reducing household incomes, the global fi nancial crisis has constrained consumption and underscored the diverging fortunes of different groups in society. Popular frustration over growing income disparity and its implications for social cohesion and the quality of democratic processes and institutions has been vigorously expressed in the Occupy Wall Street movement in the United States and similar protest movements in other countries.
Though the general impact of the Great Recession on national incomes in many countries has been clear, the detailed effect on the income distribution has not been studied because of a lack of data. This Policy Brief makes a fi rst effort to provide this analysis by using data on eight advanced economies (Germany, Greece, Ire-land, Italy, Slovakia, Spain, the United Kingdom, and United States) between 2007 and 2010. The focus is on the short-run effect of the Great Recession on income inequality with the long-run impact left for future research.
Assessing the drivers of income inequality requires access to detailed microdata on household incomes. The analysis here makes use of the most extensive and comparable such dataset made available for research by the Luxembourg Income Study (LIS) for the years 2007 and 2010 (see appendix A for more details about LIS data). The analysis starts by looking only at inequality in labor income and only among people who are em-ployed. It then progressively expands the income concept by including other sources of income and expands the coverage to include all working-age individuals and their families. The purpose of this selective analysis is to isolate the effect of such particular factors as changes in the employment rate or changes in redistribution within the household or by the state on income inequality.
The results show considerable diversity in the effect of the Great Recession on income inequality in dif-ferent countries and the ability of families and the state to mitigate its impact through redistribution within
TOMAS HELLEBRANDT, research fellow, has been with the Peterson Institute for International Economics since January 2013. This Policy Brief is part of the Institute’s project on inequality and inclusive capitalism, supported by a major grant from the ERANDA Foundation. For comments on an earlier draft, I thank without implicating Anders Åslund, Caroline Freund, Joseph E. Gagnon, Kenneth N. Kuttner, Adam S. Posen, Edwin M. Truman, and Steven R. Weisman.

22 PIIE BRIEFING 15-2
households and through public benefi t programs and the tax system. In general the effect of the Great Reces-sion on the distribution of earnings among those who remain employed appears to have been limited in most countries in the sample. When the nonemployed are included in the analysis, the rise in earnings inequality is much larger, particularly in those countries that saw large falls in employment between 2007 and 2010.
Greater redistribution within households—where household members share the earnings of those who remain in employment—relative to the continuation of the precrisis trend has somewhat mitigated the effect of the Great Recession on earnings inequality. With a few exceptions, government policies—the social safety net and direct taxes—have achieved a much larger mitigating effect on income disparities, with inequality in disposable incomes little changed between 2007 and 2010 in most countries. The marginal impact of means-tested social assistance benefi ts in mitigating the rise in inequality has been larger than that of work-related social insurance programs. Existing direct taxes have tended to have an equalizing effect in most countries. The analysis also illustrates the point that increasing direct taxes can contribute to reducing inequality, while tax cuts tend to make the distribution of disposable incomes more unequal.
The analysis points to a number of important implications for policy efforts to mitigate the impact of economic downturns on income disparities. It underscores the importance of policies designed to share the burden of adjustment more equally among workers and to reduce the impact of a negative economic shock on employment. It also suggests that policies to increase female employment can enhance the resilience of house-hold fi nances in recessions, helping to reduce the rise in earnings inequality. And it highlights the importance for equity and fairness of the precise nature of the fi scal policy mix in targeting a particular macroeconomic objective, such as stimulating the economy or consolidating public fi nances, because different measures can have very different distributive effects.
THE GINI INDEX AS A MEASURE OF INCOME INEQUALITY
The analysis presented here makes exten-sive use of the Gini index to capture income inequality. The Gini index is derived from the Lorenz curve, which plots the propor-tion of the total income of the population (y-axis) that is cumulatively earned by the bottom x percent of the population (fi gure 1). The Gini index is equal to the ratio of the area between the Lorenz curve and the line of perfect equality (G) to the area of the triangle ABC. It takes values between 0 and 1 (or 100 when expressed as a percentage). Perfect equality is achieved when the bot-tom x percent of the population receives x percent of total income, in which case the Lorenz curve lies on top of the line of per-fect equality and the Gini index is equal to 0. Perfect inequality is achieved when all in-come goes to one person, in which case the Lorenz curve is given by the line ABC and the Gini index is equal to 1 (or 100).1
1. The Gini index can also be described another way, as half of the average difference in income between every pair of units in the population, expressed as a percentage of mean income.
0
0.1
0.2
0.3
0.4
0.5
0.6
0.7
0.8
0.9
1.0
0 0.1 0.2 0.3 0.4 0.5 0.6 0.7 0.8 0.9 1.0
Lorenz curveLine of perfect equality
cumulative share of income
AB
C
G
cumulative share of population
Figure 1 Lorenz curves and the Gini index

23 PIIE BRIEFING 15-2
The Gini index is the best known and most widely used measure of inequality. This fact, together with its amenability to some useful decompositions, has motivated its use here. Nevertheless, it is important to note that the Gini index is by no means an ideal measure of inequality (see for example F. A. Cowell 2011). The LIS microdata do allow one to explore many alternative measures of inequality, and we leave this worthwhile task for future work.
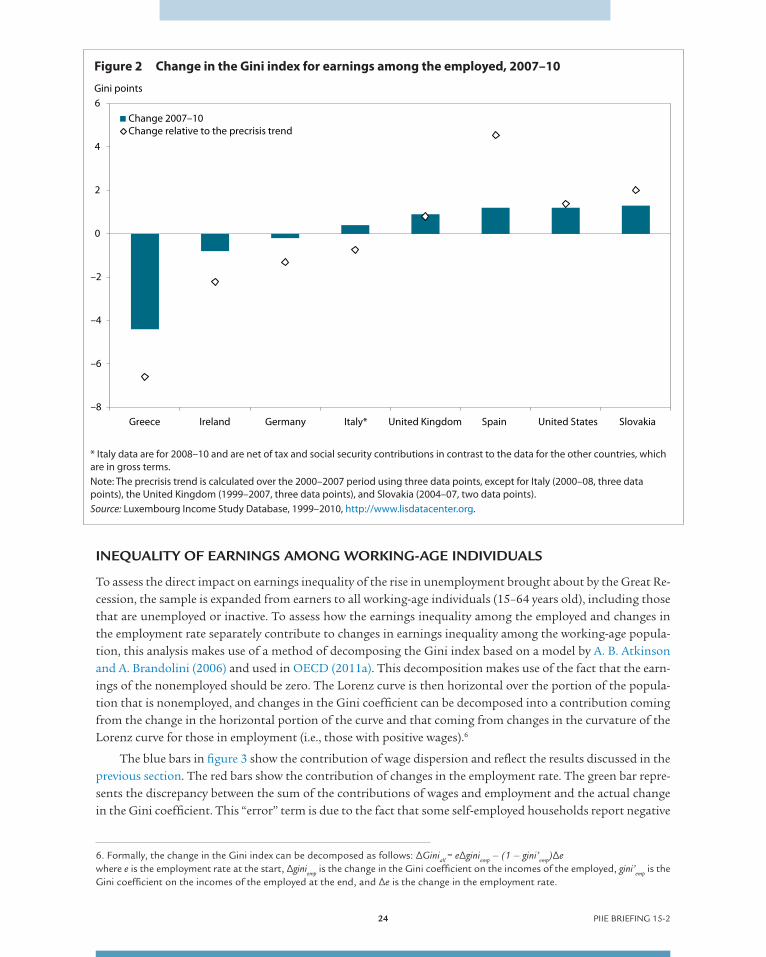
INEQUALITY OF EARNINGS AMONG THE EMPLOYED
The rise in nonemployment seen in many countries during the Great Recession might be expected to have affected the distribution of pre-tax earnings, or labor income, of the employed to the extent that the labor market upheavals affected different types of workers in different parts of the earnings distribution in varying ways. For example, if employment loss is concentrated among low-paid workers, then all other things being equal, the lower tail of the earnings distribution will shrink, and the inequality of earnings among those left employed will fall. In addition to such compositional changes due to the differential incidence of redundan-cies, the distribution of earnings will be affected by a multitude of employers’ decisions about pay growth and the success or otherwise of the self-employed in making a profi t and the impact of these factors at different points of the earnings distribution.
The Gini index on the earnings of employed working-age individuals (15–64 years old) in the sample of countries on the brink of the Great Recession ranged from 33 in Slovakia to 47 in the United States.2 The im-pact of the Great Recession on earnings inequality can be assessed by looking at the change in the Gini index between 2007 and 2010, in absolute terms and relative to the continuation of the precrisis trend3 (fi gure 2). With the exception of Greece4 the absolute change has been modest in all countries in the sample. In most cases the changes seen between 2007 and 2010 represent a reversal of the precrisis trends—countries where earnings inequality among the employed was rising before the crisis saw a decline after 2007 (Greece, Ireland, and Germany), while those countries where inequality had been falling saw an increase (Spain, the United States, and Slovakia).
The large fall in earnings inequality in Greece was driven by a fall in the inequality in the distribution of Greek wages, and in particular a considerable shrinking of the upper tail of the wage distribution. Looking at the industry composition of top wage earners in Greece reveals that the shrinking upper tail refl ected a large fall between 2007 and 2010 of public sector employees among the top wage earners in Greece. This is probably a result of the signifi cant nominal wage cuts, estimated at 14 percent, that the Greek government implemented in early 2010.5 If this is the case, it suggests that not all fi scal consolidation measures need to exacerbate in-come inequality. Consolidation measures and structural reforms aimed at removing the special privileges of certain professions and sectors can on balance contribute towards equality of incomes.
2. The Gini index for Italy was 30, but the Italian data on the components of total income, including labor income, are based on net income after income tax and social security contributions and so are not directly comparable to data for the other countries, which are in gross terms.3. To the extent that precrisis trends were related in some countries to asset price booms or bubbles, they may not have been sustainable. Assessing the sustainability of precrisis trends in inequality is beyond the scope of this analysis. 4. The results for Greece should be interpreted with caution given that LIS data has a much higher estimate of the fall in employment in Greece compared to offi cial Labor Force Survey data. See appendix A for more details.5. Hellenic Stability and Growth Programme Newsletter, Ministry of Finance, May 2010.
24 PIIE BRIEFING 15-2
INEQUALITY OF EARNINGS AMONG WORKING-AGE INDIVIDUALS
To assess the direct impact on earnings inequality of the rise in unemployment brought about by the Great Re-cession, the sample is expanded from earners to all working-age individuals (15–64 years old), including those that are unemployed or inactive. To assess how the earnings inequality among the employed and changes in the employment rate separately contribute to changes in earnings inequality among the working-age popula-tion, this analysis makes use of a method of decomposing the Gini index based on a model by A. B. Atkinson and A. Brandolini (2006) and used in OECD (2011a). This decomposition makes use of the fact that the earn-ings of the nonemployed should be zero. The Lorenz curve is then horizontal over the portion of the popula-tion that is nonemployed, and changes in the Gini coeffi cient can be decomposed into a contribution coming from the change in the horizontal portion of the curve and that coming from changes in the curvature of the Lorenz curve for those in employment (i.e., those with positive wages).6
The blue bars in fi gure 3 show the contribution of wage dispersion and refl ect the results discussed in the previous section. The red bars show the contribution of changes in the employment rate. The green bar repre-sents the discrepancy between the sum of the contributions of wages and employment and the actual change in the Gini coeffi cient. This “error” term is due to the fact that some self-employed households report negative
6. Formally, the change in the Gini index can be decomposed as follows: ΔGiniall
= eΔginiemp
– (1 – gini’emp
)Δe where e is the employment rate at the start, Δgini
emp is the change in the Gini coeffi cient on the incomes of the employed, gini’
emp is the
Gini coeffi cient on the incomes of the employed at the end, and Δe is the change in the employment rate.
–8
–6
–4
–2
0
2
4
6
Greece Ireland Germany Italy* United Kingdom Spain United States Slovakia
Change 2007–10Change relative to the precrisis trend
Gini points
Figure 2 Change in the Gini index for earnings among the employed, 2007–10
* Italy data are for 2008–10 and are net of tax and social security contributions in contrast to the data for the other countries, which are in gross terms.Note: The precrisis trend is calculated over the 2000–2007 period using three data points, except for Italy (2000–08, three data points), the United Kingdom (1999–2007, three data points), and Slovakia (2004–07, two data points).Source: Luxembourg Income Study Database, 1999–2010, http://www.lisdatacenter.org.

25 PIIE BRIEFING 15-2
earnings—those that have incurred losses in their business over the reporting period. For the purpose of this decomposition, their earnings had to be set to zero, which leads to a small discrepancy.
The results are not surprising. Rising unemployment has been the key driver of rising earnings inequal-ity amongst working-age individuals in all economies in the sample. In some countries the resulting increase in earnings inequality among the working-age population has been signifi cant. To put these changes into context, using a larger sample of 20 advanced economies around the mid-2000s, the Gini index on earnings among the working-age population ranged from around 50 in Denmark, Norway, and Sweden to 61 in the United States and 64 in Ireland. So an increase of two Gini points is roughly a fi fth of the way from Denmark to the United States.
Clearly, developments in employment matter greatly for inequality outcomes, and policies designed to reduce the impact of a negative economic shock on unemployment can go a long way to mitigating the rise in earnings inequality in a recession.
Germany is a case in point. Despite seeing a larger reduction in real GDP than the United States in the Great Recession, the employment rate among the working-age population rose in Germany between 2007 and 2010 by 2 percentage points, while in the United States it fell by 5 percentage points in the same period. Although the German export-led model placed it in a good position relative to other advanced economies to weather the Great Recession, there is little doubt that employment held up also partly due to government poli-cies. The so-called kurzarbeit policy provided wage subsidies to employees on reduced working hours, thereby preserving their purchasing power and enabling German fi rms to spread the impact of lower demand and required labor input broadly across all workers rather than to increase unemployment. Though there may be costs to such policies in terms of slowing needed rebalancing in the economy in the face of shifting sectoral
–4
–2
0
2
4
6
8
10
12
Germany Greece Italy* Slovakia UnitedKingdom
UnitedStates
Ireland Spain
ErrorEmploymentEarnings of employed
Gini change 2007–10Change relative to the precrisis trend
Gini points
Figure 3 Change in the Gini index for earnings among the working
age population, 2007–10
* Italy data are for 2008–10 and are net of tax and social security contributions in contrast to the data for the other countries, which are in gross terms.Note: The precrisis trend is calculated over the 2000–2007 period using three data points, except for Italy (2000–08, three data points), the United Kingdom (1999–2007 three data points), and Slovakia (2004–07, two data points).Source: Luxembourg Income Study Database, 1999–2010, http://www.lisdatacenter.org.
26 PIIE BRIEFING 15-2
demand patterns, the prevention of a signifi cant rise in earnings inequality from increased unemployment is an important benefi t.
Ultimately though, in assessing inequality in living standards across countries, we are interested not in gross earnings but in total income, including social transfers and net of tax. Moreover, we want to recognize that signifi cant redistribution happens within households as family members share common resources. The family and the state therefore offer some scope to mitigate the increase in inequality of individual earnings seen in many countries during the Great Recession.
THE ROLE OF HOUSEHOLDS IN MITIGATING THE IMPACT OF THE GREAT RECESSION ON INEQUALITY
The easiest way to assess the role of the family, or household, in mitigating the increase in earnings inequality during the Great Recession is to see whether the equalizing effect of aggregating individuals into households has increased or decreased between 2007 and 2010. To isolate the role of the family, the income concept in this section remains defi ned as labor income. The analysis is restricted to families headed by an individual of work-ing-age. The unit of analysis remains the individual, but it is assumed that redistribution within the household takes the form of pooling individual incomes and sharing them equally among household members.
When considering the sharing of resources within households, it is important to recognize that econo-mies of scale, such as sharing the cost of rent and utility bills, mean that a household consisting of two adults needs less than twice the income of a single person to attain the same standard of living. The standard way of making adjustment for household size is to use an equivalence scale that calculates individuals’ incomes as total household income divided by the square root of the household size.7 The resulting income concept is called equivalized income.
Inequality in equivalized earnings was signifi cantly lower than inequality in individual earnings in all countries in the sample in 2007. The gap ranges from 12 Gini points in the United Kingdom to 22 in Greece. Given the assumption of income sharing, the redistributive role of the family is greater by defi nition in larger households with more unequal distribution of earnings of household members. Thus differences between countries are related to factors such as average household size, female labor force participation, the gender pay gap, and so-called assortative mating (where high-earning men and women tend to marry each other).
To assess changes in the degree of redistribution within households during the Great Recession, fi gure 4 shows how the gap has changed between 2007 and 2010, both in absolute terms and relative to the continua-tion of the precrisis trend. It suggests that the redistributive role of the family has not increased very much in absolute terms in most countries, though it fell signifi cantly in Ireland.
However, the change appears much greater in Spain, Slovakia, Greece, and Italy when expressed relative to the continuation of the precrisis trend. The Great Recession appears to have halted a trend of falling redistri-bution within households in these countries, which was driven by increasing female employment and falling average household size before the crisis.8 If this trend had continued during the Great Recession, as it has in Ireland, the rise in inequality in equivalized earnings would have considerably exceeded the rise in inequality in individual earnings shown in fi gure 3.
It is important to note that the ability of households to mitigate the effect of rising unemployment on inequality is greater in larger households and when more household members work. For example, when one
7. The adjustment implies that each individual within a family of four on an income of $60,000 is equivalent to a single person on an income of $30,000.8. Note that increased female employment reduces inequality in the aggregate. See for example S. Harkness (2013). However, because female employment tends to lower earnings inequality within households, it reduces the amount of redistribution within households when earnings of household members are shared.

27 PIIE BRIEFING 15-2
member of a two-earner household loses his or her job, the impact on aggregate inequality in equivalized earn-ings is lower than when the sole breadwinner is made redundant, because in the former case the earnings of the remaining employed household member can be shared. This is what seems to have happened in the recession to many households in Spain and Slovakia and to a lesser extent in some of the other countries (fi gure 5). The rise in the share of single breadwinner households,9 relative to trend, is positively related to the change in redistribu-tion within households relative to trend.
In Greece, where the share of single breadwinner households was already very high before the recession, in-creased redistribution within households relative to trend appears to be related to an increase in average house-hold size. Italy also shows a signifi cant increase in household size relative to the continuation of the precrisis trend. This may refl ect actions by families to reduce living costs through economies of scale, such as an increase of young working-age people continuing to live with their parents.
Ireland is a bit of an anomaly in that household size fell relative to trend. The explanation may have to do with the structure of the social safety net in Ireland, in particular the importance of means-tested benefi ts (see next page). Because means-testing tends to involve assessing the economic situation of the whole household, not just the individual, the employment status of other household members can affect the level of benefi ts. The availability of means-tested benefi ts may therefore discourage individuals from seeking economies of scale in living costs.
9. A single breadwinner household is defi ned as headed by a working-age individual living with a partner where the labor income of one partner exceeds the income of the other by a multiple of three. The shares are expressed relative to all households headed by a working-age individual living with a partner.
–3
–2
–1
0
1
2
3
4
Ireland Germany Greece Italy* UnitedKingdom
UnitedStates
Slovakia Spain
Change 2007–10Change relative to the precrisis trend
Gini points
Equalizing effectof household
increased
Equalizingeffect
reduced
Figure 4 Change in the impact of aggregating individuals into households on
income inequality, 2007–10
* Italy data are for 2008–10 and are net of tax and social security contributions in contrast to the data for the other countries, which are in gross terms.Note: The precrisis trend is calculated over the 2000–2007 period using three data points, except for Italy (2000–08, three data points), the United Kingdom (1999–2007 three data points), and Slovakia (2004–07, two data points). Source: Luxembourg Income Study Database, 1999–2010, http://www.lisdatacenter.org.

28 PIIE BRIEFING 15-2
The role of the distribution of employment and incomes within households in mitigating the effect of the Great Recession on inequality has important implications for policy. It is widely recognized that increased female labor force participation tends to reduce the level of income inequality (see for example Harkness 2013). What this analysis suggests is that an additional benefi t of high female employment is the enhanced resilience of household fi nances in recessions, which helps reduce the rise in earnings inequality that tends to result from rising unemployment, thereby reducing the burden on the government in supporting the incomes of those who have lost their jobs.
THE ROLE OF THE SOCIAL SAFETY NET IN MITIGATING THE IMPACT OF THE GREAT RECESSION ON INCOME INEQUALITY
Having considered the role of the family in supporting the standard of living of needy individuals, the follow-ing two sections consider the role of the state. In this section the income concept is expanded from earnings to total pre-tax income by including income from capital as well as social and private transfers. The next section adds direct taxes. The analysis continues to focus on individuals living in households with a working-age head.
To compare the impact of the family and of social transfers on the change in income inequality between 2007 and 2010, fi gure 6 shows the change in the Gini index using the three income concepts discussed so far. The blue bars show the change in inequality in individual earnings among the working-age population, which appeared in fi gure 3. The red bars show the change in inequality in equivalized income. The difference between the red and the blue bars corresponds to the change in the redistributive role of households shown in fi gure 4.
–1.0
–0.5
0
0.5
1.0
1.5
2.0
2.5
3.0
3.5
4.0
–4 –2 0 2 4 6 8 10
change in share of single breadwinner households (percentage points)
Spain
Slovakia
Italy*
United Kingdom
United States
IrelandGermany
Greece
change in equalizing effect of family (Gini points)
Figure 5 Changes in equalizing effect of households and share of single
breadwinner households compared, relative to precrisis trend,
2007–10
* Italy data are for 2008–10 and are net of tax and social security contributions in contrast to the data for the other countries, which are in gross terms. Note: The precrisis trend is calculated over the 2000–2007 period using three data points, except for Italy (2000–08, three data points), the United Kingdom (1999–2007 three data points), and Slovakia (2004–07, two data points). Source: Luxembourg Income Study Database, 1999–2010, http://www.lisdatacenter.org.

29 PIIE BRIEFING 15-2
Likewise, the difference between the green and the red bars can be thought of as representing primarily the role of social transfers in mitigating the rise in income inequality.10 In all countries that saw a fall in employment in the Great Recession, with the exception of Slovakia, the role of social transfers has been very signifi cant.
To assess how different types of government transfers contribute to income inequality, fi gure 7 decom-poses the green bars in fi gure 6 using a method of decomposing the Gini index by income source developed by R. I. Lerman and S. Yitzaki (1985). Lerman and Yitzaki showed that the contribution of a given income source to the Gini index on total income is the product of three factors. The fi rst is the share of that income source in total income. The second is the inequality in the distribution of income from that source. The third factor captures the progressivity of the income from that source, that is, the extent to which the recipients of that income tend to be rich or poor when measured in terms of total income. So, for example, means-tested benefi ts may be distributed very unequally, but they have an equalizing impact on total income because they are highly progressive—they go mainly to the poor.11
Using this decomposition method, fi gure 7 shows the contributions of four sources of income to the Gini index on equivalized total pre-tax income. Factor income combines income from labor and capital. Work-re-lated social insurance transfers relate to those public and private insurance programs where the level of benefi t is tied to previous earnings and employment tenure. Means-tested transfers are those where eligibility is deter-
10. Capital income and private transfers, which are also included in total pre-tax income, had very little impact on the change in income inequality in the LIS data. Unfortunately, capital income is severely underreported in the LIS data. From the data available, capital income appears to have had a small equalizing effect between 2007 and 2010 in most countries in the sample. The true equalizing effect is likely to have been much larger, however, particularly when income from capital gains is included, which is not possible using LIS data. S. Ólafsson and A. S. Kristjánsson (2013) use tax returns data for Iceland to illustrate that capital income had a very large effect on income inequality, both as the Icelandic bubble infl ated and once it burst.
11. Formally, the Gini index on total income G is given by: k
kkkk RGSG
1
where Sk is the share of source k in total income, G
k is the Gini coeffi cient corresponding to the distribution of income from source k,
and Rk is the Gini correlation term given by: cov(yk,F)/cov(yk,Fk) where F is the cumulative distribution of total income, and Fk is the
cumulative distribution of income from source k. R will equal 1 (–1) when an income source is an increasing (decreasing) function of total income. R will equal 0 when the income source is uniformly distributed.
–1
0
1
2
3
4
5
6
7
Germany Greece Italy* UnitedKingdom
UnitedStates
Slovakia Ireland Spain
Individual earningsEquivalized earningsEquivalized total pre-tax income
Gini points
Figure 6 Change in the Gini index between 2007 and 2010 using different
income concepts
* Italy data are for 2008–10 and are net of tax and social security contributions in contrast to the data for the other countries, which are in gross terms. Source: Luxembourg Income Study Database, 1999–2010, http://www.lisdatacenter.org.

30 PIIE BRIEFING 15-2
mined by need rather than by prior earnings or work history. The other transfers category includes universal public benefi ts and private transfers.
It is interesting to note the contrasting contributions of work-related social insurance benefi ts and means-tested transfers. With the exception of Slovakia and Germany, the share of both types of social transfers in total pre-tax income increased in all countries between 2007 and 2010. However, while the increase of means-tested benefi ts has tended to mitigate the rise in inequality in total pre-tax income, at least in those countries where they represent a meaningful component of the social safety net, the rising share of work-related social insurance benefi ts has had the opposite effect, exacerbating the rise in inequality in total pre-tax income.12
This is not to say that the rise in income inequality would have been smaller if social insurance programs such as work-related public pensions or work-related unemployment insurance did not exist.13 But it does highlight that payouts from insurance programs tied to prior work experience and earnings are regressive in the sense that the poorest households do not benefi t from them as much as middle-class households, and their rising share in total income therefore increases inequality relative to social benefi ts that are distributed uniformly.
12. Note that this method of decomposing the Gini index is akin to an accounting exercise. It does not fully capture the general equilibrium effect on inequality of a given government policy. For example, changes to benefi t eligibility will affect inequality not only directly, by changing the share of the benefi t in total income and/or the inequality and/or progressivity of its distribution, but also indirectly via their effect on incentives to work and the resulting impact on the distribution of earnings.13. Within the decomposition framework used here, the impact on the Gini index of abolishing work-related social insurance would depend on how the resources freed up were used by the government and on the resulting effect of this change on the three factors (S
k, G
k, and R
k in the formula in footnote 11) determining the contributions of the remaining income sources. For example, if the
money were used for means-tested benefi ts, the Gini index would fall, but if the money were used to reduce the rates of income tax, the Gini index would rise.
Figure 7 Contributions of different income sources to change in inequality in
equivalized total pre-tax income, 2007–10
* Italy data are for 2008–10 and are net of tax and social security contributions in contrast to the data for the other countries, which are in gross terms.Note: The precrisis trend is calculated over the 2000–2007 period using three data points, except for Italy (2000–08, three data points), the United Kingdom (1999–2007 three data points), and Slovakia (2004–07, two data points). Source: Luxembourg Income Study Database, 1999–2010, http://www.lisdatacenter.org.
–3
–2
–1
0
1
2
3
4
5
Germany Greece Italy* UnitedKingdom
UnitedStates
Slovakia Ireland Spain
Gini points
Factor income Work-related social insuranceMeans-tested transfers Other transfersGini change 2007 – 10 Change relative to the precrisis trend
Means-tested transfers
Means-tested transfers
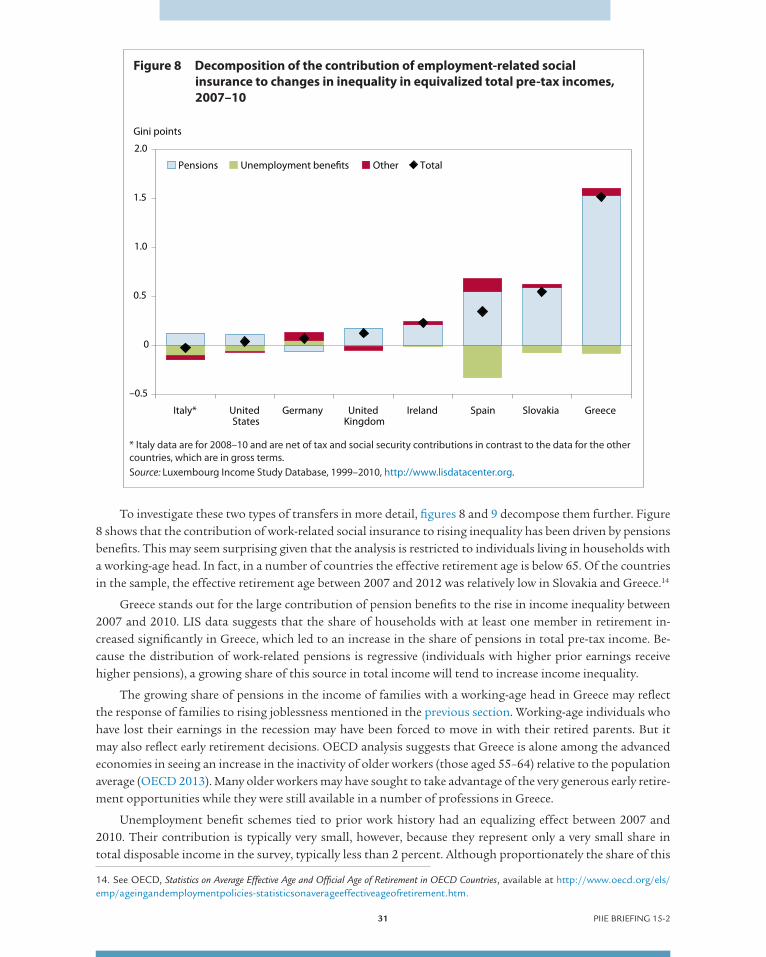
31 PIIE BRIEFING 15-2
To investigate these two types of transfers in more detail, fi gures 8 and 9 decompose them further. Figure 8 shows that the contribution of work-related social insurance to rising inequality has been driven by pensions benefi ts. This may seem surprising given that the analysis is restricted to individuals living in households with a working-age head. In fact, in a number of countries the effective retirement age is below 65. Of the countries in the sample, the effective retirement age between 2007 and 2012 was relatively low in Slovakia and Greece.14
Greece stands out for the large contribution of pension benefi ts to the rise in income inequality between 2007 and 2010. LIS data suggests that the share of households with at least one member in retirement in-creased signifi cantly in Greece, which led to an increase in the share of pensions in total pre-tax income. Be-cause the distribution of work-related pensions is regressive (individuals with higher prior earnings receive higher pensions), a growing share of this source in total income will tend to increase income inequality.
The growing share of pensions in the income of families with a working-age head in Greece may refl ect the response of families to rising joblessness mentioned in the previous section. Working-age individuals who have lost their earnings in the recession may have been forced to move in with their retired parents. But it may also refl ect early retirement decisions. OECD analysis suggests that Greece is alone among the advanced economies in seeing an increase in the inactivity of older workers (those aged 55–64) relative to the population average (OECD 2013). Many older workers may have sought to take advantage of the very generous early retire-ment opportunities while they were still available in a number of professions in Greece.
Unemployment benefi t schemes tied to prior work history had an equalizing effect between 2007 and 2010. Their contribution is typically very small, however, because they represent only a very small share in total disposable income in the survey, typically less than 2 percent. Although proportionately the share of this
14. See OECD, Statistics on Average Effective Age and Offi cial Age of Retirement in OECD Countries, available at http://www.oecd.org/els/emp/ageingandemploymentpolicies-statisticsonaverageeffectiveageofretirement.htm.
–0.5
0
0.5
1.0
1.5
2.0
Italy* UnitedStates
Germany UnitedKingdom
Ireland Spain Slovakia Greece
Pensions Unemployment benefits Other Total
Gini points
Figure 8 Decomposition of the contribution of employment-related social
insurance to changes in inequality in equivalized total pre-tax incomes,
2007–10
* Italy data are for 2008–10 and are net of tax and social security contributions in contrast to the data for the other countries, which are in gross terms. Source: Luxembourg Income Study Database, 1999–2010, http://www.lisdatacenter.org.

32 PIIE BRIEFING 15-2
source in total income has increased signifi cantly in all countries, its impact remains marginal in absolute terms.
Only in Ireland and Spain did unemployment benefi ts account for more than 2 percent of total dispos-able income in 2010, and the difference in the contributions from this income source to inequality in pre-tax income in these two countries is revealing. In both countries the share of unemployment benefi ts in total income almost doubled between 2007 and 2010. The main difference is that while unemployment benefi ts in Spain became effectively much more progressive, in Ireland they remained broadly unrelated to total income and therefore had minimal impact on inequality. 15
This difference may be related to the unequal duration of benefi ts in these two countries. The net replace-ment rate of unemployment benefi ts in Ireland is average by advanced economy standards (58.8 percent in 2009), but their duration is unusually long, stretching into the fi fth year of an unemployment spell (OECD 2011b). Spain has a higher initial replacement rate (67.7 percent in 2009), but this falls substantially (to 23.5 percent) in the third year of unemployment. As the average unemployment duration increased between 2007 and 2010, unemployment benefi t recipients in Spain but not in Ireland moved down the income ladder. In this situation unemployment benefi ts look more like aid to the poor than an insurance payout linked to past earnings. As such they have a much larger equalizing effect.
Turning to means-tested social assistance, fi gure 9 shows that, in countries most affected by the Great Recession and where social assistance forms a meaningful part of the social safety net, unemployment as-sistance and maternity or child assistance benefi ts contributed the most to reducing inequality in disposable income. Ireland stands out for the apparent effectiveness of its social assistance programs in responding to the impact of the Great Recession on income inequality. This is consistent with Ireland having one of the most
15. From the formula related to the Lerman and Yitzaki decomposition in footnote 11, it is clear that when the distribution of an income source is unrelated to the distribution of total income, the Gini correlation, R
k, will be close to zero, and the contribution to
inequality in total income from this source will therefore also be close to zero.
–1.2
–1.0
–0.8
–0.6
–0.4
–0.2
0
0.2
0.4
Ireland Spain UnitedKingdom
Germany Italy* Slovakia Greece UnitedStates
Unemployment assistanceMaternity/child benefits
OtherTotal
Gini points
Figure 9 Decomposition of the contribution of means-tested social transfers
to changes in inequality in equivalized total pre-tax incomes,
2007–10
* Italy data are for 2008–10 and are net of tax and social security contributions in contrast to the data for the other countries, which are in gross terms.Source: Luxembourg Income Study Database, 1999–2010, http://www.lisdatacenter.org.
33 PIIE BRIEFING 15-2
generous social assistance programs with net income of single social assistance recipients excluding housing benefi ts reaching on average around 40 percent of median household income, compared to around 30 percent for Spain, 20 percent in the United Kingdom, and only around 7 percent in the United States (OECD 2011b).
The impact on income inequality in different countries of different types of welfare programs suggests that benefi ts aimed at the most needy provide a much more potent means of offsetting growing earnings in-equality caused by rising unemployment than benefi ts that are tied to prior earnings or work history. In times of economic prosperity means-tested benefi ts understandably raise concerns about their effect on incentives to work. In a deep recession, however, such concerns are more diffi cult to justify, and governments seeking to ensure that the burden of adjustment to macroeconomic shocks is shared fairly would do well to avoid cutting benefi ts targeted towards those in greatest need.
THE ROLE OF INCOME TAX IN MITIGATING THE IMPACT OF THE GREAT RECESSION ON INCOME INEQUALITY
In the last step of this analysis the income concept is expanded from total pre-tax income to total disposable income by including individuals’ payments of taxes and social security contributions. The same method of decomposing the Gini index by income source introduced previously is used to assess the contributions of total pre-tax income and direct taxes to the change in inequality in disposable income between 2007 and 2010 (fi gure 10). Inequality in total disposable income changed little between 2007 and 2010 in most countries in the sample with the exception of Spain and Slovakia, which saw signifi cant increases in inequality.
The largest contributions from direct taxes to the change in inequality between 2007 and 2010 occurred in countries that signifi cantly changed their income tax and social security systems. The Irish government, faced with collapsing revenues in the wake of the fi nancial crisis and the bursting of its property bubble, in-troduced a new progressive tax on income in the 2009 budget, called an income levy, with the rates further increased in the emergency budget of 2009.16 As a result, the share of direct taxes in disposable income rose and became more progressive, completely offsetting the impact of greater inequality in pre-tax income on inequal-ity in total disposable income.
Greece and Slovakia, by contrast, cut direct taxes between 2007 and 2010. The Slovak government re-sponded to the Great Recession with a stimulus package in 2009 that temporarily but signifi cantly lowered the basic income tax allowance and greatly reduced the social security contributions of the self-employed.17 The combined effect of these measures on income inequality has been the exact opposite of that seen in Ireland. The share of direct taxes in disposable income fell, primarily benefi ting people near the middle of the income distribution rather than low earners whose earnings were largely tax-free even before the increase in the tax allowance. Moreover, selectively reducing social security contributions only for the self-employed made direct taxes signifi cantly less progressive. A self-employed person ended up with a lower tax bill and higher dispos-able income than an employee on a similar pre-tax income. As a result direct taxes contributed signifi cantly to increasing inequality in disposable incomes in Slovakia between 2007 and 2010.
The Greek government lowered the marginal tax rates on the middle two income tax brackets in 2008, shortly before the crisis.18 Together with the shrinking number of taxpayers in the top income tax brackets between 2007 and 2010, discussed above, these changes signifi cantly reduced the share of direct taxes in total disposable in-
16. See Budget 2009 documents for the Republic of Ireland, available at http://www.budget.gov.ie/Budgets/2009/2009.aspx.17. See the Stability Programme of the Slovak Republic for 2008–12, available at http://www.fi nance.gov.sk/en/Documents/1_Adresar_redaktorov/Savov/PS2008_EN_fi nal.pdf. 18. See IMF Article IV consultation staff report on Greece in 2007, available at http://www.imf.org/external/pubs/ft/scr/2008/cr08148.pdf.

34 PIIE BRIEFING 15-2
come. As in Slovakia, the reduction in the share of (progressive) direct taxes in disposable income has increased inequality in disposable incomes.
It may seem surprising that total pre-tax income has an equalizing effect on disposable income in Slo-vakia and Greece, in contrast to all the other countries where unemployment rose in the Great Recession, particularly given that both countries saw a rise in inequality in total pre-tax income (fi gure 6). One should note, however, that in this decomposition framework, the inequality in income from a given source is only one of three factors infl uencing its contribution to overall inequality in total disposable income, the other two being the share of income from that source in total disposable income and the degree of progressivity in the income from that source. In the case of Greece and Slovakia, the effect that reducing the share of total pre-tax income in disposable income between 2007 and 2010—a direct consequence of the tax cuts—had on inequality outweighed the effect of greater inequality in total pre-tax income.
Tax changes in the remaining countries in the sample were of a smaller magnitude. In general countries’ direct taxes tended to mitigate the rise in inequality in the Great Recession. As falling employment reduced the tax base, the top earners picked up a larger share of the tax bill, making direct taxes effectively more progres-sive even without rate changes. The opposite seems to have happened in Germany, where employment rose.
The contrasting effect of tax increases and tax cuts on inequality in disposable income—as illustrated by the experience of Ireland, Slovakia, and Greece—has important policy implications. While taxes are often changed primarily with macroeconomic objectives in mind, the effect on income distribution should not be overlooked. In general, increases in direct taxes will tend to have an equalizing effect, while tax cuts will tend to exacerbate income inequality. That is not to say that tax cuts are not an appropriate means of stimulating
Figure 10 Contributions of total pre-tax income and taxes to change in
inequality in disposable income, 2007–10
–6
–4
–2
0
2
4
6
Germany Ireland UnitedStates
UnitedKingdom
Italy* Greece Slovakia Spain
Total pre-tax income TaxDisposable income Change relative to the precrisis trend
Gini points
* Italy data are for 2008–10 and are in gross terms.Note: The precrisis trend is calculated over the 2000–2007 period using three data points, except for Italy (2000–08, x data points), the United Kingdom (1999–2007, x data points) , and Slovakia (2004–07, two data points). Source: Luxembourg Income Study Database, 1999–2010, http://www.lisdatacenter.org.

35 PIIE BRIEFING 15-2
the economy or that fi scal consolidation measures should happen primarily via increases in direct taxes. The case studies do, however, suggest that a given macroeconomic objective can be achieved with very different distributional outcomes.
CONCLUSIONS AND OUTLOOK
The eight advanced economies analyzed here display considerable diversity in the effect of the Great Recession on income inequality and the ability of families and the state to mitigate its impact through redistribution within households and through public benefi t programs and the tax system. Inequality in total disposable income has changed little between 2007 and 2010 in most countries in the sample with the exception of Spain and Slovakia, which saw signifi cant increases in inequality.
In general the effect of the Great Recession on the distribution of earnings among those who remained employed appears to have been limited in most countries, with the notable exception of Greece where earnings inequality fell in response to severe cuts to public sector wages. The Greek experience suggests that consolida-tion measures and structural reforms aimed at removing special privileges of certain professions and sectors can on balance contribute to equality of incomes.
The fall in employment seen in most countries in the sample between 2007 and 2010 signifi cantly in-creased inequality in earnings among the working-age population in those countries most affected. Given the signifi cance of earnings in total income, developments in employment matter greatly for inequality outcomes. The experience of Germany suggests that policies designed to reduce the impact of a negative economic shock on unemployment can go a long way to mitigating the rise in earnings inequality in a recession.
Greater redistribution of earnings within households relative to the precrisis trend has gone some way to mitigating the effect of the Great Recession on inequality. In some countries this was driven by an increase in the share of single breadwinner households, presumably caused in many cases by one partner losing his or her job. This suggests that policies to increase female labor force participation can play an important role in but-tressing the resilience of household fi nances and mitigating the effect of unemployment on income inequality in future recessions.
With few exceptions government policies—the social safety net and direct taxes—had a much larger miti-gating impact on income disparities, with inequality in disposable incomes little changed between 2007 and 2010 in most countries. The marginal impact of means-tested social assistance benefi ts, which are highly pro-gressive, in mitigating the rise in inequality has been larger than that of work-related social insurance pro-grams, which tend to be regressive.
Existing direct taxes have tended to have an equalizing effect in most countries, as the shrinking tax base has increased their effective progressivity. Ireland illustrates that raising direct tax rates can make a signifi cant contribution to reducing inequality, while Slovakia and Greece illustrate the opposite—tax cuts tend to make the distribution of disposable incomes more unequal.
The impact of the social safety net and direct taxes on the change in inequality in disposable incomes in the Great Recession highlights the importance of the precise nature of the fi scal policy mix in targeting a particular macroeconomic objective, such as stimulating the economy or consolidating public fi nances. Gov-ernments seeking to spread the burden of adjustment fairly among their citizens should keep in mind that different combinations of policies can have very different distributive effects.
The results presented here make it possible to attempt at least a qualitative statement about the likely trend in income inequality since 2010 based on subsequent economic developments. With the exception of Germany, the employment to working-age population ratio has remained broadly stable, in some countries

36 PIIE BRIEFING 15-2
following a decline before 2010 (Italy, the United Kingdom, and the United States) or continuing to decline (Greece, Spain, Slovenia, and Ireland). Given the importance of earnings in total income and the importance of employment in driving changes in earnings inequality, a signifi cant fall in income inequality since 2010 seems unlikely in most countries in the sample.
The other major development seen since 2010 in most advanced economies has been fi scal austerity. Clearly not all consolidation measures need to increase income inequality, and the precise distributional im-pact in any given country will depend on the mix of policies implemented. In general, however, past experience suggests that consolidation episodes tend to be associated with rising income inequality (see for example J. Woo et. al. 2013). It therefore seems more likely than not that income inequality has increased further since 2010 in most of the countries analyzed in this study.19
19. The recovery in asset prices, not analyzed here, is another factor that has probably contributed to rising inequality since 2010 in most countries outside the euro area periphery.

APPENDIX A
37 PIIE BRIEFING 15-2
APPENDIX A: THE DATASET
The analysis in this Policy Brief uses income data from the Luxembourg Income Study (LIS). The LIS team ac-quires reliable microdata from national household in-come surveys, carefully harmonizes and standardizes them, and makes them available for analysis through a secure server to maintain data privacy and confi den-tiality. The LIS has data on 39 advanced- and middle-income countries at about three- to fi ve-year intervals.
Because the focus of this analysis is the period of the Great Recession and because more recent data are not yet available, the analysis is restricted to two survey years, 2007 and 2010, although previous surveys are used to calculate precrisis trends. The 2007–10 period captures the Great Recession and the immediate effects of the fi scal stimulus measures put in place by many advanced economies to mitigate its im-pact. It does not cover develop-ments since 2010, such as the fl aring up of the sovereign debt crisis in Europe, the euro area’s second dip into recession, or the wave of fi scal austerity that swept over the continent. Table A1 lists the countries in the sam-ple and the number of house-holds and individuals contained in each survey.
Using survey data to ana-lyze income inequality has a number of advantages relative to the main alternative, which is data on income shares obtained from tax returns. Most impor-tantly, survey data aim to cap-ture the entire income distribution, not just those people whose income exceeds the tax allowance threshold. Household surveys also contain information on disposable income, including taxes, social security contri-butions, and nontaxable social benefi ts that are not contained in tax return data. Disposable income argu-ably better captures people’s command over resources than taxable income. Moreover, the available microdata make a much more detailed analysis of the drivers of inequality possible.
There are, however, important shortcomings of survey data that one should keep in mind when interpret-ing the results presented here. Survey data are based on only a small sample of the population. Although the
Table A1 Unweighted number of observations in
the LIS data
Households Individuals
2007 2010 2007 2010
Germany 10,921 12,146 24,999 26,952
Greece 6,504 6,029 16,869 15,067
Ireland 5,247 4,333 12,551 11,005
Italy* 7,977 7,951 19,907 19,836
Slovakia 5,450 5,200 16,546 15,335
Spain 13,014 13,109 35,970 34,756
United Kingdom 24,977 25,350 56,926 57,928
United States 75,872 75,188 206,404 204,983
LIS = Luxembourg Income Study
* Italy data are for 2008–10.
Source: Luxembourg Income Study Database, 1999–2010, http://www.lisdatacenter.org.
–10
–8
–6
–4
–2
0
2
4
Germany Greece Ireland Italy* Slovakia Spain UnitedKingdom
UnitedStates
LIS LFS data from OECD
percentage points
Figure A1 Change in employment to working age population ratio, 2007–10
LIS = Luxembourg Income Study; LFS = Labor Force Surveys; OECD = Organization for Economic Cooperation and Development * Italy data are for 2008–10. Sources: Luxembourg Income Study Database, 1999–2010, http://www.lisdatacenter.org; OECD Labor Force Surveys, http://www.oecd.org/employment/emp/onlineoecdemploymentdatabase.htm#unr.
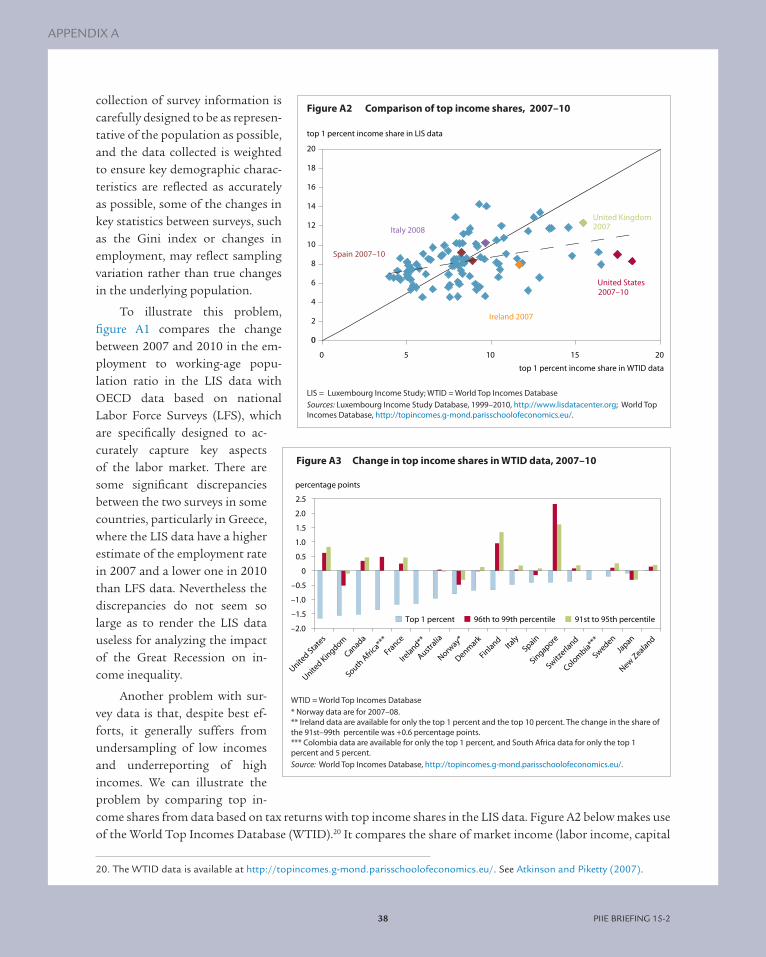
APPENDIX A
38 PIIE BRIEFING 15-2
collection of survey information is carefully designed to be as represen-tative of the population as possible, and the data collected is weighted to ensure key demographic charac-teristics are refl ected as accurately as possible, some of the changes in key statistics between surveys, such as the Gini index or changes in employment, may refl ect sampling variation rather than true changes in the underlying population.
To illustrate this problem, fi gure A1 compares the change between 2007 and 2010 in the em-ployment to working-age popu-lation ratio in the LIS data with OECD data based on national Labor Force Surveys (LFS), which are specifi cally designed to ac-curately capture key aspects of the labor market. There are some signifi cant discrepancies between the two surveys in some countries, particularly in Greece, where the LIS data have a higher estimate of the employment rate in 2007 and a lower one in 2010 than LFS data. Nevertheless the discrepancies do not seem so large as to render the LIS data useless for analyzing the impact of the Great Recession on in-come inequality.
Another problem with sur-vey data is that, despite best ef-forts, it generally suffers from undersampling of low incomes and underreporting of high incomes. We can illustrate the problem by comparing top in-come shares from data based on tax returns with top income shares in the LIS data. Figure A2 below makes use of the World Top Incomes Database (WTID).20 It compares the share of market income (labor income, capital
20. The WTID data is available at http://topincomes.g-mond.parisschoolofeconomics.eu/. See Atkinson and Piketty (2007).
0
2
4
6
8
10
12
14
16
18
20
0 5 10 15 20
United Kingdom 2007
Ireland 2007
Italy 2008
Spain 2007–10
top 1 percent income share in LIS data
top 1 percent income share in WTID data
United States 2007–10
Figure A2 Comparison of top income shares, 2007–10
LIS = Luxembourg Income Study; WTID = World Top Incomes Database Sources: Luxembourg Income Study Database, 1999–2010, http://www.lisdatacenter.org; World Top Incomes Database, http://topincomes.g-mond.parisschoolofeconomics.eu/.
Figure A3 Change in top income shares in WTID data, 2007–10
WTID = World Top Incomes Database * Norway data are for 2007–08. ** Ireland data are available for only the top 1 percent and the top 10 percent. The change in the share of the 91st–99th percentile was +0.6 percentage points. *** Colombia data are available for only the top 1 percent, and South Africa data for only the top 1 percent and 5 percent. Source: World Top Incomes Database, http://topincomes.g-mond.parisschoolofeconomics.eu/.
–2.0
–1.5
–1.0
–0.5
0
0.5
1.0
1.5
2.0
2.5
United States
United Kingdom
Canada
South Afri
ca***
France
Ireland**
Australia
Norway*
Denmark
FinlandIta
lySpain
Singapore
Switzerla
nd
Colombia***
SwedenJa
pan
New Zealand
Top 1 percent 96th to 99th percentile 91st to 95th percentile
percentage points

APPENDIX A
39 PIIE BRIEFING 15-2
APPENDIX A
39 PIIE BRIEFING 15-2
income, and private transfers) going to the top 1 percent of tax reporting units21 in the two datasets covering the period of the past 20 to 40 years, depending on the country. Those country-year observations that appear in this Policy Brief are highlighted. The chart suggests that underreporting of high incomes is particularly se-vere in the United States, the United Kingdom, and Ireland. But there are also many points above the 45 degree line. For these country-years, undersampling of low incomes may be a bigger problem than underreporting of high ones. However, discrepancies may also arise for other reasons, such as underreporting of certain sources of income such as income from capital.
The implication for the results presented here is that they are unlikely to fully refl ect the impact of the Great Recession on the very rich. This is signifi cant because the WTID data suggests that the top 1 percent are different. Not only have they seen a much faster rise in their share of income over the past 30 years in many countries, they have also been hit harder by the Great Recession than those occupying the 90th to 99th per-centile of the income distribution (fi gure A3). This probably refl ects developments in capital incomes, such as incomes from interest and dividends, which accrue disproportionately to richer households.
21. The tax reporting unit in some countries is the individual, while in others it is the household/family. For the purpose of this fi gure, the household is treated as the unit of analysis in the LIS for country-years where the tax reporting unit in the WTID data is the household, and the individual is used as the unit of analysis in the LIS for country-years where the tax reporting unit is the individual.
REFERENCESAtkinson, A. B., and A. Brandolini. 2006. From Earnings Dispersion to Income Inequality. In Inequality and Economic Integration, eds. F. Farina and E. Savaglio. London: Routledge.
Atkinson, A. B., and T. Piketty. 2007. Top Incomes Over the 20th Century. London: Oxford University Press.
Cowell, F. A. 2011. Measuring Inequality. London: Oxford University Press.
Harkness, S. 2013. Women’s Employment and Household Income Inequality. In Income Inequality: Economic Disparities and the Middle Class in Affl uent Countries, eds. J. C. Gornick and M. Jäntti. Palo Alto, CA: Stanford University Press.
Lerman, R. I., and S. Yitzhaki. 1985. Income Inequality Effects by Income Source: A New Approach and Applications to the United States. Review of Economics and Statistics 67, no. 1: 151–56.
OECD (Organization for Economic Cooperation and Development). 2011a. Divided We Stand: Why Inequality Keeps Rising. Paris. Avail-able at http://dx.doi.org/10.1787/9789264119536-en (accessed on December 5, 2013).
OECD. 2011b. Income Support for the Unemployed: How Well Has the Safety-Net Held Up During the “Great Recession”? In OECD Employment Outlook 2011. Paris. Available at http://dx.doi.org/10.1787/empl_outlook-2011-3-en (accessed on December 5, 2013).
OECD. 2013. All in it together? The experience of different labour market groups following the crisis. In OECD Employment Outlook 2013. Paris. Available at http://dx.doi.org/10.1787/empl_outlook-2013-5-en (accessed on December 5, 2013).
Ólafsson, S., and A. S. Kristjánsson. 2013. Income Inequality in Boom and Bust: A Tale from Iceland’s Bubble Economy. In Income Inequality: Economic Disparities and the Middle Class in Affl uent Countries, eds. J.C. Gornick and M. Jäntti. Palo Alto, CA: Stanford University Press.
Woo, J.; Bova, E.; Kinda, T.; and Y. S. Zhang. 2013. Distributional Consequences of Fiscal Consolidation and the Role of Fiscal Policy: What Do the Data Say? IMF Working Paper 13/195. Washington: International Monetary Fund.

40 PIIE BRIEFING 15-2
JOB CREATION AND A HEALTHY US ECONOMY
JUSTIN WOLFERS
162
−145
−42
9
169209
174
95
−298
−424
89
173 188 199260
−400
−200
0
200
400
thousands of jobs created per month
20002001
20022003
20042005
20062007
20082009
20102011
20122013
2014
Figure 1 Job growth, 2000–2014
Source: Federal Reserve Economic Data.
JUSTIN WOLFERS is senior fellow at the Peterson Institute for International Economics and professor of economics and public policy at the University of Michigan.
Testimony before the US Senate Committee on Finance hearing “Jobs and a Healthy Economy,” January 22, 2015.
Chairman Hatch, Ranking Member Wyden, and Members of the Committee, thank you for inviting me to speak with you today on the important issues of job creation and a healthy economy. Before continuing, let me add the obvious disclaimer that I am speaking only for myself.
AN IMPROVING ECONOMY
From a macroeconomic perspective, the la-bor market recovery is robust. In 2014, non-farm payrolls grew by an average of 260,000 jobs per month, the fastest rate not only through this recovery but also since 1999 (fi gure 1).
It fi nally appears that the recovery has developed reliable momentum. Aggregate GDP statistics also bear this out, although they suggest that rates of economic growth through the recovery are better described as moderate—typically in the 2 to 2½ percent range (fi gure 2). The juxtaposition of mod-erate GDP growth and robust employment growth refl ects the fact that productivity growth has been a bit slow through the re-covery.
Even so, robust job growth has led to a decline in the unemployment rate from nearly 10 percent through most of 2010 to 5.6 percent at the end of 2014 (fi gure 3).
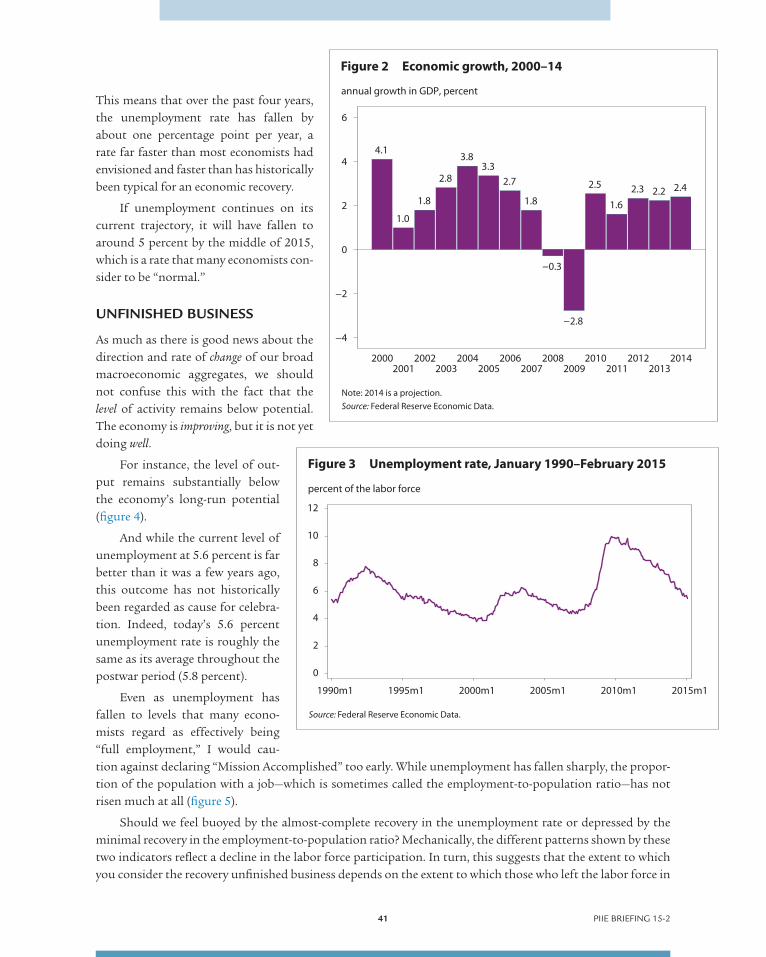
41 PIIE BRIEFING 15-2
This means that over the past four years, the unemployment rate has fallen by about one percentage point per year, a rate far faster than most economists had envisioned and faster than has historically been typical for an economic recovery.
If unemployment continues on its current trajectory, it will have fallen to around 5 percent by the middle of 2015, which is a rate that many economists con-sider to be “normal.”
UNFINISHED BUSINESS
As much as there is good news about the direction and rate of change of our broad macroeconomic aggregates, we should not confuse this with the fact that the level of activity remains below potential. The economy is improving, but it is not yet doing well.
For instance, the level of out-put remains substantially below the economy’s long-run potential (fi gure 4).
And while the current level of unemployment at 5.6 percent is far better than it was a few years ago, this outcome has not historically been regarded as cause for celebra-tion. Indeed, today’s 5.6 percent unemployment rate is roughly the same as its average throughout the postwar period (5.8 percent).
Even as unemployment has fallen to levels that many econo-mists regard as effectively being “full employment,” I would cau-tion against declaring “Mission Accomplished” too early. While unemployment has fallen sharply, the propor-tion of the population with a job—which is sometimes called the employment-to-population ratio—has not risen much at all (fi gure 5).
Should we feel buoyed by the almost-complete recovery in the unemployment rate or depressed by the minimal recovery in the employment-to-population ratio? Mechanically, the different patterns shown by these two indicators refl ect a decline in the labor force participation. In turn, this suggests that the extent to which you consider the recovery unfi nished business depends on the extent to which those who left the labor force in
4.1
1.0
1.8
2.8
3.83.3
2.7
1.8
−0.3
−2.8
2.5
1.62.3 2.2 2.4
−4
−2
0
2
4
6
annual growth in GDP, percent
20002001
20022003
20042005
20062007
20082009
20102011
20122013
2014
Figure 2 Economic growth, 2000–14
Note: 2014 is a projection.Source: Federal Reserve Economic Data.
0
2
4
6
8
10
12
percent of the labor force
1990m1 1995m1 2000m1 2005m1 2010m1 2015m1
Figure 3 Unemployment rate, January 1990–February 2015
Source: Federal Reserve Economic Data.

42 PIIE BRIEFING 15-2
59.3
58
60
62
64
percent of the population
1990m1 1995m1 2000m1 2005m1 2010m1 2015m1
Figure 5 Share of the population with a job, January 1990–
February 2015
Source: Federal Reserve Economic Data.
42
44
46
48
50
52
542000Q12000Q32001Q12001Q32002Q12002Q32003Q12003Q32004Q12004Q32005Q12005Q32006Q12006Q32007Q12007Q32008Q12008Q32009Q12009Q32010Q12010Q32011Q12011Q32012Q12012Q32013Q12013Q32014Q12014Q3
PotentialActual
Source: Federal Reserve Economic Data.
GDP per capita (thousands of dollars)
Figure 4 Real GDP per capita, 2000Q1–2014Q4

43 PIIE BRIEFING 15-2
recent years would be willing to work if suffi cient opportunities for mean-ingful work were available.
The decline in labor force partici-pation since 2000—and its steepening decline since 2008—is rather remark-able, coming as it does after decades of rising participation (fi gure 6). That rising participation had refl ected the entry of women into the workforce, a phenomenon that slowed in the 2000s and will likely require policy action such as adopting paid parental leave and other family-friendly policies in order to see further large gains.
The more recent decline in par-ticipation refl ects both cyclical and structural factors. Most economists agree that at least half of the decline in labor force participation since 2007 is due to population aging, and this has become a particularly important force as the leading edge of the baby boom cohort hit age 62 in 2008. This is just the beginning of a longer-run de-mographic shift that will continue to push the participation rate down over the next 15 years as the rest of the baby boomers enter prime retirement age.
While demographics explain half of the decline in participation, the factors responsible for the other half remain unclear, as this remains a contested issue, and there is no shortage of economists with their own preferred explanations.
It remains possible that much of this may refl ect the ongoing effects of the recent recession, which led many discouraged workers to simply stop looking for a job. If this interpretation is correct, then today’s de-pressed labor force participation rate disguises a “reserve army” of unemployed, who will return to the work-force when jobs become plentiful. By this view, the recovery still has a long way to run, and policy should be focused on ensuring that the recovery is long and strong enough to get these folks back to work.
The view that today’s low participation rates partly refl ect hidden unemployment is consistent with my own preferred interpretation, which is based on the evidence that cyclical downturns continue to depress labor force participation for several years after the ensuing recovery. By this view, today’s weak participation partly refl ects the weak economy two, three, four, or even fi ve years ago. If this view is correct—and there is evidence from state business cycles to support it—then we are still some distance from full employment, and an ongoing economic recovery will lead participation rates to rise moderately over the next year or two.
Beyond this specifi c view, the more important point is that the understanding of economists about what constitutes full employment remains quite imprecise, and there is substantial uncertainty about how much farther this recovery can continue without igniting infl ationary pressures. If the recovery continues, we may end up learning that the economy can sustain not only higher labor force participation but also an unemploy-ment rate of four-point-something percent, rather than fi ve-point-something. Certainly, the 1990s suggests
62.8
62
64
66
68
percent of the population in the labor force
1990m1 1995m1 2000m1 2005m1 2010m1 2015m1
Figure 6 Labor force participation rate, January 1990–
February 2015
Source: Federal Reserve Economic Data.
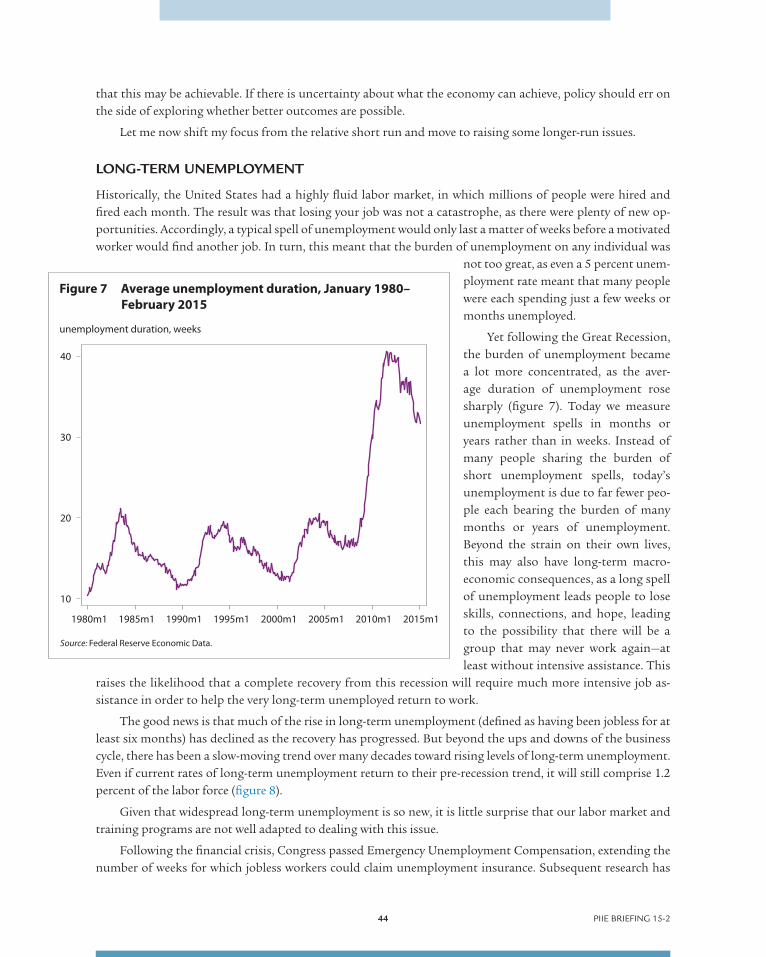
44 PIIE BRIEFING 15-2
that this may be achievable. If there is uncertainty about what the economy can achieve, policy should err on the side of exploring whether better outcomes are possible.
Let me now shift my focus from the relative short run and move to raising some longer-run issues.
LONG-TERM UNEMPLOYMENT
Historically, the United States had a highly fl uid labor market, in which millions of people were hired and fi red each month. The result was that losing your job was not a catastrophe, as there were plenty of new op-portunities. Accordingly, a typical spell of unemployment would only last a matter of weeks before a motivated worker would fi nd another job. In turn, this meant that the burden of unemployment on any individual was
not too great, as even a 5 percent unem-ployment rate meant that many people were each spending just a few weeks or months unemployed.
Yet following the Great Recession, the burden of unemployment became a lot more concentrated, as the aver-age duration of unemployment rose sharply (fi gure 7). Today we measure unemployment spells in months or years rather than in weeks. Instead of many people sharing the burden of short unemployment spells, today’s unemployment is due to far fewer peo-ple each bearing the burden of many months or years of unemployment. Beyond the strain on their own lives, this may also have long-term macro-economic consequences, as a long spell of unemployment leads people to lose skills, connections, and hope, leading to the possibility that there will be a group that may never work again—at least without intensive assistance. This
raises the likelihood that a complete recovery from this recession will require much more intensive job as-sistance in order to help the very long-term unemployed return to work.
The good news is that much of the rise in long-term unemployment (defi ned as having been jobless for at least six months) has declined as the recovery has progressed. But beyond the ups and downs of the business cycle, there has been a slow-moving trend over many decades toward rising levels of long-term unemployment. Even if current rates of long-term unemployment return to their pre-recession trend, it will still comprise 1.2 percent of the labor force (fi gure 8).
Given that widespread long-term unemployment is so new, it is little surprise that our labor market and training programs are not well adapted to dealing with this issue.
Following the fi nancial crisis, Congress passed Emergency Unemployment Compensation, extending the number of weeks for which jobless workers could claim unemployment insurance. Subsequent research has
10
20
30
40
unemployment duration, weeks
1980m1 1985m1 1990m1 1995m1 2000m1 2005m1 2010m1 2015m1
Figure 7 Average unemployment duration, January 1980–
February 2015
Source: Federal Reserve Economic Data.

45 PIIE BRIEFING 15-2
shown that this actually helped the long-term unemployed remain in the labor force and supported their job search.
Congress should consider mak-ing this process of extending bene-fi ts automatic for future downturns of suffi cient severity. Such a move would remove the need for specifi c congressional action (which often comes with a lag), and a well-crafted formula would also offer Congress the assurance that such extensions would disappear when business cycle conditions returned to normal.
Indeed, let me expand on this theme a bit, by raising the possibility of using such automatic stabilizers more aggressively.
PREVENTING FUTURE RECESSIONS AND AN INCREASING ROLE FOR AUTOMATIC STABILIZERS
The most recent recession has highlighted an important shortcoming in relying on the Federal Reserve to manage the business cycle: When interest rates hit zero, there is limited scope for further monetary action to stimulate the economy. Indeed, we now understand that in a low infl ation environment, it is very diffi cult for the Fed to engineer the sorts of suffi ciently low real interest rates that may be required to offset adverse economic shocks.
This suggests that it may be important to build more automatic stabilizers into our economy. We already have some automatic stabilizers built in, such as a progressive tax system, which means that when income falls, so too will tax rates. Likewise, some federal programs, like the Unemployment Insurance Extended Benefi ts, provide needed income that leads to increased spending during periods of high unemployment.
This idea of building in a countercyclical spending pattern is one that Congress could expand substantial-ly, building formulae into an array of federal programs that would increase spending during periods of slow economic activity and lower spending during periods of stronger activity. I have already raised the idea that the Emergency Unemployment Compensation program could be put in place so that it is automatically triggered whenever long-term unemployment rises again in the future. But the idea is far more broadly applicable, and similar triggers could be built into programs ranging from federal highway and infrastructure spending, to Pell grants, to making block grants to states for Temporary Assistance for Needy Families (TANF) responsive to economic conditions.
Not only would the automaticity of these mechanisms minimize the legislative lags that often undermine fi scal stimulus, but they would increase spending precisely when the value of that spending was highest and curtail spending as the value falls. And the use of formulae would allow the debate about how best to respond to cyclical changes to be divorced from the very different debate about how much should be spent on each of these programs.
Automatic stabilizers also have important benefi ts beyond the role they play in taming the business cycle.
1.7
1.2
0.0
1.0
2.0
3.0
4.0
5.0
1950m1 1960m1 1970m1 1980m1 1990m1 2000m1 2010m1 2020m1
Figure 8 Long-term unemployment rate, 1948–February 2015
Note: Dashed line shows pre-recession trend.Source: Federal Reserve Economic Data.
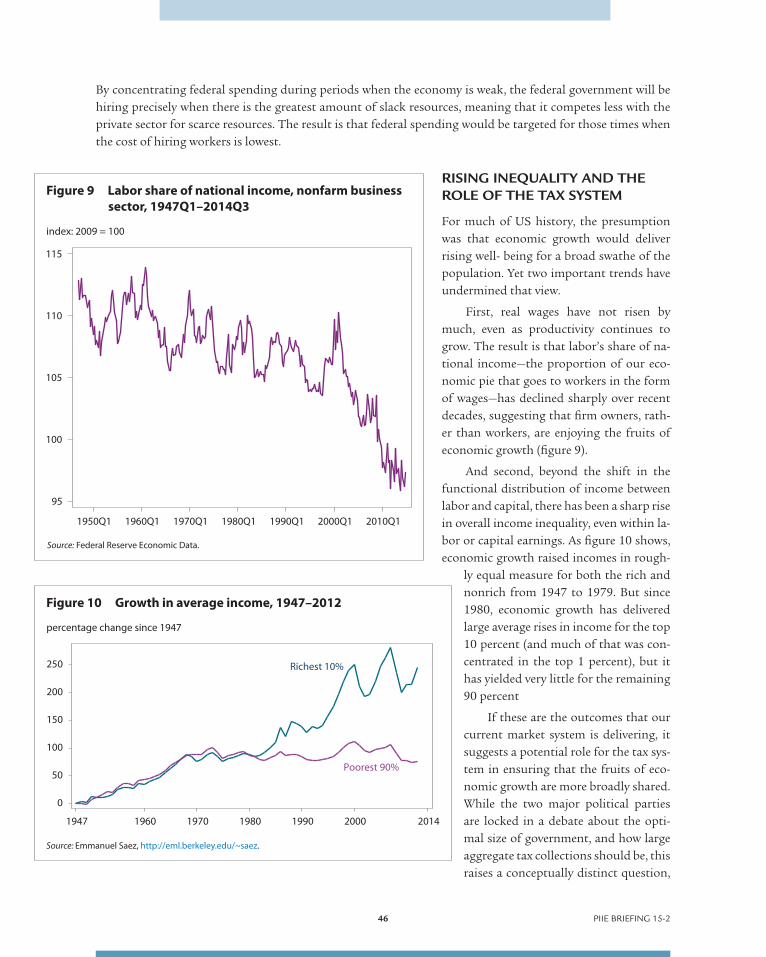
46 PIIE BRIEFING 15-2
By concentrating federal spending during periods when the economy is weak, the federal government will be hiring precisely when there is the greatest amount of slack resources, meaning that it competes less with the private sector for scarce resources. The result is that federal spending would be targeted for those times when the cost of hiring workers is lowest.
RISING INEQUALITY AND THE ROLE OF THE TAX SYSTEM
For much of US history, the presumption was that economic growth would deliver rising well- being for a broad swathe of the population. Yet two important trends have undermined that view.
First, real wages have not risen by much, even as productivity continues to grow. The result is that labor’s share of na-tional income—the proportion of our eco-nomic pie that goes to workers in the form of wages—has declined sharply over recent decades, suggesting that fi rm owners, rath-er than workers, are enjoying the fruits of economic growth (fi gure 9).
And second, beyond the shift in the functional distribution of income between labor and capital, there has been a sharp rise in overall income inequality, even within la-bor or capital earnings. As fi gure 10 shows, economic growth raised incomes in rough-
ly equal measure for both the rich and nonrich from 1947 to 1979. But since 1980, economic growth has delivered large average rises in income for the top 10 percent (and much of that was con-centrated in the top 1 percent), but it has yielded very little for the remaining 90 percent
If these are the outcomes that our current market system is delivering, it suggests a potential role for the tax sys-tem in ensuring that the fruits of eco-nomic growth are more broadly shared. While the two major political parties are locked in a debate about the opti-mal size of government, and how large aggregate tax collections should be, this raises a conceptually distinct question,
95
100
105
110
115
index: 2009 = 100
1950Q1 1960Q1 1970Q1 1980Q1 1990Q1 2000Q1 2010Q1
Figure 9 Labor share of national income, nonfarm business
sector, 1947Q1–2014Q3
Source: Federal Reserve Economic Data.
Richest 10%
Poorest 90%
0
50
100
150
200
250
percentage change since 1947
1947 1960 1970 1980 1990 2000 2014
Figure 10 Growth in average income, 1947–2012
Source: Emmanuel Saez, http://eml.berkeley.edu/~saez.

47 PIIE BRIEFING 15-2
which is how best to distribute that tax burden. This is a debate that can occur even without shifting the over-all tax burden. Higher taxes on the few who have enjoyed unusually strong returns, if it leads to lower taxes on many other workers, may even enhance overall incentives for productive activity while also reducing inequality.
INVESTING IN EDUCATION
For much of the past century, economic growth and opportunity in the United States have been supported by rising levels of education. Typically, each generation of Americans got around two more years of education than their parents. Yet in the past few decades, this trend has slowed dramatically, and virtually halted for men. Indeed, the current crop of 30-year-old men are barely more educated than their parents were (fi gure 11).
The “high school movement” in the early 20th century led to a substantial expansion of secondary education. And while I recognize that these issues lie largely outside the committee’s jurisdiction, I think it nonetheless is important to make the case that now is the time for a broad-er “college movement,” which makes both two-year and four-year colleges more widely available.
The president’s proposal to ex-pand access to community college seems like a natural fi rst step in this agenda. But this is an agenda that would also benefi t from four comple-mentary reforms. First, college readi-ness remains an important barrier for many students, and an emerging body of evidence suggests that the roots of these gaps arise in early childhood. This suggests that investments in pre-K education may also help yield better long-run outcomes. Second, while there are some excellent ter-tiary institutions, far too many of them—and far too many in the community college sector—yield low-quality education and result only in students dropping out from colleges. The sector needs to be reformed, with an emphasis on raising the quality of community college education, providing more support for struggling stu-dents, and the federal government should stop funding underperforming tertiary institutions. Third, a variety of innovative education programs have shown that even very small low-cost nudges—such as help in navigat-ing the Free Application for Federal Student Aid process, a text message to remind you of your deadlines, a personalized letter letting you know that a high-quality college education may actually be affordable given the array of funding opportunities available—can have very large effects. Successful programs should be scaled up, and federal grants should be made for ongoing innovation in simplifying the college application process and making the relatively low cost of college substantially more transparent. And fourth, the expensive big-ticket items, like the Hope Tax Credit, the Lifetime Learning Credit, and the American Opportunity Tax Credit, are potentially useful but should be tightly tailored to families most in need, both because that is where the college attendance gap is the largest and also because this is where extra federal dollars are most likely to have their largest effect. Moreover, these credits are most likely to be effective if coupled with the sorts of information campaigns and nudges I just mentioned.
Labor markets and a healthy economy are of paramount importance to the health, happiness, and well-being of all Americans, and I appreciate the opportunity to share my assessment with you today.
Men
Women
6
8
10
12
14
years of education by age 30 for US born
1880 1900 1920 1940 1960 1980
Figure 11 Years of education, by cohort, 1880–1980
Source: Updated data obtained from Claudia Goldin and Lawrence Katz (originally published in The Race Between Education and Technology, Harvard University Press, 2008).

PETERSON INSTITUTE FOR INTERNATIONAL ECONOMICS1750 Massachusetts Avenue, NWWashington, DC 20036-1903(202) 328-9000 FAX: (202) 659-3225www.piie.com