Embed Size (px)
Citation preview
WHICAPWashington
Heights/Hamilton Heights-Inwood Columbia Aging
Project
Jennifer J. Manly, PhDColumbia University Medical Center
Acknowledgements
• Funded in part by Grant R13AG030995-01A1 from the National Institute on Aging
• The views expressed in written conference materials or publications and by speakers and moderators do not necessarily reflect the official policies of the Department of Health and Human Services; nor does mention by trade names, commercial practices, or organizations imply endorsement by the U.S. Government.
CollaboratorsMaria GlymourChristopher WeissAdam BrickmanKaren SiedleckiRobert Heaton
Supported by• NIA R01 AG16206 (PI: Manly)• NIA P01 AG07232 (PI: Mayeux)
Lenny CedanoRaquel CaboYaakov SternRichard MayeuxNicole Schupf
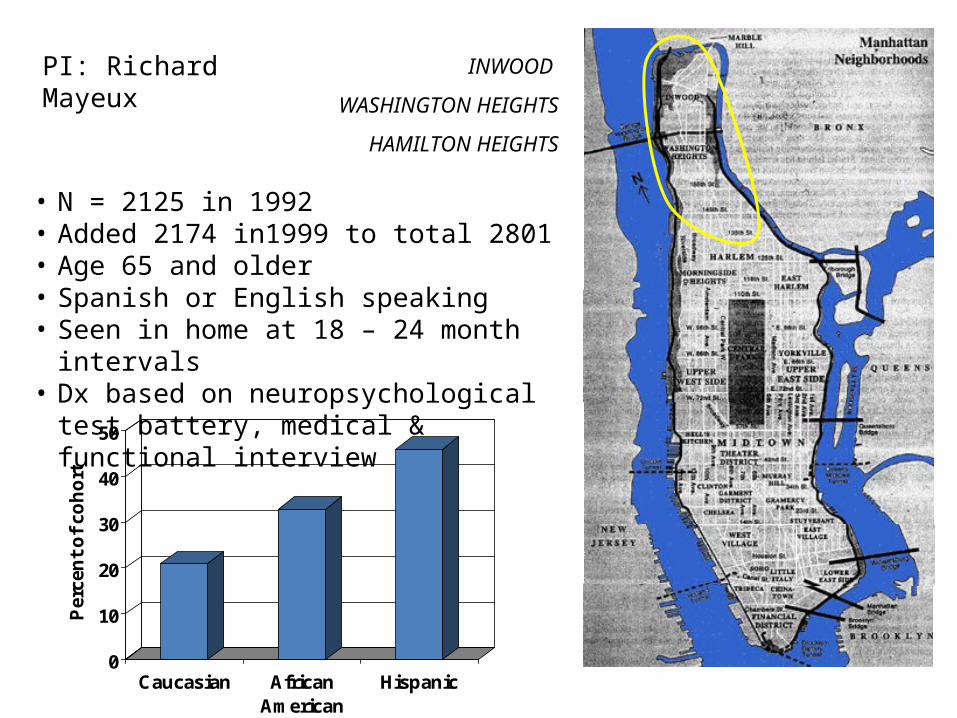
INWOOD
WASHINGTON HEIGHTS
HAMILTON HEIGHTS• N = 2125 in 1992• Added 2174 in1999 to total 2801• Age 65 and older• Spanish or English speaking• Seen in home at 18 – 24 month intervals• Dx based on neuropsychological test battery,
medical & functional interview
0
10
20
30
40
50
Per
cen
t o
f co
ho
rt
Caucasian AfricanAmerican
Hispanic
PI: Richard Mayeux
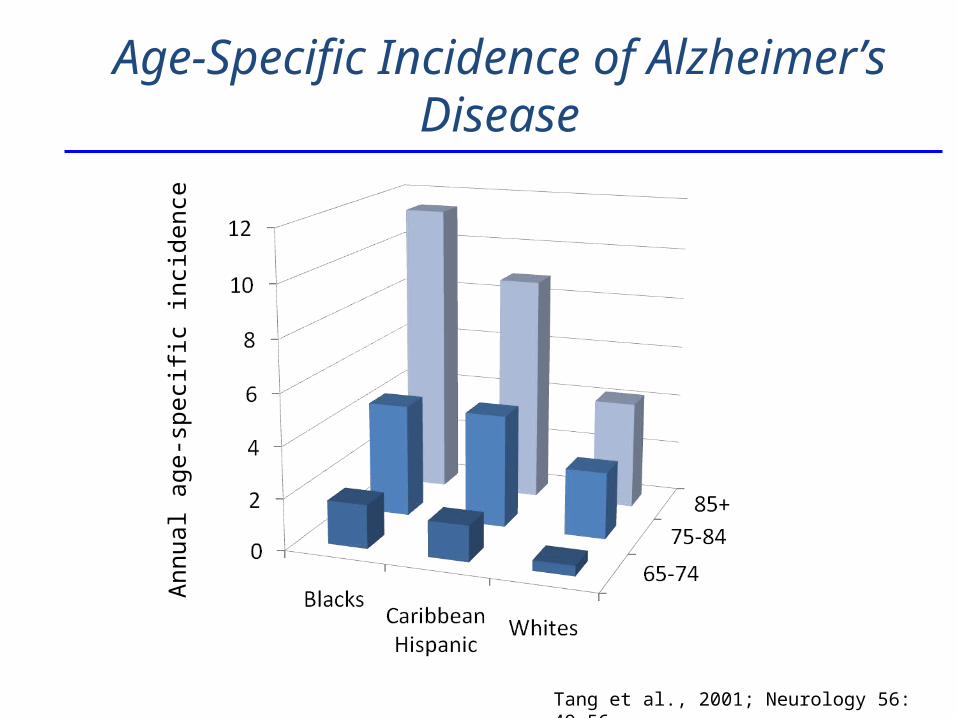
Age-Specific Incidence of Alzheimer’s Disease
Annu
al a
ge-s
peci
fic in
cide
nce
Tang et al., 2001; Neurology 56: 49-56
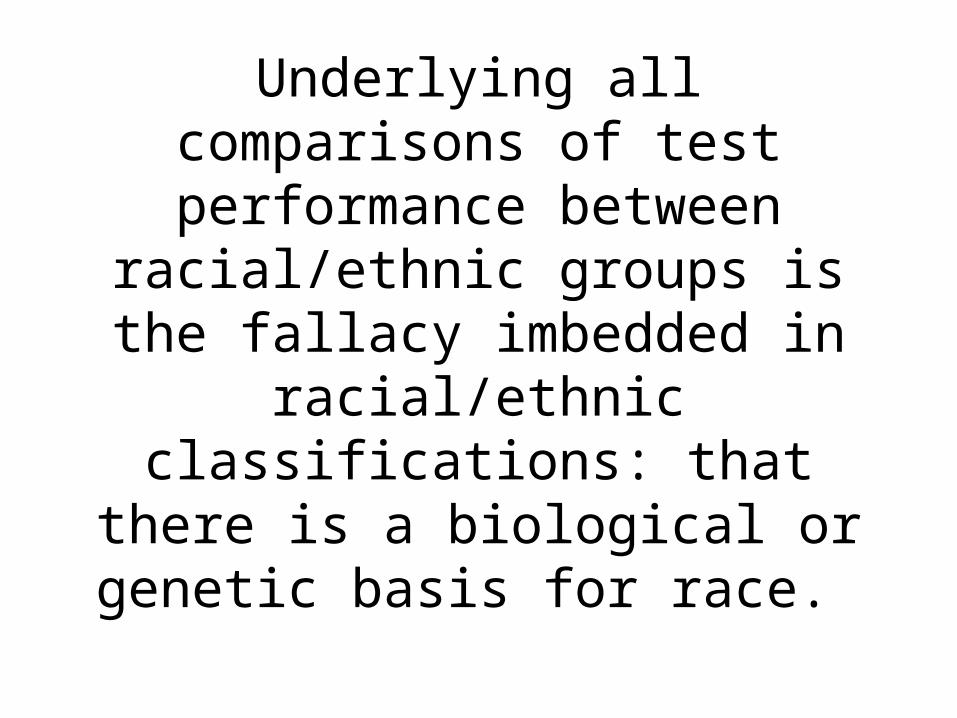
Underlying all comparisons of test performance between racial/ethnic
groups is the fallacy imbedded in racial/ethnic classifications: that
there is a biological or genetic basis for race.
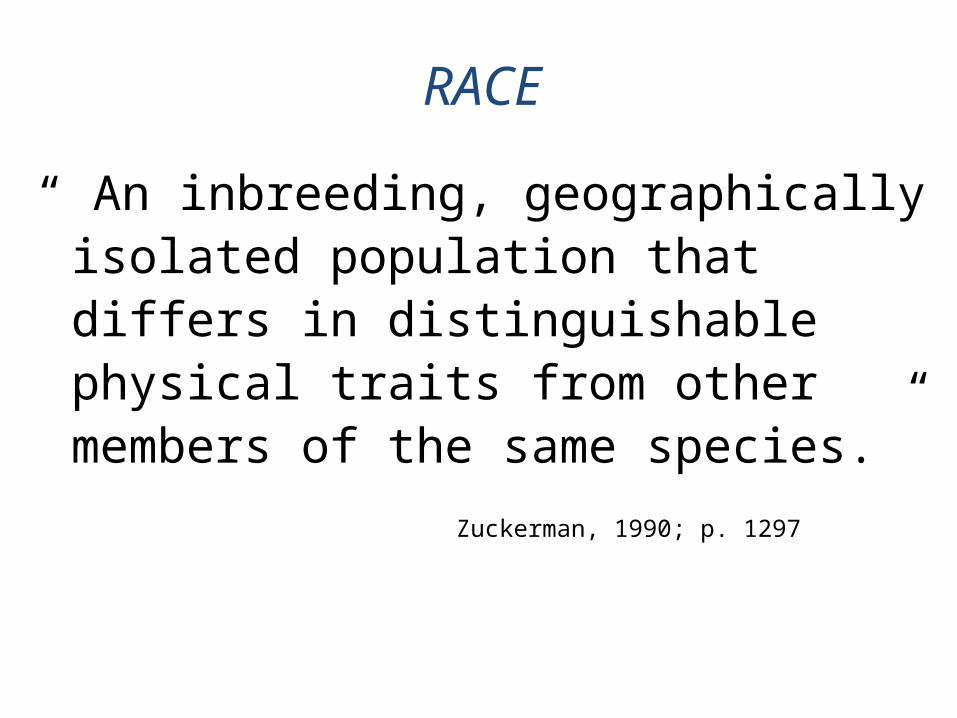
RACE
“ An inbreeding, geographically isolated population that differs in distinguishable physical traits from other members of the same species.”
Zuckerman, 1990; p. 1297
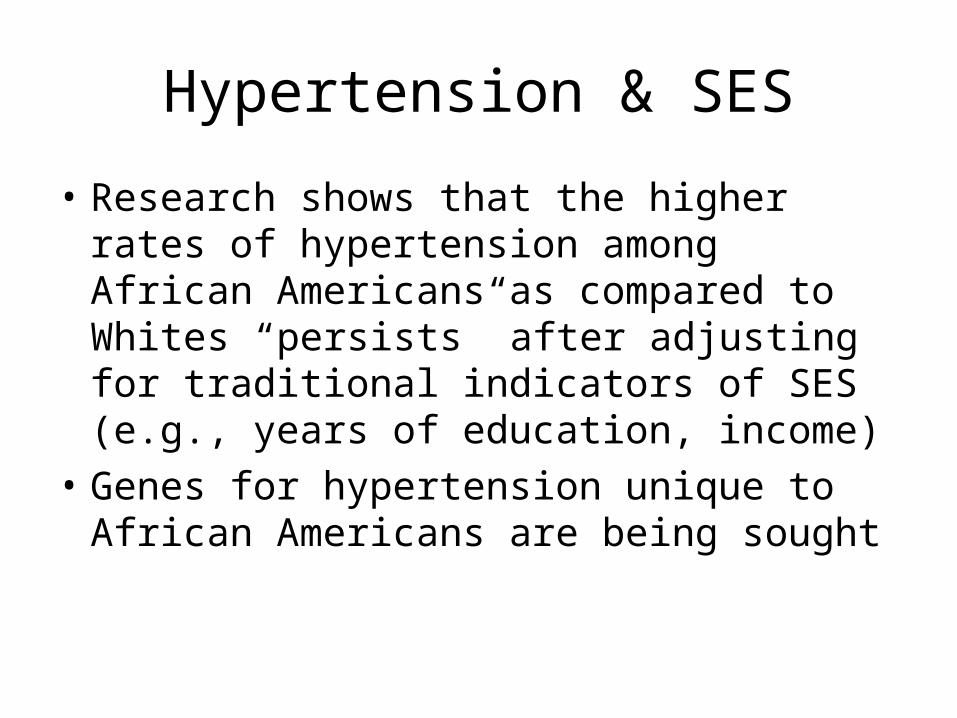
Hypertension & SES
• Research shows that the higher rates of hypertension among African Americans as compared to Whites “persists” after adjusting for traditional indicators of SES (e.g., years of education, income)
• Genes for hypertension unique to African Americans are being sought
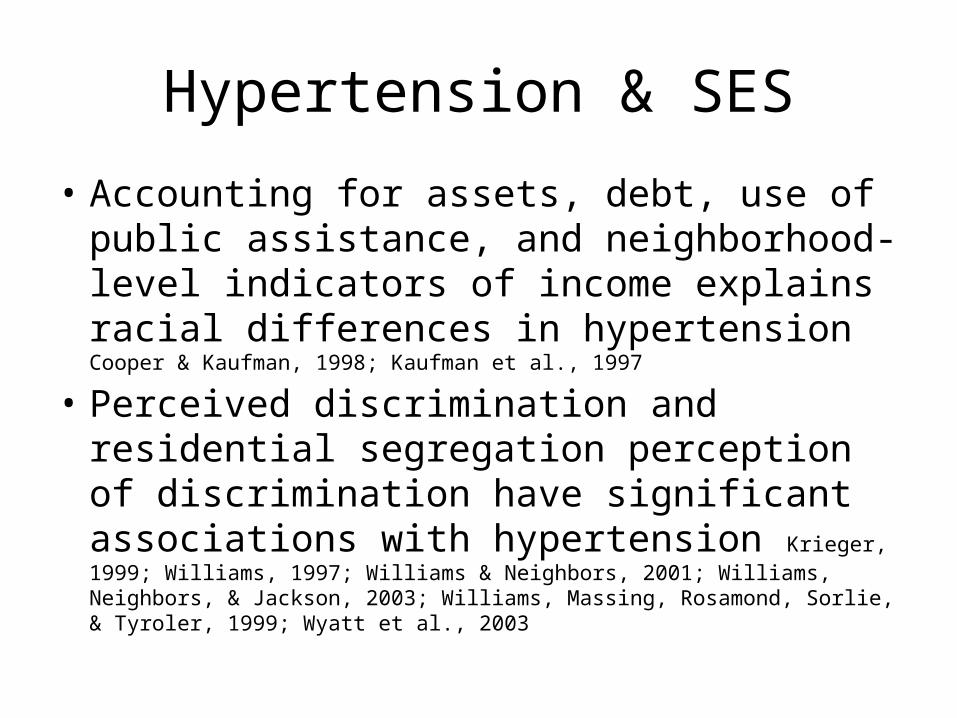
Hypertension & SES
• Accounting for assets, debt, use of public assistance, and neighborhood-level indicators of income explains racial differences in hypertension Cooper & Kaufman, 1998; Kaufman et al., 1997
• Perceived discrimination and residential segregation perception of discrimination have significant associations with hypertension Krieger, 1999; Williams, 1997; Williams & Neighbors, 2001; Williams, Neighbors, & Jackson, 2003; Williams, Massing, Rosamond, Sorlie, & Tyroler, 1999; Wyatt et al., 2003
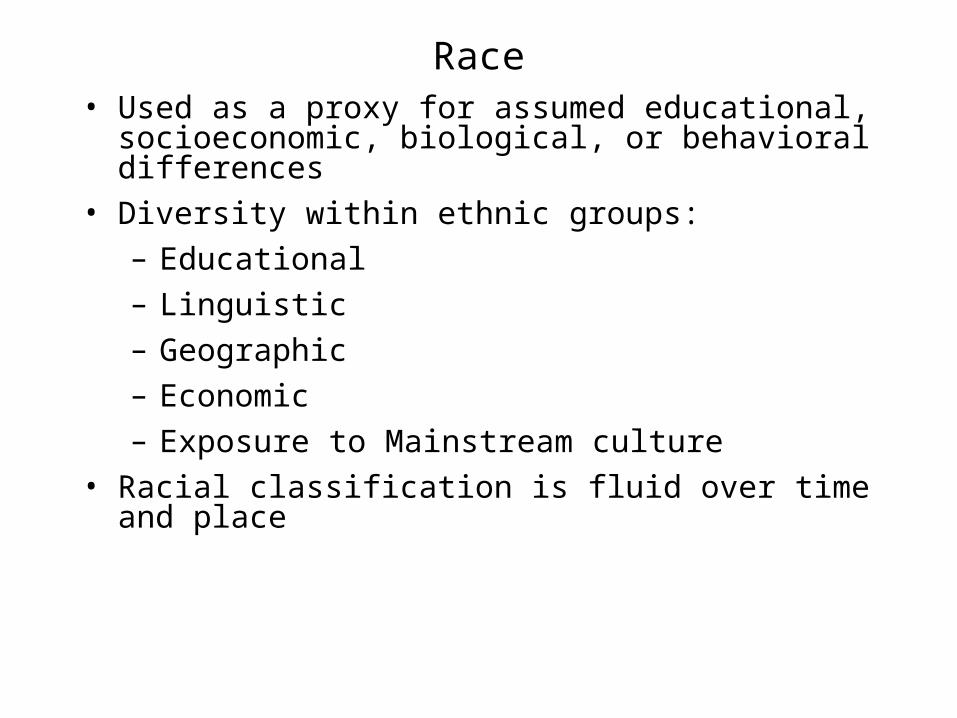
Race• Used as a proxy for assumed educational, socioeconomic,
biological, or behavioral differences • Diversity within ethnic groups:
– Educational– Linguistic– Geographic– Economic– Exposure to Mainstream culture
• Racial classification is fluid over time and place
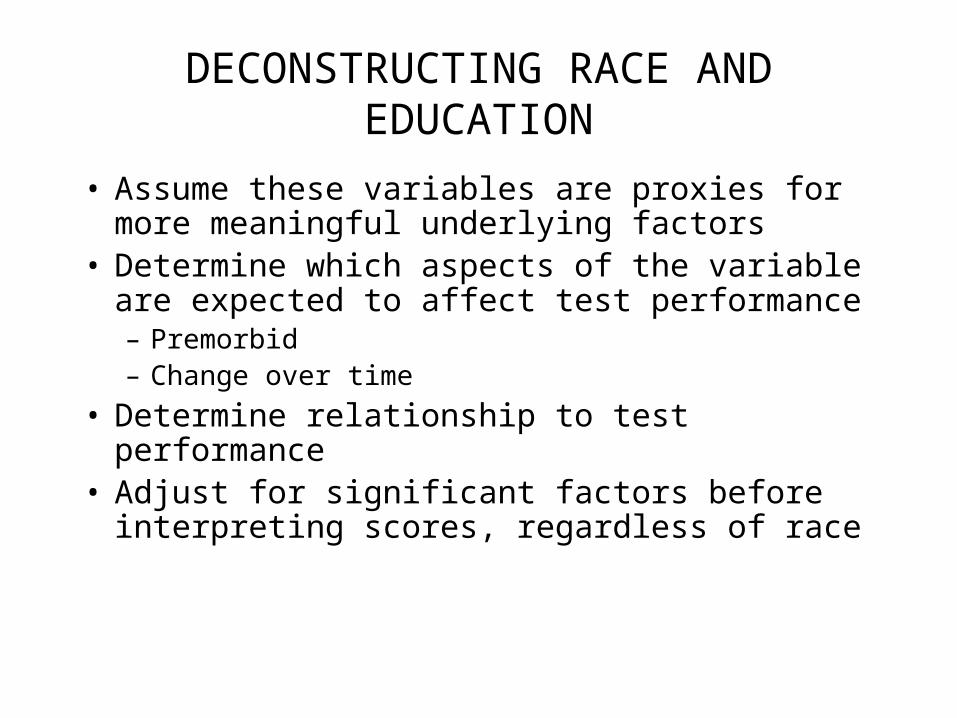
DECONSTRUCTING RACE AND EDUCATION
• Assume these variables are proxies for more meaningful underlying factors
• Determine which aspects of the variable are expected to affect test performance– Premorbid– Change over time
• Determine relationship to test performance• Adjust for significant factors before interpreting
scores, regardless of race
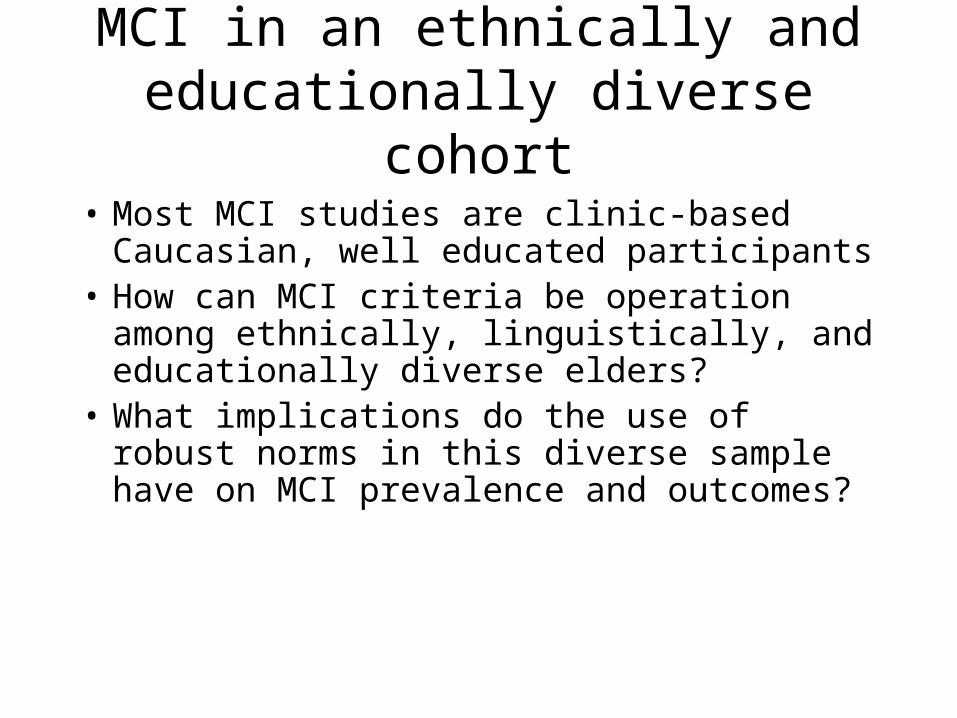
MCI in an ethnically and educationally diverse cohort
• Most MCI studies are clinic-based Caucasian, well educated participants
• How can MCI criteria be operation among ethnically, linguistically, and educationally diverse elders?
• What implications do the use of robust norms in this diverse sample have on MCI prevalence and outcomes?
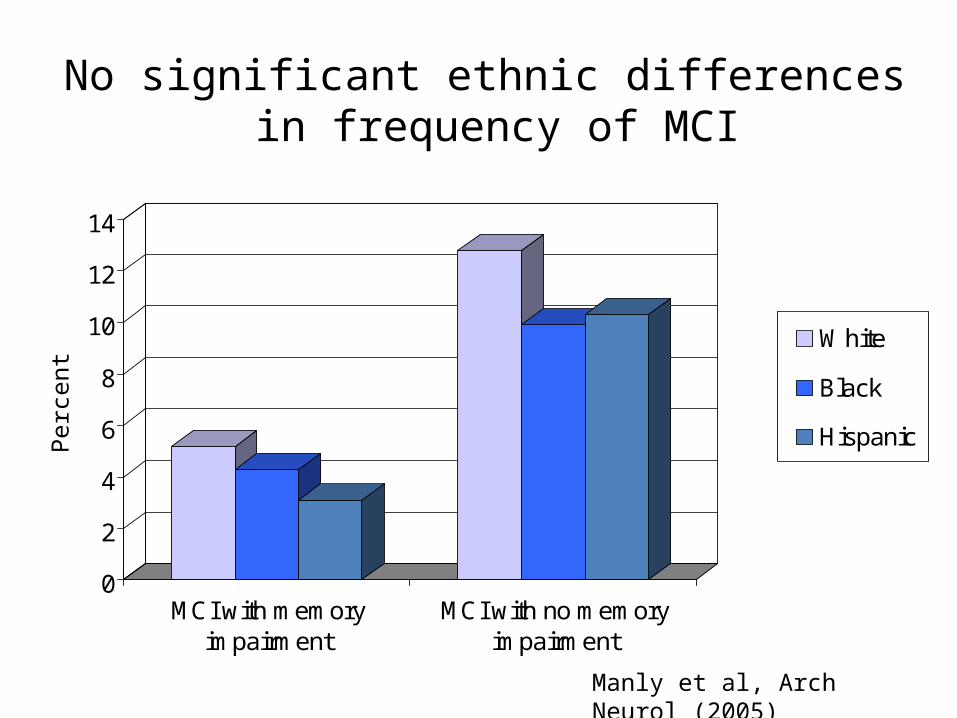
No significant ethnic differences in frequency of MCI
0
2
4
6
8
10
12
14
MCI with memoryimpairment
MCI with no memoryimpairment
White
Black
HispanicPerc
ent
Manly et al, Arch Neurol (2005)
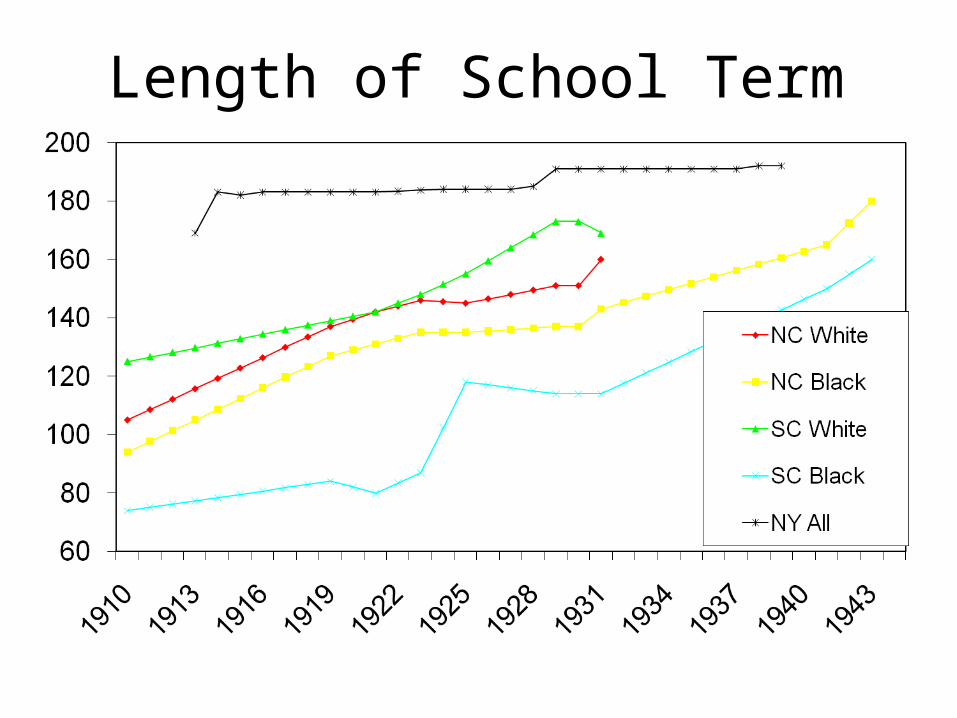
Length of School Term
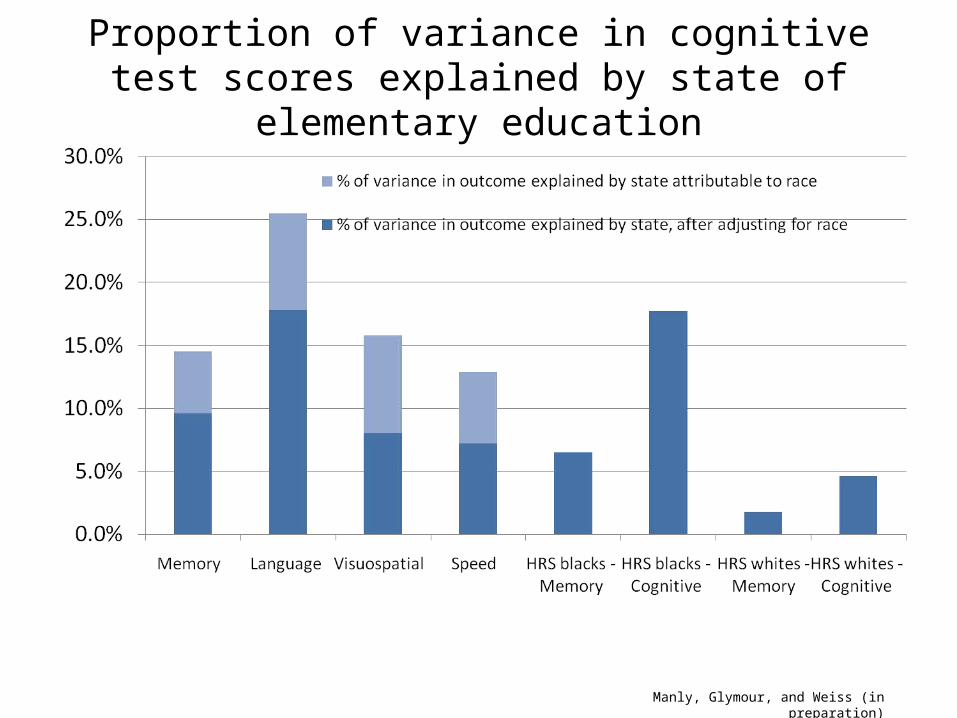
Proportion of variance in cognitive test scores explained by state of elementary education
Manly, Glymour, and Weiss (in preparation)
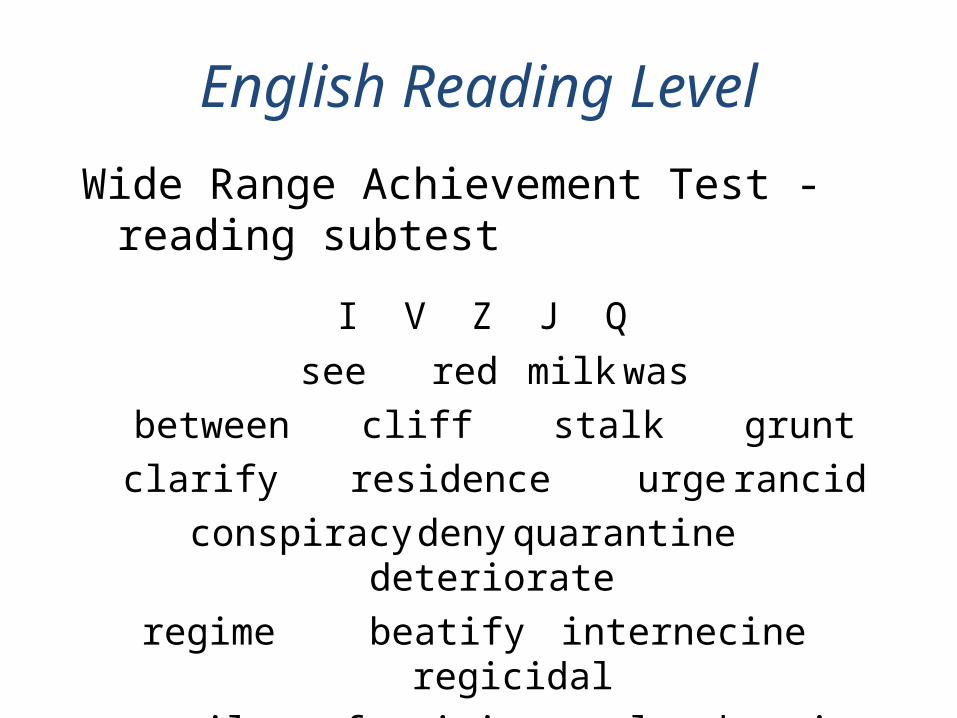
English Reading Level
Wide Range Achievement Test - reading subtest
I V Z J Q see red milk was
between cliff stalk gruntclarify residence urge rancid
conspiracy deny quarantine deteriorateregime beatify internecine regicidal
puerile factitious lucubrationepithalamion inefficacious synecdoche
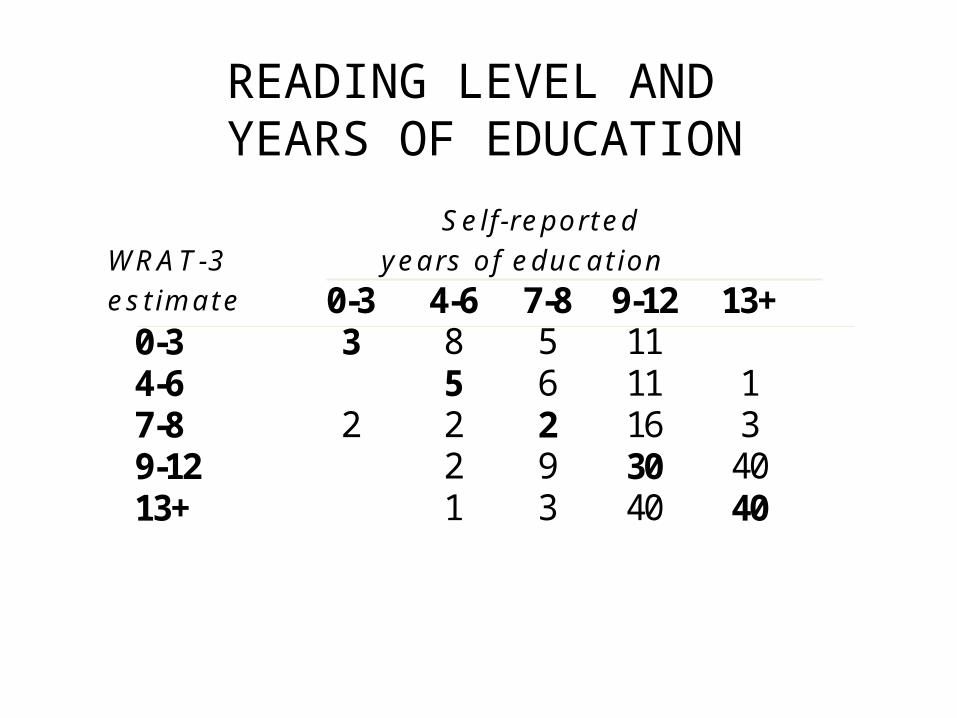
Self-reported WRAT-3 years of education
estimate 0-3 4-6 7-8 9-12 13+ 0-3 3 8 5 11 4-6 5 6 11 1 7-8 2 2 2 16 3 9-12 2 9 30 40 13+ 1 3 40 40
READING LEVEL AND YEARS OF EDUCATION
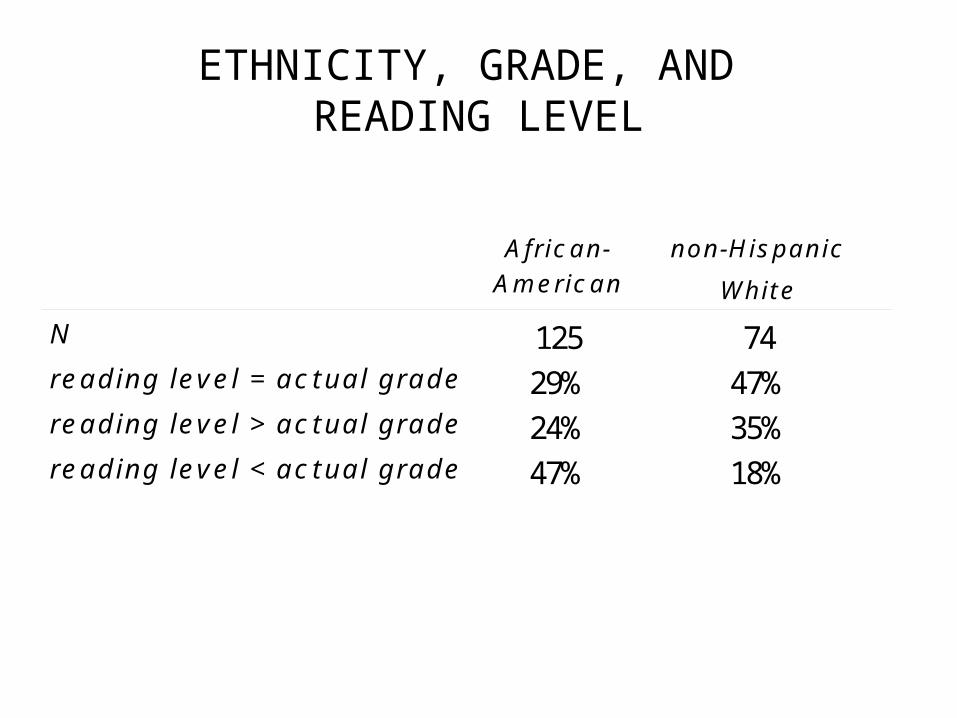
ETHNICITY, GRADE, AND READING LEVEL
African-American
non-Hispanic
White
N 125 74reading level = actual grade 29% 47%reading level > actual grade 24% 35%reading level < actual grade 47% 18%
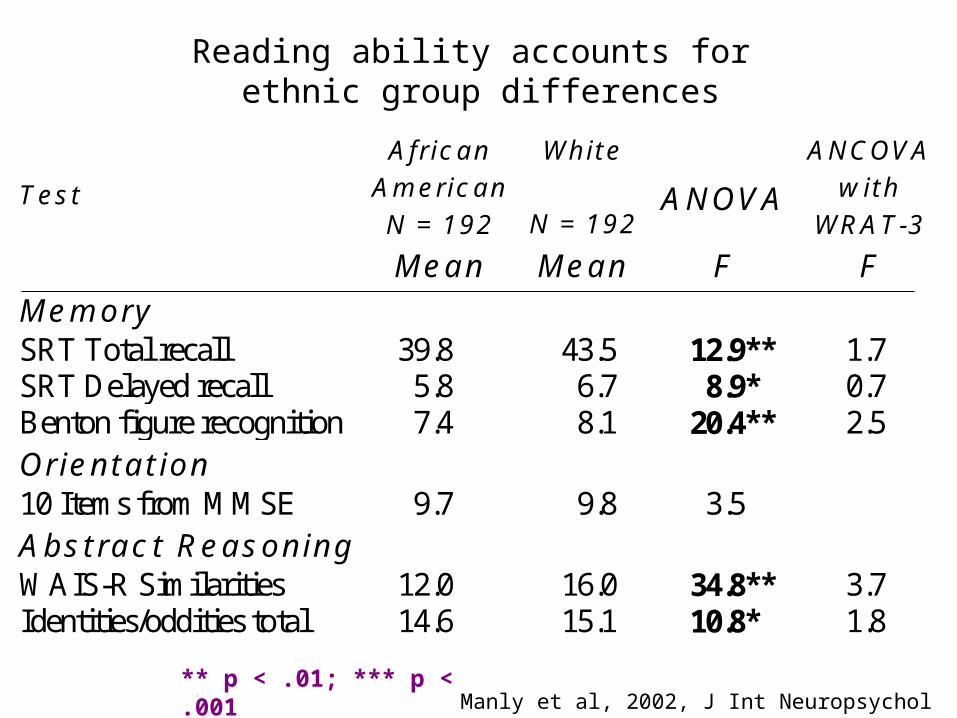
Reading ability accounts for ethnic group differences
Test
African American N = 192
White
N = 192
ANOVA
ANCOVA with
WRAT-3
Mean Mean F F Memory
SRT Total recall 39.8 43.5 12.9** 1.7 SRT Delayed recall 5.8 6.7 8.9* 0.7 Benton figure recognition 7.4 8.1 20.4** 2.5 Orientation
10 Items from MMSE 9.7 9.8 3.5 Abstract Reasoning
WAIS-R Similarities 12.0 16.0 34.8** 3.7 Identities/oddities total 14.6 15.1 10.8* 1.8
** p < .01; *** p < .001Manly et al, 2002, J Int Neuropsychol Soc 8: 341-348
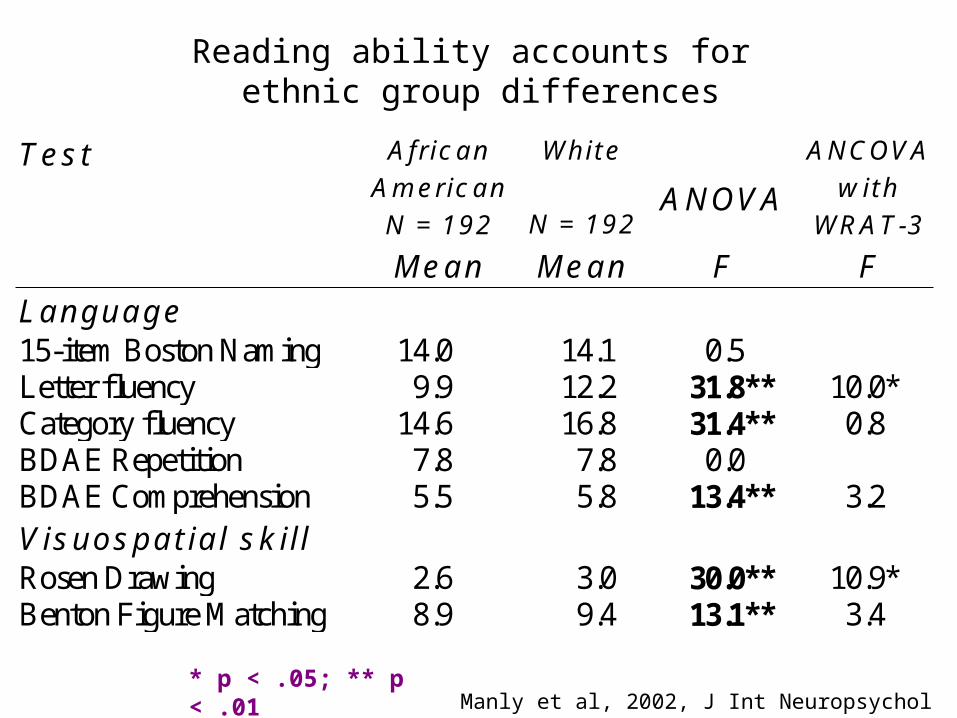
Reading ability accounts for ethnic group differences
Test African American N = 192
White
N = 192
ANOVA
ANCOVA with
WRAT-3
Mean Mean F F Language
15-item Boston Naming 14.0 14.1 0.5 Letter fluency 9.9 12.2 31.8** 10.0* Category fluency 14.6 16.8 31.4** 0.8 BDAE Repetition 7.8 7.8 0.0 BDAE Comprehension 5.5 5.8 13.4** 3.2 Visuospatial skill
Rosen Drawing 2.6 3.0 30.0** 10.9* Benton Figure Matching 8.9 9.4 13.1** 3.4
* p < .05; ** p < .01Manly et al, 2002, J Int Neuropsychol Soc 8: 341-348
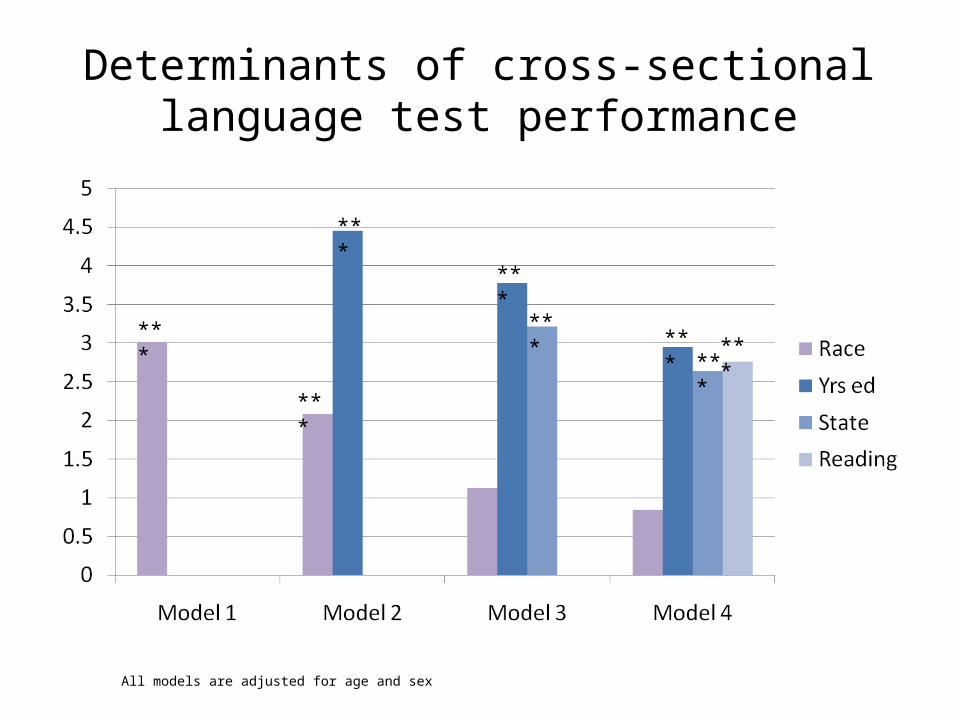
Determinants of cross-sectional language test performance
All models are adjusted for age and sex
***
***
***
***
*** ******
***
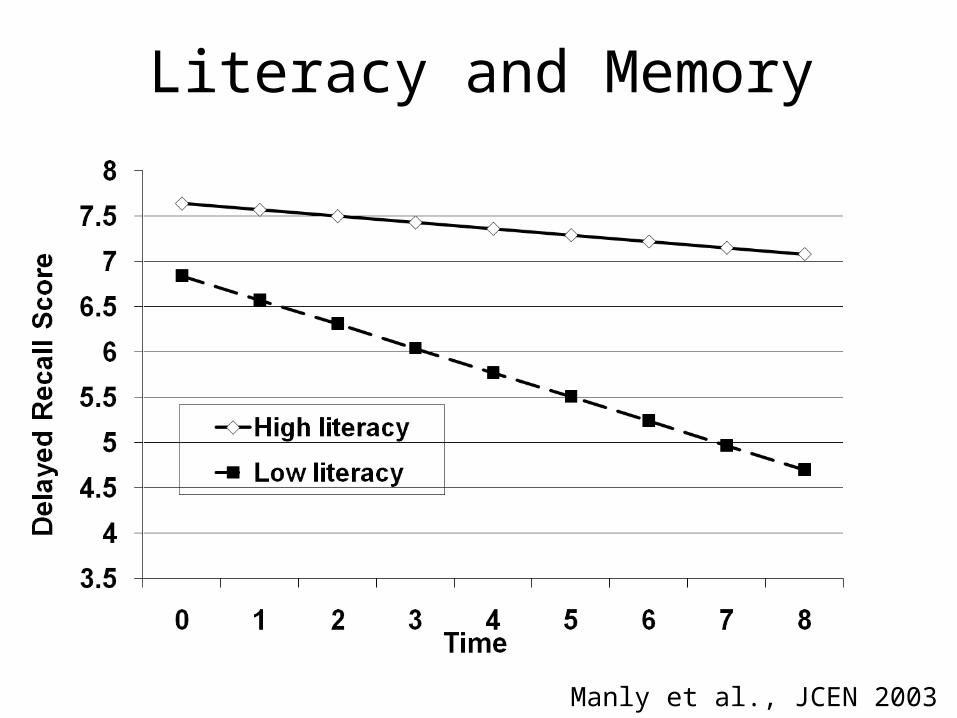
Literacy and Memory
Manly et al., JCEN 2003
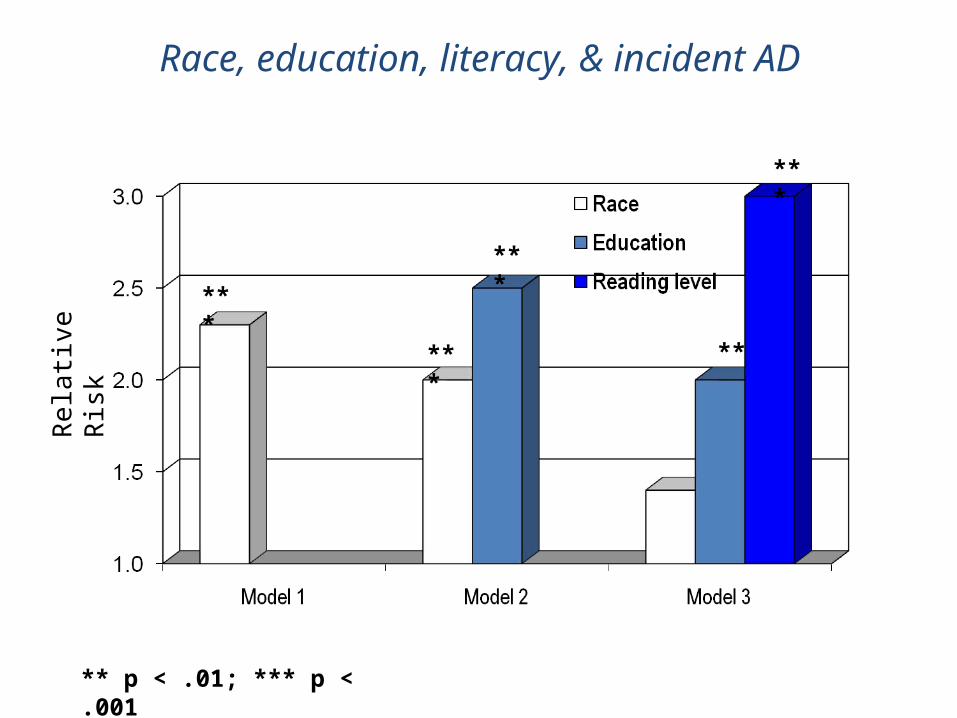
Race, education, literacy, & incident ADRe
lativ
e Ri
sk
** p < .01; *** p < .001
***
***
***
***
**
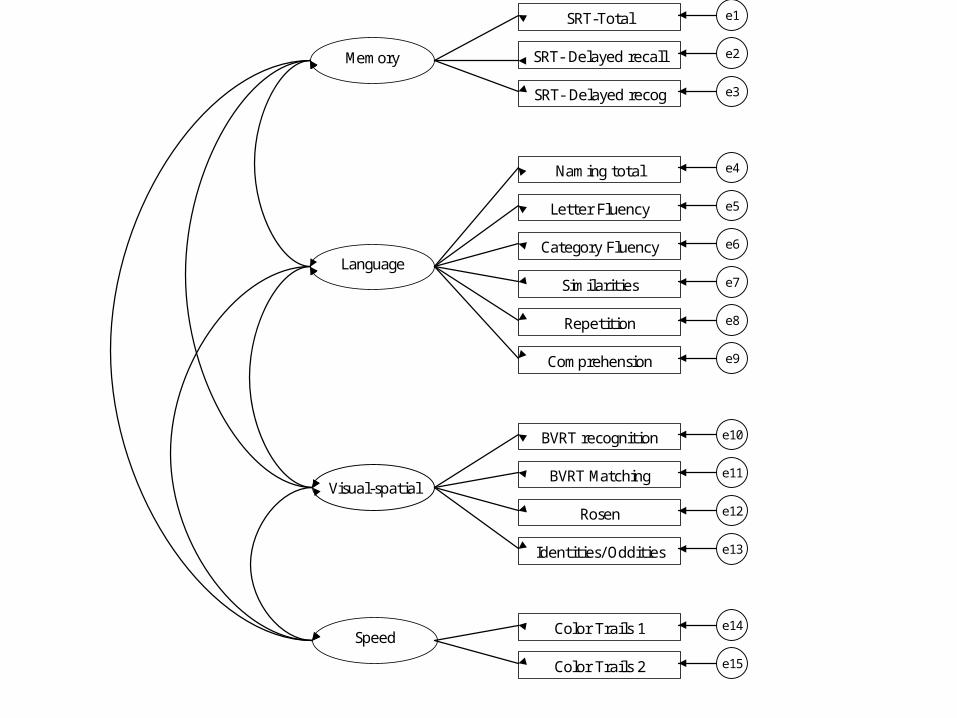
Memory
Language
Speed
SRT-Total
SRT- Delayed recall
SRT- Delayed recog
Naming total
Letter Fluency
Category Fluency
Similarities
Repetition
BVRT recognition
Comprehension
BVRT Matching
Rosen
Identities/ Oddities
Color Trails 1
Color Trails 2
e1
e2
e3
e7
e8
e9
e10
e11
e12
e13
e14
e15
e6
e5
e4
Visual-spatial
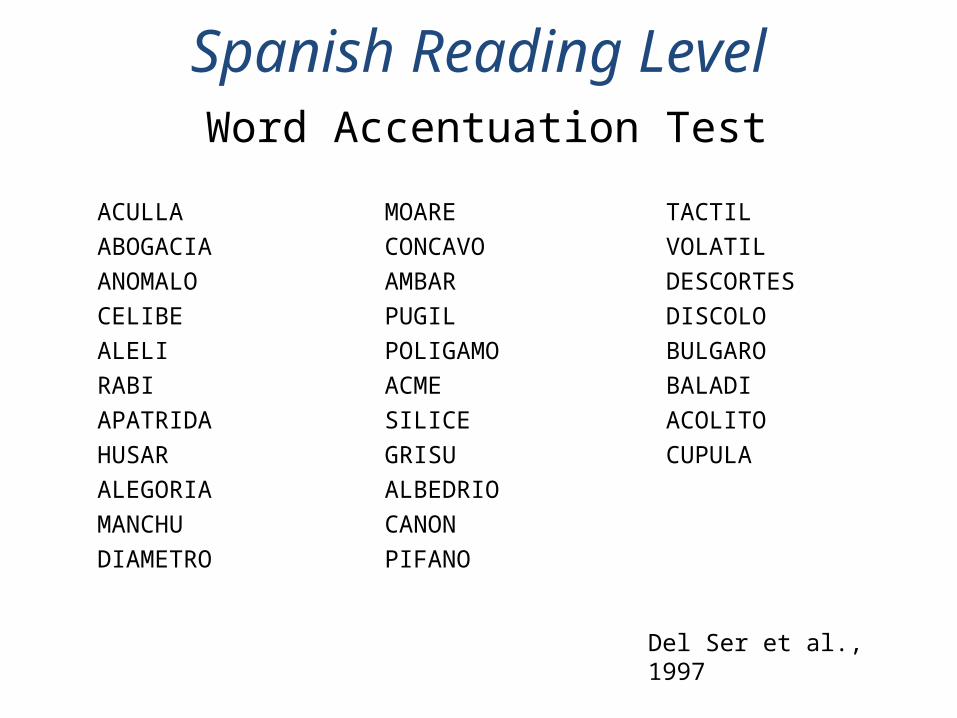
Spanish Reading Level Word Accentuation Test
ACULLAABOGACIAANOMALOCELIBEALELIRABIAPATRIDAHUSARALEGORIAMANCHUDIAMETRO
MOARECONCAVOAMBARPUGILPOLIGAMOACMESILICEGRISUALBEDRIOCANONPIFANO
TACTILVOLATILDESCORTESDISCOLOBULGAROBALADIACOLITOCUPULA
Del Ser et al., 1997
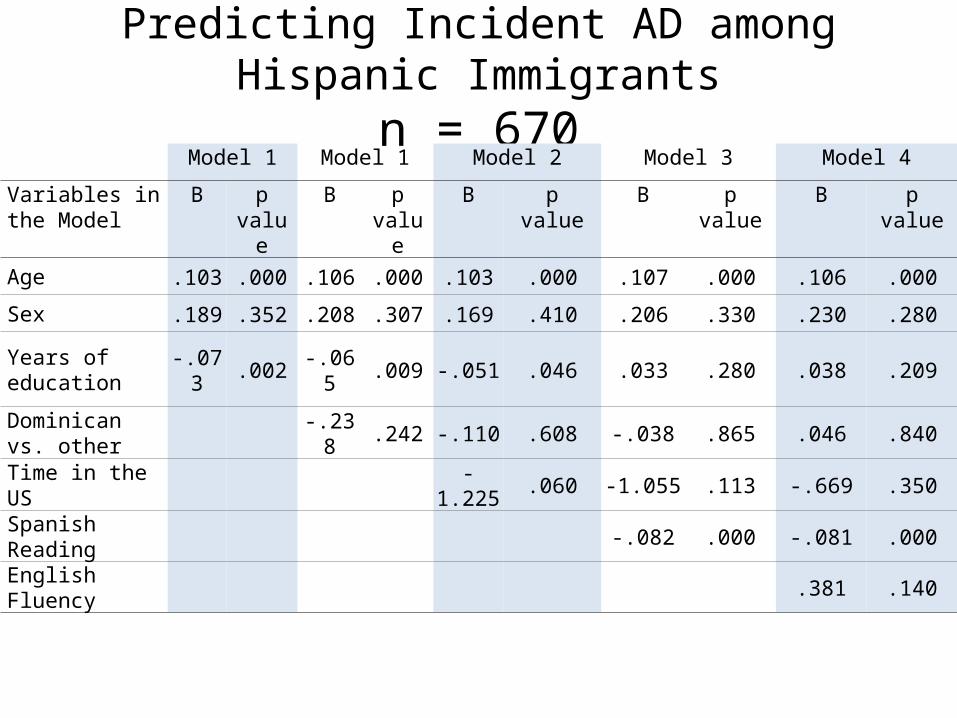
Predicting Incident AD among Hispanic Immigrantsn = 670
Model 1 Model 1 Model 2 Model 3 Model 4
Variables in the Model
B p value
B p value
B p value B p value B p value
Age .103 .000 .106 .000 .103 .000 .107 .000 .106 .000
Sex .189 .352 .208 .307 .169 .410 .206 .330 .230 .280
Years of education -.073 .002 -.065 .009 -.051 .046 .033 .280 .038 .209
Dominican vs. other -.238 .242 -.110 .608 -.038 .865 .046 .840
Time in the US -1.225 .060 -1.055 .113 -.669 .350
Spanish Reading -.082 .000 -.081 .000
English Fluency .381 .140
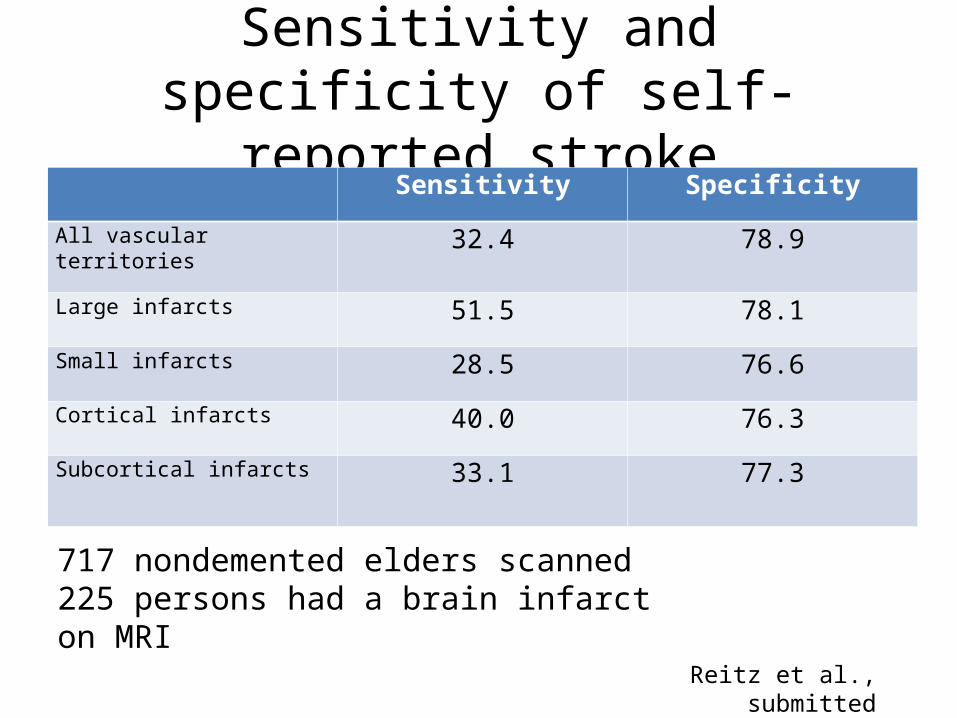
Sensitivity and specificity of self-reported stroke
Sensitivity Specificity
All vascular territories 32.4 78.9
Large infarcts 51.5 78.1
Small infarcts 28.5 76.6
Cortical infarcts 40.0 76.3
Subcortical infarcts 33.1 77.3
Reitz et al., submitted
717 nondemented elders scanned225 persons had a brain infarct on MRI
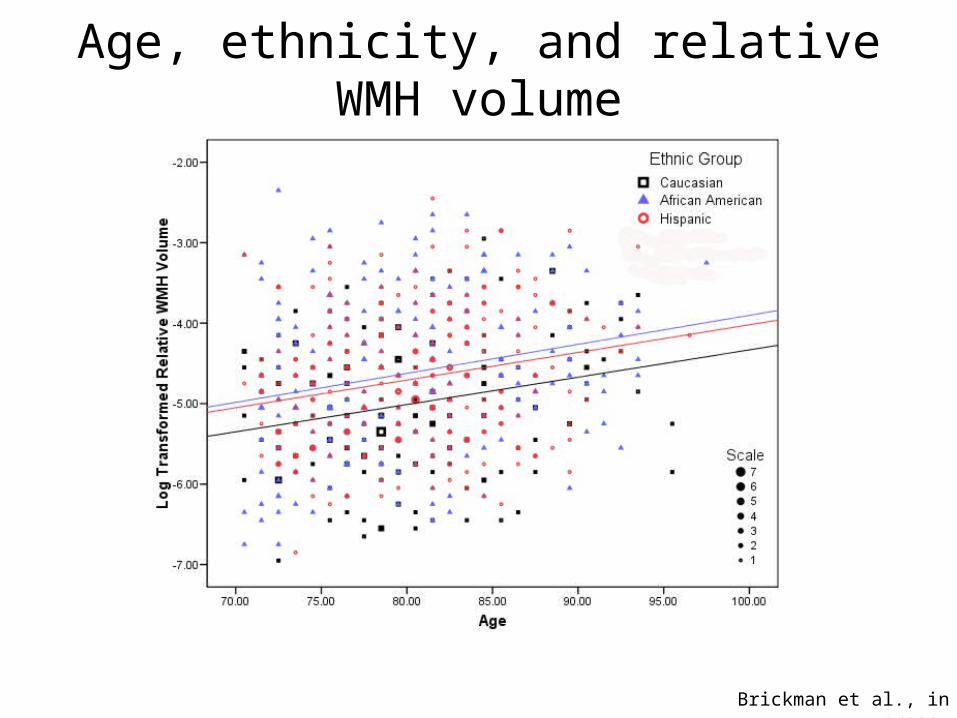
Brickman et al., in press
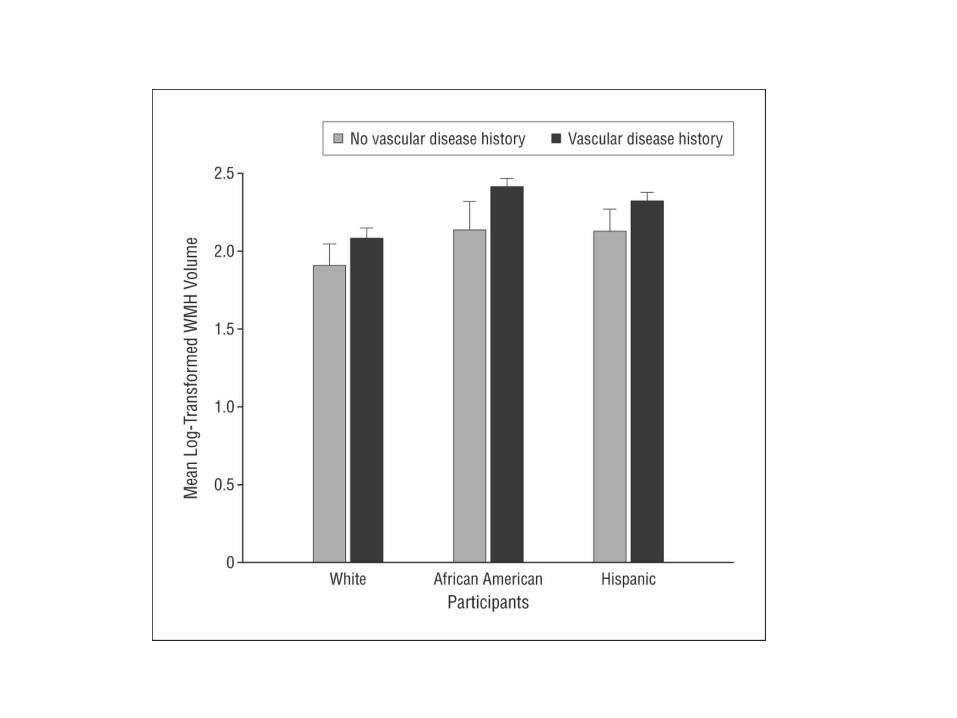
Age, ethnicity, and relative WMH volume