Embed Size (px)
Citation preview

SURVEY BRIEF AUGUST 2019
Who Are the Remaining Uninsured, and Why Do They Lack Coverage?
Findings from the Commonwealth Fund Biennial Health Insurance Survey, 2018
Munira Z. Gunja Senior Researcher The Commonwealth Fund
Sara R. Collins Vice President The Commonwealth Fund
The Affordable Care Act (ACA) brought sweeping change to the U.S. health care system, expanding comprehensive health insurance to millions of Americans and making it possible for anyone with health problems to get coverage by banning insurers from denying coverage or charging more because of preexisting conditions. In 2018 there were 18.2 million fewer uninsured people in the U.S. than when the ACA became law.1 In addition, fewer people are forgoing health care because of cost or reporting high out-of-pocket costs relative to their income.2
Yet, in 2018, an estimated 30.4 million people were uninsured, up from a low of 28.6 million in 2016. Coverage gains have stalled in most states and have even eroded in some.3 In addition, more people have reported problems getting health care because of cost.
To examine why so many people remain uninsured, we use data from the 2018 Commonwealth Fund Biennial Health Insurance Survey. Answers to the survey questions can help federal and state policymakers find solutions to help uninsured Americans gain coverage.
HIGHLIGHTS In 2018, uninsured working-age adults in the United States were disproportionately low
income, Latino, and under age 35.
Nearly half of uninsured adults may have been eligible for subsidized insurance through the marketplace or their state’s expanded Medicaid program.
Two-thirds (67%) of uninsured adults had not gone to the marketplace to examine their coverage options. Of those, one-third (36%) said they didn’t think they could afford health insurance.
Following the ACA individual market subsidies and reforms, the share of adults who had tried to buy a plan in the individual market and reported difficulties finding an affordable plan fell from 60 percent to 34 percent. In 2018, 42 percent of adults reported difficulty finding affordable coverage.
Despite affordability concerns and changes made by Congress and the Trump administration, 62 percent of adults with individual coverage and 84 percent with Medicaid rated their coverage as “good,” “very good,” or “excellent.”

commonwealthfund.org Survey Brief, August 2019
Who Are the Remaining Uninsured, and Why Do They Lack Coverage? 2
Source: Munira Z. Gunja and Sara R. Collins, Who Are the Remaining Uninsured, and Why Do they Lack Coverage?: Findings from the Commonwealth Fund Biennial Health Insurance Survey, 2018 (Commonwealth Fund, Aug. 2019).
Uninsured Working-Age Adults Disproportionately Low-Income, Latino, and Under Age 35
<200% FPL
58%
200%–399% FPL
21%
400%+ FPL
8%
DK/Refused
13%
Income
19–34
44%
35–49
30%
50–64
24%
Refused
2%
Age
White
42%
Black
11%
Latino
35%
Asian or PI
3%Other/Mixed
6%
DK/Refused
2%
Race/Ethnicity
Notes: FPL = federal poverty level. DK = don’t know. PI = Pacific Islander.
Data: Commonwealth Fund Biennial Health Insurance Survey (2018).
Adults ages 19–64 who were uninsured
Notes: FPL = federal poverty level. DK = don’t know. PI = Pacific Islander.
Data: Commonwealth Fund Biennial Health Insurance Survey (2018).
The ACA’s coverage expansions led to significant declines in uninsured rates among people who had been the most likely to be uninsured: people with low incomes, Latinos, and young adults (Table 1). But in 2018, these groups remained disproportionately uninsured.
In 2018, 58 percent of uninsured adults had incomes below 200 percent of the federal poverty level ($24,120 for an individual and $49,200 for a family of four). Across age groups, young adults ages 19 to 34 made up the largest share of the uninsured. More than one-third of the uninsured were Latino even though Latinos make up 18 percent of the working-age adult population (Table 1).
Uninsured Working-Age Adults Disproportionately Low-Income, Latino, and Under Age 35

commonwealthfund.org Survey Brief, August 2019
Who Are the Remaining Uninsured, and Why Do They Lack Coverage? 3
Nearly Half of Uninsured Adults May Be Eligible for Marketplace Subsidies or Medicaid
Notes: FPL = federal poverty level. The Affordable Care Act set the top income eligibility threshold at 133% of poverty but also called for a new standardized method for calculating income. States previously had different rules about what sources of income counted for purposes of eligibility. The standardized modified adjusted gross income system automatically disregards 5% of someone's income, effectively making the threshold 138% of poverty. We use the 133% threshold in this survey.
Data: Commonwealth Fund Biennial Health Insurance Survey (2018).
We examined the remaining uninsured by income status to determine whether they might be eligible for subsidized coverage. The ACA provides subsidized insurance through two sources: Medicaid for adults who earn less than 138 percent of poverty ($16,643 for an individual or $33,948 for a family of four) in states that expanded Medicaid, and subsidized plans in the ACA marketplaces for those who earn up to 400 percent of poverty ($48,240 for an individual and $98,400 for a family of four).
The ACA excludes undocumented immigrants from both the marketplace subsidies and the Medicaid expansion: they may only buy coverage through the individual market outside the marketplaces. We use foreign-born status among Latinos as a rough proxy for uninsured adults who may not be eligible for subsidized coverage because of their immigration status.4 We do not have an estimate of undocumented immigrants of other ethnicities.
Nearly half (47%) of uninsured adults in 2018 had incomes that may make them eligible for either expanded Medicaid or subsidized marketplace plans. The remainder of uninsured adults would not qualify for either: 11 percent earn below 100 percent of poverty and live in a state that did not expand Medicaid;5 8 percent have incomes at or above 400 percent of poverty and are ineligible for the tax credits; and 25 percent were foreign-born Latinos and may be ineligible for Medicaid or subsidized plans because of their immigration status.
Source: Munira Z. Gunja and Sara R. Collins, Who Are the Remaining Uninsured, and Why Do they Lack Coverage?: Findings from the Commonwealth Fund Biennial Health Insurance Survey, 2018 (Commonwealth Fund, Aug. 2019).
Nearly Half of Uninsured Adults May Be Eligible for Marketplace Subsidies or Medicaid
25% 11% 4% 3% 4% 36% 8% 9%
Eligible for unsubsidized coverage through the
individual market or may be eligible for traditional
Medicaid
Eligible for expanded Medicaid or subsidized coverage through
the marketplaceAbove subsidy eligible rangeForeign-born Latinos
Adults ages 19–64 who were uninsured
Notes: FPL = federal poverty level. The Affordable Care Act set the top income eligibility threshold at 133% of poverty but also called for a new standardized method for calculating income. States previously had different rules about what sources of income counted for purposes of eligibility. The standardized modified adjusted gross income system automatically disregards 5% of someone's income, effectively making the threshold 138% of poverty. We use the 133% threshold in this survey.
Data: Commonwealth Fund Biennial Health Insurance Survey (2018).
Foreign-born Latinos <100% FPL, nonexpansion
<100% FPL, expansion
100%–132% FPL, nonexpansion
100%–132% FPL, expansion
133%–399% FPL 400%+ FPL
Undesignated

commonwealthfund.org Survey Brief, August 2019
Who Are the Remaining Uninsured, and Why Do They Lack Coverage? 4
One-Third of Uninsured Adults Who Did Not Visit Marketplace to Get Coverage Cited Affordability Concerns
While half of adults who were uninsured at the time of the survey might have been eligible for subsidized health care, the majority (67%) of uninsured adults did not try to get health insurance through the marketplace. When asked why, more than one-third (36%) reported it was because they did not think they could afford it, 15 percent said they did not think they needed it, 8 percent said they did not think they would be eligible for insurance, and 7 percent said they were not aware of the marketplace.6
* 3% of uninsured adults ages 19 to 64 who did not visit the marketplace reported it was because they had, or will have, insurance through another source, 2% reported it was because the marketplaces were not open for enrollment when they needed coverage, and 1% reported they went someplace else to look for health insurance. Respondents who reported “some other reason” cited lack of time and citizenship status, among other reasons.
Data: Commonwealth Fund Biennial Health Insurance Survey (2018).
Source: Munira Z. Gunja and Sara R. Collins, Who Are the Remaining Uninsured, and Why Do they Lack Coverage?: Findings from the Commonwealth Fund Biennial Health Insurance Survey, 2018 (Commonwealth Fund, Aug. 2019).
36
15
8 7
28
You did not thinkyou could affordhealth insurance
You did not thinkyou needed health
insurance
You did not thinkyou would be
eligible for healthinsurance
You were notaware of themarketplace
Some otherreason*
One-Third of Uninsured Adults Who Did Not Visit Marketplace to Get Coverage Cited Affordability Concerns
* 3% of uninsured adults ages 19 to 64 who did not visit the marketplace reported it was because they had, or will have, insurance through another source, 2% reported it was because the marketplaces were not open for enrollment when they needed coverage, and 1% reported they went someplace else to look for health insurance. Respondents who reported “some other reason” cited lack of time and citizenship status, among other reasons.
Data: Commonwealth Fund Biennial Health Insurance Survey (2018).
Percent of adults ages 19–64 who were uninsured and did not visit the marketplace
What was the main reason you did not try to get health insurance through the marketplace?
Did you try to get health insurance through the marketplace?
Percent of adults ages 19–64 who were uninsured
Yes32%
No67%
Did you try to get health insurance through the marketplace?

commonwealthfund.org Survey Brief, August 2019
Who Are the Remaining Uninsured, and Why Do They Lack Coverage? 5
One-Third of Adults Who Lost Coverage and Were Previously Covered Through the Individual Market Cited Affordability Concerns
Affordability is the top reason adults dropped their individual market coverage. One-third (34%) of adults who were either uninsured at the time of the survey or had a gap in coverage in the past 12 months, and who were previously covered by either a plan they bought through the marketplace or directly from an insurance company, reported they lost or dropped their plan because they could not afford it.7 Half of these adults were uninsured, about a quarter had reenrolled into the individual market, 12 percent transitioned into Medicaid, 7 percent enrolled in employer insurance, and 5 percent enrolled into Medicare (data not shown).
* 4% percent of adults ages 19 to 64 who were uninsured at the time of the survey or uninsured in the past 12 months and were previously covered by a plan bought on their own or through the marketplace reported they lost or dropped their marketplace coverage because they couldn’t get the health care they needed, 2% reported it was because they didn’t think they needed it, and 1% reported it was because they moved. Respondents who reported “some other reason” cited lack of knowledge about their coverage options, among other reasons.
Data: Commonwealth Fund Biennial Health Insurance Survey (2018).
Source: Munira Z. Gunja and Sara R. Collins, Who Are the Remaining Uninsured, and Why Do they Lack Coverage?: Findings from the Commonwealth Fund Biennial Health Insurance Survey, 2018 (Commonwealth Fund, Aug. 2019).
34
15
8 7 7
20
You couldn’t afford what you had to pay for your health plan
Lost/changed job You didn’t pay your premium on time
You missed thedeadline to reenroll
Your plan was nolonger being offered
Some other reason*
One-Third of Adults Who Lost Coverage and Were Previously Covered Through the Individual Market Cited Affordability Concerns
* 4% percent of adults ages 19 to 64 who were uninsured at the time of the survey or uninsured in the past 12 months and were previously covered by a plan bought on their own or through the marketplace reported they lost or dropped their marketplace coverage because they couldn’t get the health care they needed, 2% reported it was because they didn’t think they needed it, and 1% reported it was because they moved. Respondents who reported “some other reason” cited lack of knowledge about their coverage options, among other reasons.
Data: Commonwealth Fund Biennial Health Insurance Survey (2018).
Percent of adults ages 19–64 who were uninsured at the time of the survey or uninsured in the past 12 months and were previously covered by a plan bought through the marketplace or from an insurance company
What was the main reason you lost or dropped your coverage?What was the main reason you lost or dropped your coverage?

commonwealthfund.org Survey Brief, August 2019
Who Are the Remaining Uninsured, and Why Do They Lack Coverage? 6
Majority of Adults Who Lost Coverage and Were Previously Covered by Medicaid Said They Were No Longer Eligible
More than half (57%) of adults who were either uninsured at the time of the survey or had a gap in insurance coverage in the past 12 months and who were previously covered by Medicaid reported they lost their Medicaid coverage because they were no longer eligible. Fourteen percent said they did not reenroll in time and 10 percent had moved.8 After losing Medicaid, about half of these adults remained uninsured, nearly one-third reenrolled in Medicaid, 14 percent enrolled in employer coverage, 3 percent gained individual market coverage, and 3 percent gained Medicare (data not shown).
* 4% percent of adults ages 19 to 64 who were uninsured at the time of the survey or uninsured in the past 12 months and were previously covered by Medicaid reported losing or dropping their Medicaid coverage because they couldn’t afford to pay for it and 3% reported it was because they couldn’t get the health care they needed. Respondents who reported “some other reason” cited a lack of knowledge about their coverage options and the complexity of the enrollment process, among other reasons.
Data: Commonwealth Fund Biennial Health Insurance Survey (2018).
Source: Munira Z. Gunja and Sara R. Collins, Who Are the Remaining Uninsured, and Why Do they Lack Coverage?: Findings from the Commonwealth Fund Biennial Health Insurance Survey, 2018 (Commonwealth Fund, Aug. 2019).
57
1410
14
You were no longer eligible You did not reenroll in Medicaidwhen you needed to
You moved Some other reason*
Majority of Adults Who Had Lost Coverage and Were Previously Covered by Medicaid Said They Were No Longer Eligible
* 4% percent of adults ages 19 to 64 who were uninsured at the time of the survey or uninsured in the past 12 months and were previously covered by Medicaid reported losing or dropping their Medicaid coverage because they couldn’t afford to pay for it and 3% reported it was because they couldn’t get the health care they needed. Respondents who reported “some other reason” cited a lack of knowledge about their coverage options and the complexity of the enrollment process, among other reasons.
Data: Commonwealth Fund Biennial Health Insurance Survey (2018).
Percent of adults ages 19–64 who were uninsured at the time of the survey or uninsured in the past 12 months and were previously covered by Medicaid
What was the main reason you lost or dropped your Medicaid coverage?What was the main reason you lost or dropped your Medicaid coverage?
commonwealthfund.org Survey Brief, August 2019
Who Are the Remaining Uninsured, and Why Do They Lack Coverage? 7
More Adults Had Difficulty Finding Affordable Coverage in the Individual Market in 2018 vs. 2016
The ACA’s subsidies and reforms to the individual market, such as banning preexisting condition exclusions and premium setting based on health and gender, went into effect in 2014. Before these reforms, in 2010, 60 percent of adults who had individual coverage or had tried to buy it in the past three years said it was very difficult or impossible to find affordable coverage. By 2016, the share of adults reporting difficulty finding affordable coverage in the individual market fell by nearly half, to 34 percent. But in 2018, this progress eroded somewhat: 42 percent of adults reported difficulty finding affordable coverage.
Note: FPL = federal poverty level. * Bought in the past three years. ** Respondent rated their health status as fair or poor, or has any of the following chronic conditions: hypertension or high blood pressure; heart disease, including heart attack; diabetes; asthma, emphysema, or lung disease; high cholesterol. ^ Among those who ever tried buying health insurance on their own in the past three years.
Data: Commonwealth Fund Biennial Health Insurance Surveys (2010, 2016, 2018).
Source: Munira Z. Gunja and Sara R. Collins, Who Are the Remaining Uninsured, and Why Do they Lack Coverage?: Findings from the Commonwealth Fund Biennial Health Insurance Survey, 2018 (Commonwealth Fund, Aug. 2019).
More Adults Had Difficulty Finding Affordable Coverage in the Individual Market in 2018 vs. 2016
Note: FPL = federal poverty level. * Bought in the past three years. ** Respondent rated their health status as fair or poor, or has any of the following chronic conditions: hypertension or high blood pressure; heart disease, including heart attack; diabetes; asthma, emphysema, or lung disease; high cholesterol. ^ Among those who ever tried buying health insurance on their own in the past three years.
Data: Commonwealth Fund Biennial Health Insurance Surveys (2010, 2016, 2018).
Total Health problem** <200% FPL 200%+ FPL
2010 2016 2018 2010 2016 2018 2010 2016 2018 2010 2016 2018
Adults ages 19–64 with individual coverage* or who tried to buy it in past three years who:
26 million
44 million
45 million
Found it very difficult or impossible to find affordable coverage
60% 34% 42% 70% 42% 47% 64% 35% 44% 54% 32% 41%
Found it very difficult or impossible to find coverage they needed
43% 25% 31% 53% 31% 36% 49% 26% 32% 35% 23% 31%
Has individual coverage* or ended up buying a health insurance plan^
46%12
million
66%29
million
61%27
million36% 60% 59% 34% 63% 57% 57% 71% 64%
commonwealthfund.org Survey Brief, August 2019
Who Are the Remaining Uninsured, and Why Do They Lack Coverage? 8
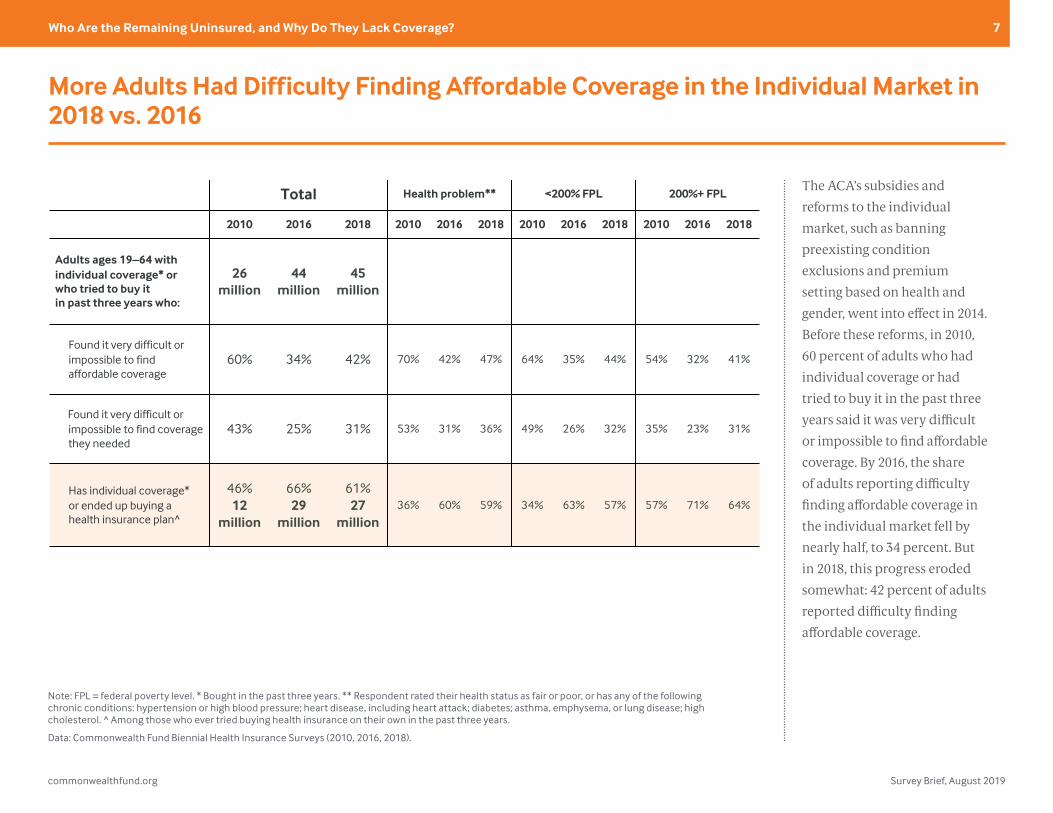
Majority of Adults Give Their Health Insurance High Ratings
Large majorities of insured adults continue to rate their health insurance highly. In 2018, 62 percent of adults with individual market plans and 84 percent with Medicaid rated their health coverage as “good,” “very good,” or “excellent.” Despite affordability concerns and changes made by Congress and the Trump administration, a majority of adults with individual coverage continue to give their health insurance high marks. Significantly more adults with Medicaid gave their coverage high ratings in 2018 compared to 2010.
* Individual coverage includes those who purchased insurance on and off the marketplaces.
Data: Commonwealth Fund Biennial Health Insurance Survey (2010, 2012, 2014, 2016, 2018).
Source: Munira Z. Gunja and Sara R. Collins, Who Are the Remaining Uninsured, and Why Do they Lack Coverage?: Findings from the Commonwealth Fund Biennial Health Insurance Survey, 2018 (Commonwealth Fund, Aug. 2019).
82 8283
81
80
7374
8179
84
65
57
71
63 62
2010 2012 2014 2016 2018
Employer Medicaid Individual*
Majority of Adults Give Their Health Insurance High Ratings
* Individual coverage includes those who purchased insurance on and off the marketplaces.
Data: Commonwealth Fund Biennial Health Insurance Survey (2010, 2012, 2014, 2016, 2018).
Percent of adults ages 19–64 who were insured and viewed their health insurance as “good,” “very good,” or “excellent”
Now thinking about your current health insurance coverage, how would you rate it?
Now thinking about your current health insurance coverage, how would you rate it?

commonwealthfund.org Survey Brief, August 2019
Who Are the Remaining Uninsured, and Why Do They Lack Coverage? 9
POLICY RECOMMENDATIONSAffordability remains a key reason 30 million adults remain uninsured. Our findings show more than a third of uninsured adults who did not try to get coverage through the marketplaces cited affordability concerns. One-third of adults with a coverage gap who were previously insured through the individual market dropped their plans because they could not afford them. The survey also suggests a lack of knowledge among uninsured adults about their coverage options. While the national debate about health care is focused on more sweeping reforms, such as Medicare for All, federal and state policymakers have several options to help millions of people keep or gain coverage within the existing law.
• Expand Medicaid without restrictions. Seventeen states have yet to expand eligibility for Medicaid, leaving more than 3 million people with incomes under poverty uninsured.9 In addition, encouraged by the Trump administration, nine states have secured approval from HHS to impose work requirements in their Medicaid programs; another seven have submitted applications to do so. A federal district court judge has halted the implementation of work requirements in Kentucky, Arkansas, and New Hampshire but not before more than 18,000 poor adults in Arkansas lost their insurance coverage as a result.10
• Lift the 400-percent-of-poverty cap on eligibility for marketplace tax credits. In 2019, this action would help people with incomes exceeding $48,560 (individuals) and $100,400 (family of four) better afford marketplace plans. The tax credits work by capping the amount people pay toward their premiums at 9.86 percent of income. Lifting the cap has a built-in phase-out: as income rises, fewer people qualify, since premiums consume an increasingly smaller share of incomes. RAND researchers estimate that this policy change would increase insurance coverage by nearly 2 million and lower silver-plan premiums by nearly 3 percent as healthier people enroll. It would cost the federal government an estimated $10 billion annually.11 Legislation has been introduced to lift the cap.12
• State or federal reinsurance. The ACA’s reinsurance program was effective in lowering marketplace premiums. After it expired in 2017, seven states implemented their own programs, four more
will implement a program in 2020, and one has submitted an application to do so.13 Alaska’s program reduced premiums by more than 20 percent in 2018.14 These lower costs particularly help people with incomes too high to qualify for ACA premium tax credits. Several congressional bills have proposed a federal reinsurance program.15
• Reinstate outreach and navigator funding for the 2020 open-enrollment period. The administration has nearly eliminated funding for advertising and assistance to help people enroll in marketplace plans.16 Survey research indicates that people who received personal assistance when they shopped for coverage were more likely to enroll than those who did not.17 Some lawmakers have proposed reinstating this funding.18
• Ban or place limits on short-term health plans and other insurance that doesn’t comply with the ACA. The Trump administration loosened regulations on short-term plans that don’t have to comply with the ACA, potentially leaving people who enroll in them exposed to high costs and insurance fraud. These plans also draw healthier people out of the marketplaces, increasing premiums for those who remain and federal costs of premium subsidies. Twenty-three states and D.C. have banned or placed limits on short-term insurance policies.19 Some lawmakers have proposed a federal ban.20
• Make premium contributions for individual market plans fully tax deductible. People who are self-employed are already allowed to do this.21

commonwealthfund.org Survey Brief, August 2019
Who Are the Remaining Uninsured, and Why Do They Lack Coverage? 10
• Fix the so-called family coverage glitch. People with employer premium expenses that exceed 9.86 percent of their income are eligible for marketplace subsidies if their income falls between 100 and 400 percent of poverty. This then triggers a federal tax penalty for their employers. There’s a catch: this provision applies only to single-person policies, leaving many middle-income families caught in the “family coverage glitch.” Congress could help families by pegging unaffordable employer plans to family policies instead of single policies. In 2016, Matthew Buettgens and colleagues estimated more than 6 million people were affected by the glitch and fixing it would lower their spending on premiums from an average 12 percent of income to 6.3 percent, at a cost to the federal government of $3.7 billion to $6.5 billion.22
• Inform people about their options. People who lose coverage during the year are eligible for special enrollment periods for ACA marketplace coverage. Those eligible for Medicaid can sign up at any time. But research indicates that many people who lose employer coverage do not use these options.23 The federal government, the states, and employers could increase awareness through advertising and education.
• Reduce churn in Medicaid. Research shows that over a two-year period, one-quarter of Medicaid beneficiaries leave the program and become uninsured.24 Many do so because of administrative barriers, particularly the renewal process.25 By imposing work requirements, as some states are doing, this involuntary disenrollment will likely get worse. To help people stay continuously covered, the federal government and the states could consider simplifying and streamlining the enrollment and reenrollment processes.
• Extend the marketplace open-enrollment period. The current open-enrollment period lasts just 45 days. In 2019, eight states that run their own marketplaces have longer periods, some by as much as an additional 45 days.26 Other states, as well as the federal marketplace, could extend their enrollment periods as well.
HOW WE CONDUCTED THIS STUDY
The Commonwealth Fund Biennial Health Insurance Survey, 2018, was conducted by SSRS from June 27 to November 11, 2018. The survey consisted of telephone interviews in English and Spanish and was conducted among a random, nationally representative sample of 4,225 adults ages 19 to 64 living in the continental United States. A combination of landline and cellular phone random-digit-dial (RDD) samples was used to reach people. In all, 725 interviews were conducted with respondents on landline telephones and 3,500 interviews were conducted on cellular phones.
The sample was designed to generalize to the U.S. adult population and to allow separate analyses of responses of low-income households. Statistical results are weighted to correct for the stratified sample design, the overlapping landline and cellular phone sample frames, and disproportionate nonresponse that might bias results. The data are weighted to the U.S. adult population by age, sex, race/ethnicity, education, household size, geographic region, population density, and household telephone use, using the U.S. Census Bureau’s 2017 Annual Social and Economic Supplement.
The resulting weighted sample is representative of the approximately 193.9 million U.S. adults ages 19 to 64. The survey has an overall margin of sampling error of +/– 1.9 percentage
points at the 95 percent confidence level. The RDD landline portion of the survey achieved a 8.4 percent response rate and the RDD cellular phone component achieved a 5.2 percent response rate.
This survey is the eighth in a series of Commonwealth Fund surveys to measure access to affordable health care over time. The previous surveys were conducted by Princeton Survey Research Associates International using the same stratified sampling strategy that was used in 2018, except the 2001, 2003, and 2005 surveys did not include a cellular phone random-digit-dial sample. In 2001, the survey was conducted from April 27 through July 29, 2001, and included 2,829 adults ages 19 to 64; in 2003, the survey was conducted from September 3, 2003, through January 4, 2004, and included 3,293 adults ages 19 to 64; in 2005, the survey was conducted from August 18, 2005, to January 5, 2006, among 3,352 adults ages 19 to 64; in 2010, the survey was conducted from July 14 to November 30, 2010, among 3,033 adults ages 19 to 64; in 2012, the survey was conducted from April 26 to August 19, 2012, among 3,393 adults ages 19 to 64; in 2014, the survey was conducted from July 22 to December 14, 2014, among 4,251 adults ages 19 to 64; and in 2016, the survey was conducted from July 12 to November 20, 2016, among 4,186 adults ages 19 to 64.

commonwealthfund.org Survey Brief, August 2019
Who Are the Remaining Uninsured, and Why Do They Lack Coverage? 11
Table 1. Uninsured Rates by Demographics
Total (ages 19–64) Uninsured (rate) Uninsured (distribution)
2010 2018 2010 2018 2010 2018
Percent distribution 100% 100% 20% 12% 20% 12%
Unweighted n 3065 4225 593 555 593 555Millions 185.0 193.9 37.2 24.0 37.2 24.0Age 19–34 34 32 27 17 46 44
35–49 33 30 20 12 34 30
50–64 32 35 13 8 20 24
Gender Male 49 48 20 14 49 54
Female 51 52 20 11 51 46
Base: Young adults (ages 19–34)
Male 51 51 29 19 54 58
Female 49 49 25 15 46 42
Race/Ethnicity White 64 59 15 9 47 42
African American 12 12 24 11 15 11
Latino 16 18 39 24 31 35
Asian 3 4 9 10 1 3
Other/Mixed 4 5 29 14 5 6
Poverty status Less than 100% poverty 20 18 41 19 41 27
100%–132% poverty 7 7 31 18 11 10
133%–249% poverty 18 19 26 17 23 26
250%–399% poverty 19 19 8 10 8 16
400% poverty or more 25 29 4 3 4 8
Don't know/Refused 11 7 23 22 12 13
Health status No health problem 50 50 19 13 46 53
Fair/Poor health status, or any chronic condition* 50 50 22 12 54 47
Political affiliation Republican 23 22 14 9 16 16
Democrat 32 28 19 8 31 18
Independent 23 23 16 11 19 21
Something else 12 18 27 15 16 22
Marketplace type** State-based marketplace — 29 — 10 — 22
Federally run marketplace — 71 — 13 — 76
Medicaid expansion*** Expanded Medicaid — 64 — 9 — 48
Did not expand Medicaid — 35 — 18 — 51
Region Northeast 19 19 13 8 13 12
Midwest 22 21 16 11 17 18
South 37 37 24 16 44 47
West 22 23 23 12 25 23
Adult work status Full time 52 53 12 10 30 42
Part time 12 14 32 17 19 19
Not working 36 33 28 14 50 38Employer size^^ Less than 100 employees 40 41 26 19 67 68
100 or more employees 57 56 8 6 29 28
NOTES
* Respondent said health status was fair or poor or said they had at least one of the following chronic diseases: hypertension or high blood pressure; heart disease; diabetes; asthma, emphysema, or lung disease; high cholesterol; depression or anxiety.
** The following states have state-based marketplaces: CA, CO, CT, ID, MA, MD, MN, NY, RI, VT, WA, and the District of Columbia. All other states were considered to have federally facilitated marketplaces.
*** The following states expanded their Medicaid program and began enrolling individuals in July 2018 or earlier: AK, AR, AZ, CA, CO, CT, DE, HI, IA, IL, IN, KY, LA, MA, MD, ME, MI, MN, MT, ND, NH, NJ, NM, NV, NY, OH, OR, PA, RI, VA, VT, WA, WV, and the District of Columbia. All other states were considered to have not expanded.
^^ Base: Full- and part-time employed adults ages 19–64. Distributions may not sum to 100 percent because of "don't know" or refusal to respond.
— Not applicable.
DATA
Commonwealth Fund Biennial Health Insurance Surveys (2010 and 2018).

commonwealthfund.org Survey Brief, August 2019
Who Are the Remaining Uninsured, and Why Do They Lack Coverage? 12
NOTES1. Robin A. Cohen, Emily P. Terlizzi, and Michael E. Martinez, Health Insurance Coverage: Early Release of Estimates from the National Health Interview Survey, 2018 (National Center for Health Statistics, Centers for Disease Control and Prevention, May 2019).
2. David C. Radley, Sara R. Collins, and Susan L. Hayes, 2019 Scorecard on State Health System Performance: Deaths from Suicide, Alcohol, Drugs on the Rise; Progress Expanding Health Care Coverage Stalls; Health Costs Are a Growing Burden (Commonwealth Fund, June 2019).
3. Radley, Collins, and Hayes, 2019 Scorecard, 2019.
4. Research has found that nearly half of foreign-born Latinos are undocumented immigrants. See Jens M. Krogstad and Mark H. Lopez, Hispanic Immigrants More Likely to Lack Health Insurance than U.S.-Born (Pew Research Center, Sept. 2014).
5. These adults would only be eligible for their state’s existing Medicaid program, which is usually only available to children and very poor parents, or unsubsidized plans in the marketplaces.
6. Three percent of uninsured adults ages 19 to 64 who did not visit the marketplace reported it was because they had, or will have, insurance through another source, 2% reported it was because the marketplaces were not open for enrollment when they needed coverage, and 1% reported they went someplace else to look for health insurance. Respondents who reported “some other reason” cited lack of time and citizenship status, among other reasons.
7. Four percent of adults ages 19 to 64 who were uninsured at the time of the survey or uninsured in the past 12 months and were previously covered by a plan bought on their own or through the marketplace reported they lost or dropped their marketplace coverage because they couldn’t get the health care they needed, 2% reported it was because they didn’t think they needed it, and 1% reported it was because they moved. Respondents who reported “some other reason” cited lack of knowledge about their coverage options, among other reasons.
8. Four percent of adults ages 19 to 64 who were uninsured at the time of the survey or uninsured in the past 12 months and were previously covered by Medicaid reported losing or dropping their Medicaid coverage because they couldn’t afford to pay for it and 3% reported it was because they couldn’t get the health care they needed. Respondents who reported “some other reason” cited a lack of knowledge about their coverage options and the complexity of the enrollment process, among other reasons.
9. Estimate includes three states (Idaho, Nebraska, Utah) that passed ballot initiatives in 2018 to expand Medicaid but have not yet done so. See Commonwealth Fund, “Status of Medicaid Expansion and Work Requirement Waivers,” interactive map, updated July 31, 2019; Rachel Garfield, Kendal Orgera, and Anthony Damico, The Coverage Gap: Uninsured Poor Adults in States that Do Not Expand Medicaid (Henry J. Kaiser Family Foundation, June 2018 and May 2019); and Matthew Buettgens, The Implications of Medicaid Expansion in the Remaining States (Urban Institute, May 2018).
10. Benjamin D. Sommers et al., “Medicaid Work Requirements – Results from the First Year in Arkansas,” New England Journal of Medicine, published online June 19, 2019.
11. Jodi Liu and Christine Eibner, Expanding Enrollment Without the Individual Mandate: Options to Bring More People into the Individual Market (Commonwealth Fund, Aug. 2018).
12. U.S. Senator for California, Dianne Feinstein, “Senators Introduce Legislation to Improve Affordable Care Act, Make Coverage More Affordable for Middle-Class Families,” Press release, June 7, 2017.
13. Commonwealth Fund, “What Is Your State Doing to Affect Access to Adequate Health Insurance?,” interactive map, updated Aug. 22, 2019.
14. Rachel Schwab, Emily Curran, and Sabrina Corlette, Assessing the Effectiveness of State-Based Reinsurance: Case Studies of Three States’ Efforts to Bolster Their Individual Markets (Robert Wood Johnson Foundation, Nov. 2018).

commonwealthfund.org Survey Brief, August 2019
Who Are the Remaining Uninsured, and Why Do They Lack Coverage? 13
15. Sara R. Collins and Roosa Tikkanen, “The Many Varieties of Universal Coverage,” interactive, Mar. 6, 2019.
16. Sara R. Collins, “Consumers Shopping for Health Plans Are Left in the Dark by Trump Administration,” To the Point (blog), Commonwealth Fund, July 19, 2018.
17. Sara R. Collins, Munira Z. Gunja, and Michelle M. Doty, Following the ACA Repeal-and-Replace Effort, Where Does the U.S. Stand on Insurance Coverage? Findings from the Commonwealth Fund Affordable Care Act Tracking Survey, March–June 2017 (Commonwealth Fund, Sept. 2017).
18. Collins and Tikkanen, “Many Varieties of Universal Coverage,” 2019.
19. Commonwealth Fund, “What Is Your State Doing?,” 2019.
20. Collins and Tikkanen, “Many Varieties of Universal Coverage,” 2019.
21. Timothy S. Jost, “Fixing Our Most Pressing Health Insurance Problems: A Bipartisan Path Forward,” To the Point (blog), Commonwealth Fund, July 13, 2017.
22. Matthew Buettgens, Lisa Dubay, and Genevieve M. Kenney, “Marketplace Subsidies: Changing The ‘Family Glitch’ Reduces Family Health Spending But Increases Government Costs,” Health Affairs 35, no. 7 (July 2016): 1167–75.
23. Matthew Buettgens, Stan Dorn, and Hannah Recht, More Than 10 Million Uninsured Could Obtain Marketplace Coverage Through Special Enrollment Periods (Robert Wood Johnson Foundation and Urban Institute, Nov. 2015).
24. Sara R. Collins, Sherry A. Glied, and Adlan Jackson, The Potential Implications of Work Requirements for the Insurance Coverage of Medicaid Beneficiaries: The Case of Kentucky (Commonwealth Fund, Oct. 2018).
25. Benjamin D. Sommers, “Loss of Health Insurance Among Non-Elderly Adults in Medicaid,” Journal of General Internal Medicine 24, no. 1 (Jan. 2009): 1–7.
26. Commonwealth Fund, “What Is Your State Doing?,” 2019.

commonwealthfund.org Survey Brief, August 2019
Who Are the Remaining Uninsured, and Why Do They Lack Coverage? 14
ABOUT THE AUTHORS
Munira Z. Gunja, M.P.H., is senior researcher in the Health Care Coverage and Access program at the Commonwealth Fund. Ms. Gunja joined the Fund from the U.S. Department of Health and Human Services in the office of the Assistant Secretary for Planning and Evaluation (ASPE), Division of Health Care Access and Coverage, where she received the Secretary’s Award for Distinguished Service. Before joining ASPE, Ms. Gunja worked for the National Cancer Institute where she conducted data analysis for numerous studies featured in scientific journals. She graduated from Tulane University with a B.S. in public health and international development and an M.P.H. in epidemiology.
Sara R. Collins, Ph.D., is vice president for Health Care Coverage and Access at the Commonwealth Fund. An economist, Dr. Collins joined the Fund in 2002 and has led the Fund’s national program on health insurance since 2005. She also directs the Fund’s research initiative on Tracking Health System Performance. Since joining the Fund, she has led several national surveys on health insurance and authored numerous reports, issue briefs, and journal articles on health insurance coverage and policy. She has provided invited testimony before several Congressional committees and subcommittees. Prior to joining the Fund, Dr. Collins was associate director/senior research associate at the New York Academy of Medicine. Earlier in her career, she was an associate editor at U.S. News & World Report, a senior economist at Health Economics Research, and a senior health policy analyst in the New York City Office of the Public Advocate. Dr. Collins holds a Ph.D. in economics from George Washington University.
ACKNOWLEDGMENTS
The authors thank Robyn Rapoport, Rob Manley, and Erin Czyzewicz of SSRS, and David Blumenthal, Elizabeth Fowler, Chris Hollander, Deborah Lorber, Paul Frame, Jen Wilson, Gabriella Aboulafia, Corinne Lewis, and Roosa Tikkanen of the Commonwealth Fund.
Editorial support was provided by Deborah Lorber.
For more information about this brief, please contact: Munira Z. Gunja, M.P.H.Senior Researcher, Health Care Coverage and AccessThe Commonwealth Fundmgcmwf.org

About the Commonwealth FundThe mission of the Commonwealth Fund is to promote a high-performing health care system that achieves better access, improved quality, and greater efficiency, particularly for society’s most vulnerable, including low-income people, the uninsured, and people of color. Support for this research was provided by the Commonwealth Fund. The views presented here are those of the authors and not necessarily those of the Commonwealth Fund or its directors, officers, or staff.