Embed Size (px)
Citation preview

DI
SC
US
SI
ON
P
AP
ER
S
ER
IE
S
Forschungsinstitut zur Zukunft der ArbeitInstitute for the Study of Labor
Who Will Be Idol? The Importance of Social Networks for Winning on Reality Shows
IZA DP No. 5056
July 2010
Odelia HeizlerAyal Kimhi

Who Will Be Idol?
The Importance of Social Networks for Winning on Reality Shows
Odelia Heizler Hebrew University
and IZA
Ayal Kimhi Hebrew University
Discussion Paper No. 5056 July 2010
IZA
P.O. Box 7240 53072 Bonn
Germany
Phone: +49-228-3894-0 Fax: +49-228-3894-180
E-mail: [email protected]
Any opinions expressed here are those of the author(s) and not those of IZA. Research published in this series may include views on policy, but the institute itself takes no institutional policy positions. The Institute for the Study of Labor (IZA) in Bonn is a local and virtual international research center and a place of communication between science, politics and business. IZA is an independent nonprofit organization supported by Deutsche Post Foundation. The center is associated with the University of Bonn and offers a stimulating research environment through its international network, workshops and conferences, data service, project support, research visits and doctoral program. IZA engages in (i) original and internationally competitive research in all fields of labor economics, (ii) development of policy concepts, and (iii) dissemination of research results and concepts to the interested public. IZA Discussion Papers often represent preliminary work and are circulated to encourage discussion. Citation of such a paper should account for its provisional character. A revised version may be available directly from the author.

IZA Discussion Paper No. 5056 July 2010
ABSTRACT
Who Will Be Idol? The Importance of Social Networks for Winning on Reality Shows* This paper examines, both theoretically and empirically, the effect of social networks and belonging to minority groups (or race) on the probability of winning in reality television shows. We develop a theoretical model that studies viewer behavior by presenting a framework of competition between two contestants from two different groups. The results are examined empirically using unique contestant data from the highly popular reality show “A Star Is Born”, the Israeli counterpart of “American Idol”. Our main finding is that social networks and belonging to minority groups play key roles in the contestant’s victory, but their effects are nonlinear: the social network effect is U-shaped, whereas that of belonging to a minority group follows an inverted U shape. Beyond the world of reality TV, this paper sheds light on the general behavior of social networks as well. JEL Classification: J15, D71, P16 Keywords: American Idol, social networks, minority groups, contest, voting Corresponding author: Odelia Heizler Department of Agricultural Economics and Management The Hebrew University P.O. Box 12 Rehovot 76100 Israel E-mail: [email protected]
* We are grateful to Klaus Zimmermann, Barry Chiswick, Carmel Chiswick, Amelie Constant, and other participants of the 6th IZA Annual Migration Meeting, for helpful and important comments.

2
1. Introduction
“American Idol”—based on the British TV show “Pop Idol”, is the most popular and
successful reality show on America's FOX TV network. “American Idol” is a singing
competition, aimed at determining the best undiscovered young singers in the country.
The judging system is democratic, with everyone being able to vote for his or her
favorite contestant. In the 2007 season, “American Idol” drew a massive audience of
37.7 million viewers, peaking in the last half hour at more than 41 million viewers,
and received a record 74 million votes.1 The “American Idol” format is successful
worldwide. It has a plethora of spinoffs, including “Australian Idol”, “Canadian Idol”,
“Indian Idol”, “Idols West Africa”, “Latin American Idol”, “New Zealand Idol”,
“Pinoy Idol” (in the Philippines), and “A Star Is Born” (in Israel), to name a few.
Although the aim of “American Idol” and its counterparts is to find the most
talented young singer in the country, viewer preferences may be affected by a variety
of considerations beyond those of contestant ability or performance. The case of
Sanjaya Malakar is an example of this: Malakar advanced to 7th place in season 6 of
“American Idol” by getting the popular vote, despite poor reviews by the show's
judges. One of those judges, Simon Cowell, threatened that if Malakar won, he would
not return to judge the following show, even though he was contractually obligated to
do so. Other competitors who won praises from the judges, like Antonella Barba,
were eliminated in preliminary rounds. The British Rock star Elton John, once a guest
judge on “American Idol”, came right out with the claim that the voting by the
national viewing audience was “incredibly racist”.2
Lee (2006) dealt with the question of whether the viewers of “American Idol”
are racially biased by using ratings data from the first four seasons, 2002 through
2005. He found that the racial composition of the contestants affects the viewing of
black and non-black households, such that as the share of black contestants increases,
the black households’ rating increases, whereas the non-black households’ rating
decreases. Lee (2006) also found strong evidence for same-race preferences in the
1 Source: Wikipedia (http://en.wikipedia.org/wiki/American_Idol). 2 According to Reuters, Source: http://au.news.yahoo.com/040427/11/oqwi.html.

3
voting: a black contestant was less likely to be voted off when there were relatively
more black viewers.
A vast number of economic and sociological studies have taken on the subject of
same-race preferences (see, for example, Marshall, 1974; Holzer and Ihlanfeldt,
1998). Becker’s pioneer study (1971) identified three principal sources of racial
discrimination: discrimination by employers, discrimination by fellow workers, and
discrimination by consumers. Becker discussed the issue of consumer discrimination
directly reducing productivity, making it impossible to tell whether differential
productivity is the effect of discrimination or of differential ability to do the job.
Studies show that racial preferences or racial discrimination begin at a young age.
Clark and Clark (1950) showed that 3- to 7-year-olds already had racial preferences:
most of white skin children preferred dolls with white skin color and rejected dolls
with brown skin color. They also found that the children’s knowledge of the concept
of racial difference had been established with the age. These racial preferences can
then be expressed in choice of spouse, neighborhood, friends and even favorite TV
show (see, for example, Wong, 2003).
Preferences for, or identification with specific contestants, irrespective of
ability, can also be explained by social networks. There is a substantial body of
economic and sociological literature on the important role played by social networks
in human interactions and in communicating valuable information (see Bala and
Goyal, 2000). This information may include, among other things, job and
accommodation options, business opportunities, stock market tips and product quality.
For example, Montgomery (1991) presented a long list of studies on the important
role of social ties, such as friends and relatives, in job-search outcomes. Carrington et
al. (1996) investigated the effect of social networks on immigrants' choice of location
in their host country. A social network is created among two or more people with a
common denominator, which can be broad (such as belonging to the same minority or
religious group, or living in the same city) or narrow (such as learning in the same
class, working in the same office).
Despite the development and enormous success of reality TV shows worldwide,
to the best of our knowledge, there have not been any economics studies examining
the relationship between social networks and viewers’ behavior in reality TV shows,
except for the aforementioned study by Lee (2006) on same-race preferences. The
economics studies that do exist on reality shows investigate the structure and rules of

4
the contest. For example, Amegashie (2007) studied the allocation of voting rights
between the expert judges and the viewers on “American Idol”, designed to prevent
low-ability contestants from winning. He showed that the contestants' differences in
ability should be an important consideration in the allocation of voting rights. Fu and
Lu (2006) examined the optimal structure of multistage sequential-elimination
contests and the optimal prize allocation, such as in “American Idol”. They focused
on the “winner-take-all” type of contest, i.e., a single winner and a single prize.
This paper starts by developing a theoretical model of competition between two
different groups where each member decides how much effort to invest in favor of the
contestant from his/her group. We study how the number of group members affects
the strength of the relationship among the members. The effect of the benefit from the
contestant’s victory on the optimal effort is also examined. Our results are tested
empirically using a unique dataset of contestants from the popular Israeli reality show
“A Star Is Born”, which is based on “American Idol”. We distinguish between the
behaviors of viewers from big cities and that of viewers from small areas, as well as
between viewers from centrally located areas and those from the periphery.
Although this paper focuses on the effects of social networks and race on the
behavior of reality-show voters, the results can be applied to a variety of situations,
such as voter support of a candidate belonging to their minority group or who was
born in their country. For example, Sen. Barak Obama, like the black leader Jesse
Jackson in '84 and '88, recently beat Sen. Hillary Clinton in the racially charged state
of South Carolina. About half of the voters were black and four out of five of them
supported Obama. Obama got only a quarter of the white votes while Clinton and Sen.
John Edwards split the rest. Obama declared that “The choice in this election is not
about regions or religions or genders…it's not about black versus white,” but it can be
explained by our model on social networks and voter behavior.
This paper is organized as follows. Section 2 describes the analyzed reality
show, “A Star Is Born”. Section 3 displays a theoretical model of competition
between two contestants from two different groups. Section 4 presents the empirical
analysis which includes a description of the data, the method and the results. Section 5
concludes.

5
2. Background—“A Star Is Born”
“A Star Is Born”, which began its first season in 2003, is one of the most popular
Israeli TV shows. “A Star Is Born”, like its counterpart “American Idol”, belongs to
the new popular TV genre of reality shows. Reality shows are based on three main
elements: 1) contestants are given a particular task; 2) at the completion of the task,
the participants are critiqued; 3) one of the contestants is then eliminated from the
competition (see Higdon, 2007). More than 31.2% of the Israeli population (35.9% of
the Jewish population) watched the final of the "A Star Is Born" competition in 2007.3
The number of votes in the final amounted to more than 900,000, as compared to
about 3,186,000 votes in the country's general election in 2006.
Like “American Idol”, “A Star Is Born” begins with preliminary auditions in
selected locations across Israel. Tens of thousands of candidates (about 40,000 in
2007) with the dream of becoming an idol are tested, interviewed and most are
eliminated before the individual auditions in front of three main judges. The body of
judges includes the best singers and artists; sometimes a fourth guest judge may be
added. In the next stage, the judges choose an initial field of about 100 candidates and
after a lengthy process, they narrow them down to a team of about 20 competitors.
Although this top team is selected by expert judges, the viewers can marginally affect
their decision by granting a “life-preserver” to selected candidates who were
eliminated in the auditions, thereby returning them to the show.
When the auditioning stage is over, the power shifts from the expert judges to
the viewers. The candidates sing solos and duets and deal with different musical
genres, and the viewers are given a limited amount of time following each broadcast
to vote for their favorite contestant via SMS from cellular phones or voting on the
internet. Compared to “American Idol” which enables voting via a toll-free number,
the voting for “A Star Is Born” costs 1 NIS per call. Another main difference between
the rules of these two shows is that whereas in “American Idol” viewers are allowed
to vote as many times as they like for any number of contestants, the voting in Israel
is limited to five votes per voting method.4 The viewers can, of course, bypass this
restriction by voting from different cellular phones and computers. The contestant
3 Source: Wikipedia in Hebrew (www.he.wikipedia.org). 4 This rule was not valid in the first three seasons, when the number of votes was limited to 250.

6
who obtains the lowest number of votes from the public is eliminated from the
competition. In each show, one contestant is voted off, up until the quarter-finals
when about eight contestants are left. Six of these contestants move on to the semi-
finals, where two groups of three contestants each compete. The winner of each group
in the semi-finals moves on to the finals and a competition between the two second-
place contestants produce the third contestant in the finals.
During the season, the viewers can learn about the contestants’ personalities,
their hobbies, their resumes and their socioeconomic backgrounds via their blogs,
official and unofficial websites, interviews and articles in magazines and newspapers,
as well as from watching the show itself. The contestants' socioeconomic background
and the minority groups to which they belong are emphasized in the media. Towards
the finals, the viewers get a glimpse of the contestants' residences. On fan-based
websites and the show's official website, among the reasons why one should vote for a
specific individual we can easily find sentences such as: “I am voting for Daniel Ben-
Haim because he lives in Migdal-Haemek,” “I am not voting for Marina because she
is Russian,” or “All the people who come from Georgia must vote for Refael Mirela.”
Take the example of Miriam Tokan, the show's first Arabic contestant. Her being
voted off spurred a widespread public debate on racist voting. Several articles were
written on the topic, a central question being whether the show, which is a symbol of
Israeli consensus, could afford to have an Arabic singer as its winner. The Arab-
Israeli cabinet minister Raleb Majadele described Tokan as a young woman who
overcame fear, broke the barriers and gave hope to all Arabic teenagers. In a letter to
Tokan he wrote: “your angelic voice was a source of pride for me.”
In every season of “A Star Is Born”, there have been spontaneous as well as
formal public activities in favor of a specific contestant by his/her community for
reasons unrelated to talent (see Neiger and Yosman, 2005). For example, the
Ashkelon city council printed and displayed posters citywide which called for people
to vote for Zipi Mashhid, a resident of that city. The city of Maale Edomim organized
a campaign in favor of its resident, Arel Moyal: for the finals, the city gathered
together dozens of teenagers to sit in the schools and vote the free 250 times for

7
Moyal.5 The mayor explained that the city’s support was in essence a way of thanking
the contestant for the honor he had brought to the city. In the finals, Moyal overcame
Skat, the contestant from Kfar Saba, who had led throughout the contest. Kfar Saba
thought it enough to send emails reminding the city’s workers to vote for Skat. The
organizing of families, relatives and friends is also common: these groups may open
“command centers” where each individual member contacts everybody he/she knows
asking them to vote for the group's favorite contestant as many times as possible.
3. The theoretical model
Consider two reality-show contestants, A and B , belonging to two different groups
or from two different locations. The probability of each contestant winning depends
on the relative number of votes he/she receives. Each group allocates resources and
effort in favor of its contestant. Although rent-seeking models usually refer to interest
groups that attempt to influence the outcomes of the political decision-making process
in their favor via resource allocation (see for example, Appelbaum and Katz, 1987),
here we adopt a standard model of rent seeking among interest groups.
Denote the number of group members for a contestant ,i i A B∀ = by iN and
each member's effort in favor of that contestant byiE . Hence the probability of
contestant i being the winner is given by:
(1) i ii
i i j j
N EP
N E N E=
+
for and , .i j j A B≠ =≠ =≠ =≠ =
It should be noted that this probability function is identical to Tullock’s (1980)
commonly used rule which claims that the probability of success in competition
equals the relative effort. We treat belonging to a contestant’s group as a club good
5 The relative weight of those teenagers was high because most of the viewers, 73.9%, chose to cast
between 1 and 10 votes by each of the two routes whereas only 3% of them cast 250 votes via each of
the two routes.
8
that provides positive returns to the participants in the club (see Iannaccone, 1992).
The decision of the group’s members as to how much effort to invest in their
contestant is affected by their benefit from his/her winning, iB , which depends on the
group’s size, iN , and the socioeconomic status of the group, iS . As the group gets
bigger, the relationship of the groups’ members with the contestant weakens and their
benefit from the candidate’s victory, iB , decreases, i.e. ( , )
0i i i
i
dB N S
dN< 6; moreover,
the lower the socioeconomic status of the group, the higher the benefit from the honor
bestowed upon them by a victory, i.e. ( , )
0i i i
i
dB N S
dS< . The utility if the contestant
loses the competition is normalized to zero. Our assumption may be supported by
Narud and Share (1999) who found that party activists, belonging to extremist and
small groups, invest more efforts in support of their candidates than activists
belonging to larger groups, indicating that their utility from their candidate’s victory
is higher.
The expected net payoff for each member of group i is given by:
(2) ( ),i i i i i iU PB N S E= − .
We focus on the interior Nash equilibrium of the contest. The conditions
characterizing this equilibrium are 0 ,i
i
Ui A B
E
∂= ∀ =
∂. From equations (1) and (2) it
follows that the optimal effort of each member in group i is given by:
(3) ( )2 1 0i j j ii
i i i j j
N N E BU
E N E N E
∂= − =
∂ +.
From equation (3), we get that at equilibrium, the optimal effort of each member of
group ,i i A B∀ =∀ =∀ =∀ = equals:
6 Suppose, for example, that the group contains only two people: if one of them wins the contest, the
other will benefit from all honor and pride resulting from a victory.

9
(4) ( )
2*
2
i j i ji
i i j j
N N B BE
N B N B=
+
for and , .i j j A B≠ =≠ =≠ =≠ =
To determine the probability of the contestant from group A being the winner at
equilibrium, we plug equation (4) into equation (1):
(5) ( )
( ) ( )
2
2
*2 2
2 2
.
i j i ji
i i j j
ii j i j i j j i
i j
i i j j i i j j
N N B BN
N B N BP
N N B B N N B BN N
N B N B N B N B
+=
++ +
From equation (5), we find that the equilibrium probability of winning the contest is
equal to:
(6) * .i ii
i i j j
N BP
N B N B=
+
This means that the probability of a contestant from group i winning is equal to the
sum of the benefits to group i ’s members from the victory of their contestant divided
by the sum of the benefits to the two groups’ members from the victory of their
respective contestants.
Let us now examine the effect of the number of group members on the
probability of winning. From equation (6):
(7) ( )
*
2 .
ij j i i
ii
i i i j j
BN B B N
NP
N N B N B
∂+ ∂∂ =
∂ +

10
The denominator of equation (7) is positive, but the numerator can be positive if
ii i
i
BB N
N
∂>
∂ or negative if i
i ii
BB N
N
∂<
∂. To determine whether the extreme point is a
minimum or maximum, we calculate the second derivative. We can obtain that:
(8)
( )
( )
22
22 *
32
2 2
.
i i ij j i i i j j i i
i i ii
i i i j j
B B BN B N N B N B B N
N N NP
N N B N B
∂ ∂ ∂ + + − + ∂ ∂ ∂ ∂ =
∂ +
The last component in brackets in the numerator is clearly negative; in addition, we
know that 0i
i
B
N
∂<
∂, and thus the sign of
2 *
2i
i
P
N
∂∂
depends on the sign of 2
2i
i
B
N
∂∂
. If
2
20i
i
B
N
∂<
∂ then
2 *
20i
i
P
N
∂<
∂ and the extreme point is a maximum; however, if
2
20i
i
B
N
∂>
∂,
the extreme point is a minimum if and only if ( )
2
2
2
22
ii i
ii i
i i ii i i j j
BB N
NB B
N N NN N B N B
∂+ ∂∂ ∂ > −
∂ ∂+.
Thus, the effect of a change in the number of group members on the probability of
their contestant succeeding in the contest is determined by the rate of the effect of
change in the number of group members on the benefit culled by each member if their
contestant wins. It is known that as the number of group members increases, the
strength of the relationship between them or their identification with the contestant
decreases (i.e. 0i
i
B
N
∂<
∂); however, the rate of that decrease is unknown.
We can conclude that:
Proposition 1
If 2
20i
i
B
N
∂<
∂ (or
2
20i
i
B
N
∂>
∂ and
( )
2
2
2
22
ii i
ii i
i i ii i i j j
BB N
NB B
N N NN N B N B
∂+ ∂∂ ∂ < −
∂ ∂+), then the
relationship between the number of group members and the probability of winning
has an inverted U shape (Figure 1).

11
If 2
20A
A
B
N
∂>
∂ and is high enough (i.e. if
( )
2
2
2
22
AA A
AA A
A A A A B B A A
BB N
NB B
N N N B N B N N
∂+ ∂∂ ∂ > −
∂ + ∂), then
the relationship between the number of group members and the probability of winning
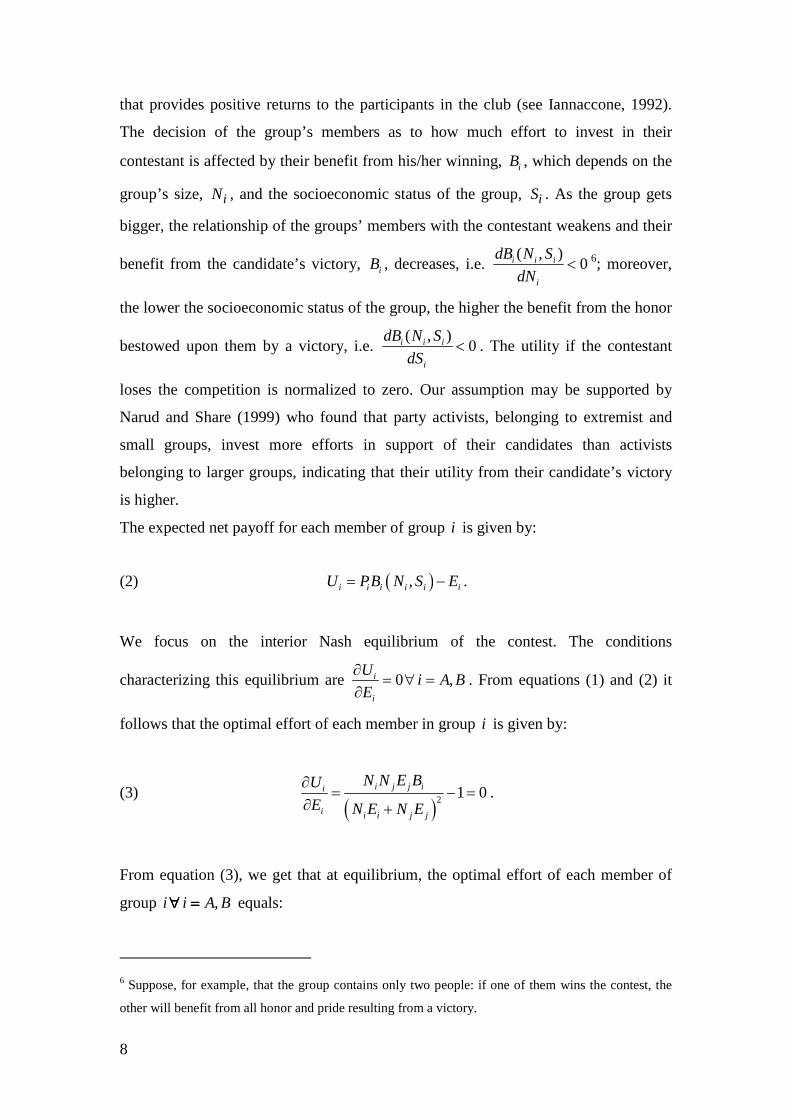
has a U shape (Figure 2).
Next we examine the effect of the group's socioeconomic status on the probability of
its contestant winning:
(9) ( )
*
2
ij j i
i i
i i i j j
BN B N
P S
S N B N B
∂∂ ∂
=∂ +
Because 0i
i
B
S
∂<
∂, it is clear that
*
0i
i
P
S
∂<
∂, hence:
Proposition 2
There is a negative relationship between the socioeconomic status of the group and
the probability of its contestant winning.
We expect that when the contestant belongs to a group characterized by low
socioeconomic status, the benefit to the group members from his/her victory will be
higher than for group members with high socioeconomic characteristics. This is
because the victory brings the former group, which has a negative image, positive
exposure and the hope that additional members will succeed, as in the aforementioned
case of the Arabic contestant Miriam Tokan. Therefore, the members of this group
will increase their efforts in support of their contestant.
Similarly, it is easy to see that ( )
*
2 0.j ji
i i i j j
N BP
B N B N B
∂= >
∂ +In words, there is a positive
relationship between the benefit to the group’s members from the victory of the
contestant and his/her probability of winning. This result is supported by many studies
which have shown that the player with the higher net payoff invests more resources in

12
the contest and has a higher probability of winning the contest (see for example,
Epstein and Nitzan, 2002).
4. Empirical evidence
4.1 Summary statistics
Following the theoretical model presented above, we examine the effect of social
networks on the probability of winning a competition using unique data on the
contestants of “A Star Is Born” for all five seasons, 2003 through 2007. Our dataset
contains 103 individuals who reached the televised rounds, i.e. the rounds in which
the audience participates in the judgment process. A listing of our data sources can be
found in the Appendix.
The key explanatory variables in our analysis measure social networks.
Following Bertrand et al (2000), Epstein et al. (2007) and others, we use two proxy
variables to represent the social networks which exist within localities and within
minority groups: the first is the number of residents in the contestant’s location of
residence, the second is the number of members in his/her minority group across
Israel (if the contestant belongs to a minority group).In addition, the strength and
width of social networks may vary by age, and teenagers also have more interest in
reality TV programs than older people. Hence, we use the share of young people in
the contestant's place of residence as another explanatory variable in the probability of
success in the contest. From the theoretical model, it follows that as the viewers'
benefit from their contestant winning increases, so will the effort they invest in
him/her. We take the socioeconomic level of the contestant’s location of residence as
a proxy variable for the benefit incurred by the residents from their contestant
winning, i.e., the lower the socioeconomic level of the location, the more negative
press they receive, such as widespread unemployment, poverty, crime, etc. Therefore,
the benefit to these residents from positive exposure in the media and the hope and
honor brought about by a victory is higher than that to residents of a location with
high socioeconomic level. We also control for other variables that may affect the
probability of winning the contest, such as: gender, age and musical experience.
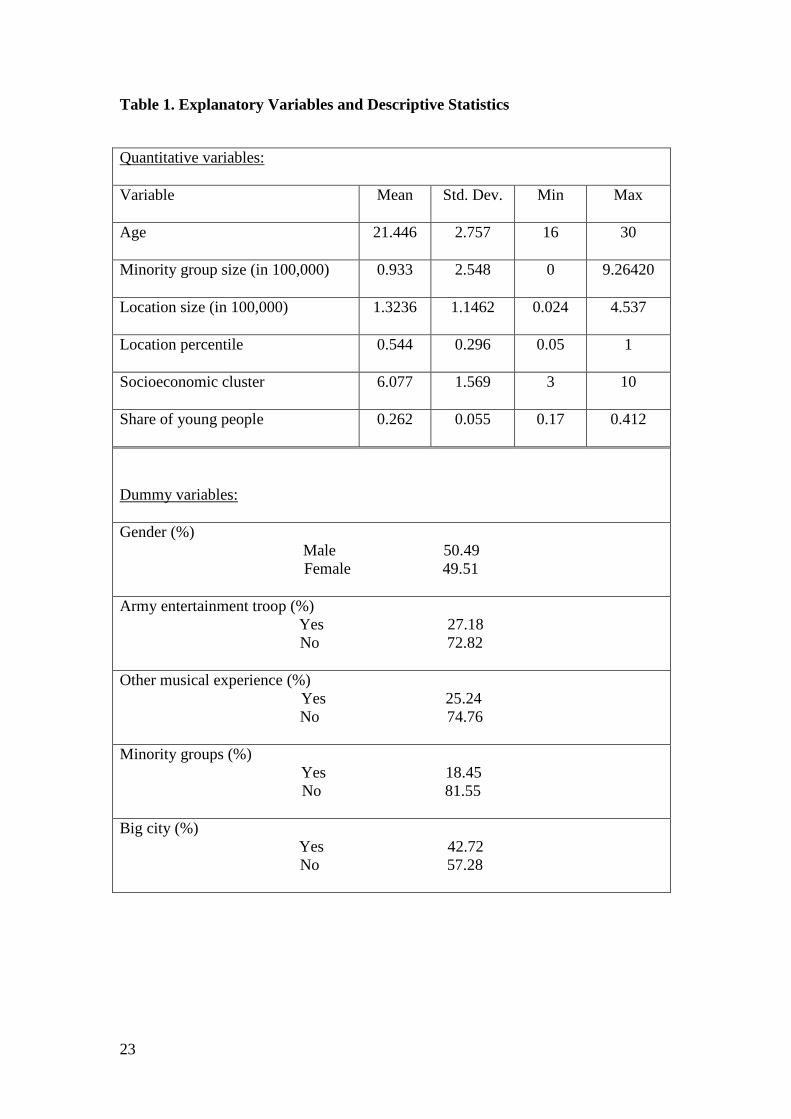
Table 1 displays summary statistics of the contestants and the characteristics of
their locations of residence. About half of the contestants are male. Their average age
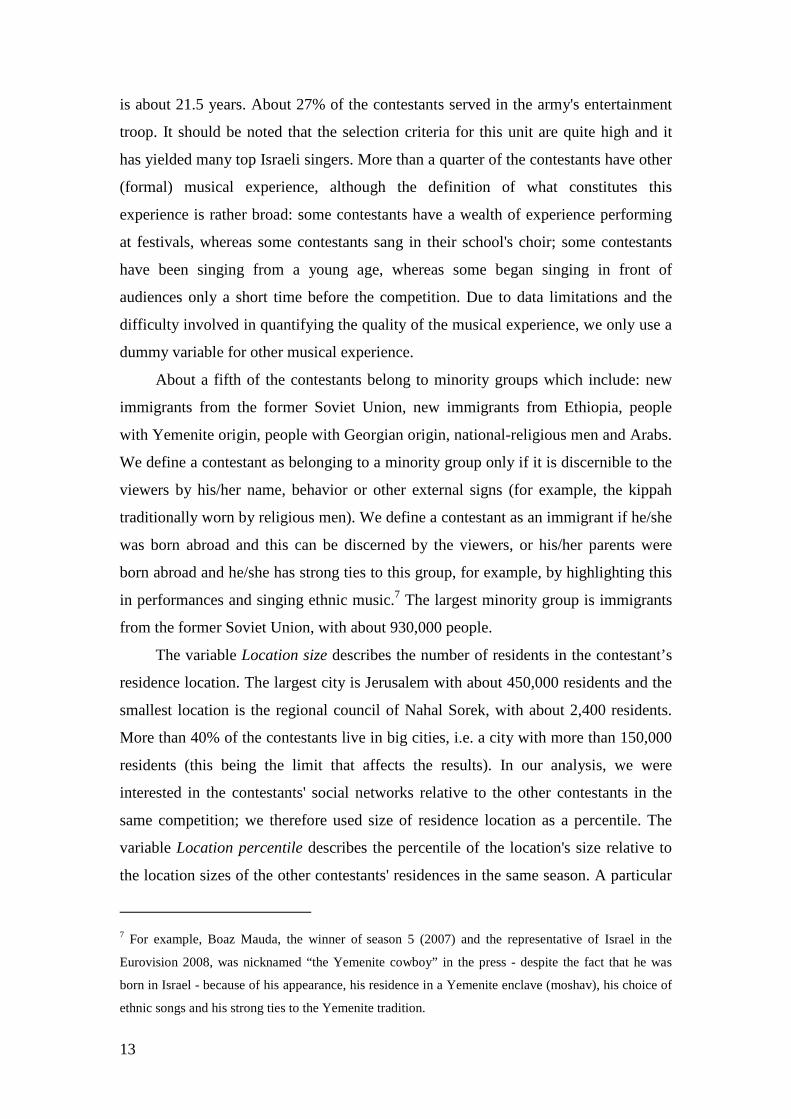
13
is about 21.5 years. About 27% of the contestants served in the army's entertainment
troop. It should be noted that the selection criteria for this unit are quite high and it
has yielded many top Israeli singers. More than a quarter of the contestants have other
(formal) musical experience, although the definition of what constitutes this
experience is rather broad: some contestants have a wealth of experience performing
at festivals, whereas some contestants sang in their school's choir; some contestants
have been singing from a young age, whereas some began singing in front of
audiences only a short time before the competition. Due to data limitations and the
difficulty involved in quantifying the quality of the musical experience, we only use a
dummy variable for other musical experience.
About a fifth of the contestants belong to minority groups which include: new
immigrants from the former Soviet Union, new immigrants from Ethiopia, people
with Yemenite origin, people with Georgian origin, national-religious men and Arabs.
We define a contestant as belonging to a minority group only if it is discernible to the
viewers by his/her name, behavior or other external signs (for example, the kippah
traditionally worn by religious men). We define a contestant as an immigrant if he/she
was born abroad and this can be discerned by the viewers, or his/her parents were
born abroad and he/she has strong ties to this group, for example, by highlighting this
in performances and singing ethnic music.7 The largest minority group is immigrants
from the former Soviet Union, with about 930,000 people.
The variable Location size describes the number of residents in the contestant’s
residence location. The largest city is Jerusalem with about 450,000 residents and the
smallest location is the regional council of Nahal Sorek, with about 2,400 residents.
More than 40% of the contestants live in big cities, i.e. a city with more than 150,000
residents (this being the limit that affects the results). In our analysis, we were
interested in the contestants' social networks relative to the other contestants in the
same competition; we therefore used size of residence location as a percentile. The
variable Location percentile describes the percentile of the location's size relative to
the location sizes of the other contestants' residences in the same season. A particular
7 For example, Boaz Mauda, the winner of season 5 (2007) and the representative of Israel in the
Eurovision 2008, was nicknamed “the Yemenite cowboy” in the press - despite the fact that he was
born in Israel - because of his appearance, his residence in a Yemenite enclave (moshav), his choice of
ethnic songs and his strong ties to the Yemenite tradition.

14
location's size percentile can differ from year to year. For instance, in the 2004
competition, the percentile of the city of Ashdod was 70, whereas it was the largest
city in the 2006 competition (i.e. its percentile was set at 100).
The variable Socioeconomic cluster is an index of the socioeconomic level of a
location, ranked from 1 to 10. This index is prepared by the Israeli Central Bureau of
Statistics. It takes into account a variety of parameters such as: median age, average
income per capita, unemployment rate, housing density, rate of households with
computers, average number of cars per household, etc. The average socioeconomic
cluster of the contestants' residence locations is around 6. Another variable is the
Share of young people (aged 10-24 years) in the contestant's location of residence. It
is assumed that young people have a greater interest in the singing competition, and
therefore play a larger part in the voting than older people. The average share of
young people is 26%. Netivot leads in the list with more than 40% young people,
whereas Givataim is in last place, with only 17%.
4.2 Method
In the theory section we modeled the probability of winning. This is however too
simplistic for our empirical application. The reason is that the contest is conducted in
several stages. In each stage, some of the contestants advance to the next stage, while
the others are eliminated. Therefore, we choose as a dependent variable the highest
stage of the competition reached by the contestant. We would have preferred to use
the number (or percent) of votes received by each contestant, but these data are not
available: we only know who obtains the fewest votes and is eliminated. Of course, as
the contestant survives more rounds, the implication is that he/she has more votes than
the contestants who are voted off. Hence, we treat the number of votes as a latent
continuous variable that determines the probability of winning (as in the theoretical
model) as well as the highest stage achieved (as in the empirical application).
Table 2 presents two possible divisions into stages, with each stage including the
value of the dependent variable and the percentage of observations. The first
possibility is division into six stages: first place, second place, third place, semi-final,
quarter-final and others. The second division possibility consists of three stages: takes
part in the final (i.e., the three top places), takes part in the semi-final or quarter-final,
and others. The first division possibility has two main problems: in “A Star Is Born”,
the judges can grant “immunity” to one contestant per round until the semi-finals (if

15
there is consensus among the judges). This means that this contestant will move on to
the next round even if he/she receives the lowest number of votes. This can
marginally affect the results because sometimes the “immune” contestant is the one
that would have otherwise been eliminated.8 Moreover, the weight of the judges’
score in the finals and semi-finals is 25% (75% being the share of the viewer votes),
and thus the judges can influence the order of the three finalists. Unfortunately, we do
not have accurate information on the contestants’ rankings without the judges’ scores.
The second problem in the first division possibility is scarcity of observations for the
first three places, i.e., amounting to less than 5% (see Table 1); however, if we refer to
this group as one category, it contains almost 15% of the observations. We therefore
adopt the second division possibility, i.e. division into three stages.
Ordered Logit models are used to estimate the relationship between the stage
reached by the contestant and a set of independent variables (see Greene, 2002). The
Ordered Logit model specifies the probability of observing outcome i as the
probability that a linear function of explanatory variables plus a random error, is
within the range of the cut points estimated for the outcome:
(10) ( )1 1 1 2 2Pr( ) Pr ... , 1,...,j i j j k kj j ioutcome i k x x x u k i Iβ β β−= = < + + + + ≤ =
where ju is assumed to be logistically distributed. In either case, the coefficients
1 2, ,..., kβ β β along with the cut points, 1 2 1, , Ik k k − are estimated, where I is the
number of possible outcomes, 0k is taken as −∞ and Ik as +∞ .
The estimated coefficients of the Ordered Logit model cannot be readily
interpreted. They represent marginal effects of each variable on the unobserved latent
variable from which the ordered outcomes are derived should be estimated, but these
marginal effects are conditional on normalizing the error variance to 1. Hence, we
will refer to the signs of these marginal effects rather than on their magnitude.
The data is composed of observations on contestants from five consecutive
seasons; this gives rise to the possibility that the standard errors are correlated within
8 For example, in season 5 (2007), Alisa Shparaga rose to the semi-finals only thanks to “immunity”
from the judges.

16
each season. We therefore derive cluster-robust standard errors for the statistical
inference.
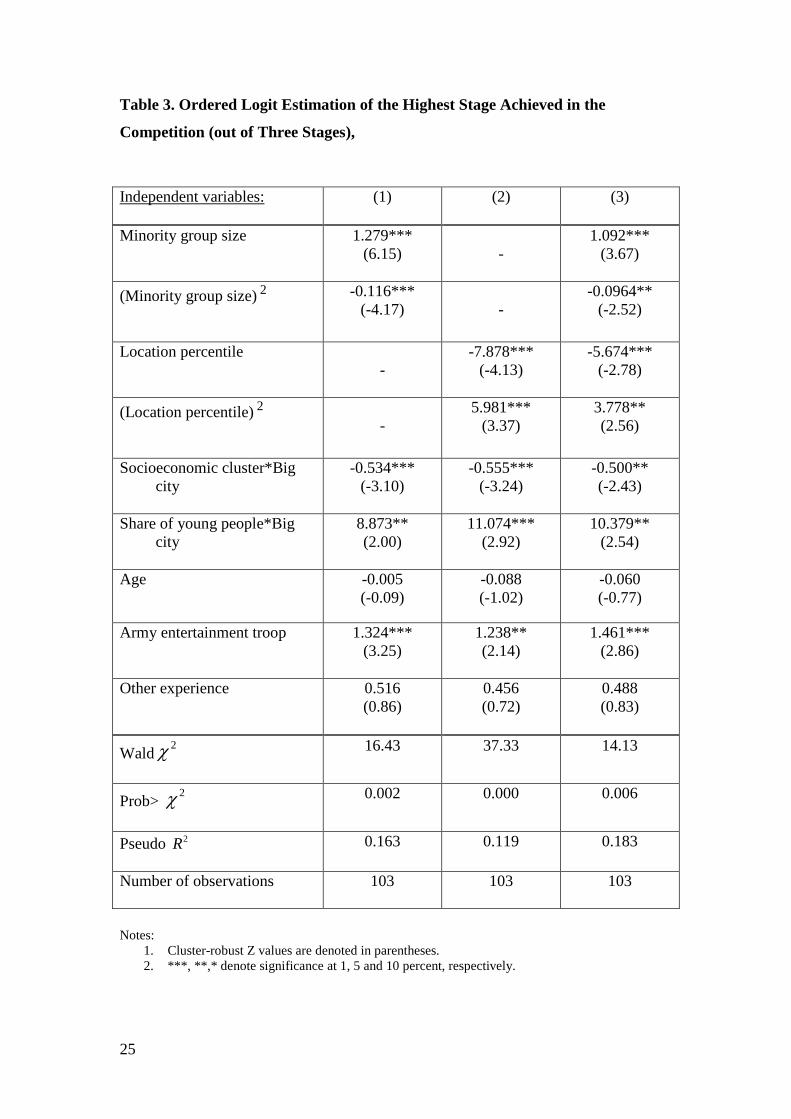
4.3 Results
Table 3 presents the results. Due to correlation between the variables Location size
and Minority group size, we run segregated regressions with each social network’s
variable in columns (1) and (2). Column (3) displays the regression with both
variables. As expected from our theoretical model, we find that the effect of social
network variables on the level of success in the competition is not linear - the
variables behave differently: the minority group size has an inverted U-shaped effect
on the probability of winning in the contest whereas the location size has a U-shaped
effect on this probability. The inverted U and U shapes are retained in the combined
regression in column (3), but the significance decreases because of the correlation.
Our results indicate that the size of the minority group increases the level of success
as long as it is lower than about 550,000, and decreases the level of success above this
cutoff point. Hence, contestants from “medium-size” minorities have a higher level of
success relative to contestants from smaller or bigger minority groups. The Increasing
location percentile decreases the probability of winning as long as it is below 65%,
and increases the probability above that cutoff, such that contestants from the biggest
and smallest locations have better chances of winning the contest.
The location's socioeconomic cluster has a significant effect only in big cities
(i.e. city with 150,000 residents or more).910 As expected, its effect is negative, i.e.
contestants from big cities have a higher probability of winning the contest as the
socioeconomic level of their location decreases. The variable Share of young people
also has a significant and positive effect only in big cities.11 The fact that these
variables are significant only for big cities can be explained as follows: in big cities,
9 When we estimated the regression with the variables socioeconomic cluster, Share of young people,
and their interactions with big cities, the results does not change qualitatively. 10 We examined the existence of different effects of economic cluster and share of young people in big
versus small locations, but we found a significant effect only for big locations. 11 As explained in the Appendix, this variable is based on the 1995 population census (the most recent
Israeli census), so it may not precisely represent today's situation. However, the essence of the results
did not change when we left this variable out.

17
the probability of a viewer from the contestant's residence location knowing the
contestant (or his/her family) personally is rather small, and the feeling of
membership and identification with the contestant is weak. If the viewer votes for a
contestant from his/her location, he/she is probably doing so to benefit from that
contestant's becoming the winner. The lower the socioeconomic level of the location,
the greater the viewer's benefit from positive advertisement and from the consequent
hope that people from this location will succeed in the future; however, in small
locations, the personal connection with the contestant (or his/her extended family) and
the identification with him/her is stronger than in big cities. Hence, people will invest
effort in their contestant, even if the benefit from positive advertisement is low.
Moreover, people in small locations will invest effort in their contestant even if they
are adults and reality TV shows interest them less than they interest young people.
The variable age is not significant in any of the regressions. Note that its
variance is rather small (table 1); while the average age is 21.5, 80% of the
contestants are aged 23 years or younger. Note that the rules of the contest determine
a lower age limit, 16 years, but there is no upper limit (as opposed to “American Idol”
which imposed an upper age limit of 24 years, which was then increased to 28 years).
Nevertheless, the judges actually tend to select the younger contestants in the early
auditions. Regarding gender, the judges and the show's producers try to prevent a
situation in which all the finalists are males or females via some tools they have at
their disposal (for example, dividing the contestants into two semi-finalist groups,
granting “immunity”, the “life-preserver” option which returns contestants who were
voted off the program, etc.). Hence, our regressions do not include the variable
Gender.12
As expected, serving in the army's entertainment troop affects the prospects of
success in the contest significantly and positively. However, surprisingly, the dummy
variable of other musical experience is not significant. This can be explained by the
broad definition of this variable: some contestants have a wealth of musical
experience, whereas some have very little, but we cannot distinguish between them.
Another explanation is that the viewers prefer to vote for previously unknown singers.
Table 4 presents the results when the dependent variable is divided into six stages. As
mentioned above, this division is somewhat problematic because of the judges'
12 The essence of the results does not change even if we include this variable.

18
potential marginal effect on the stage a particular contestant reaches and because of
the scarcity of observations for the top three places. However, we can see that the
essence of the results does not change using this division.
5. Discussion
This paper has studied the effect of social networks of contestants on his probability
of winning the contest, both theoretically and empirically. We examined two kinds of
social networks: those based on the contestant’s place of residence and those based on
minority groups if the contestant belongs to such a group. Our theoretical results show
that the social networks’ behavior depend on the rate of the effect of change in the
number of contestant’s group members on the benefit culled by each member if their
contestant wins and on the socioeconomic status of the contestant’s group.
We used contestant data from the highly popular reality show “A Star Is Born”,
the Israeli counterpart of “American Idol”. We found that the effect of social network
variables on the probability of winning the competition is not linear: the minority
group size has an inverted U-shaped effect on the probability of winning the contest,
whereas the location size has a U-shaped effect on this probability. This means that
the size of the minority group initially increases the probability of winning and
afterward decreases it, whereas the location size initially decreases the probability of
winning and afterward increases it. We also found that the socioeconomic status of
the contestant’s group significantly decreases the probability of winning the contest,
but only for contestants from big cities.
In this paper, we identified a number of significant attributes of social networks,
related to voting in reality TV shows. While reality shows have become central and
important in the culture and leisure life of millions across the world, there are almost
no studies on the behavior of those people. Our theoretical model of the optimal effort
of the individual in favor of his favorite contestant has been applied to the case of
reality shows, but it can be applied to various other cases, such as membership in
sport clubs, membership in church groups, supporting political candidates, etc.

19
References
Amegashie, J.A. (2007): American Idol: Should it Be a Singing Contest or a Popularity Contest? CESifo Working Paper Series No. 2171. Appelbaum, E. and Katz, E. (1987): “Seeking Rents by Setting Rents: The Political Economy of Rent Seeking,” The Economic Journal, 97(387), pp. 685-699. Bala, V. and Goyal, S. (2000): “A Strategic Analysis of Network Reliability,” Review of Economic Design, 5, pp. 205-228. Becker, G.S. (1971): The Economics of Discrimination. Chicago: The University of Chicago Press. Bertrand, M., Luttmer, E.F.P. and Mullainathan, S. (2000): “ Network Effects and Welfare Cultures,” The Quarterly Journal of Economics, 115(3), pp. 1019-1055. Carrington, W.J., Detragiache, E. and Vishwanath, T. (1996): “Migration with Endogenous Moving Costs,” American Economic Review, 86(4), pp. 909-930. Clark, K.B. and Clark, M.P. (1950): “Emotional Factors in Racial Identification and Preference in Negro Children,” The Journal of Negro Education, 19(3), pp. 341-350. Bauer, T. Epstein, G.S. and Gang, I.N. (2007): “The Influence of Stocks and Flows on Migrants’ Location Choices,” Research in Labor Economics, 2007, 26, 199-229. Epstein, G.S. and Nitzan. S. (2002): “Asymmetry and Corrective Public Policy in Contests,” Public Choice, 113(1-2), pp. 231-240. Fu, Q. and Lu, J. (2006): “The Optimal Multi-Stage Contest”, MPRA Paper No. 946, http://mpra.ub.uni-muenchen.de/946/ Greene, W.H. (2002): Econometric Analysis (Fifth Edition). New Jersey: Prentice Hall. Higdon, M.J. (2007): “From Simon Cowell to Tim Gunn: What Reality Television Can Teach Us About How to Critique our Students' Work Effectively,” Perspectives: Teaching Legal Research and Writing, 15(3), pp. 169-173.
Holzer, H.J. and Ihlanfeldt, K.R. (1998): “Customer Discrimination and Employment
Outcomes for Minority Workers,” The Quarterly Journal of Economics, 113(3), pp. 835-867. Iannaccone, L.R. (1992): “Sacrifice and Stigma: Reducing Free-riding in Cults, Communes, and Other Collectives,” Journal of political Economy, 100(2), pp. 271-91. Lee, J. (2006): American Idol: Evidence of Same-Race Preferences? IZA Discussion Paper No. 1974, Bonn: IZA,. www.iza.org.

20
Marshall, R. (1974): “The Economics of Racial Discrimination: A Survey,” Journal of Economic Literature, 12(3), pp. 849-871. Montgomery, J.D. (1991): “Social Networks and Labor-Market Outcomes: Toward an Economic Analysis,” American Economic Review, 81(5), pp. 1408-1418. Narud, H.M. and A. Share (1999): “Are Party Activist the Party Extremists? The Structure of Opinion in Political Parties”, Scandinavian Political Studies, 22(1), pp. 45-65. Neiger, M. and Yosman, A. (2005): “The Illusion of Democratic Choice: How the Reality Shows Achieve Cooperation of Viewers,” Chaim Herzog Institute for Media, Politics and Society, Booklet 3. (in Hebrew) www.tau.ac.il/institutes/herzog. Tullock, G. (1980): "Efficient rent-seeking". In Buchanan, J.M., Tollison, R.D. and Tullock, G., Toward a Theory of the Rent-Seeking Society. College Station: Texas A & M University Press, pp. 97-112. Wong, L.Y. (2003): “Why Do Only 5.5% of Black Men Marry White Women?" International Economic Review, 44(3), pp. 803-826.

21
Figure 1. Inverted U-shaped probability of winning
AN
AP
AN
AB

22
Figure 2. U-shaped probability of winning
AN
AB
AN
AP
23
Table 1. Explanatory Variables and Descriptive Statistics
Quantitative variables:
Variable
Mean Std. Dev. Min Max
Age
21.446 2.757 16 30
Minority group size (in 100,000)
0.933 2.548 0 9.26420
Location size (in 100,000)
1.3236 1.1462 0.024 4.537
Location percentile
0.544 0.296 0.05 1
Socioeconomic cluster 6.077
1.569 3 10
Share of young people
0.262 0.055 0.17 0.412
Dummy variables:
Gender (%)
Male 50.49 Female 49.51
Army entertainment troop (%)
Yes 27.18 No 72.82
Other musical experience (%)
Yes 25.24 No 74.76
Minority groups (%)
Yes 18.45 No 81.55
Big city (%)
Yes 42.72 No 57.28

24
Table 2. The Dependent Variable
Six stages Three stages Stage
Value Percent of observations
Value Percent of observations
First place (takes part
in the final)
6
4.85%
Second place (takes part in the final)
5 4.85%
Third place (takes part in the final)
4 4.85%
3 14.56%
Semi-final
3 13.59%
Quarter-final
2 16.5%
2 30.10%
Others
1 55.34% 1 55.34%
25
Table 3. Ordered Logit Estimation of the Highest Stage Achieved in the
Competition (out of Three Stages),
Independent variables:
(1) (2) (3)
Minority group size
1.279*** (6.15)
-
1.092*** (3.67)
(Minority group size)2
-0.116*** (-4.17)
-
-0.0964** (-2.52)
Location percentile
-
-7.878*** (-4.13)
-5.674*** (-2.78)
(Location percentile)2
-
5.981*** (3.37)
3.778** (2.56)
Socioeconomic cluster*Big city
-0.534*** (-3.10)
-0.555*** (-3.24)
-0.500** (-2.43)
Share of young people*Big city
8.873** (2.00)
11.074*** (2.92)
10.379** (2.54)
Age
-0.005 (-0.09)
-0.088 (-1.02)
-0.060 (-0.77)
Army entertainment troop
1.324*** (3.25)
1.238** (2.14)
1.461*** (2.86)
Other experience
0.516 (0.86)
0.456 (0.72)
0.488 (0.83)
Wald2χ
16.43 37.33 14.13
Prob> 2χ
0.002 0.000 0.006
Pseudo 2R
0.163 0.119 0.183
Number of observations
103 103 103
Notes:
1. Cluster-robust Z values are denoted in parentheses. 2. ***, **,* denote significance at 1, 5 and 10 percent, respectively.

26
Table 4. Ordered Logit Estimation of the Highest Stage Achieved in the
Competition (out of Six Stages), Independent variables:
(1) (2) (3)
Minority group size
1.150*** (3.85)
-
1.015*** (2.72)
(Minority group size)2
-0.101*** (2.70)
-
-0.087* (-1.88)
Location percentile
-
-6.950*** (-3.19)
-5.312** (-2.50)
(Location percentile)2
-
5.412*** (2.74)
3.636*** (2.58)
Socioeconomic cluster*Big city
-0.465*** (-2.77)
-0.504*** (-3.02)
-0.428** (-2.10)
Share of young people*Big city
7.306* (1.65)
9.629*** (2.60)
8.443** (2.07)
Age
-0.005 (-0.08)
-0.081 (-1.02)
-0.057 (-0.86)
Army entertainment troop
1.159** (2.28)
0.993 (1.62)
1.270** (2.30)
Other experience
0.454 (0.94)
0.386 (0.73)
0.422 (0.92)
Wald 2χ
11.19 84.78
41.44
Prob> 2χ
0.024 0.000 0.000
Pseudo 2R
0.111
0.073
0.124
Number of observations
103 103 103
Notes:
1. Cluster-robust Z values are denoted in parentheses. 2. ***, **,* denote significance at 1, 5 and 10 percent, respectively.

27
Appendix—data sources
1. Personal data on the contestants
Personal data on the contestants such as: gender, age, residence, musical experience,
belonging to minority groups and the stage that he/she reached in the competition
were collected from the official website of “A Star Is Born”, fan websites, personal
websites, contestant blogs and watching the programs. The official website of “A Star
Is Born” only contains full details on the contestants from seasons 4 and 5 (years
2006-2007) and was used as the basis for data on the contestants from those seasons.
The data on contestants from earlier seasons were collected from the other mentioned
sources.
The main websites from which the data were drawn are:
Official website of “A Star Is Born 5”:
http://www.keshet-tv.com/Starborn5/Default.aspx
Official website of “A Star Is Born 4”:
http://www.keshet-tv.com/Starborn4/Default.aspx
Links to contestants personal websites:
http://index.nana10.co.il/category.asp?cat=3144
Details on season 3 contestants:
http://www.tve.co.il/mini.asp?id=31
Details on season 2 contestants:
http://www.tapuz.co.il/blog/userBlog.asp?FolderName=KohavNolad2
Details on season 1 contestants:
http://mooma.keshet-tv.com/Discs.asp?ArtistID=29&AlbumID=39331
2. Data on residence location and minority group characteristics
• The number of residents in a locality and the minority group sizes were
obtained from the Central Bureau of Statistics, Statistical Abstract of Israel for
the years 2003-2007.
• The socioeconomic clusters of residence localities were collected from the
Central Bureau of Statistics, Characterization and Classification of Local
Authorities by the Socioeconomic Level of the Population, 2003.

28
• The share of young people was collected from the Central Bureau of Statistics,
Population and Housing Census, 1995. Due to the lack of other data on the
share of young people, we used the share of children aged 0-14 years at the
time of the census as a proxy for young people aged 10-24 at the time of the
competition.