Embed Size (px)
Citation preview
Who writes the pay slip? Do R&D subsidies merely increase researcher wages?
Kris Aerts
DEPARTMENT OF MANAGERIAL ECONOMICS, STRATEGY AND INNOVATION (MSI)
Faculty of Business and Economics
OR 0806
1
Who writes the pay slip?
Do R&D subsidies merely increase researcher wages?
Kris Aerts K.U.Leuven R&D and K.U.Leuven, Dept. of Managerial Economics, Strategy and Innovation
October 2008
Abstract
Government intervention in private R&D activity is common practice nowadays. However, its impact may not be unambiguously positive. First, companies may simply replace private R&D budgets with the public R&D grant. Second, even if an increase in private R&D investment is confirmed, it may not automatically induce more R&D output: the additional R&D budget may be crowded out by duplicate or more risky research, or a mere increase in researcher wages.
This paper empirically analyzes the effect of public R&D subsidies on private R&D investments, employment and wages in Flanders, using a parametric treatment effects models on the funding status as well as IV regression models on the amount of funding. Positive additionality effects are supported, measured in terms of R&D expenditure, employment and wages. However, partial crowding out cannot be rejected. Keywords: R&D subsidies, R&D expenditure, R&D employment, R&D wages, policy
evaluation, treatment effects model, IV model JEL-Classification: C21, H50, J20, J24, O38 Address: K.U.Leuven Research & Development
Minderbroedersstraat 8A P.B. 5105 BE-3000 Leuven BELGIUM
Phone: +32 (0)16 32 06 49 Fax: +32 (0)16 32 65 15 E-mail: [email protected]
2
1. Introduction
R&D activity fosters economic growth (Romer, 1990) and is crucial in every
modern economy these days. However, R&D is a high-risk activity entailing a
substantial level of uncertainty (Dasgupta and Maskin, 1987). Large R&D
investments may not (immediately) lead to results which contribute significant
value to a company (Rosenberg, 1974). One of the main concerns of R&D
managers therefore is to attract qualified and motivated personnel, apt to conduct
R&D activities with a considerable degree of success. The lack of qualified
personnel is an important bottleneck, seriously hampering innovative activity
(Eurostat, 2004 as well as Mohnen et al., 2008). Moreover, sooner or later,
knowledge created in the R&D process becomes available to other companies,
which have the opportunity to free ride and exploit this knowledge (Arrow, 1962).
Mobility of R&D personnel is one of the main factors explaining (un)desired
spillovers between companies (Mansfield, 1985). Maliranta et al. (2008) mitigate
this effect though, as they find that most of the knowledge which is transferred by
employees, is knowledge which can be easily copied and implemented without
substantial additional R&D efforts. An adequate remuneration therefore is crucial to
attract, stimulate and retain highly competent R&D personnel. Earnings are an
important determinant in the remuneration system, although also intrinsic
motivations like job satisfaction and exciting job opportunities matter (Coombs and
Gomez-Mejia, 1991). Researcher wages consume the lion’s share of the total R&D
expenditure of a company.
An adequate remuneration system may attenuate the free-rider problem, but
also the government can play an important role through public intervention.
Because of the negative externalities (see e.g. Arrow, 1962) in the R&D process,
companies are expected to invest less than what is socially desirable and as a
consequence some projects, despite their significant social benefit, will not be
executed. An R&D subsidy lowers the cost of a private R&D project and possibly
alters its outcome into an expected net profit, resulting in a positive decision to
conduct the project. Subsidies for R&D projects by now have become a well-
established government intervention tool in the private R&D sector. However,
companies may well replace their own, private money with the grant they received
3
from the government, which would in the end not increase total private R&D
expenditures. Empirical research on this crowding-out hypothesis is vast (see e.g.
Aerts et al., 2007 for a survey of the empirical evidence) and many researchers
reject, while others support it. However, as David and Hall (2000) suggest: ‘the
more the better’ is a questionable statement when it comes to R&D expenditure.
Mere R&D expenditures may not constitute an adequate measure to evaluate the
effectiveness of R&D subsidies. They advise to introduce the close
interconnectivity between scientific labour markets and R&D investment decisions
into the evaluation process of public R&D policy. Goolsbee (1998) came to the
conclusion that R&D subsidies are primarily translated into researcher wage
increases, inflating positive additionality effects by 30% to 50%. Wallsten (2000)
and Suetens (2002) agree as their data refute the argument that R&D subsidies
stimulate the demand for R&D personnel. Yet other researchers find positive
estimates for increases in the R&D staff due to a subsidy (Üçdoğruk, 2004; Ali-
Yrkkö, 2005; as well as Reinthaler and Wolff, 2004).
This paper empirically analyzes the effect of public R&D subsidies on private
R&D investments, employment and wages in Flanders, employing parametric
treatment effects models and IV methods. In the next section, the relevant literature
will be discussed. Subsequently, I come to a brief explanation of the econometric
methods underlying the empirical evidence. After a description of the data in the
fourth section, the estimation results are presented and subsequently discussed in the
two last sections.
2. Literature Review
The evaluation of public R&D policy has been extensively addressed in
empirical research. David and Hall (2000) conclude in their review of evaluation
studies on innovation input that the results on potential crowding-out effects are
ambiguous, and they criticize that most existing studies neglect the problem of
sample selection bias: it is not implausible that an endogenous relationship exists
between R&D investments and the receipt of public R&D grants. On the demand
side of public funding, R&D intensive firms may well be more likely to apply for a
subsidy: they are more apt to market their project as being highly interesting for
society and exhibiting a high expected rate of success. Moreover, they may be better
4
acquainted with the eligibility criteria and the procedures to apply for a subsidy. On
the supply side of the public funding system, the government may just as well be
more inclined to grant them a subsidy, as R&D intensive firms exhibit a higher
expected rate of success. This makes R&D funding an endogenous variable, which
may seriously distort evaluation results. In the next section, I expound on the
methodological consequences of this endogeneity problem. More recent research
takes this potential sample selection bias into account through selection models,
instrumental variable (IV) estimations (including simultaneous equation systems),
difference-in-differences estimations and matching techniques. So far, Austria,
Denmark, Finland, Flanders, France, Germany, Ireland, Israel, Norway, Spain,
Sweden and the US have been subject to an R&D input evaluation analysis of their
public R&D funding system. These studies tend to reject full crowding-out effects
but the results are ambiguous1. Key reasons for these diverging conclusions are the
use of different estimators, as well as the application for a broad range of countries,
each with their own specific S&T policy (David and Hall, 2000).
However, more private R&D investments do not necessarily translate into
more R&D output. Moreover, even if an increase in private R&D activity is
confirmed, it may not be beneficial for the society. Inefficiencies may rise from
duplicate research (Irwin and Klenow, 1996 as well as David and Hall, 2000),
though Dasgupta and Maskin (1987: 582) state that “parallelism need not imply
waste”. The additional R&D budget may be allocated to more risky and therefore
potentially less successful projects (Setter and Tishler, 2005). Romer (2000)
denounces the mismatch between policy measures stimulating the private demand
for scientists and engineers and the incapability of the educational system to provide
a positive supply response. Consequently, David and Hall (2000) advocate the
introduction of labour market dynamics into the additionality issue.
Although the development of econometric methods (see Heckman et al., 1997
and Heckman et al., 1999 for a survey) to counter the difficulties in measuring the
effectiveness of policy programs originated in labour market economics (the
1 Aerts and Czarnitzki (2004 and 2006), Aerts and Schmidt (2008), Ali-Yrkkö (2004), Almus and Czarnitzki (2003), Clausen (2007), Czarnitzki (2001), Czarnitzki and Fier (2002), Czarnitzki and Hussinger (2004), Duguet (2004), Ebersberger (2005), Fier (2002), González and Pazó (2006), González et al. (2005), Görg and Strobl (2007), Hussinger (2008), Hyytinen and Toivanen (2005), Lööf and Heshmati (2005) and Streicher et al. (2004) reject full crowding-out effects, while Busom (2000), Heijs and Herrera (2004), Kaiser (2004), Lach (2002), Suetens (2002), Toivanen and Niininen (2000) as well as Wallsten (2000) find indications that public R&D funding replaces private R&D investments to some extent. The interested reader is referred to Aerts et al. (2007) for a survey of the recent literature on the evaluation of public innovation policy.
5
evaluation of labour programs including public job training and active labour
market policies), the main research issue in additionality research of R&D subsidies
became to find out how much more private R&D investments were made, due to the
provision of public money for private R&D activities. The impact on the R&D
workforce has been ignored to a large extent.
To the best of my knowledge, only a limited number of studies explores this
research path, either on the macro (Reinthaler and Wolff, 2004) or micro (Goolsbee,
1998 for individuals and Wallsten, 2000; Suetens, 2002; Üçdoğruk, 2004 and Ali-
Yrkkö, 2005 for firms) level. The empirical evidence is not unanimous, however.
One explanation can be found, by analogy with diverging results in the more
traditional R&D additionality research, in the use of different datasets, covering
different regions and time windows and the application of various methodologies.
Another explanation is the behaviour of the inputs of the R&D process, including
the supply of R&D personnel. Different hypotheses are put forward in the literature,
predicting the elasticity of the supply of researchers and their wages. A subset of the
studies mentioned above additionally substantiates proof on the impact of public
R&D funding on R&D wages (Goolsbee, 1998; Reinthaler and Wolff, 2004;
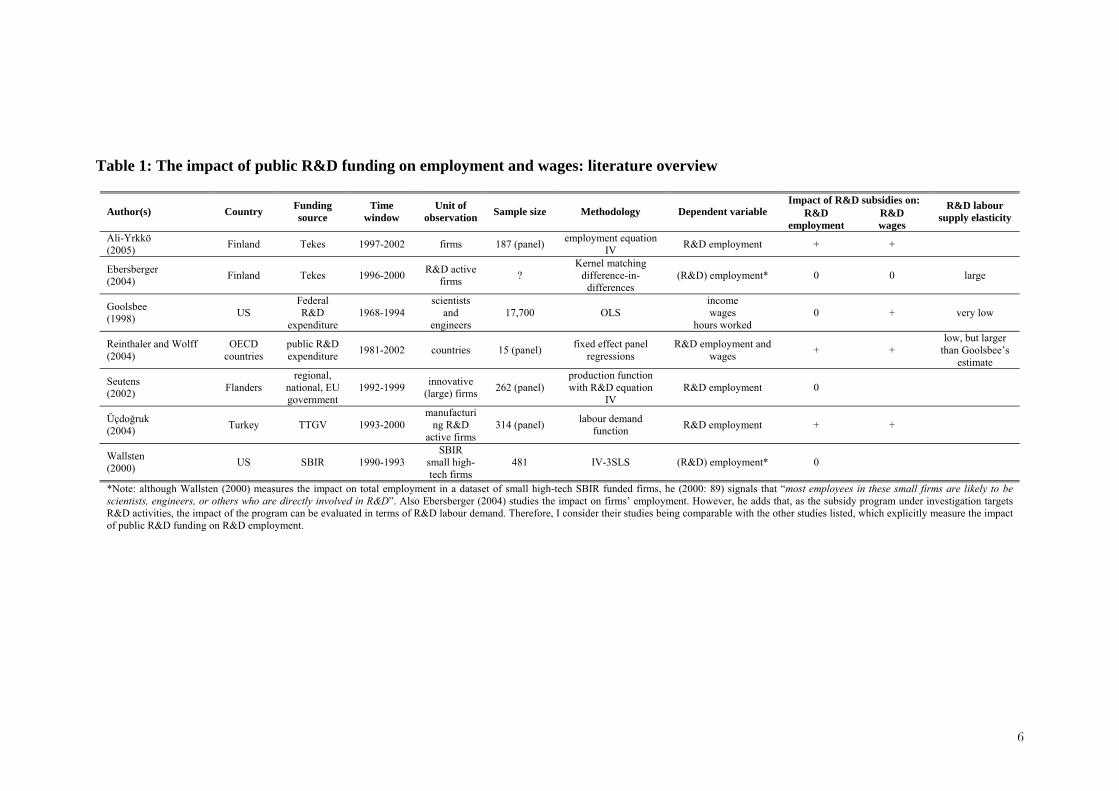
Üçdoğruk, 2004 and Ali-Yrkkö, 2005). An overview of the main characteristics of
these articles is presented in Table 1. In the following subsections a synopsis of the
literature on additionality effects on R&D employment as well as R&D wages is
presented and the hypotheses, which will be tested in the empirical part, are derived.
6
Table 1: The impact of public R&D funding on employment and wages: literature overview
Impact of R&D subsidies on: Author(s) Country Funding
source Time
window Unit of
observation Sample size Methodology Dependent variable R&D employment
R&D wages
R&D labour supply elasticity
Ali-Yrkkö (2005) Finland Tekes 1997-2002 firms 187 (panel) employment equation
IV R&D employment + +
Ebersberger (2004) Finland Tekes 1996-2000 R&D active
firms ? Kernel matching
difference-in-differences
(R&D) employment* 0 0 large
Goolsbee (1998) US
Federal R&D
expenditure 1968-1994
scientists and
engineers 17,700 OLS
income wages
hours worked 0 + very low
Reinthaler and Wolff (2004)
OECD countries
public R&D expenditure 1981-2002 countries 15 (panel) fixed effect panel
regressions R&D employment and
wages + + low, but larger
than Goolsbee’s estimate
Seutens (2002) Flanders
regional, national, EU government
1992-1999 innovative (large) firms 262 (panel)
production function with R&D equation
IV R&D employment 0
Üçdoğruk (2004) Turkey TTGV 1993-2000
manufacturing R&D
active firms 314 (panel) labour demand
function R&D employment + +
Wallsten (2000) US SBIR 1990-1993
SBIR small high-tech firms
481 IV-3SLS (R&D) employment* 0
*Note: although Wallsten (2000) measures the impact on total employment in a dataset of small high-tech SBIR funded firms, he (2000: 89) signals that “most employees in these small firms are likely to be scientists, engineers, or others who are directly involved in R&D”. Also Ebersberger (2004) studies the impact on firms’ employment. However, he adds that, as the subsidy program under investigation targets R&D activities, the impact of the program can be evaluated in terms of R&D labour demand. Therefore, I consider their studies being comparable with the other studies listed, which explicitly measure the impact of public R&D funding on R&D employment.
7
2.1. Public R&D funding and R&D employment
Applying fixed effect panel regressions on a panel dataset containing data on
15 OECD countries from 1981 to 2002, Reinthaler and Wolff (2004) estimate
positive additionality effects for R&D investments, as well as a smaller, but still
significant increase in national R&D employment. Goolsbee (1998) investigates
survey data on the income of 17,700 scientists and engineers in the U.S. from 1968
to 1994. He relates the total and federal R&D expenditure to income as well as
wages and hours worked in an OLS framework. The impact of federal R&D
expenditure on the number of hours worked is not significant.
Suetens (2002), Üçdoğruk (2004) and Ali-Yrkkö (2005) all apply a
production function framework, taking information on subsidy receipt into account.
Suetens (2002) uses panel data on Flemish firms observed between 1992 and 1999
to estimate an R&D personnel equation and an output (added value) equation with
instrumental variables and finds that crowding-out effects cannot be rejected
offhand. Üçdoğruk (2004) employs a panel dataset on Turkish R&D active
manufacturing companies, observed between 1993 and 2000. She concludes that
R&D support programs significantly increase the demand for R&D personnel,
especially for researchers holding a graduate degree. However, she does not correct
for the potential endogeneity bias embodied in the relationship between the demand
for R&D personnel and public R&D funding. In his set of Finnish firms, observed
between 1997 and 2002, Ali-Yrkkö (2005) estimates significantly positive effects
on R&D employment.
Wallsten (2000) and Ebersberger (2004) present two studies which are closely
related to this research issue and which are therefore included as well. Wallsten
(2000) evaluates the impact of US SBIR grants to small high-tech firms on their
total employment in an IV approach. Although this funding is not explicitly
intended to support R&D activities, the author signals (Wallsten, 2000: 89) that
“most employees in these small firms are likely to be scientists, engineers, or others
who are directly involved in R&D”. He finds that larger firms are more likely to
receive a grant, but additionality effects on employment cannot be confirmed.
Ebersberger (2004) investigates the impact of two-year grants, allocated in 1996, on
8
the total labour demand in Finnish companies employing matching and difference-
in-differences methods. He claims that, as the subsidy program under investigation
targets R&D activities, the impact of the program can be evaluated in terms of R&D
labour demand. His estimates demonstrate no significant impact. From this review
of research on R&D subsidies and R&D employment, it becomes clear that the
evidence is mixed: both neutral as well as positive effects are found.
Two elements may introduce some dynamics into the subsidy-employment
relationship. First, increased R&D investments due to a subsidy may stimulate
company growth and only in a second phase lead to increased R&D employment.
See e.g. Chennels and Van Reenen (1999) for a survey of studies on the impact of
technological change on employment. Second, as Reinthaler and Wolff (2004)
suggest, technology spillover effects may exist: a subsidy may induce the
development of a new technology, which nevertheless draws heavily on knowledge
incorporated in existing technologies, and may therefore stimulate other firms to
build on that technology. As a result, one could expect that the impact of public
R&D funding is larger in the long than in the short run. Positive long-run effects on
R&D employment are found by Lerner (1999), Ebersberger (2004) as well as
Reinthaler and Wolff (2004).
2.2. Public R&D funding and R&D wages
R&D wages absorb a significant share of the total R&D expenditure (e.g. in
Flanders on average around 67% in Czarnitzki et al., 2006). Therefore, also the cost
of the input factor of R&D personnel, i.e. R&D wages, plays an important role in
additionality research on R&D employment: R&D wages may adversely interact
with Science and Technology policy measures introduced by the government. This
may provide a sound explanation to why the publicly induced increase in R&D
staffing does not keep up with the induced increase in R&D expenditure.
Reinthaler and Wolff (2004) observe a simultaneous increase in national R&D
investment and R&D employment. The increase of the R&D staff is smaller,
though, which brings them to the conclusion that also scientists’ wages experience
an increase. Goolsbee (1998) concludes that increases in R&D expenditure are
mainly allocated to researcher wages and not to research effort. Ebersberger (2004)
9
claims that the Finnish innovation system provides an adequate inflow of
researchers, and that therefore an increase in R&D investments is fully absorbed by
an increase in R&D employment, but he does not put his statement to the test. This
is however done by Ali-Yrkkö (2005), who concludes that R&D subsidies have, in
addition to a positive effect on the number of R&D employees, also a significantly
positive effect on researcher wages. Üçdoğruk (2004) finds indications that in
Turkey, R&D subsidies significantly increase researcher wages. So, although there
is substantial ambiguity concerning the impact of R&D subsidies on R&D
employment, there is consensus on the fact that researcher wages increase when a
company receives an R&D subsidy.
Also few attempts have been made to assess the impact of R&D tax credits on
private R&D wages. Although in this paper, the explicit focus is on direct R&D
funding, the main results are briefly mentioned. Marey and Borghans (2000)
estimate the wage effect of R&D tax incentives in the Netherlands and estimate
average elasticities of R&D wages to the total sectoral R&D expenditure of 0.52 in
the short run and 0.38 in the long run. Lokshin and Mohnen (2008) estimate a short
run elasticity of 0.10 and a long run elasticity of 0.12 in the Netherlands. Haegeland
and Møen (2007) assess the Norwegian R&D tax credit measure and estimate an
elasticity of 0.33.
The latter studies typically conclude that the increase of R&D wages provokes
a significant inflation problem in additionality research: it is criticized that a
substantial part of the subsidised money dissipates, as it perishes into mere R&D
wage increases, without any actual impact on R&D activity. Goolsbee (1998)
estimates that, as a result of R&D wage increases, additionality effects of R&D
subsidies may be overestimated by 30% to 50%. The indirect impact of this wage
increase may be even worse, since an increase in researcher wages may also affect
non-funded firms, as they have to downsize their R&D activity (Goolsbee, 1998 and
Hinloopen, 2004).
Inelastic labour supply
The argument of inflated additionality effects is typically based on the
underlying hypothesis that the supply of R&D personnel is inelastic. An inelastic
labour supply increases the search costs for competent scientists and engineers and
10
strengthens the bargaining power of R&D employees in wage negotiations (Lokshin
and Mohnen, 2008).
Goolsbee (1998) provides evidence that the supply of scientists and engineers
is relatively inelastic. Reinthaler and Wolff (2004) make a stand against a priori
expectations about the elasticity of the R&D labour supply. An elastic supply curve
can be expected when considering the large pool of university graduates available to
R&D companies on the one hand and the number of researchers actually employed
as R&D staff on the other hand. Lundborg (2005) concludes that supply is not a
restrictive variable, as the underutilization of potential R&D employees is
substantial. However, Goolsbee’s findings (1998) on an inelastic labour supply
curve are not unrealistic when R&D is performed by thin on the ground experienced
and highly specialized scientists. Trajtenberg (2000) also claims that shortages of
highly skilled personnel in cutting edge technologies are a pervasive phenomenon in
Israel. By contrast, Ebersberger (2004: 22) rejects the existence of this problem in
Finland, as “the Finnish innovation system has been able to constantly increase the
supply of science and technology graduates”. The reader should bear in mind
however, that Goolsbee (1998) runs his analysis on survey data on the income of
scientists and engineers, including both public and private R&D staff. One could
expect that the researcher supply elasticity is highly dependent on the sector.
Research in universities versus companies may require and/or attract a different
kind of researcher. Reinthaler and Wolff (2004) compute elasticities of the labour
supply in 15 OECD countries. Their estimates are rather low, but significantly
larger than the estimates of Goolsbee (1998). They find an additional explanation
for a potential underestimation of the labour supply elasticity in Goolsbee’s exercise
(1998) in the fact that he uses data from a period exhibiting extraordinary
government intervention. Moreover, the supply elasticity is measured in a different
way: Goolsbee (1998) calculates the increase in the average working time in
reaction to higher wages, while Reinthaler and Wolff (2004) also allow for the
additional employment of R&D workers.
Upskilling process
Nevertheless, Goolsbee’s (1998) pessimism may be alleviated, as R&D wage
increases do not necessarily equate a loss of R&D effort. For example, in a general
11
employment context, Merito et al. (2007) test the impact of public funding and
record positive effects on SME wages on the short (two years) and long term (four
years) and conclude that the simultaneity of increased R&D staffing and higher
wages signals an ‘upskilling’ process: the employment structure is shifted towards
more skilled employees. Katz and Murphy (1992) also found that rapid growth in
the demand of skilled workers appears to be the driving force behind changes in the
wage structure. Translated into an R&D environment, this would render the R&D
effort of an equally large R&D staff more efficient. Moreover, the population of
(potential) R&D employees is not homogeneous. Zucker and Darby (1996: 12709)
state that “scientific breakthroughs are created by, embodied in, and applied
commercially by particular individuals responding to incentives and working in
specific organizations and locations”. As a result, in high-tech firms intellectual
capital of key personnel is far more important than physical assets (Darby et al.,
1999). Therefore, partial or even full crowding-out of additional R&D investments
into higher wages is not necessarily bad: if companies are able to allocate a larger
budget to their human capital, this may strengthen their power in the competition to
attract top researchers.
Determinants of R&D wages
Wage dispersion may originate in employee as well as employer specificities.
Individual worker characteristics, among which gender and age are most important,
determine a significant share of wage dispersion. Also, considerable disparities in
the pay slip are due to differences in the workplace. A large share of the literature
on wages focuses on the positive correlation between company size and wages as
well as the impact of sector affiliation. Larger companies typically write higher pay
slips. Different explanations can be found: higher wages may serve as a
compensation mechanism for a more complex working environment in larger
companies; act as an instrument to increase the workforce’s motivation; or reflect
differences in the composition of the workforce. Heterogeneity in the composition
of the workforce, generating a larger share of skilled workers in the larger firms, can
originate in different capital intensities (skilled workers work in more capital
intensive sectors; larger companies are typically more capital intensive), scale
advantages (employing skilled workers implies a substantial amount of fixed costs),
the hierarchical structure (larger companies are structured more hierarchically,
12
requiring the employment of more managers) and the employees’ seniority (larger
companies can offer more promotion and education possibilities and face a lower
risk of bankruptcy, implying a higher level of seniority and subsequently higher
wages) (Plasman et al., 2008).
Next to size, also sector affiliation is found to drive a significant share of
wage differences (see Plasman et al., 2008). A growing body of the literature
investigates the underlying reasons behind this strong correlation. First, the weight
of wage bargaining differs significantly between the sectors. In some sectors (e.g.
sectors with a large share of small companies), sectoral bargaining is absent and
wages are settled at the company level. Furthermore, some sectoral agreements only
determine minimum wages, as increases in the actual wages are only negotiated at
the company level. Therefore, a strong centralization of the wage bargaining process
reduces wage differences. This argument is strongly linked with the second:
different sectors exhibit different productivity and profit levels (Plasman et al.,
2006). Moreover, differences in the way the profit gains are redistributed in the
company also drive inter-firm wage differences. Rusinek and Rycx (2008) find that,
the more this redistribution occurs on the company level, the larger the wage
differences become. A last argument is the power of unions: they can put pressure
on companies to increase the wages and close sectoral wage gaps.
In this paper we specifically look at R&D wages in the private sector. Typical
factors influencing the general average wage level and dispersion are expected to
play here, too, and interact with the factors explaining R&D activity. First, size
seems to be an important driver of inter-firm2 R&D wage differences: the annual
R&D expenditure per R&D employee increases significantly with firm size
(Czarnitzki et al., 2006). Also sector affiliation interacts with R&D wages. The
annual R&D expenditure per R&D personnel and the share of personnel costs in the
total R&D expenditure vary over the different sectors (Czarnitzki et al., 2006).
Capital intensity is expected to have an impact, as well as the share of highly skilled
employees. Productivity and, more specifically, R&D productivity may be
correlated positively with R&D wages, as well as the level of international
competition, and (foreign) group membership. Last, also the scope of the union’s
2 As only information about the average R&D wage is available, intra-firm R&D wage dispersion can not be investigated. It is beyond the scope of this paper, but remains an interesting and challenging issue for further research.
13
power in the wage bargaining process may generate inter-firm R&D wage
differences.
2.3. Hypotheses
In the empirical part of this paper, I first assess the impact of public R&D
funding on private R&D expenditure. In the next step, the typical testing of the
crowding-out hypothesis in terms of R&D expenditure is extended with respect to
the R&D workforce: if a subsidy stimulates private R&D expenditure, does this
publicly induced increase in R&D expenditure generate additional R&D
employment? In the last step, the wage structure is analysed with respect to R&D
subsidies.
The literature shows that long term effects may be significantly different from
the effects found in the short run. However, this paper focuses on the short term
effects; potential long term effects are beyond its scope and left for further research.
3. Selectivity issue
This section will explain more in detail the nature of the endogeneity problem,
which may distort estimation results of the relationship between public R&D
funding and R&D activity. Next, I briefly explain the methodology which will be
employed to eliminate the potential bias caused by this selectivity problem.
The outcome variable Y (e.g. R&D expenditure, R&D personnel, etc.) can be
modelled as follows3:
0S1S
if UXβ
USαXβY
==
⎩⎨⎧
+++
= , (1)
where X represents a set of exogenous variables and β their respective parameters. S
refers to the treatment status (S=1: treated; S=0: untreated – treatment is the receipt
of a subsidy in this case) and α measures the impact of this treatment. U is the error
term with zero mean and U is assumed to be uncorrelated with X. However, it is not
unlikely that U is correlated with S: subsidized companies may well be more R&D
active than the non-subsidized companies, even without the subsidy program. R&D
3 I omit firm indices for the sake of readability.
14
intensive firms may be more likely to receive an R&D subsidy as governments aim
at maximizing the probability of success and therefore may well cherry-pick
proposals of companies with considerable R&D expertise. Moreover, it is also quite
possible that only particular companies apply for public R&D grants because they
have an information advantage and are acquainted with policy measures they
qualify for. In an experimental setting, without any selection bias and random
subsidy allocation, U and S are not correlated. This is most likely not the case in
current innovation policy practice, though. This would imply a selection bias in the
estimation of the treatment effect. Therefore, standard econometric approaches,
regressing Y on X and S by OLS, are not valid and other approaches, taking this
potential endogeneity properly into account, should be employed. Econometric
literature has developed a range of methods (see e.g. the surveys of Heckman et al.,
1999; Blundell and Costa Dias, 2000, 2002; Aerts et al., 2007). Examples of these
methods are difference-in-differences estimations, matching, selection models and
instrumental variable (IV) estimations (including simultaneous equation systems). I
will apply the latter two methods in the empirical part. In the following paragraphs
they are very briefly explained.
The subsidy allocation can be modelled by the following selection equation:
VZS += γ* , (2)
where S* is an index, measuring the probability to receive public funding,
depending on a set of company characteristics Z and their respective parameters γ,
as well as an error term V. When S* is positive, the company is granted a subsidy:
. otherwise0 S*if
S>
⎩⎨⎧
=01
(3)
The two-step selection model estimates two equations. A discrete choice
model predicts the probability of being treated (S*) (the selection equation) and the
outcome variable is regressed linearly on the treatment variable, controlling for
observable exogenous characteristics (the outcome equation). Theoretically, the
outcome equation is defined through the nonlinearity of the hazard parameter (also
labelled as the inverse Mills ratio). However, in practice, most observations are
located within the quasi-linear range of the hazard parameter (Puhani, 2000). Hence,
to identify the treatment effect, an exclusion restriction is imposed. This requires the
15
existence of at least one variable, which is insignificant in the outcome equation, but
at the same time significant in the selection equation. This regressor should not be
correlated with the error term V of the selection equation. The selection model
directly controls for the part of the error term U which is correlated with S. It is
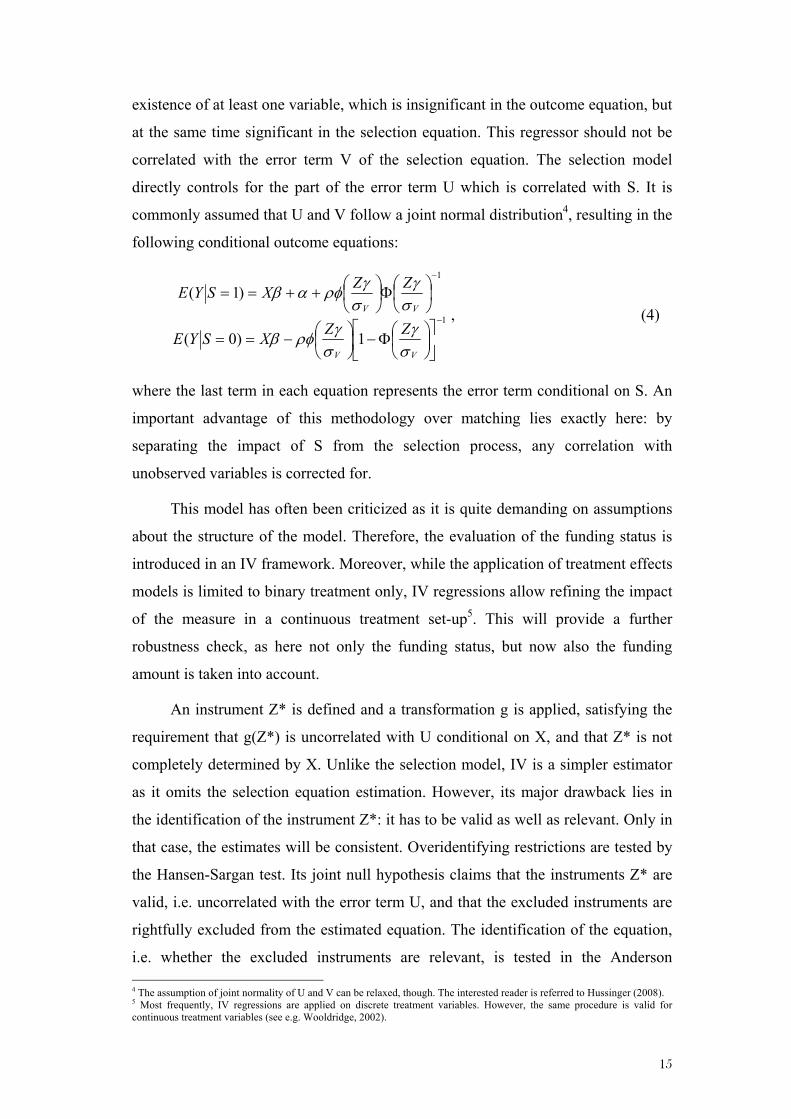
commonly assumed that U and V follow a joint normal distribution4, resulting in the
following conditional outcome equations:
1
1
1)0(
)1(−
−
⎥⎦
⎤⎢⎣
⎡⎟⎠⎞
⎜⎝⎛Φ−⎟
⎠⎞
⎜⎝⎛−==
⎟⎠⎞
⎜⎝⎛Φ⎟
⎠⎞
⎜⎝⎛++==
VV
VV
ZZXSYE
ZZXSYE
σγ
σγρφβ
σγ
σγρφαβ
, (4)
where the last term in each equation represents the error term conditional on S. An
important advantage of this methodology over matching lies exactly here: by
separating the impact of S from the selection process, any correlation with
unobserved variables is corrected for.
This model has often been criticized as it is quite demanding on assumptions
about the structure of the model. Therefore, the evaluation of the funding status is
introduced in an IV framework. Moreover, while the application of treatment effects
models is limited to binary treatment only, IV regressions allow refining the impact
of the measure in a continuous treatment set-up5. This will provide a further
robustness check, as here not only the funding status, but now also the funding
amount is taken into account.
An instrument Z* is defined and a transformation g is applied, satisfying the
requirement that g(Z*) is uncorrelated with U conditional on X, and that Z* is not
completely determined by X. Unlike the selection model, IV is a simpler estimator
as it omits the selection equation estimation. However, its major drawback lies in
the identification of the instrument Z*: it has to be valid as well as relevant. Only in
that case, the estimates will be consistent. Overidentifying restrictions are tested by
the Hansen-Sargan test. Its joint null hypothesis claims that the instruments Z* are
valid, i.e. uncorrelated with the error term U, and that the excluded instruments are
rightfully excluded from the estimated equation. The identification of the equation,
i.e. whether the excluded instruments are relevant, is tested in the Anderson 4 The assumption of joint normality of U and V can be relaxed, though. The interested reader is referred to Hussinger (2008). 5 Most frequently, IV regressions are applied on discrete treatment variables. However, the same procedure is valid for continuous treatment variables (see e.g. Wooldridge, 2002).
16
canonical correlations likelihood-ratio test. Its null hypothesis is that the equation is
underidentified. Consequently, the potential endogeneity is adequately corrected for,
if the Hansen-Sargan test holds and the Anderson canonical correlations likelihood-
ratio test is rejected. Moreover, compliance with the Stable Unit Treatment Value
Assumption (SUTVA) is required: the treatment of one firm should not affect the
treatment effect on another firm (Rubin, 1990). Unfortunately this cannot be tested.
4. The data
This section first sketches the contextual framework. Next, I come to a
description of the data and the variables which are employed in the empirical part.
4.1. Contextual framework
The particularities of public R&D funding and the process of wage settlement
in Flanders are briefly explained.
Public R&D funding in Flanders
In Flanders, IWT, the Institute for the Promotion of Innovation through
Science and Technology in Flanders, is the single counter where companies can
apply for a subsidy. This implies that subsidies, at the Flemish and Belgian level, as
well as certain EU-funded projects6 are evaluated and granted through IWT.
Accelerated depreciation for R&D capital assets and R&D tax allowances are
available through the federal Belgian government. In contrast to most countries, the
Belgian R&D tax allowances are fixed and not granted as a percentage: for each
additional employee employed in scientific research, the company is granted a tax
exemption for a fixed amount, in the year of recruitment. However, as Van
Pottelsberghe et al. (2003) indicate, very few Belgian companies actually make use
of these fiscal measures7. Main reasons are a low level of acquaintance with the
6 The Framework Program projects are not managed through IWT. However, typically the scale of these projects is very large because these projects are often managed in international company consortia. As a result, the number of Flemish firms engaging in these programs is very limited. 7 Due to recent changes in the Science and Technology Policy, this situation has changed, though. In the current system, fiscal measures, and more specifically tax credits for R&D personnel, are becoming increasingly popular. However, this is not relevant in the current paper, as our data was collected before the change.
17
system, complexity and high administration costs8 and the fact that the measures are
not significantly substantial9. Direct R&D funding through IWT remains the largest
source of public R&D grants in the private sector in Flanders10.
Wage settlement in Flanders
In Flanders, wages are typically settled through collective bargaining. This
usually occurs hierarchically, on three levels, which implies that bargaining at lower
levels can only affect wages upwards (Plasman et al., 2007). At the top level, wages
are settled through inter-sectoral agreements at the national level: minimum wages
are fixed, as well as a margin for wage increases. Second, additional sectoral
agreements may be negotiated, setting industry standards (minimum wages by
category of worker) for most of the employees in the industry concerned. Finally, in
a third bargaining round, single-employer agreements may be settled at the firm
level. The bargaining process at the firm level has gained importance over time.
Strong wage increases may reduce the national competitiveness and hence also
reduce employment rates. Therefore, the government froze the private-sector wages
several times; e.g. in 1996, a wage standard was introduced, imposing an upper
limit to wage increases, coupled to the wage margins in France, Germany and the
Netherlands. However, international comparisons reveal that labour is still
significantly expensive in Flanders. Nevertheless, wage settlement in Flanders is far
from a centralized and tight system and leaves considerable margin for inter-firm
wage dispersion; Anglo-Saxon countries exhibit higher dispersion rates, while
wages are distributed more equally in the Scandinavian countries (Plasman et al.,
2008).
4.2. Variables
The potential crowding-out effect of R&D subsidies in Flanders is addressed
empirically with data from the biannual Research and Development Survey. This
mainly quantitative survey covers most EU countries with a by and large
8 First, each year the company has to deliver a certificate. Second, the researcher should be full time employed in the research department of the same company to qualify. Third, the tax allowance is nominative, inducing a burden to keep track of all employees who benefited from the measure in the past. 9 First, the amount of the exemption is not sufficiently significant. Second, the definition of highly qualified personnel is too strict, so that only very few employees qualify for the measure. Third, the tax exemption is a short term measure (it only relates to the first year of recruitment) while R&D typically is a long term process. 10 The interested reader is referred to Aerts and Czarnitzki (2006) for a detailed overview of the public R&D funding system in Flanders.
18
harmonized questionnaire and the collected data are, among other things, used to
compose the European Innovation Scoreboard (see e.g. PRO INNO EUROPE,
2008). The set-up of the Flemish R&D survey is inventory-based: all potentially
R&D active companies are identified and surveyed. In terms of R&D expenditure,
the collected data cover a sample of companies, which are, in total, responsible for
about 80% of the total R&D expenditure in Flanders (Debackere and Veugelers,
2007). Therefore, the sample is close to the population of all R&D active companies
in Flanders. I pool two consecutive waves, i.e. the 2004 and 2006 R&D surveys11.
The R&D data are supplemented with patent application data from the European
Patent Office since 1978. Balance sheet data from the National Bank of Belgium
(Belfirst) was merged to the dataset to provide financial indicators. Last,
information on the subsidy size and history of each company was added: IWT keeps
track of all subsidy applications and potential subsequent grants.
The receipt of subsidies is denoted by a dummy variable (FUN) indicating
whether the firm received public R&D funding. The amount of subsidies received is
measured by AMT (in million EUR). No distinction is made with respect to the
source which provided the public funding; the impact is an average effect over the
different funding schemes.
The outcome variables reflect a company’s R&D12 activities. First, I test the
impact of an R&D subsidy on R&D expenditure (RDX, in million EUR). As the
distribution of RDX is highly skewed, the R&D expenditure intensity, RDXint
(RDX / turnover * 100) is included as well. Second, I test how the R&D staffing
changes when a subsidy is granted to a company. RDP is the number of R&D
personnel (in full time equivalents, or FTEs). Again, to complete the picture of the
impact of R&D subsidies on R&D activities in spite of the skewed distribution of
R&D activities, R&D personnel intensities are calculated: RDPint (RDP / total
number of employees * 100). The third set of outcome variables disentangles a
company’s R&D expenditure into the share allocated to personnel costs on the one
hand and the share allocated to all other costs (investments and operational costs) on
11 The data collected in the surveys refer to the period 2002-2004 (2004 survey) and 2004-2006 (2006 survey). The funding variables are measured in 2003 and 2005, respectively. To avoid endogeneity problems in the selection equation, the covariates are measured, whenever possible, at the beginning of the reference period. Only R&D active companies are kept for the analysis. 12 R&D is defined in accordance with the Frascati Manual (OECD, 2002: 30): “creative work undertaken on a systematic basis in order to increase the stock of knowledge, including knowledge of man, culture and society, and the use of this stock of knowledge to devise new applications”.
19
the other hand. These variables are normalized by the number of R&D employees.
Hence, RDX_P/RDP reflects the company’s R&D wage structure. RDX_O/RDP
measures the R&D expenditure per R&D employee, leaving out the personnel costs.
These variables will allow us to test whether potential additionality effects on the
R&D expenditure are partially or fully absorbed by an increase in R&D staff wages.
In that case, the effectiveness of the public R&D funding system could be
questioned. The Flemish R&D activities are highly skewed. That is why one should
also consider the logarithmically rescaled values of the measures of R&D activity:
lnRDX and lnRDP; of course, also the amount of funding is rescaled in these
models (lnAMT).
In the literature on additionality assessment of public R&D funding, different
authors have used different sets of exclusion restrictions and instrumental variables.
Busom (2000) introduced selection models in additionality research and used the
age of the company, reflecting its overall experience, as an exclusion restriction.
She argues that more experienced firms are more aware of the value of innovation
and may write better project proposals, both increasing the likelihood of receiving a
subsidy. Kaiser (2004) uses a set of dummies reflecting competition (local, national
or multinational orientation), ownership ((partly) publicly owned) and cooperation
behaviour (external partners or academia involved in new product or process
development). He argues that the firm may not care where the competition comes
from, while governments may want to strengthen the technological competitiveness
of domestic firms in the perspective of foreign competition. Moreover, the explicit
policy aim of the Danish government to foster R&D cooperation may increase the
likelihood that R&D cooperation projects are publicly funded. Ebersberger (2005)
uses the share of R&D employees as exclusion restriction; as he uses a sample of
innovative firms only, funding decisions have no influence on R&D status, but do
influence the intensity of conducting R&D activity. Hussinger (2008) generates an
artificial exclusion construct, including information on the legal form of the
company, foreign ownership and the existence of an own R&D department within
the company. Wallsten (2000) was the first to employ instrumental variable
regressions. His instrument, the budget which is potentially available for a firm in a
certain industry or technological area, has become very popular and was picked up
by several authors (Hyytinen and Toivanen, 2005; Clausen, 2007 and Ali-Yrkkö,
20
2004 and 2005). Ali-Yrkkö (2004) additionally experimented with the amount of
funding the company has applied for in the year of the funding receipt. Aerts and
Czarnitzki (2006) use the number of past project applications. Suetens (2002) and
Gonzáles et al. (2005) introduce the lagged value of the subsidy as instrumental
variable in their regression.
Building on the existing research summarized above, I introduce two new
variables. They are supposed to have an impact on the funding status, but not on the
outcome. In the treatment effects model they serve as excluded explanatory
variables in the outcome regressions, which are significant in the selection equation,
though. In the IV-set-up, they provide a vector of instruments. They are computed
from the company’s subsidy history. AMT/PROJ_past5yrs (in million EUR)
contains the total public R&D funding the company received in the preceding five
years, divided by the number of projects in this period. PROJ/EMP_past5yrs (in
number / FTE) is a count variable, reflecting the total number of project proposals
per employee each company submitted in order to obtain an R&D subsidy in the
preceding five years. These variables seem to be reliable instruments, since they are
highly correlated with a company’s current funding status but at the same time, the
company’s current R&D activity does not influence its subsidy history. To obtain
the right fit in the estimate dimensions, also the logarithmic transformations of these
variables (lnAMT/PROJ_past5yrs and lnPROJ/EMP_past5yrs) were used in the
respective models.
I use several control variables which may affect both the subsidy receipt and
R&D effort. Including the number of employees allows controlling for size effects,
which are empirically often found to explain innovativeness (see e.g. Veugelers and
Cassiman, 1999). Moreover, the Flemish S&T policy puts high value on R&D
activities performed by small and medium sized companies. Therefore, the size
variable is also expected to influence the subsidy receipt. The logarithmic
transformation (lnEMP) is used to avoid potential estimation biases caused by
skewness of the data.
Another important variable is the firms' patent stock (PAT). As I use data
from two cross-sectional datasets, which do not include time-series information, the
patent stock enables us to control for previous (successful) R&D activities.
Obviously, not all innovation efforts lead to patents, which Griliches (1990: 1669)
21
formulated nicely as “not all inventions are patentable, not all inventions are
patented”. Likewise, not all patented innovations result from R&D activities; the
R&D process is only part of a company’s innovative activity13. Moreover, the
propensity to patent may be heterogeneous among firms. However, as data on
previous R&D expenditure are not available, the patent stock is the best
approximation of past innovation activities. I use all patent information in the EPO
database and generate the stock of patents for each firm as the depreciated sum of
all patents filed at the EPO from 1978 until 2001(1997):
ttt PATAPATPAT +−= −1)1( δ , (5)
where PAT is the patent stock of a firm in period t and t-1, respectively, PATA are
the number of patent applications filed at the EPO and δ is a constant depreciation
rate of knowledge which is set to 0.15 as common in the literature (see e.g. Jaffe,
1986; Griliches and Mairesse, 1984). On the one hand, firms that exhibit previous
successful innovation projects indicated by patents, are more likely to receive public
R&D funding, because public authorities may follow the ‘picking-the-winner’
principle in order to minimize the expected failure rates of the innovation projects,
and hence, to maximize the expected benefit for the society. On the other hand, the
patent stock controls for the past average innovative engagement of the firms,
because it is expected that firms that were highly innovative in the past will
continue this strategy. The patents are counted only until 2001(1997), to ensure that
the stock definitely refers to past innovation activities, in order to avoid a
simultaneous equation bias in the regression analysis. The patent stock enters into
the regression as patent stock per employee (PAT/EMP) to reduce the potential
multicollinearity with firm size.
The export quota (EXQU = exports / turnover) measures the degree of
international competition a firm faces. Firms that engage in foreign markets may be
more innovative than others and, hence, would be more likely to apply for subsidies.
Next, variables reflecting the technological and financial quality of the
company may play a significant part in both the subsidy and R&D story. These
characteristics are proxied by capital intensity (CAPint) as the value of fixed assets
13 Innovative activity is defined as “all those scientific, technological, organisational, financial and commercial steps which actually, or are intended to, lead to the implementation of technologically new or improved products or processes” (OECD/Eurostat, 1997: 10).
22
per employee and cash-flow (CASHF) (both in million EUR) respectively. Both
variables are obtained from balance sheet records provided by the National Bank of
Belgium (through the Belfirst database). CASHF is also divided by the number of
employees (CASHF/EMP) to avoid multicollinearity with firm size.
A dummy variable indicating whether a firm belongs to a group (GROUP)
controls for different governance structures. Firms belonging to a group may be
more likely to receive subsidies because they presumably have better access to
information about governmental actions due to their network linkages. In addition to
group membership, FOREIGN indicates whether this group is domestic or foreign-
owned. Foreign affiliates may be more likely to apply for a subsidy in their home
country. Twelve industry dummies (BR) are included to allow for differences
between sectors. On the one hand, some sectors may exhibit a larger R&D intensity.
On the other hand, governments may favour certain sectors in their R&D policy,
which increases the likelihood of receiving subsidies for firms in these industries.
From the theoretical evidence on R&D wages, different factors are derived
which could possibly drive inter-firm dispersion. Most of these are already reflected
in the variables described above. Size (lnEMP) and sector (BR) may determine
R&D wages. Also capital intensity is expected to have an impact. Productivity and
more specifically R&D productivity may be correlated positively with R&D wages.
This productivity is captured by the patent stock (PAT/EMP). Internationally
competing firms may pay higher wages (EXQU). Moreover, also group membership
(GROUP) and foreign ownership (FOREIGN) may play. Besides these variables,
which are also included in the models assessing the impact of public funding on
R&D expenditure and R&D employment, two other variables are defined to refine
the assessment of additionality effects on R&D wages. First, the percentage of
highly skilled employees is included as the share of R&D employees with a doctoral
or university degree (UNI). Second, the impact of the union in the wage bargaining
process may be an influencing factor. This parameter is computed following
Vandenbussche et al. (2001). The idea is to maximise the union’s utility function
LwLwU .),( = , explained by wages w and employment L, with respect to the
wages:
)1(. ββ π −=Ω U Maxw
. (6)
23
The parameter β reflects the bargaining strength of the union, and has a value
between zero, i.e. in the absence of a union: all rents are absorbed by the firm, and
unit value, i.e. with a ‘monopoly union’: the union determines the wages
unilaterally. Wages are modelled according to the following equation:
0
0
1 Lww a π
ββ−
+= , (7)
where the employee’s wage is the sum of his alternative wage wa and a fraction of
the firm’s profit per employee π0/L0. For each sector, an unbalanced firm-level
panel was constructed, containing balance sheet information from the National
Bank of Belgium (Belfirst), covering all Belgian firms in the sector, with non-
missing values for the period 1998-2006. The profit π0/L0 was computed as the
value added minus the labour costs, divided by the number of employees, and
normalized by the consumer price index (obtained from Eurostat, 2008). The
average wage w was generated dividing the total labour costs of the firm by the
number of employees. The alternative wage wa was set to zero14. As this model may
be subject to endogeneity, the regression is instrumented by the profit per employee
in the previous period 01
01 / −− tt Lπ and year dummies. The monetary values were
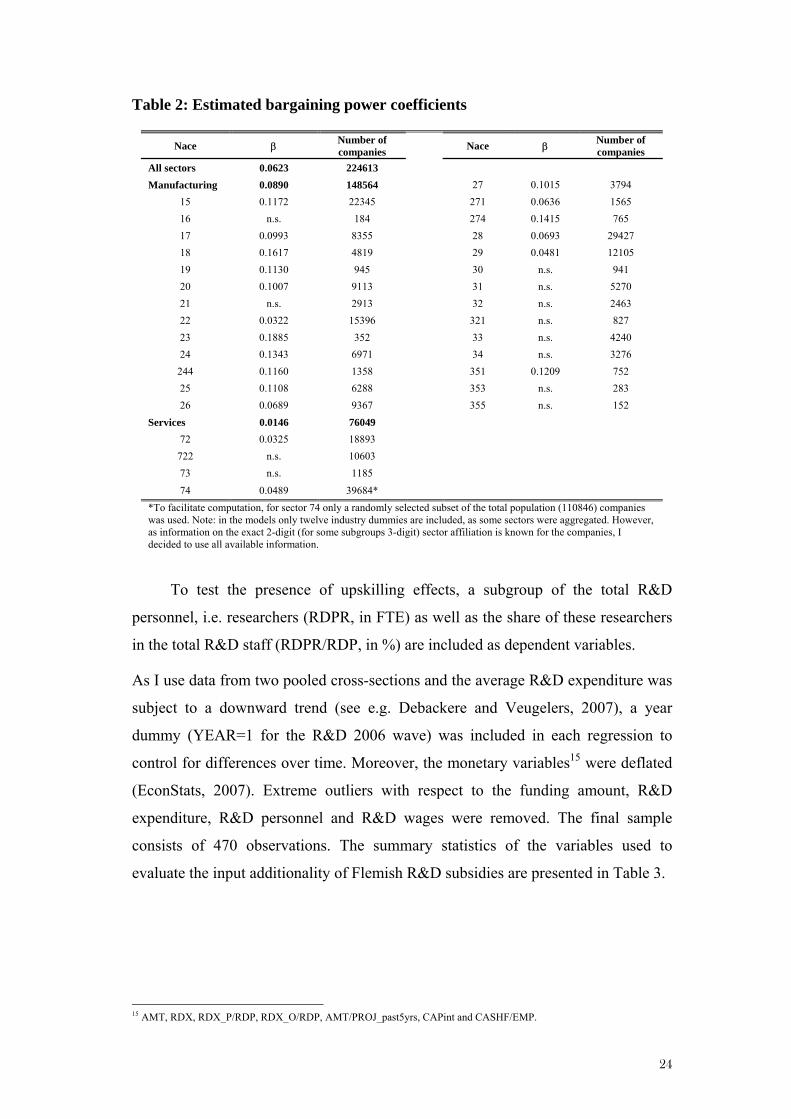
deflated (EconStats, 2007). Table 2 shows the estimated bargaining power
coefficients β for the sectors in the dataset. Parameter β is additionally included in
the equations where the impact of funding on R&D wages is estimated, in the
variable BARG.
14 Vandenbussche et al. (2001) alternatively suggest to set the alternative wage wa at the sectoral minimum wage, but as this did not change their results, I also use a zero value for wa.
24
Table 2: Estimated bargaining power coefficients
Nace β Number of companies Nace β Number of
companies All sectors 0.0623 224613 Manufacturing 0.0890 148564 27 0.1015 3794
15 0.1172 22345 271 0.0636 1565 16 n.s. 184 274 0.1415 765 17 0.0993 8355 28 0.0693 29427 18 0.1617 4819 29 0.0481 12105 19 0.1130 945 30 n.s. 941 20 0.1007 9113 31 n.s. 5270 21 n.s. 2913 32 n.s. 2463 22 0.0322 15396 321 n.s. 827 23 0.1885 352 33 n.s. 4240 24 0.1343 6971 34 n.s. 3276 244 0.1160 1358 351 0.1209 752 25 0.1108 6288 353 n.s. 283 26 0.0689 9367 355 n.s. 152
Services 0.0146 76049 72 0.0325 18893 722 n.s. 10603 73 n.s. 1185 74 0.0489 39684*
*To facilitate computation, for sector 74 only a randomly selected subset of the total population (110846) companies was used. Note: in the models only twelve industry dummies are included, as some sectors were aggregated. However, as information on the exact 2-digit (for some subgroups 3-digit) sector affiliation is known for the companies, I decided to use all available information.
To test the presence of upskilling effects, a subgroup of the total R&D
personnel, i.e. researchers (RDPR, in FTE) as well as the share of these researchers
in the total R&D staff (RDPR/RDP, in %) are included as dependent variables.
As I use data from two pooled cross-sections and the average R&D expenditure was
subject to a downward trend (see e.g. Debackere and Veugelers, 2007), a year
dummy (YEAR=1 for the R&D 2006 wave) was included in each regression to
control for differences over time. Moreover, the monetary variables15 were deflated
(EconStats, 2007). Extreme outliers with respect to the funding amount, R&D
expenditure, R&D personnel and R&D wages were removed. The final sample
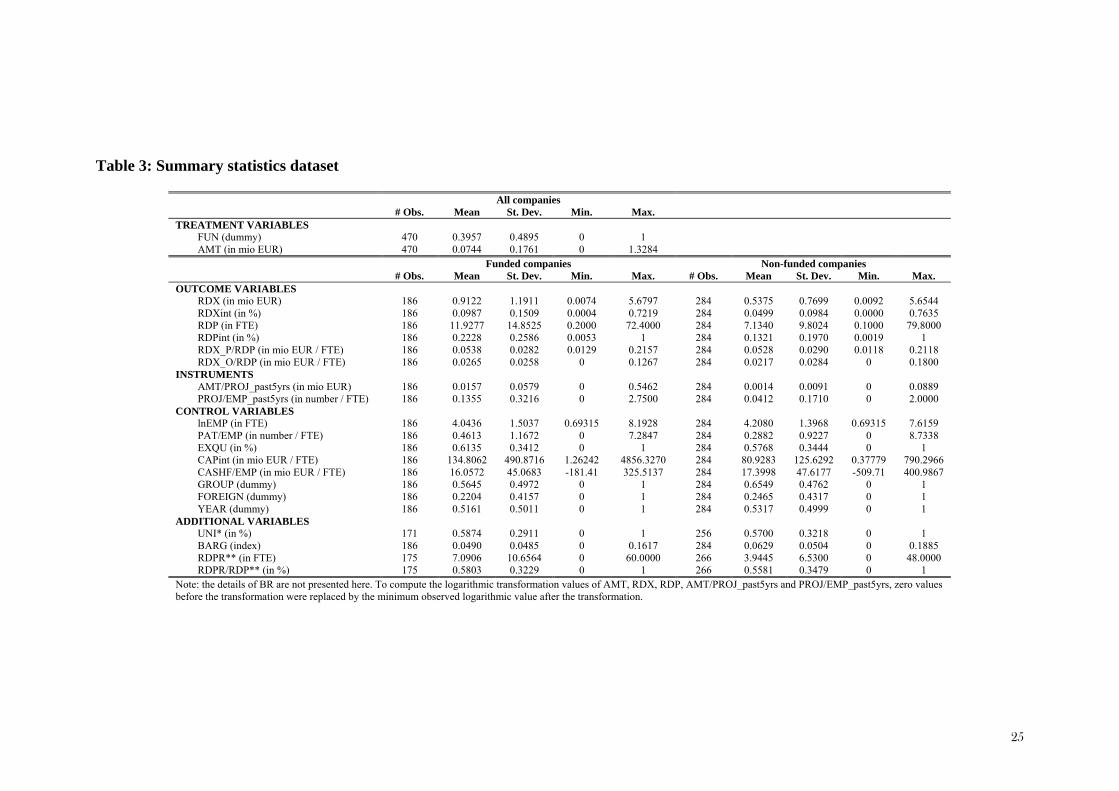
consists of 470 observations. The summary statistics of the variables used to
evaluate the input additionality of Flemish R&D subsidies are presented in Table 3.
15 AMT, RDX, RDX_P/RDP, RDX_O/RDP, AMT/PROJ_past5yrs, CAPint and CASHF/EMP.
25
Table 3: Summary statistics dataset
All companies # Obs. Mean St. Dev. Min. Max. TREATMENT VARIABLES
FUN (dummy) 470 0.3957 0.4895 0 1 AMT (in mio EUR) 470 0.0744 0.1761 0 1.3284
Funded companies Non-funded companies # Obs. Mean St. Dev. Min. Max. # Obs. Mean St. Dev. Min. Max. OUTCOME VARIABLES
RDX (in mio EUR) 186 0.9122 1.1911 0.0074 5.6797 284 0.5375 0.7699 0.0092 5.6544 RDXint (in %) 186 0.0987 0.1509 0.0004 0.7219 284 0.0499 0.0984 0.0000 0.7635 RDP (in FTE) 186 11.9277 14.8525 0.2000 72.4000 284 7.1340 9.8024 0.1000 79.8000 RDPint (in %) 186 0.2228 0.2586 0.0053 1 284 0.1321 0.1970 0.0019 1 RDX_P/RDP (in mio EUR / FTE) 186 0.0538 0.0282 0.0129 0.2157 284 0.0528 0.0290 0.0118 0.2118 RDX_O/RDP (in mio EUR / FTE) 186 0.0265 0.0258 0 0.1267 284 0.0217 0.0284 0 0.1800
INSTRUMENTS AMT/PROJ_past5yrs (in mio EUR) 186 0.0157 0.0579 0 0.5462 284 0.0014 0.0091 0 0.0889 PROJ/EMP_past5yrs (in number / FTE) 186 0.1355 0.3216 0 2.7500 284 0.0412 0.1710 0 2.0000
CONTROL VARIABLES lnEMP (in FTE) 186 4.0436 1.5037 0.69315 8.1928 284 4.2080 1.3968 0.69315 7.6159 PAT/EMP (in number / FTE) 186 0.4613 1.1672 0 7.2847 284 0.2882 0.9227 0 8.7338 EXQU (in %) 186 0.6135 0.3412 0 1 284 0.5768 0.3444 0 1 CAPint (in mio EUR / FTE) 186 134.8062 490.8716 1.26242 4856.3270 284 80.9283 125.6292 0.37779 790.2966 CASHF/EMP (in mio EUR / FTE) 186 16.0572 45.0683 -181.41 325.5137 284 17.3998 47.6177 -509.71 400.9867 GROUP (dummy) 186 0.5645 0.4972 0 1 284 0.6549 0.4762 0 1 FOREIGN (dummy) 186 0.2204 0.4157 0 1 284 0.2465 0.4317 0 1 YEAR (dummy) 186 0.5161 0.5011 0 1 284 0.5317 0.4999 0 1
ADDITIONAL VARIABLES UNI* (in %) 171 0.5874 0.2911 0 1 256 0.5700 0.3218 0 1 BARG (index) 186 0.0490 0.0485 0 0.1617 284 0.0629 0.0504 0 0.1885 RDPR** (in FTE) 175 7.0906 10.6564 0 60.0000 266 3.9445 6.5300 0 48.0000 RDPR/RDP** (in %) 175 0.5803 0.3229 0 1 266 0.5581 0.3479 0 1
Note: the details of BR are not presented here. To compute the logarithmic transformation values of AMT, RDX, RDP, AMT/PROJ_past5yrs and PROJ/EMP_past5yrs, zero values before the transformation were replaced by the minimum observed logarithmic value after the transformation.
26
5. Estimates
This section presents empirical evidence on the impact of R&D subsidies on
R&D expenditure, employment and wages in Flanders. I employ parametric
treatment effects models as well as IV regression models. First, the impact of the
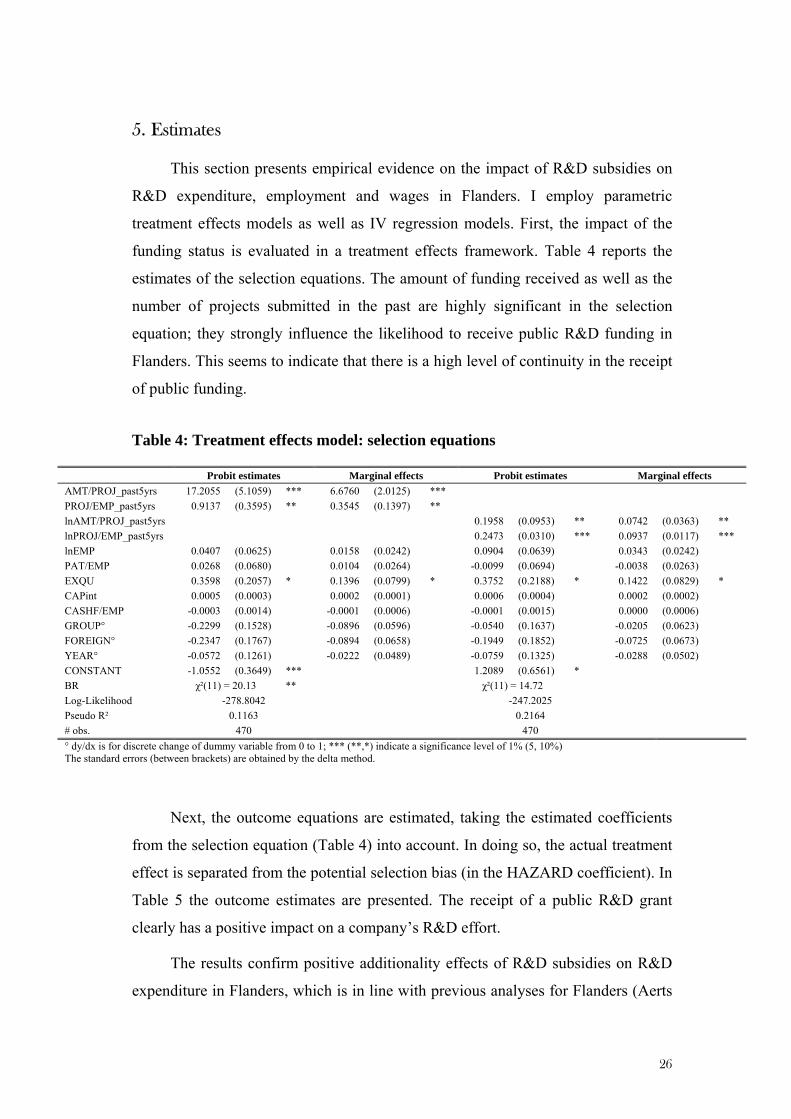
funding status is evaluated in a treatment effects framework. Table 4 reports the
estimates of the selection equations. The amount of funding received as well as the
number of projects submitted in the past are highly significant in the selection
equation; they strongly influence the likelihood to receive public R&D funding in
Flanders. This seems to indicate that there is a high level of continuity in the receipt
of public funding.
Table 4: Treatment effects model: selection equations
Probit estimates Marginal effects Probit estimates Marginal effects AMT/PROJ_past5yrs 17.2055 (5.1059) *** 6.6760 (2.0125) *** PROJ/EMP_past5yrs 0.9137 (0.3595) ** 0.3545 (0.1397) ** lnAMT/PROJ_past5yrs 0.1958 (0.0953) ** 0.0742 (0.0363) ** lnPROJ/EMP_past5yrs 0.2473 (0.0310) *** 0.0937 (0.0117) *** lnEMP 0.0407 (0.0625) 0.0158 (0.0242) 0.0904 (0.0639) 0.0343 (0.0242) PAT/EMP 0.0268 (0.0680) 0.0104 (0.0264) -0.0099 (0.0694) -0.0038 (0.0263) EXQU 0.3598 (0.2057) * 0.1396 (0.0799) * 0.3752 (0.2188) * 0.1422 (0.0829) * CAPint 0.0005 (0.0003) 0.0002 (0.0001) 0.0006 (0.0004) 0.0002 (0.0002) CASHF/EMP -0.0003 (0.0014) -0.0001 (0.0006) -0.0001 (0.0015) 0.0000 (0.0006) GROUP° -0.2299 (0.1528) -0.0896 (0.0596) -0.0540 (0.1637) -0.0205 (0.0623) FOREIGN° -0.2347 (0.1767) -0.0894 (0.0658) -0.1949 (0.1852) -0.0725 (0.0673) YEAR° -0.0572 (0.1261) -0.0222 (0.0489) -0.0759 (0.1325) -0.0288 (0.0502) CONSTANT -1.0552 (0.3649) *** 1.2089 (0.6561) * BR χ²(11) = 20.13 ** χ²(11) = 14.72 Log-Likelihood -278.8042 -247.2025 Pseudo R² 0.1163 0.2164 # obs. 470 470 ° dy/dx is for discrete change of dummy variable from 0 to 1; *** (**,*) indicate a significance level of 1% (5, 10%) The standard errors (between brackets) are obtained by the delta method.
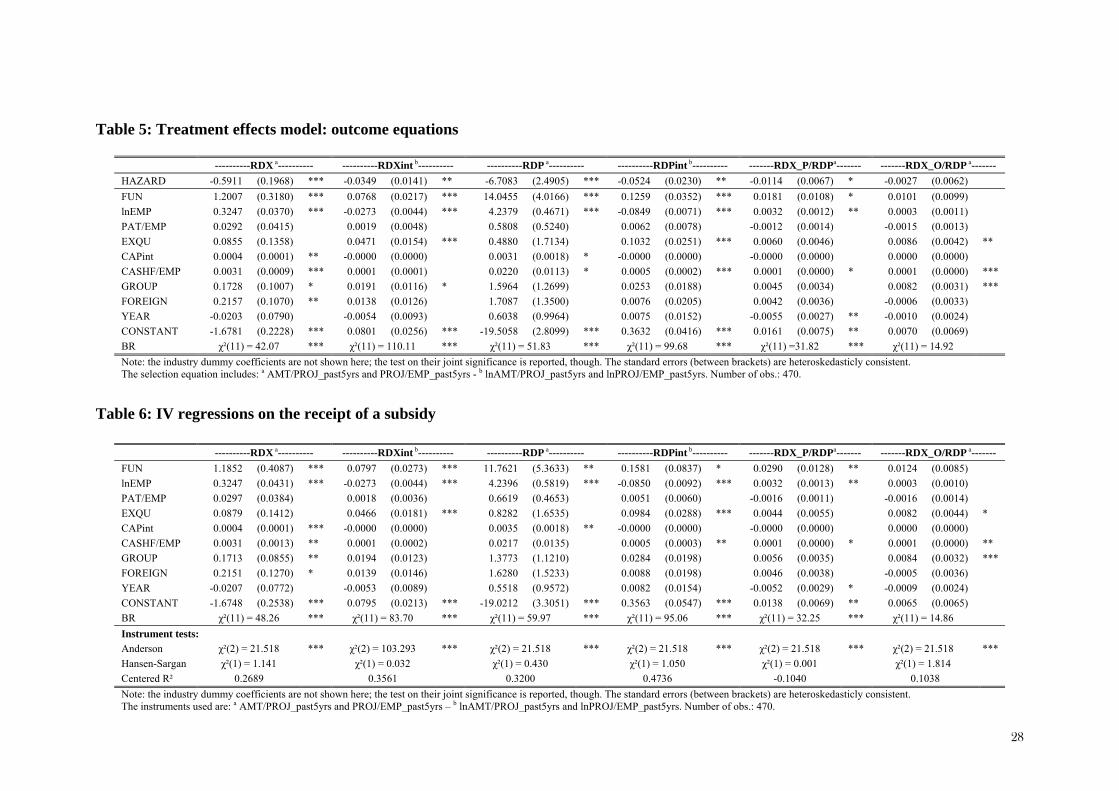
Next, the outcome equations are estimated, taking the estimated coefficients
from the selection equation (Table 4) into account. In doing so, the actual treatment
effect is separated from the potential selection bias (in the HAZARD coefficient). In
Table 5 the outcome estimates are presented. The receipt of a public R&D grant
clearly has a positive impact on a company’s R&D effort.
The results confirm positive additionality effects of R&D subsidies on R&D
expenditure in Flanders, which is in line with previous analyses for Flanders (Aerts
27
and Czarnitzki, 2004 and 2006 as well as Aerts and Schmidt, 2008). Funded
companies spend more (RDX***) on R&D than their non-funded counterparts.
Also, funding is positively correlated with the company’s R&D expenditure
intensity (RDXint***). However, as David and Hall (2000) put forward well-
founded, this significantly positive impact on R&D expenditure may well be fully
absorbed merely by researcher wage increases if the labour supply of R&D staffing
is inelastic. Additional R&D expenditure would then not be translated into more
R&D activity. The current analysis allows completing the additionality picture with
information on the impact of public R&D grants on R&D employment and wages.
First, we look at the impact on R&D staffing. Table 5 shows that similar companies
with an opposite funding status significantly differ in terms of the R&D personnel
they employ: the number of R&D employees (RDP***) as well as R&D personnel
intensity (RDPint***) are significantly higher after the receipt of a subsidy. Hence,
in Flanders, public R&D funding is actually translated into more R&D activity.
These results suggest that the supply of R&D personnel in Flanders is not fully
inelastic: companies are able to attract more R&D personnel when they have a
larger R&D human resources budget at their disposal. This result contrasts with the
findings of Suetens (2002), who could not provide evidence to support positive
additionality effects of R&D subsidies to Flemish companies, evaluating the R&D
staffing employed. This may, however, be due to the fact that the dataset as well as
the analysis framework differ significantly (see David and Hall, 2000). Lastly, we
turn to the potential impact of public R&D funding on a company’s R&D wages
(RDX_P/RDP). The estimates reveal that, in addition to a significantly positive
impact on R&D expenditure and R&D staffing, also the wage structure reacts to an
R&D subsidy: the average personnel cost per R&D employee (RDX_P/RDP*)
increases, while the average operational costs and investments per R&D employee
(RDX_O/RDP) do not change.
28
Table 5: Treatment effects model: outcome equations
Table 6: IV regressions on the receipt of a subsidy
----------RDX a---------- ----------RDXint b---------- ----------RDP a---------- ----------RDPint b---------- -------RDX_P/RDPa------- -------RDX_O/RDP a------- HAZARD -0.5911 (0.1968) *** -0.0349 (0.0141) ** -6.7083 (2.4905) *** -0.0524 (0.0230) ** -0.0114 (0.0067) * -0.0027 (0.0062) FUN 1.2007 (0.3180) *** 0.0768 (0.0217) *** 14.0455 (4.0166) *** 0.1259 (0.0352) *** 0.0181 (0.0108) * 0.0101 (0.0099) lnEMP 0.3247 (0.0370) *** -0.0273 (0.0044) *** 4.2379 (0.4671) *** -0.0849 (0.0071) *** 0.0032 (0.0012) ** 0.0003 (0.0011) PAT/EMP 0.0292 (0.0415) 0.0019 (0.0048) 0.5808 (0.5240) 0.0062 (0.0078) -0.0012 (0.0014) -0.0015 (0.0013) EXQU 0.0855 (0.1358) 0.0471 (0.0154) *** 0.4880 (1.7134) 0.1032 (0.0251) *** 0.0060 (0.0046) 0.0086 (0.0042) ** CAPint 0.0004 (0.0001) ** -0.0000 (0.0000) 0.0031 (0.0018) * -0.0000 (0.0000) -0.0000 (0.0000) 0.0000 (0.0000) CASHF/EMP 0.0031 (0.0009) *** 0.0001 (0.0001) 0.0220 (0.0113) * 0.0005 (0.0002) *** 0.0001 (0.0000) * 0.0001 (0.0000) *** GROUP 0.1728 (0.1007) * 0.0191 (0.0116) * 1.5964 (1.2699) 0.0253 (0.0188) 0.0045 (0.0034) 0.0082 (0.0031) *** FOREIGN 0.2157 (0.1070) ** 0.0138 (0.0126) 1.7087 (1.3500) 0.0076 (0.0205) 0.0042 (0.0036) -0.0006 (0.0033) YEAR -0.0203 (0.0790) -0.0054 (0.0093) 0.6038 (0.9964) 0.0075 (0.0152) -0.0055 (0.0027) ** -0.0010 (0.0024) CONSTANT -1.6781 (0.2228) *** 0.0801 (0.0256) *** -19.5058 (2.8099) *** 0.3632 (0.0416) *** 0.0161 (0.0075) ** 0.0070 (0.0069) BR χ²(11) = 42.07 *** χ²(11) = 110.11 *** χ²(11) = 51.83 *** χ²(11) = 99.68 *** χ²(11) =31.82 *** χ²(11) = 14.92 Note: the industry dummy coefficients are not shown here; the test on their joint significance is reported, though. The standard errors (between brackets) are heteroskedasticly consistent. The selection equation includes: a AMT/PROJ_past5yrs and PROJ/EMP_past5yrs - b lnAMT/PROJ_past5yrs and lnPROJ/EMP_past5yrs. Number of obs.: 470.
----------RDX a---------- ----------RDXint b---------- ----------RDP a---------- ----------RDPint b---------- -------RDX_P/RDPa------- -------RDX_O/RDP a------- FUN 1.1852 (0.4087) *** 0.0797 (0.0273) *** 11.7621 (5.3633) ** 0.1581 (0.0837) * 0.0290 (0.0128) ** 0.0124 (0.0085) lnEMP 0.3247 (0.0431) *** -0.0273 (0.0044) *** 4.2396 (0.5819) *** -0.0850 (0.0092) *** 0.0032 (0.0013) ** 0.0003 (0.0010) PAT/EMP 0.0297 (0.0384) 0.0018 (0.0036) 0.6619 (0.4653) 0.0051 (0.0060) -0.0016 (0.0011) -0.0016 (0.0014) EXQU 0.0879 (0.1412) 0.0466 (0.0181) *** 0.8282 (1.6535) 0.0984 (0.0288) *** 0.0044 (0.0055) 0.0082 (0.0044) * CAPint 0.0004 (0.0001) *** -0.0000 (0.0000) 0.0035 (0.0018) ** -0.0000 (0.0000) -0.0000 (0.0000) 0.0000 (0.0000) CASHF/EMP 0.0031 (0.0013) ** 0.0001 (0.0002) 0.0217 (0.0135) 0.0005 (0.0003) ** 0.0001 (0.0000) * 0.0001 (0.0000) ** GROUP 0.1713 (0.0855) ** 0.0194 (0.0123) 1.3773 (1.1210) 0.0284 (0.0198) 0.0056 (0.0035) 0.0084 (0.0032) *** FOREIGN 0.2151 (0.1270) * 0.0139 (0.0146) 1.6280 (1.5233) 0.0088 (0.0198) 0.0046 (0.0038) -0.0005 (0.0036) YEAR -0.0207 (0.0772) -0.0053 (0.0089) 0.5518 (0.9572) 0.0082 (0.0154) -0.0052 (0.0029) * -0.0009 (0.0024) CONSTANT -1.6748 (0.2538) *** 0.0795 (0.0213) *** -19.0212 (3.3051) *** 0.3563 (0.0547) *** 0.0138 (0.0069) ** 0.0065 (0.0065) BR χ²(11) = 48.26 *** χ²(11) = 83.70 *** χ²(11) = 59.97 *** χ²(11) = 95.06 *** χ²(11) = 32.25 *** χ²(11) = 14.86 Instrument tests: Anderson χ²(2) = 21.518 *** χ²(2) = 103.293 *** χ²(2) = 21.518 *** χ²(2) = 21.518 *** χ²(2) = 21.518 *** χ²(2) = 21.518 *** Hansen-Sargan χ²(1) = 1.141 χ²(1) = 0.032 χ²(1) = 0.430 χ²(1) = 1.050 χ²(1) = 0.001 χ²(1) = 1.814 Centered R² 0.2689 0.3561 0.3200 0.4736 -0.1040 0.1038 Note: the industry dummy coefficients are not shown here; the test on their joint significance is reported, though. The standard errors (between brackets) are heteroskedasticly consistent. The instruments used are: a AMT/PROJ_past5yrs and PROJ/EMP_past5yrs – b lnAMT/PROJ_past5yrs and lnPROJ/EMP_past5yrs. Number of obs.: 470.
29
The parametric treatment effects models reveal that the Flemish R&D policy stimulates
private R&D activity, both in terms of expenditure and employment. In a next step, the
evaluation of the funding status (FUN) is introduced in an IV framework. As discussed
before, both the amount of funding received and the number of projects submitted by the
company in the preceding five years are expected to be reliable instruments in an IV approach
of the additionality issue. Table 6 shows the regression results. The coefficient of FUN is
again highly significant and positive for R&D expenditure, personnel, intensity and wages.
Moreover, the tests on the quality of the instrumental variables confirm that the model
requirements hold. Compared to the treatment effects model, the coefficients are very similar.
In the last step, I extend the analysis of the funding status and take the amount of
funding (AMT) into account. This enables a more profound insight into the nature of the
additionality effects found in the discrete models. These latter models reject full crowding-out
effects. However, it is still possible that funded companies to some extent replace private
money with the public grant. This would mean that a subsidy partially crowds out companies’
private R&D effort.
Again, funding is instrumented with both the amount of funding received and the
number of projects submitted by the company in the preceding five years. The estimates for
different R&D expenditure measures are presented in Table 7. The coefficient of AMT is
highly significant and positive. Moreover, the tests on the quality of the instrumental variables
confirm that the model requirements hold. A subsidy of 1 million EUR increases the average
R&D expenditure with 1.793 million EUR. The Flemish R&D activities are highly skewed,
however. That is why one should also consider lnRDX and RDXint. The coefficients of the
log-log specification can be interpreted as elasticities. Here, the picture looks a little less
attractive: the elasticity of the R&D expenditure merely amounts to 12%.
30
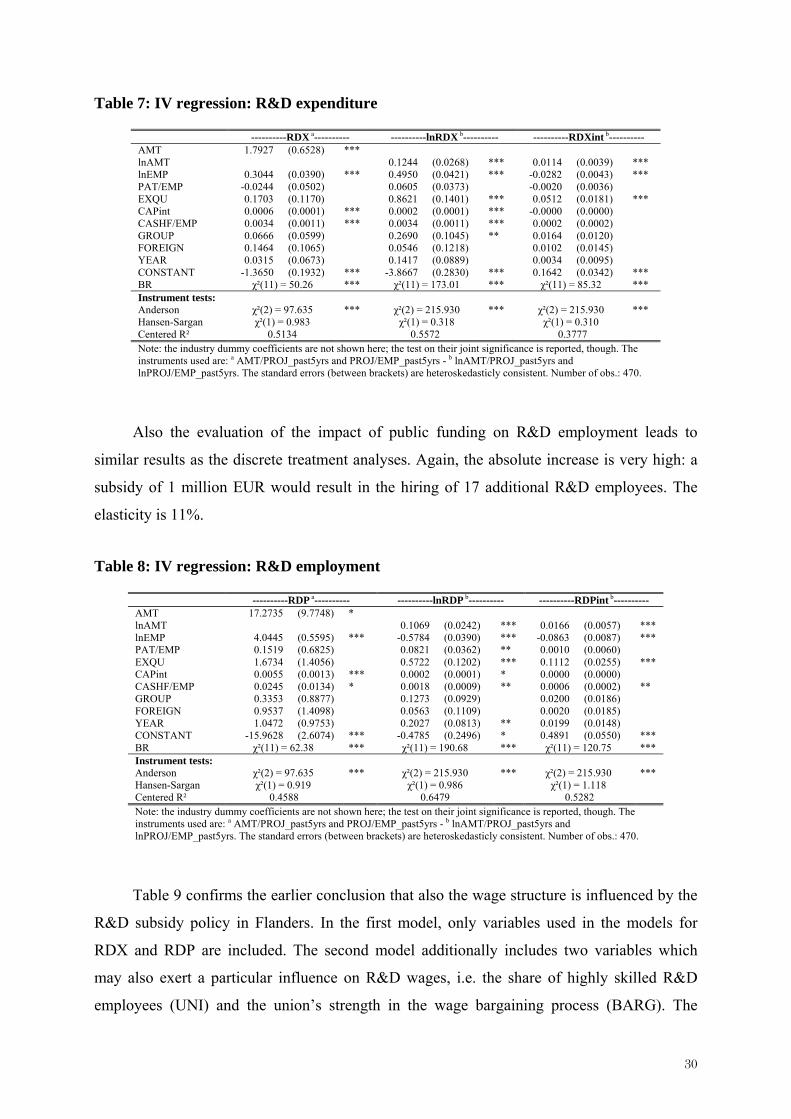
Table 7: IV regression: R&D expenditure
----------RDX a---------- ----------lnRDX b---------- ----------RDXint b---------- AMT 1.7927 (0.6528) *** lnAMT 0.1244 (0.0268) *** 0.0114 (0.0039) *** lnEMP 0.3044 (0.0390) *** 0.4950 (0.0421) *** -0.0282 (0.0043) *** PAT/EMP -0.0244 (0.0502) 0.0605 (0.0373) -0.0020 (0.0036) EXQU 0.1703 (0.1170) 0.8621 (0.1401) *** 0.0512 (0.0181) *** CAPint 0.0006 (0.0001) *** 0.0002 (0.0001) *** -0.0000 (0.0000) CASHF/EMP 0.0034 (0.0011) *** 0.0034 (0.0011) *** 0.0002 (0.0002) GROUP 0.0666 (0.0599) 0.2690 (0.1045) ** 0.0164 (0.0120) FOREIGN 0.1464 (0.1065) 0.0546 (0.1218) 0.0102 (0.0145) YEAR 0.0315 (0.0673) 0.1417 (0.0889) 0.0034 (0.0095) CONSTANT -1.3650 (0.1932) *** -3.8667 (0.2830) *** 0.1642 (0.0342) *** BR χ²(11) = 50.26 *** χ²(11) = 173.01 *** χ²(11) = 85.32 *** Instrument tests: Anderson χ²(2) = 97.635 *** χ²(2) = 215.930 *** χ²(2) = 215.930 *** Hansen-Sargan χ²(1) = 0.983 χ²(1) = 0.318 χ²(1) = 0.310 Centered R² 0.5134 0.5572 0.3777 Note: the industry dummy coefficients are not shown here; the test on their joint significance is reported, though. The instruments used are: a AMT/PROJ_past5yrs and PROJ/EMP_past5yrs - b lnAMT/PROJ_past5yrs and lnPROJ/EMP_past5yrs. The standard errors (between brackets) are heteroskedasticly consistent. Number of obs.: 470.
Also the evaluation of the impact of public funding on R&D employment leads to
similar results as the discrete treatment analyses. Again, the absolute increase is very high: a
subsidy of 1 million EUR would result in the hiring of 17 additional R&D employees. The
elasticity is 11%.
Table 8: IV regression: R&D employment
----------RDP a---------- ----------lnRDP b---------- ----------RDPint b---------- AMT 17.2735 (9.7748) * lnAMT 0.1069 (0.0242) *** 0.0166 (0.0057) *** lnEMP 4.0445 (0.5595) *** -0.5784 (0.0390) *** -0.0863 (0.0087) *** PAT/EMP 0.1519 (0.6825) 0.0821 (0.0362) ** 0.0010 (0.0060) EXQU 1.6734 (1.4056) 0.5722 (0.1202) *** 0.1112 (0.0255) *** CAPint 0.0055 (0.0013) *** 0.0002 (0.0001) * 0.0000 (0.0000) CASHF/EMP 0.0245 (0.0134) * 0.0018 (0.0009) ** 0.0006 (0.0002) ** GROUP 0.3353 (0.8877) 0.1273 (0.0929) 0.0200 (0.0186) FOREIGN 0.9537 (1.4098) 0.0563 (0.1109) 0.0020 (0.0185) YEAR 1.0472 (0.9753) 0.2027 (0.0813) ** 0.0199 (0.0148) CONSTANT -15.9628 (2.6074) *** -0.4785 (0.2496) * 0.4891 (0.0550) *** BR χ²(11) = 62.38 *** χ²(11) = 190.68 *** χ²(11) = 120.75 *** Instrument tests: Anderson χ²(2) = 97.635 *** χ²(2) = 215.930 *** χ²(2) = 215.930 *** Hansen-Sargan χ²(1) = 0.919 χ²(1) = 0.986 χ²(1) = 1.118 Centered R² 0.4588 0.6479 0.5282 Note: the industry dummy coefficients are not shown here; the test on their joint significance is reported, though. The instruments used are: a AMT/PROJ_past5yrs and PROJ/EMP_past5yrs - b lnAMT/PROJ_past5yrs and lnPROJ/EMP_past5yrs. The standard errors (between brackets) are heteroskedasticly consistent. Number of obs.: 470.
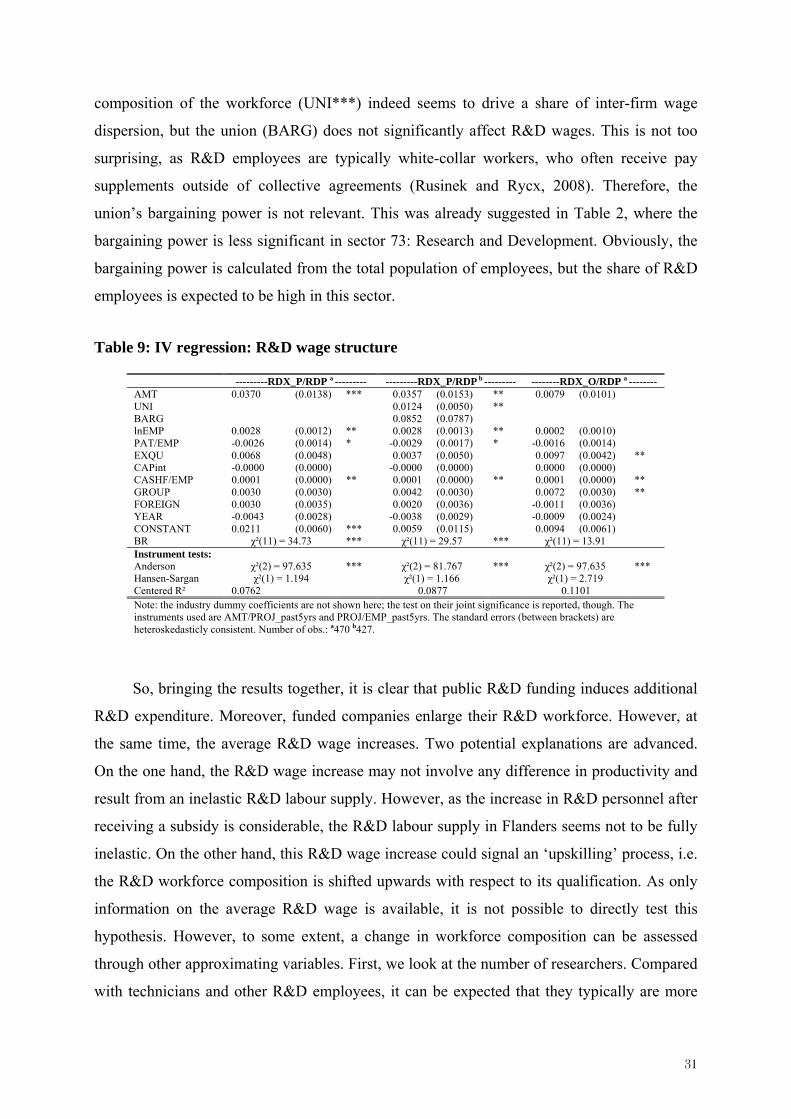
Table 9 confirms the earlier conclusion that also the wage structure is influenced by the
R&D subsidy policy in Flanders. In the first model, only variables used in the models for
RDX and RDP are included. The second model additionally includes two variables which
may also exert a particular influence on R&D wages, i.e. the share of highly skilled R&D
employees (UNI) and the union’s strength in the wage bargaining process (BARG). The
31
composition of the workforce (UNI***) indeed seems to drive a share of inter-firm wage
dispersion, but the union (BARG) does not significantly affect R&D wages. This is not too
surprising, as R&D employees are typically white-collar workers, who often receive pay
supplements outside of collective agreements (Rusinek and Rycx, 2008). Therefore, the
union’s bargaining power is not relevant. This was already suggested in Table 2, where the
bargaining power is less significant in sector 73: Research and Development. Obviously, the
bargaining power is calculated from the total population of employees, but the share of R&D
employees is expected to be high in this sector.
Table 9: IV regression: R&D wage structure
---------RDX_P/RDP a --------- ---------RDX_P/RDP b --------- --------RDX_O/RDP a -------- AMT 0.0370 (0.0138) *** 0.0357 (0.0153) ** 0.0079 (0.0101) UNI 0.0124 (0.0050) ** BARG 0.0852 (0.0787) lnEMP 0.0028 (0.0012) ** 0.0028 (0.0013) ** 0.0002 (0.0010) PAT/EMP -0.0026 (0.0014) * -0.0029 (0.0017) * -0.0016 (0.0014) EXQU 0.0068 (0.0048) 0.0037 (0.0050) 0.0097 (0.0042) ** CAPint -0.0000 (0.0000) -0.0000 (0.0000) 0.0000 (0.0000) CASHF/EMP 0.0001 (0.0000) ** 0.0001 (0.0000) ** 0.0001 (0.0000) ** GROUP 0.0030 (0.0030) 0.0042 (0.0030) 0.0072 (0.0030) ** FOREIGN 0.0030 (0.0035) 0.0020 (0.0036) -0.0011 (0.0036) YEAR -0.0043 (0.0028) -0.0038 (0.0029) -0.0009 (0.0024) CONSTANT 0.0211 (0.0060) *** 0.0059 (0.0115) 0.0094 (0.0061) BR χ²(11) = 34.73 *** χ²(11) = 29.57 *** χ²(11) = 13.91 Instrument tests: Anderson χ²(2) = 97.635 *** χ²(2) = 81.767 *** χ²(2) = 97.635 *** Hansen-Sargan χ²(1) = 1.194 χ²(1) = 1.166 χ²(1) = 2.719 Centered R² 0.0762 0.0877 0.1101 Note: the industry dummy coefficients are not shown here; the test on their joint significance is reported, though. The instruments used are AMT/PROJ_past5yrs and PROJ/EMP_past5yrs. The standard errors (between brackets) are heteroskedasticly consistent. Number of obs.: a470 b427.
So, bringing the results together, it is clear that public R&D funding induces additional
R&D expenditure. Moreover, funded companies enlarge their R&D workforce. However, at
the same time, the average R&D wage increases. Two potential explanations are advanced.
On the one hand, the R&D wage increase may not involve any difference in productivity and
result from an inelastic R&D labour supply. However, as the increase in R&D personnel after
receiving a subsidy is considerable, the R&D labour supply in Flanders seems not to be fully
inelastic. On the other hand, this R&D wage increase could signal an ‘upskilling’ process, i.e.
the R&D workforce composition is shifted upwards with respect to its qualification. As only
information on the average R&D wage is available, it is not possible to directly test this
hypothesis. However, to some extent, a change in workforce composition can be assessed
through other approximating variables. First, we look at the number of researchers. Compared
with technicians and other R&D employees, it can be expected that they typically are more
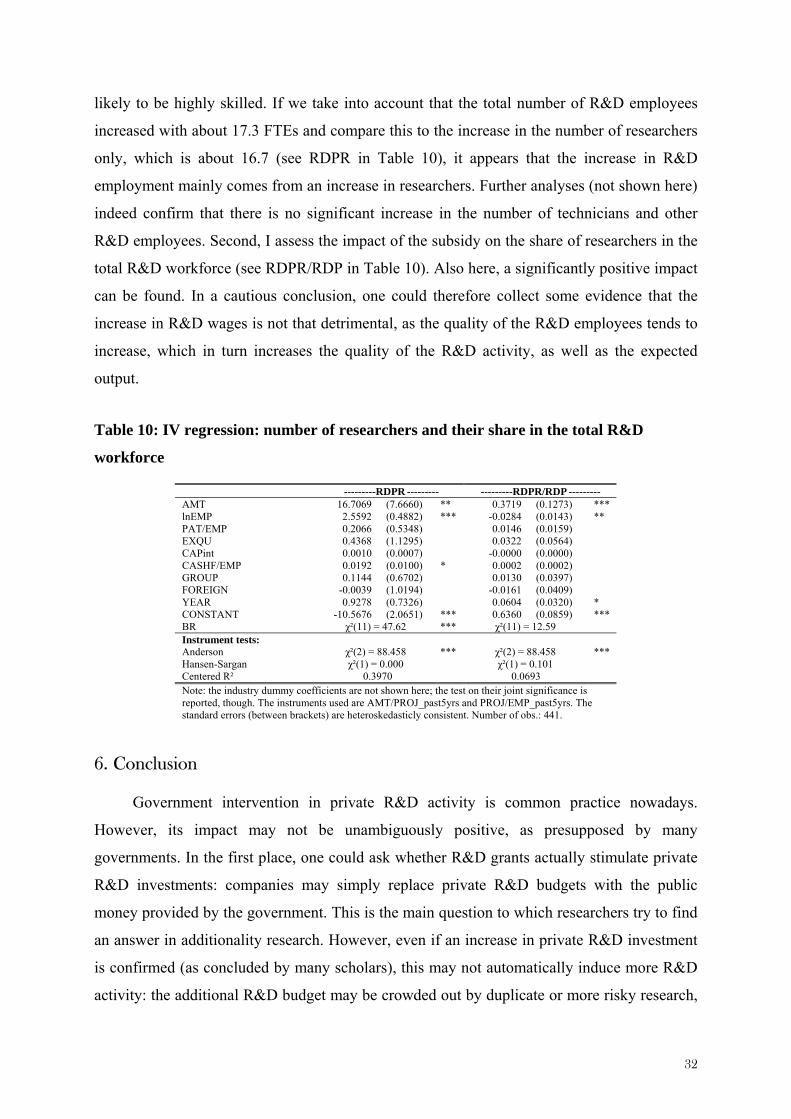
32
likely to be highly skilled. If we take into account that the total number of R&D employees
increased with about 17.3 FTEs and compare this to the increase in the number of researchers
only, which is about 16.7 (see RDPR in Table 10), it appears that the increase in R&D
employment mainly comes from an increase in researchers. Further analyses (not shown here)
indeed confirm that there is no significant increase in the number of technicians and other
R&D employees. Second, I assess the impact of the subsidy on the share of researchers in the
total R&D workforce (see RDPR/RDP in Table 10). Also here, a significantly positive impact
can be found. In a cautious conclusion, one could therefore collect some evidence that the
increase in R&D wages is not that detrimental, as the quality of the R&D employees tends to
increase, which in turn increases the quality of the R&D activity, as well as the expected
output.
Table 10: IV regression: number of researchers and their share in the total R&D
workforce
---------RDPR --------- ---------RDPR/RDP --------- AMT 16.7069 (7.6660) ** 0.3719 (0.1273) *** lnEMP 2.5592 (0.4882) *** -0.0284 (0.0143) ** PAT/EMP 0.2066 (0.5348) 0.0146 (0.0159) EXQU 0.4368 (1.1295) 0.0322 (0.0564) CAPint 0.0010 (0.0007) -0.0000 (0.0000) CASHF/EMP 0.0192 (0.0100) * 0.0002 (0.0002) GROUP 0.1144 (0.6702) 0.0130 (0.0397) FOREIGN -0.0039 (1.0194) -0.0161 (0.0409) YEAR 0.9278 (0.7326) 0.0604 (0.0320) * CONSTANT -10.5676 (2.0651) *** 0.6360 (0.0859) *** BR χ²(11) = 47.62 *** χ²(11) = 12.59 Instrument tests: Anderson χ²(2) = 88.458 *** χ²(2) = 88.458 *** Hansen-Sargan χ²(1) = 0.000 χ²(1) = 0.101 Centered R² 0.3970 0.0693 Note: the industry dummy coefficients are not shown here; the test on their joint significance is reported, though. The instruments used are AMT/PROJ_past5yrs and PROJ/EMP_past5yrs. The standard errors (between brackets) are heteroskedasticly consistent. Number of obs.: 441.
6. Conclusion
Government intervention in private R&D activity is common practice nowadays.
However, its impact may not be unambiguously positive, as presupposed by many
governments. In the first place, one could ask whether R&D grants actually stimulate private
R&D investments: companies may simply replace private R&D budgets with the public
money provided by the government. This is the main question to which researchers try to find
an answer in additionality research. However, even if an increase in private R&D investment
is confirmed (as concluded by many scholars), this may not automatically induce more R&D
activity: the additional R&D budget may be crowded out by duplicate or more risky research,
33
or a mere increase in researcher wages without any impact on the R&D activity of a company
and as a result render an R&D grant, although to the benefit of private R&D expenditure,
ineffective.
This paper provides insights into the impact of R&D grants, giving audience to the
appeal of David and Hall (2000) to include labour market dynamics in the traditional
application of treatment effects models in additionality research. I empirically analyze the
effect of public R&D subsidies on private R&D investments, employment and wages in
Flanders, employing parametric treatment effects models and IV regression methods. The
main data source is the Flemish R&D Survey, supplemented with information from
companies’ balance sheets (National Bank of Belgium), patenting activity (EPO) and subsidy
history (IWT).
Size, previous innovative activity, international competition, group membership, foreign
ownership and industry affiliation may induce a considerable selection bias, rendering the
receipt of a subsidy endogenous. Controlling for this bias with information on the company’s
subsidy history, I conclude that R&D subsidies in Flanders bring about positive additionality
effects, measured in R&D expenditure. Moreover, this public R&D funding is translated into
more R&D activity: funded companies employ more R&D personnel, suggesting that the
supply of R&D personnel in Flanders is not fully inelastic. Full crowding-out effects are
rejected. However, partial crowding-out cannot be ruled out: funded companies do not add the
whole subsidy amount to their private R&D budget. This analysis highlights the importance
of evaluating the effectiveness of the R&D policy in terms of both the funding status and the
grant size. The estimates indicate that, to some extent, the private R&D activity is reduced
and replaced by the subsidy. The results for the impact on R&D expenditure and employment
are very comparable; they change likewise.
However, next to a significantly positive impact on R&D expenditure and R&D
staffing, also an increase in R&D wages is found in firms receiving R&D subsidies. A
mismatch between the demand and supply of R&D employees may enforce an increase in
labour costs for the companies, which translates in increased R&D remuneration. In the
European Innovation Scoreboard (EIS) country reports, the drivers of innovative activity are
assessed at the country level (PRO INNO EUROPE, 2007). Belgium is among the TOP10 in
the EU27. Although it is clear that its performance lags behind in several indicators, and
Belgium’s weak competence in capitalizing the full benefits of above average levels of R&D
and innovation expenditure in terms of innovative output is exposed, the main strength of the
34
Belgian innovation system seems to lie in its strong relative performance on human resources
in innovation. Despite a small shortage of skilled technical staff in specific industries,
especially in the Walloon region, and a considerable outgoing brain drain, which are
denounced in the EIS report, the analysis in this paper shows that the Flemish human
resources in innovation seem to be sufficiently strong to withstand an increase in the demand
for R&D employees and to provide a significantly large supply in response. Conversely, also
an upskilling process could be an underlying explanation for an increase in R&D wages after
the receipt of a subsidy. As the increase in R&D employment is significant and as mainly the
number of researchers is increased after a subsidy receipt, I tend to believe that a change in
the composition of the workforce towards more highly skilled employees is the main force
driving inter-firm R&D wage dispersion between funded and non-funded firms.
In these last paragraphs, I come to some final caveats which the reader should bear in
mind and which give way to further research. First, the restriction to R&D active companies
implies that the additionality effect can only be derived in terms of additional R&D spending.
However, subsidies can be a trigger, pushing companies without any R&D activity to become
R&D active. If these switchers would be taken into account as well, the treatment effects are
very likely to be higher. Second, the literature review implies that the effect of an R&D
subsidy may be very different in the long run. Here, short term effects were investigated.
However, the increase in R&D activity on the short run may induce different effects on the
long run. The impact on the R&D personnel demand may become even larger, when, as one
could expect, the elasticity of labour supply is larger in the long run: more R&D personnel
becomes available as idle R&D educated people switch to R&D jobs and new R&D educated
people become available on the job market. Research on the long term effects would therefore
add much value to the existing studies. Third, a profound analysis of the determinants of R&D
wages is highly relevant. The composition of the workforce was revealed as a very important
factor, while the union’s bargaining power does not seem to play. However, an extension of
the current model, including other potential determinants, seems a promising research field.
Fourth, the variables reflecting the wage structure do not capture other benefits to reward
R&D personnel. Examples are stock options or other fringe benefits. Taking these rewards
additionally into account could refine the analysis currently presented here. However, this
information is very difficult to obtain and highly company-specific. Last, it would be highly
interesting to evaluate the R&D output effects of the increase in R&D activity. Some work
has been done in this respect, using patenting activity (Czarnitzki and Licht, 2006 as well as
35
Schneider, 2008) or the introduction of new products (Aerts, 2008; Hujer and Radić, 2005 as
well as Bérubé and Mohnen, 2007), but the topic deserves further elaboration. Also, the
relationship between researcher wages and innovative performance seems to be a valuable
research domain.
Acknowledgements
The author is indebted to Dirk Czarnitzki for his valuable and highly appreciated
comments. Remarks of Koen Debackere, Kornelius Kraft, Pierre Mohnen and Reinhilde
Veugelers also contributed to the strength of this paper.
References
Aerts, K., 2008. Carrying Flemish coals to Newcastle? R&D subsidies and foreign ownership,
Research Report OR 0803, K.U.Leuven, Faculty of Business and Economics, Leuven.
Aerts, K., Czarnitzki, D., 2004. Using innovation survey data to evaluate R&D policy: The
case of Belgium, ZEW Discussion Paper 04-55, Mannheim. Also appeared as Research
Report OR 0439, K.U.Leuven, Dept. of Applied Economics, Leuven.
Aerts, K., Czarnitzki, D., 2006. The impact of public R&D funding in Flanders, IWT M&A
study 54, Brussels.
Aerts, K., Czarnitzki, D., Fier, A., 2007. Capítulo 3: Evaluación econométrica de las políticas
públicas de I+D: situación actual, 79-104, in: Heijs, J., Buesa, M., (Eds.), La cooperación
en innovación en España y el papel de las ayudas públicas, Instituto de Estudios Fiscales,
Madrid.
Aerts, K., Schmidt, T., 2008. Two for the price of one? On additionality effects of R&D
subsidies: A comparison between Flanders and Germany, Research Policy 37(5), 806–822.
Ali-Yrkkö, J., 2004. Impact of Public R&D Financing on Private R&D – Does Financial
Constraint Matter?, Discussion Paper 943, The Research Institute of the Finnish Economy,
Helsinki.
Ali-Yrkkö, J., 2005, Impact of Public R&D Financing on Employment, Discussion Paper 980,
The Research Institute of the Finnish Economy, Helsinki.
36
Almus, M., Czarnitzki, D., 2003. The Effects of Public R&D Subsidies on Firms' Innovation
Activities: The Case of Eastern Germany, Journal of Business and Economic Statistics
21(2), 226-236.
Arrow, K. J., 1962. Economic Welfare and the Allocations of Resources of Invention, 361-
392, in: Nelson, R.R. (Ed.), The Rate and Direction of Inventive Activity: Economic and
Social Factors, Princeton.
Bérubé, C., Mohnen, P., 2007. Are Firms That Received R&D Subsidies More Innovative?,
UNU-MERIT Working Paper Series 015, Maastricht.
Blundell, R., Costa Dias, M., 2000. Evaluation methods for non-experimental data, Fiscal
Studies 21(4), 427-468.
Blundell, R., Costa Dias, M., 2002. Alternative approaches to evaluation in empirical
microeconomics, Portuguese Economic Journal 1, 1-38.
Busom, I., 2000. An empirical evaluation of the effects of R&D subsidies, Economics of
Innovation and New Technology 9(2), 111-148.
Chennells, J., Van Reenen, J., 1999. Has technology hurt less skilled workers? An
econometric survey of the effects of technical change on the structure of pay and jobs,
Institute of Fiscal Studies, Working Paper 99/27, London.
Clausen, T.H., 2007. Do subsidies have positive impacts on R&D and innovation activities at
the firm level?, Working Paper 20070615, Centre for Technology, Innovation and Culture,
University of Oslo, Oslo.
Coombs, G. and Gomez-Mejia, L.R., 1991. Cross-functional compensation strategies in high
technology firms, Compensation and Benefits Review 23(5), 40-48.
Czarnitzki, D., 2001. Die Auswirkungen der Forschungs- und Technologiepolitik auf die
Innovationsaktivitäten ostdeutscher Unternehmen, Schmollers Jahrbuch - Zeitschrift für
Wirtschafts- und Sozialwissenschaften 121(4), 1-22.
Czarnitzki, D., Fier, A., 2002. Do Innovation Subsidies Crowd Out Private Investment?
Evidence from the German Service Sector, Konjunkturpolitik - Applied Economics
Quarterly 48(1), 1-25.
Czarnitzki, D., Hussinger, K., 2004. The link between R&D subsidies, R&D input and
technological performance, ZEW Discussion Paper 04-56, Mannheim.
37
Czarnitzki, D., Licht, G., 2006. Additionality of public R&D grants in a transition economy:
the case of Eastern Germany, Economics of Transition 14(1), 101-131.
Czarnitzki, D. (Ed.), Aerts, K., Cassiman, B., Hoskens, M., Vanhee, M., Veugelers, R., 2006.
Research, Development and innovation in Flanders 2004, IWT M&A study 55, Brussels.
Darby, M.R., Liu, Q., Zucker, L.G., 1999. Stakes and Stars: The Effect of Intellectual Human
Capital on the Level and Variability of High-Tech Firms’ Market Values, NBER Working
Paper 7201, Cambridge.
Dasgupta, P., Maskin, E., 1987. The Simple Economics of Research Portfolios, The
Economic Journal 97(387), 581-595.
David, P., Hall, B.H., 2000. Heart of Darkness: Modeling Public-Private Funding Interactions
Inside the R&D Black Box, Research Policy 29(9), 1165-1183.
Debackere, K., Veugelers, R., (Eds.), 2007. Vlaams Indicatorenboek 2007 Wetenschap,
Technologie en Innovatie, Steunpunt O&O Indicatoren and Ministerie van de Vlaamse
Gemeenschap, Leuven.
Duguet, E., 2004. Are R&D subsidies a substitute or a complement to privately funded R&D?
Evidence from France using propensity score methods for non experimental data, Revue
d’Economie Politique 114(2), 263-292.
Ebersberger, B., 2004. Labour Demand Effect of Public R&D Funding. VTT Working Papers
9, Technical Research Centre of Finland, Helsinki.
Ebersberger, B., 2005. The Impact of Public R&D Funding, VTT Publications 588, Technical
Research Centre of Finland, Helsinki.
EconStats, 2007. GDP Deflator.
Eurostat, 2004. Innovation in Europe – Results for the EU, Iceland and Norway, Luxembourg.
Eurostat, 2008. Consumer Price Index.
Fier, A., 2002. Staatliche Förderung industrieller Forschung in Deutschland, ZEW
Wirtschaftsanalysen 62, Baden-Baden.
González, X., Pazó, C., 2006. Do public subsidies stimulate private R&D spending?,
Documentos de Traballo 0601, Universidade de Vigo.
González, X., Jaumandreu, J., Pazó, C., 2005. Barriers to innovation and subsidy
effectiveness, RAND Journal of Economics 36(4), 930-950.
38
Goolsbee, A., 1998. Does Government R&D Policy Mainly Benefit Scientists and
Engineers?, American Economic Review 88(2), 298-302.
Görg, H., Strobl, E., 2007. The effect of R&D subsidies on private R&D, Economica 74(294),
215-234.
Griliches, Z., Mairesse, J., 1984. Productivity and R&D at the Firm Level, 339-374, in:
Griliches, Z. (Ed.), R&D, Patents and Productivity, Chicago.
Griliches, Z., 1990. Patent statistics as economic indicators: A survey Journal of Economic
Literature 2(4), 1661-1797.
Haegeland, T., Møen, J., 2007. Input additionality in the Norwegian R&D tax credit scheme,
Statistics Norway, Oslo.
Heckman, J.J., Smith J., Clements, N., 1997. Making the most out of program evaluations and
social experiments: accounting for heterogeneity in program impacts, Review of Economic
Studies 64, 487-536.
Heckman, J.J., Lalonde, R.J., Smith, J.A., 1999. The economics and econometrics of active
labour market programs, 1866-2097, in: Ashenfelter, A., Card, D., (Eds.), Handbook of
labour economics 3, Amsterdam.
Heijs, J., Herrera, L., 2004. The distribution of R&D subsidies and its effect on the final
outcome of innovation policy, Working Paper Instituto de Análisis Industrial y Financiero
46, Madrid.
Hinloopen, J., 2004. The market for business brokers, Journal of Small Business Economics
22(5), 407-415.
Hujer, R., Radić, D., 2005. Evaluating the impacts of subsidies on innovation activities in
Germany, Scottish Journal of Political Economy 52(4), 565-586.
Hussinger, K., 2008. R&D and subsidies at the firm level: an application of parametric and
semi-parametric two-step selection models, Journal of Applied Econometrics 23(6), 729-
747.
Hyytinen, A., Toivanen, O., 2005. Do financial constraints hold back innovation and growth?
Evidence on the role of public policy, Research Policy 34(9), 1385-1403.
Irwin, D.A., Klenow, P.J., 1996. High-tech R&D subsidies: estimating the effects of
Sematech, Journal of International Economics 40(3-4), 323-344.
39
Jaffe, A.B., 1986. Technological Opportunity and Spillovers of R&D: Evidence from Firm's
Patent, Profits, and Market Value, American Economic Review 76 (5), 984-1001.
Kaiser, U., 2004. Private R&D and public R&D subsidies: Microeconometric evidence from
Denmark, CEBR Discussion Paper 2004-19, Denmark.
Katz, L.F., Murphy, K.M., 1992. Changes in Relative Wages, 1963-1987: Supply and
Demand Factors, The quarterly journal of economics 107(1), 35-78.
Lach, S., 2002. Do R&D subsidies stimulate or displace private R&D? Evidence from Israel,
Journal of Industrial Economics 50(4), 369-390.
Lerner, J., 1999. The Government as Venture Capitalist: The Long-Run Impact of the SBIR
Program, Journal of Business 72(3), 285-318.
Lokshin, B., Mohnen, P., 2008. Wage effects of R&D tax incentives: Evidence from the
Netherlands, UNU-MERIT Working Paper 2008-034, UNU-Merit, Maastricht.
Lööf, H., Heshmati, A., 2005. The impact of public funding on private R&D investment. New
evidence from a firm level innovation study, CESIS Working Paper 06, Sweden.
Lundborg, P., 2005. Wage Fairness, Growth and the Utilization of R&D Workers, FIEF
Working Paper Series 206, Sweden.
Maliranta, M., Mohnen, P., Rouvinen, P., 2008. Is Inter-Firm Labour Mobility a Channel of
Knowledge Spillovers? Evidence from a Linked Employer-Employee Panel, UNU-MERIT
Working Paper Series 2008-005, Maastricht.
Mansfield, E., 1985. How rapidly does new industrial technology leak out?, The Journal of
Industrial Economics 34(2), 217-223.
Marey, P., Borghans, L., 2000. Wage elasticities of the supply of R&D workers in the
Netherlands, mimeo, University of Maastricht, Maastricht.
Merito, M., Giannangeli, S., Bonaccorsi, A., 2007. Do Incentives to Industrial R&D Enhance
Research Productivity and Firm Growth? Evidence from the Italian Case, Paper presented
at the workshop “Assessing the impact of State aid to firm”, Bank of Italy, Rome.
Mohnen, P., Palm, F.C., Schim van der Loeff, S., Tiwari, A., 2008. Financial Constraints and
Other Obstacles: Are they a Threat to Innovation Activity?, UNU-MERIT Working Paper
Series 2008-006, Maastricht.
40
OECD, 2002. Proposed Standard Practice for Surveys of Research and Experimental
Development - Frascati Manual, Paris.
OECD/Eurostat, 1997. Proposed Guidelines for Collecting and Interpreting Technological
Innovation Data - Oslo Manual, Paris.
Plasman, R., Rusinek, M., Rycx, F., 2007. Wages and the Bargaining Regime under Multi-
level Bargaining: Belgium, Denmark and Spain, European Journal of Industrial Relations
13(2), 161-80.
Plasman, R., Rusinek, M., Rycx, F., Tojerow, I., 2008. Loonstructuur in België, Dulbea
Discussion Paper 08-04.RR, ULB, Brussels.
Plasman, R., Rycx, F., Tojerow, I., 2006. Industry Wage Differentials, Unobserved Ability
and Rentsharing, Evidence from Matched Worker-firm Data, 1995-2002, National Bank of
Belgium Working Paper 90, NBB, Brussels.
PRO INNO EUROPE, 2007. INNO-Policy TrendChart - Policy Trends and Appraisal Report:
Belgium, Maastricht. Online available at http://www.proinno-
europe.eu/docs/reports/documents/Country_Report_Belgium_2007.pdf.
PRO INNO EUROPE, 2008. European Innovation Scoreboard 2007: Comparative analysis of
innovation performance, Maastricht. Online available at http://www.proinno-
europe.eu/admin/uploaded_documents/European_Innovation_Scoreboard_2007.pdf
Puhani, P.A., 2000. The Heckman correction for sample selection and its critique, Journal of
Economic Surveys 14(1), 53-68.
Reinthaler, V., Wolff, G.B., 2004. The effectiveness of subsidies revisited: accounting for
wage and employment effects in business R&D, ZEI Working Paper B21-2004,
Romer, P.M., 1990. Endogenous Technological Change, Journal of Political Economy 98(5),
71-102.
Romer, P.M., 2000. Should the government subsidize supply or demand in the market for
scientists and engineers?, NBER Working Paper No. W7723, Cambridge.
Rosenberg, N., 1974. Science, Invention and Economic Growth, The Economic Journal
84(333), 90-108.
Rubin, D.B., 1990. Formal mode of statistical inference for causal effects, Journal of
Statistical Planning and Inference 25(3), 279-292.
41
Rusinek, M., Rycx, F., 2008. Rent-Sharing under Different Bargaining Regimes: Evidence
from Linked Employer-Employee Data, IZA Discussion Paper 3406, Institute for the Study
of Labour (IZA), Bonn.
Schneider, C., 2008. Mixed R&D incentives: the effect of R&D subsidies on patented
inventions, Paper presented at the third ZEW Conference on the Economics of Innovation
and Patenting, Mannheim.
Setter, O., Tishler, A., 2005. Investment Policies in Advanced Defence R&D Programs, Tel
Aviv University, Tel Aviv.
Streicher, G., Schibany, A., Gretzmacher, N., 2004. Input additionality effects of R&D
subsidies in Austria, TIP Working Paper, 04-03, Vienna.
Suetens, S., 2002. R&D subsidies and production effects of R&D personnel: evidence from
the Flemish region, CESIT Discussion Paper 2002/03, Antwerp.
Toivanen, O., Niininen, P., 2000. Investment, R&D, subsidies, and credit constraints, Helsinki
School of Economics Working Paper 244, Helsinki.
Trajtenberg, M., 2000. R&D Policy in Israel: An Overview and Reassessment, NBER
Working Paper No. W7930, Cambridge.
Üçdoğruk, Y., 2004. Do Researchers Benefit from R&D Support Programs in Turkey?, Paper
presented at the 10th SMYE Conference, Geneva, Switzerland.
Van Pottelsberghe, B., Nysten, S., Megally, E., 2003. Evaluation of current fiscal incentives
for business R&D in Belgium, Solvay Business School and Service Public Federal de
Programmation Politique Scientifique, Brussels.
Vandenbussche, H., Veugelers, R., Konings, J., 2001. Unionization and European
antidumping protection, Oxford Economic Papers 53, 297-317.
Veugelers, R., Cassiman, B., 1999. Make or buy in innovation strategies: evidence from
Belgian manufacturing firms, Research Policy 28(1), 63–80.
Wallsten, S.J., 2000. The effects of government-industry R&D programs on private R&D: the
case of the Small Business Innovation Research Program, RAND Journal of Economics
31(1), 82-100.
Wooldridge, J.M., 2002. Econometric analysis of cross section and panel data, Massachusetts
Institute of Technology Press, Cambridge/London.

42
Zucker, L.G., Darby, M.R., 1996. Star scientists and institutional transformation: Patterns of
invention and innovation in the formation of the biotechnology industry, Proceedings of
the National Academy of Science USA 93, 12709-12716.