Embed Size (px)
Citation preview
Whole-genome approach implicatesCD44 in cellular resistance to carboplatinSunita J. Shukla,1 Shiwei Duan,2 Xiaolin Wu,2 Judith A. Badner,3 Kristen Kasza4 and M. Eileen Dolan2,5,6*
1Department of Human Genetics, University of Chicago, Chicago, IL 60637, USA2Department of Medicine, University of Chicago, Chicago IL 60637, USA3Department of Psychiatry, University of Chicago, Chicago IL 60637, USA4Department of Health Studies, University of Chicago, Chicago IL 60637, USA5Committee on Cancer Biology, University of Chicago, Chicago IL 60637, USA6Committee on Clinical Pharmacology and Pharmacogenomics, University of Chicago, Chicago IL 60637, USA
*Correspondence to: Tel: þ1 773 702-4441; Fax: þ1 773 702 0963; E-mail: [email protected]
Date received (in revised form): 22nd September, 2008
AbstractCarboplatin is a chemotherapeutic agent used in the management of many cancers, yet treatment is limited by
resistance and toxicities. To achieve a better understanding of the genetic contribution to carboplatin resistance
or toxicities, lymphoblastoid cell lines from 34 large Centre d’Etude du Polymorphisme Humain pedigrees were
utilised to evaluate interindividual variation in carboplatin cytotoxicity. Significant heritability, ranging from
0.17–0.36 (p ¼ 1 � 1027 to 9 � 1024), was found for cell growth inhibition following 72-hour treatment at each
carboplatin concentration (10, 20, 40 and 80 mM) and IC50 (concentration for 50 per cent cell growth inhibition).
Linkage analysis revealed 11 regions with logarithm of odds (LOD) scores greater than 1.5. The highest LOD
score on chromosome 11 (LOD ¼ 3.36, p ¼ 4.2 � 1025) encompasses 65 genes within the 1 LOD confidence
interval for the carboplatin IC50. We further analysed the IC50 phenotype with a linkage-directed association
analysis using 71 unrelated HapMap and Perlegen cell lines and identified 18 single nucleotide polymorphisms
within eight genes that were significantly associated with the carboplatin IC50 (p , 3.6 � 1025; false discovery
rate ,5 per cent). Next, we performed linear regression on the baseline expression and carboplatin IC50 values
of the eight associated genes, which identified the most significant correlation between CD44 expression and
IC50 (r2 ¼ 0.20; p ¼ 6 � 1024). The quantitative real-time polymerase chain reaction further confirmed a
statistically significant difference in CD44 expression levels between carboplatin-resistant and -sensitive cell lines
(p ¼ 5.9 � 1023). Knockdown of CD44 expression through small interfering RNA resulted in increased cellular
sensitivity to carboplatin (p , 0.01). Our whole-genome approach using molecular experiments identified CD44
as being important in conferring cellular resistance to carboplatin.
Keywords: CD44, carboplatin, CEPH, HapMap, expression, linkage
Introduction
The antitumour effects of platinating agents have
contributed significantly to the clinical manage-
ment of a variety of cancers, including ovarian,
head and neck, and non-small cell lung carci-
nomas.1,2 These agents exert their antitumour
activity by binding preferentially to the N-7 pos-
itions of adenine and guanine of DNA, resulting in
the formation of intra- and inter-strand cross-links.1
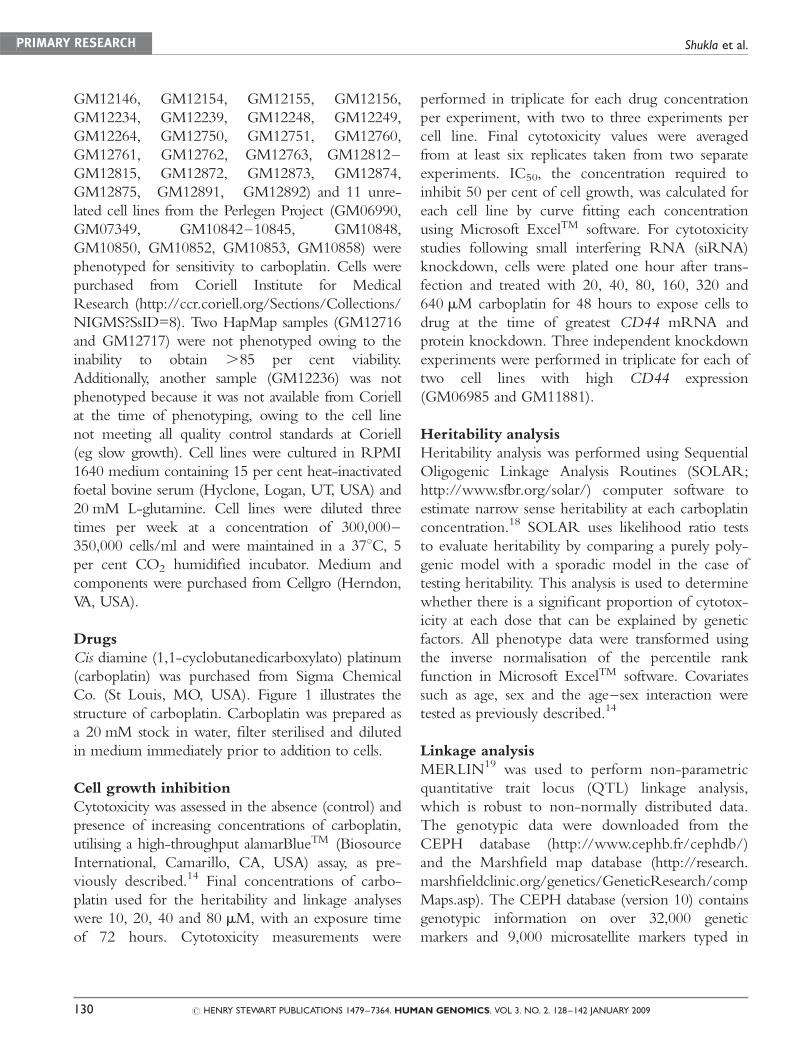
Cisplatin and carboplatin (Figure 1) have similar
mechanisms of action; differences in potency
between the two drugs relate to different aquation
rates. Although cisplatin has had a major clinical
impact, carboplatin, with its more stable leaving
group, was developed as a less toxic analogue that
retained its antitumor activity.2 In 1989, Food and
Drug Administration approval was granted for a
PRIMARY RESEARCH
128 # HENRY STEWART PUBLICATIONS 1479–7364. HUMAN GENOMICS. VOL 3. NO. 2. 128–142 JANUARY 2009
carboplatin-based regimen as the standard of care
for ovarian cancer.2 As seen with cisplatin, intrinsic
and/or acquired resistance, as well as toxicities,
associated with carboplatin are major limitations of
this drug.1,3,4 Carboplatin resistance may be multi-
factorial, consisting of increased efflux from the
cell, drug inactivation, increased DNA repair and
evasion of apoptosis.5,6 Candidate genes that may
be involved in resistance to carboplatin are illus-
trated in the platinum-based pathway on the
PharmGKB website (http://www.pharmgkb.org).
The major dose-limiting toxicity associated with
carboplatin is myelosuppression.7 Specifically, car-
boplatin can cause thrombocytopenia in 20–40 per
cent of patients and severe neutropenia in approxi-
mately 20 per cent of treated patients.8 A few
association studies evaluating single nucleotide
polymorphisms (SNPs) within candidate genes have
been performed with regard to platinum-based
clinical response and outcome. Suk et al.9 found
that the germline C/A or A/A genotype at the
C8092A polymorphism within ERCC1 conferred
a 2.33-fold relative increase in the risk of develop-
ing severe gastrointestinal toxicity. Several studies
have shown that a subset of lung cancer patients
whose tumours do not express ERCC1 are likely
to receive a survival benefit from adjuvant therapy
with a platinum agent, while patients who do
express ERCC1 derive no such benefit.10,11 In
metastatic breast cancer patients, a study identified
an association between polymorphisms in XRCC1
and XRCC3 and survival after receiving treatment
regimens that included carboplatin.12 These find-
ings regarding DNA repair genes emerged as a
result of a candidate gene approach, an approach
that is limited to genes known to be involved in
the mechanism of action of the drug. Drug toxicity
and response are probably multigenic traits,
however, and not all genes that may be important
are included in such studies.
Our laboratory is focused on building cell-based
genetic models to identify genes and variants confer-
ring sensitivity to chemotherapeutic agents.13–17
Using lymphoblastoid cell lines (LCLs) from appar-
ently healthy individuals within large Centre
d’Etude du Polymorphisme Humain (CEPH)
families, we found that chemotherapeutic-induced
cytotoxicity is significantly heritable for cisplatin and
daunorubicin.13,14,17 In the present study, we utilised
large CEPH pedigrees for genome-wide linkage and
unrelated Hapmap and Perlegen LCLs for linkage-
directed association analysis to identify genes and
variants involved in carboplatin-induced cytotoxicity.
The identified genes were further interrogated to
determine whether baseline gene expression corre-
lated with carboplatin IC50. We successfully per-
formed expression knockdown studies of one such
target gene, CD44, whose expression explained a
significant proportion of the variation in carboplatin
IC50. This finding validated the role of CD44 in
carboplatin resistance in these cell lines.
Materials and methods
Cell lines
Four hundred and forty-seven Epstein–Barr virus
(EBV)-transformed LCLs derived from 34
Caucasian Utah CEPH families of northern and
western European descent (1331, 1332, 1333,
1334, 1340, 1341, 1344, 1345, 1346, 1347, 1349,
1350, 1356, 1358, 1362, 1375, 1377, 1408, 1413,
1416, 1418, 1420, 1421, 1423, 1424, 1444, 1447,
1454, 1459, 1463, 13291, 13292, 13293, 13294)
were used for heritability and linkage analyses.
Fifty-seven out of 60 unrelated cell lines (from the
same families) from the HapMap Project
(GM06985, GM06993, GM06994, GM07000,
GM07022, GM07034, GM07055, GM07056,
GM07345, GM07357, GM11829, GM11830,
GM11831, GM11832, GM11839, GM11840,
GM11881, GM11882, GM11992, GM11993,
GM11994, GM11995, GM12003, GM12004,
GM12005, GM12006, GM12043, GM12044,
GM12056, GM12057, GM12144, GM12145,Figure 1. Chemical structure of carboplatin.
Whole-genome approach implicates CD44 in cellular resistance to carboplatin PRIMARY RESEARCH
# HENRY STEWART PUBLICATIONS 1479–7364. HUMAN GENOMICS. VOL 3. NO 2. 128–142 JANUARY 2009 129
GM12146, GM12154, GM12155, GM12156,
GM12234, GM12239, GM12248, GM12249,
GM12264, GM12750, GM12751, GM12760,
GM12761, GM12762, GM12763, GM12812–
GM12815, GM12872, GM12873, GM12874,
GM12875, GM12891, GM12892) and 11 unre-
lated cell lines from the Perlegen Project (GM06990,
GM07349, GM10842–10845, GM10848,
GM10850, GM10852, GM10853, GM10858) were
phenotyped for sensitivity to carboplatin. Cells were
purchased from Coriell Institute for Medical
Research (http://ccr.coriell.org/Sections/Collections/
NIGMS?SsID=8). Two HapMap samples (GM12716
and GM12717) were not phenotyped owing to the
inability to obtain .85 per cent viability.
Additionally, another sample (GM12236) was not
phenotyped because it was not available from Coriell
at the time of phenotyping, owing to the cell line
not meeting all quality control standards at Coriell
(eg slow growth). Cell lines were cultured in RPMI
1640 medium containing 15 per cent heat-inactivated
foetal bovine serum (Hyclone, Logan, UT, USA) and
20 mM L-glutamine. Cell lines were diluted three
times per week at a concentration of 300,000–
350,000 cells/ml and were maintained in a 378C, 5per cent CO2 humidified incubator. Medium and
components were purchased from Cellgro (Herndon,
VA, USA).
Drugs
Cis diamine (1,1-cyclobutanedicarboxylato) platinum
(carboplatin) was purchased from Sigma Chemical
Co. (St Louis, MO, USA). Figure 1 illustrates the
structure of carboplatin. Carboplatin was prepared as
a 20 mM stock in water, filter sterilised and diluted
in medium immediately prior to addition to cells.
Cell growth inhibition
Cytotoxicity was assessed in the absence (control) and
presence of increasing concentrations of carboplatin,
utilising a high-throughput alamarBlueTM (Biosource
International, Camarillo, CA, USA) assay, as pre-
viously described.14 Final concentrations of carbo-
platin used for the heritability and linkage analyses
were 10, 20, 40 and 80 mM, with an exposure time
of 72 hours. Cytotoxicity measurements were
performed in triplicate for each drug concentration
per experiment, with two to three experiments per
cell line. Final cytotoxicity values were averaged
from at least six replicates taken from two separate
experiments. IC50, the concentration required to
inhibit 50 per cent of cell growth, was calculated for
each cell line by curve fitting each concentration
using Microsoft ExcelTM software. For cytotoxicity
studies following small interfering RNA (siRNA)
knockdown, cells were plated one hour after trans-
fection and treated with 20, 40, 80, 160, 320 and
640 mM carboplatin for 48 hours to expose cells to
drug at the time of greatest CD44 mRNA and
protein knockdown. Three independent knockdown
experiments were performed in triplicate for each of
two cell lines with high CD44 expression
(GM06985 and GM11881).
Heritability analysis
Heritability analysis was performed using Sequential
Oligogenic Linkage Analysis Routines (SOLAR;
http://www.sfbr.org/solar/) computer software to
estimate narrow sense heritability at each carboplatin
concentration.18 SOLAR uses likelihood ratio tests
to evaluate heritability by comparing a purely poly-
genic model with a sporadic model in the case of
testing heritability. This analysis is used to determine
whether there is a significant proportion of cytotox-
icity at each dose that can be explained by genetic
factors. All phenotype data were transformed using
the inverse normalisation of the percentile rank
function in Microsoft ExcelTM software. Covariates
such as age, sex and the age–sex interaction were
tested as previously described.14
Linkage analysis
MERLIN19 was used to perform non-parametric
quantitative trait locus (QTL) linkage analysis,
which is robust to non-normally distributed data.
The genotypic data were downloaded from the
CEPH database (http://www.cephb.fr/cephdb/)
and the Marshfield map database (http://research.
marshfieldclinic.org/genetics/GeneticResearch/comp
Maps.asp). The CEPH database (version 10) contains
genotypic information on over 32,000 genetic
markers and 9,000 microsatellite markers typed in
PRIMARY RESEARCH Shukla et al.
130 # HENRY STEWART PUBLICATIONS 1479–7364. HUMAN GENOMICS. VOL 3. NO. 2. 128–142 JANUARY 2009
the CEPH LCLs. Overall, this database manages over
6 million genotypes, which can be utilised for
genetic studies. The Marshfield map database was
used to determine microsatellite locations within par-
ticular chromosomal regions of interest. The genetic
markers were error checked for Mendelian incompat-
ibility, mis-specified relationship and unlikely recom-
binations, using a platform for linkage analysis as
previously described.13,14 The SNP data were down-
loaded from the SNP Consortium (www.snp.cshl.
org). From the combined pool of SNP and microsa-
tellite markers genotyped in the above databases,
approximately 7,209 non-redundant markers were
selected based on the availability of genotypes in at
least 50 per cent of family members. Physical pos-
itions of selected microsatellite and SNP markers
were found using Build 36 of the UCSC Genome
Browser (http://www.genome.ucsc.edu.). Genetic
maps were constructed based on microsatellite and
SNP positions in the Marshfield map. These highly
heterozygous markers, yielding a dense genetic map,
were utilised for the analysis. Age and sex were also
included as covariates in the analysis.
Association analysis
SNP genotypes were downloaded from the
International HapMap Project (http://hapmap.org)
(release 20) and Perlegen (http://perlegen.com) gen-
otype databases for the 68 unrelated CEPH/UTAH
(57 HapMap plus 11 Perlegen) samples. To exclude
possible genotyping errors in overlapping samples
from the HapMap and Perlegen datasets, 23,189
Perlegen SNPs with Mendelian transmission errors
and 13,803 SNPs with inconsistent genotypes were
removed. A total of 277,000 SNPs, located 5 kilo-
bases upstream/downstream of genes, in addition to
within genes, were used for the analysis.
The single-locus analysis was performed using
one-way analysis of variance (ANOVA), with
Bartlett’s test for equal variances cutoff as p ¼ 0.01,
using R-2.3.1. Since multivariate normality of the
phenotypic data is a critical assumption of ANOVA,
the IC50 phenotype was transformed into normal
distributions using log2 transformations. ANOVA
was then performed on unrelated samples to assess
the non-linear relationship among the genotypes.
False discovery rate (FDR) was used to control for
multiple testing within the phenotype using the Q
Value package of R-2.3.1 (www.r-project.com). An
association p value with an FDR of less than 5 per
cent was defined as significant.
Gene expression
Baseline gene expression values for HapMap
CEPH samples were determined as previously
described20 using the Affymetrix GeneChip
Human Exon 1.0 ST array.
Quantitative real-time polymerase chainreaction (qRT-PCR)
Up to 5 � 106 total number of cells from ten LCLs
with the highest carboplatin IC50 values (IC50 range:
91.3–34.7) and ten LCLs with the lowest carboplatin
IC50 values (IC50 range: 10.4–13.3) (out of the 68
unrelated HapMap and Perlegen samples) were eval-
uated for CD44 baseline expression. The LCLs with
the lowest IC50 values were: GM10845, GM10853,
GM12006, GM12043, GM12145, GM12146,
GM12812, GM12813, GM12815 and GM12872.
The LCLs with the highest IC50 values were:
GM06985, GM11830, GM11881, GM12044,
GM12056, GM12751, GM12761 and GM12891.
LCLs in exponential growth were pelleted, washed
three times with ice cold phosphate-buffered saline,
flash frozen in liquid nitrogen, and stored in a freezer
at –80oC until required. Total RNA was isolated
from the cells using the Qiagen RNeasy Mini kit
(Valencia, CA, USA), according to the manufac-
turer’s protocol. Gene expression was quantified with
the Roche LightCycler SYBR Green I kit
(Indianapolis, IN, USA) and samples were run
(one-step PCR) on the 7900 HT Fast Real Time
PCR System from Applied Biosciences (Foster City,
CA, USA). PCR primers were designed and tested
for gene homology using the UCSC Genome
Browser (www.genome.ucsc.edu) and BLAST
(www.ncbi.nlm.nih.gov/BLAST) programs. Primers
were designed to be approximately 20–25 base pairs
in length, have 50–60 per cent GC content and
melting temperatures of 55–658C. CD44 primers
were designed to capture all isoforms with the
forward primer 50-GCATTGCAGTCAACAGTCG
Whole-genome approach implicates CD44 in cellular resistance to carboplatin PRIMARY RESEARCH
# HENRY STEWART PUBLICATIONS 1479–7364. HUMAN GENOMICS. VOL 3. NO 2. 128–142 JANUARY 2009 131
AAGAAG-30 and the reverse primer 50-GGCCTCTCCGTTGAGTCCACTT-30. Lamin A/C
primer sequences included forward primer 50-ATGATCGCTTGGCGGTCTAC-30 and reverse primer
50-GCCCTGCGTTCTCCGTTT-30. Beta-actin was
used as an endogenous control with the forward
primer 50-ATTGCCGACAGGATGCAGA-30 and
reverse primer 50-GCTCAGGAGGAGCAATGAGCTT-30. Standard curves were prepared for all genes,
with fivefold dilutions ranging from 2,000 ng/ml to
0.64 ng/ml. Standard curves were only used if they
had r2 values .0.985. CD44 and beta-actin were run
under identical conditions, with parameters as
follows: Step 1: 558�1,800 seconds; Step 2: 958 �600 seconds; Step 3: 958 � ten seconds, 588 � 15
seconds, 728 � 20 seconds (repeated 45 times).
Lamin A/C primers were run under the following
conditions: Step 1: 558 � 1,800 seconds; Step 2:
958 � 600 seconds; Step 3: 958 � 15 seconds,
608 � 60 seconds, 728 � six seconds (repeated 45
times). Melt curve analysis was performed for each
run. Three separate experiments were run; within
each experiment, samples were run in duplicate.
Student’s t-test was used for comparison of normal-
ised CD44 expression levels between cells with high
and low carboplatin IC50 values.
siRNA knockdown of CD44
LCLs (GM06985 and GM11881) were grown to 7–
9 �105 cells/ml and transfected 24 hours after dilut-
ing with an Amaxa Nucleofector I device, according
to the manufacturer’s recommendations (Amaxa
Biosystems Inc., Gaithersburg, MD, USA). Electrical
parameter X-01 and Nucleofector kit V were used
for the single cuvette transfection process.
Nucleofected cells were immediately transferred into
a flask containing 3 ml medium and then placed in a
humidified incubator at 378C, 5 per cent CO2.
Transfection efficiency, typically between 70 and 80
per cent, was determined by flow cytometry using
fluorescently labelled siGLO siRNA directed against
lamin A/C from Dharmacon (Lafayette, CO, USA).
Transfection efficiency was also assessed by mRNA
knockdown of lamin A/C 24 hours post-transfection
using qRT-PCR conditions as described above.
CD44 On-Targetplus pool siRNA and control
On-Targetplus siCONTROL non-targeting pool
siRNA (Dharmacon) were used. All siRNAs were
used at equal concentrations (600 pmol). Typical
mRNA knockdown of CD44, as compared with
non-targeting control, was assessed after 24 hours.
Western blotting
CD44 protein levels were analysed in total cell extracts
prepared by lysing the cells in RIPA buffer in the pre-
sence of protease inhibitors (Santa Cruz
Biotechnology, Santa Cruz, CA, USA). Protein con-
centrations were analysed at 595 nm using Bio-Rad’s
(Hercules, CA, USA) Bradford protein assay. Since
CD44 is highly expressed in LCLs, 1 mg total protein
was separated on a 4–20 per cent tris-glycine gel
(Bio-Rad) under non-reducing conditions and trans-
ferred to a polyvinylidene difluoride (PVDF) mem-
brane. The membrane was blocked for at least one
hour in 3 per cent milk. Primary CD44 (recognising
the extracellular N-terminal domain) and b-actin anti-
bodies (Abcam, Cambridge, MA, USA) were added
in 1:5,000 dilutions overnight at 48C. Proteins werevisualised using horseradish peroxidase-conjugated sec-
ondary antibodies (1:10,000 dilutions) from Millipore
(St Charles, MO, USA) and ECL plus Western
Blotting Detection Reagent (General Electric
Healthcare, Piscataway, NJ, USA). CD44 protein levels
were measured 48–96 hours after siRNA transfection.
Statistical analysis
IC50 values, from at least three separate knockdown
experiments, were compared using Student’s t-test.
To improve the statistical power, the cellular survi-
val results across the two cell lines (GM06985 and
GM11881) were combined by performing a mixed
model ANOVA, with cell line as a random effect
and dose and experimental condition (CD44
siRNA versus non-targeting group) as fixed effects.
The interaction between dose and experimental
condition was also tested.
Results
Carboplatin-induced cytotoxicity
Lymphoblastoid cell lines derived from 34 large
CEPH pedigrees (447 total cell lines) were evalu-
ated for cell growth inhibition following exposure
PRIMARY RESEARCH Shukla et al.
132 # HENRY STEWART PUBLICATIONS 1479–7364. HUMAN GENOMICS. VOL 3. NO. 2. 128–142 JANUARY 2009
to increasing concentrations of carboplatin for 72
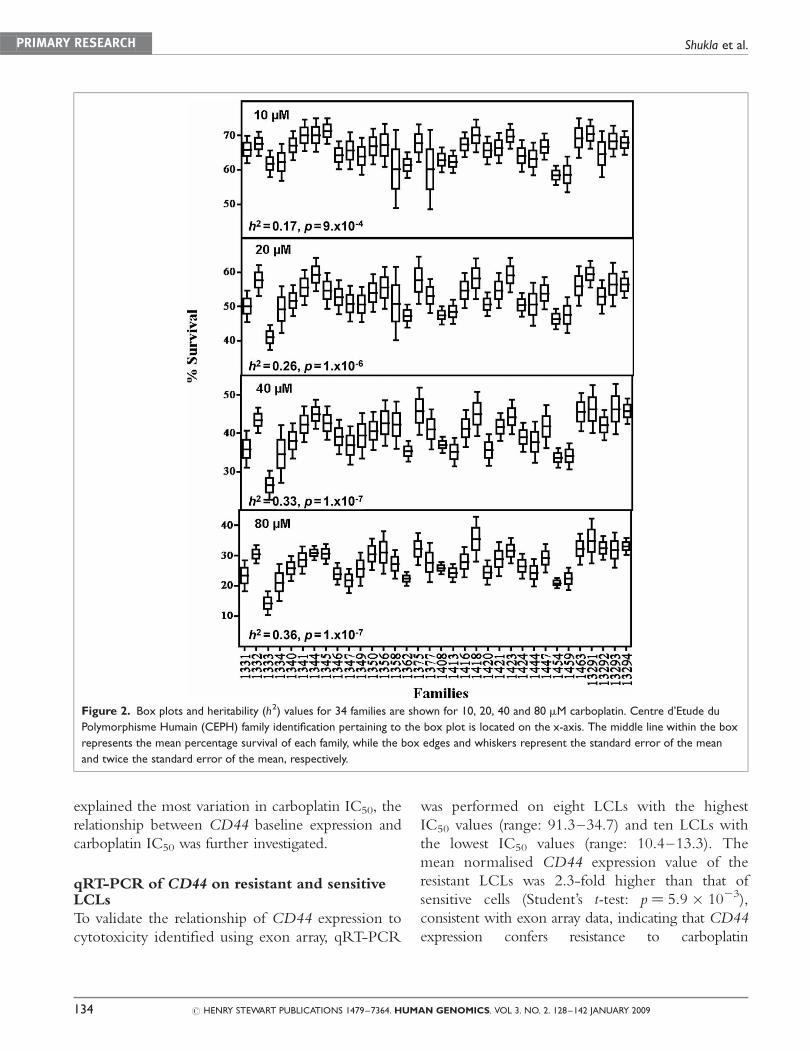
hours. The mean (+SD) percentage cell survival
pertaining to the 10, 20, 40 and 80 mM carboplatin
doses were 65.7+ 8.7, 52.7+ 9.87, 39.8+ 9.59
and 27.1+ 9.17 per cent, respectively. IC50 was
determined for 94 per cent (422/447) of cell lines
because of the requirement to have survival values
above and below 50 per cent. The mean IC50
(+SD) concentration was 25.8+ 13 mM, with a
range of 8.28–91.3 mM. Intra- and interfamily
variations for all of the carboplatin concentrations
are shown in the box plots in Figure 2.
Heritability analysis
Heritability analysis, which compares the covari-
ance of each trait with the overall variance of that
trait, revealed a significant genetic contribution for
the cytotoxic effects of each carboplatin drug con-
centration (Figure 2). Approximately 17–36 per
cent (p ¼ 1 � 1027 to 9 � 1024) of the variation
in carboplatin cytotoxicity was due to genetic
factors, with no sex-specific effects for any of the
phenotypes tested. The heritability for the IC50
phenotype was 0.21 (p ¼ 2.7 � 1025).
Linkage analysis
Non-parametric QTL linkage analysis was performed
on all four carboplatin concentrations, as well as the
IC50 phenotype. There were 11 different genomic
regions (containing 1,212 non-redundant genes)
with LOD scores .1.5 for the different carboplatin
concentrations tested (Table 1, Figure 3). The highest
LOD score of 3.36 was found on chromosome
11q14.3-11q23.3 for the IC50 phenotype, with 151
genes within the 1 LOD confidence interval region.
This region also contained a suggestive linkage peak
corresponding to the 10 mM concentration, with a
LOD score of 1.57. Other overlapping linkage regions
included chromosome 8 for the 20, 40 and 80 mM
concentrations and IC50, with associated LOD scores
of 1.65, 1.61, 2.09 and 1.87, and chromosome 9 for
the 40 and 80 mM concentrations, with associated
LOD scores of 1.58 and 1.59, respectively.
Association analysis
Since the carboplatin IC50 phenotype was associated
with the highest linkage peak (Figure 3), we chose
this phenotype for the next step in our analysis.
There were over 440 genes underneath the suggestive
peaks, with LOD .1.5 for the carboplatin IC50. To
prioritise SNPs within this region, we performed an
ANOVA-based linkage-directed association analysis
on a subset of samples within the pedigrees that had
publicly available dense genotypic data — specifically,
unrelated HapMap and Perlegen samples. This analy-
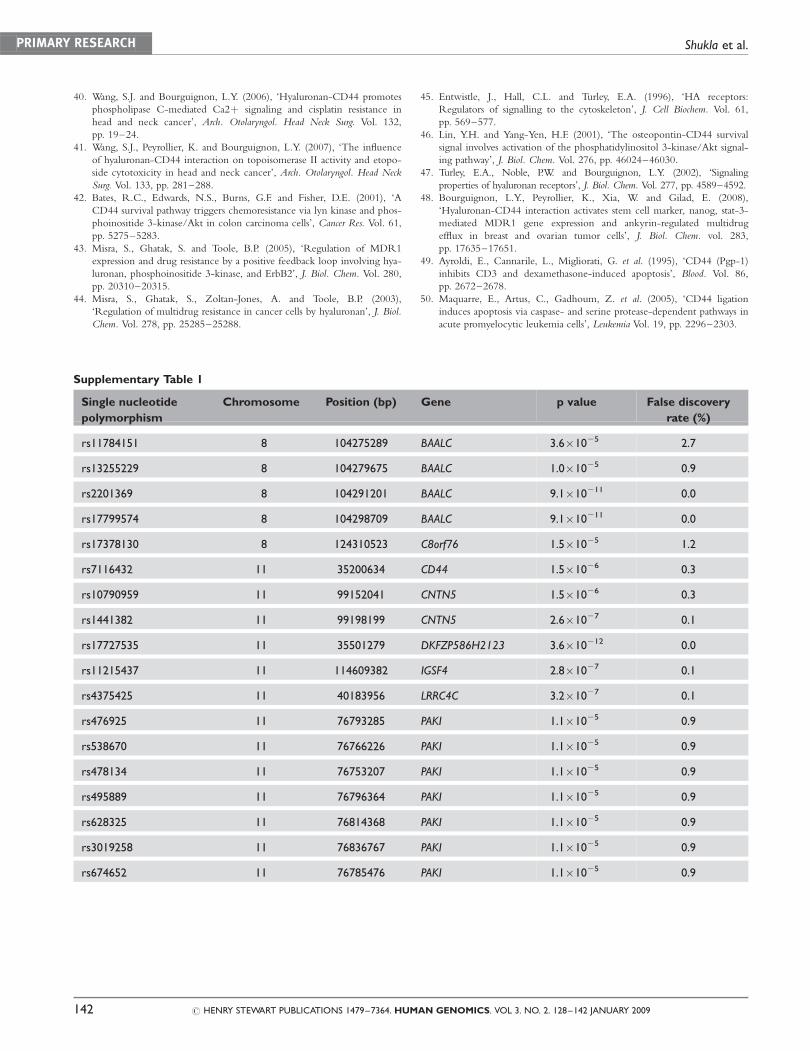
sis resulted in 18 SNPs, corresponding to eight genes
(located on chromosomes 8 and 11) that were
significantly associated with the IC50 phenotype
(Table 1, Supplementary Table 1). The associated
genes were: BAALC, C8orf76, CD44, CNTN5,
DKFZP586H2123, IGSF4, LRRC4C and PAK1.
The highest FDR value for the SNPs contained
within the associated genes was 2.7 per cent
(Supplementary Table 1). Genes belonging to the
biological process of cell adhesion (CD44, CNTN5,
IGSF4), as determined by Entrez Gene (www.
http://www.ncbi.nlm.nih.gov/sites/entrez?db=gene),
were represented as significantly associated with the
carboplatin IC50 and were located underneath the
linkage peak on chromosome 11 (LOD ¼ 2.54).
Baseline gene expression correlation withcarboplatin IC50
To examine the contribution of baseline gene
expression of the eight associated genes to the carbo-
platin IC50, we utilised our previously published
Affymetrix exon array expression data
on the HapMap cell lines.16 BAALC, LRRC4C,
DKFZP586H2123 and CNTN5 were not expressed
at baseline (data not shown). Of the remaining
genes, linear regression was performed using the
log2-transformed expression and IC50 values of the
HapMap unrelated cell lines. The most significant
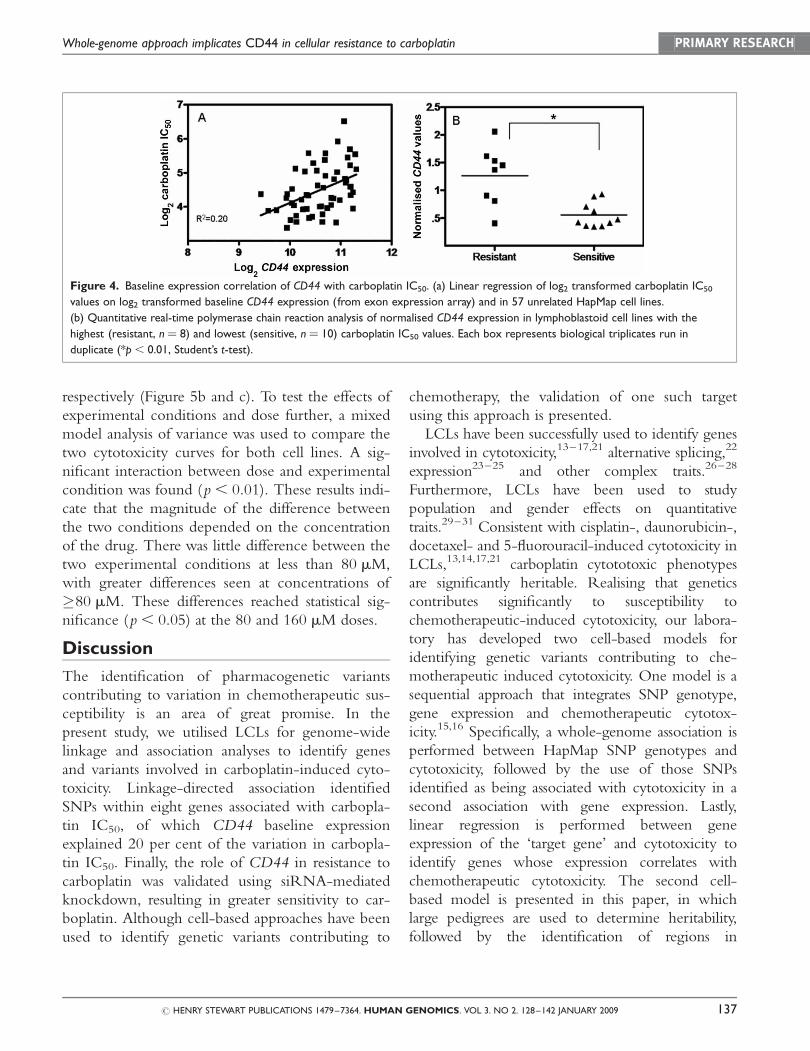
correlation was observed with CD44, in which 20
per cent (p ¼ 6 � 1024) of the variation in carbo-
platin IC50 was explained by CD44 baseline
expression, with higher CD44 expression corre-
sponding to carboplatin resistance (Figure 4a).
Baseline PAK1 expression explained 9 per cent of
the variation in carboplatin IC50 (p ¼ 2 � 1022) but
IGSF4 and C8orf76 baseline expression did not
explain a significant amount of variation in carbo-
platin IC50 (p. 0.05). Since CD44 expression
Whole-genome approach implicates CD44 in cellular resistance to carboplatin PRIMARY RESEARCH
# HENRY STEWART PUBLICATIONS 1479–7364. HUMAN GENOMICS. VOL 3. NO 2. 128–142 JANUARY 2009 133
explained the most variation in carboplatin IC50, the
relationship between CD44 baseline expression and
carboplatin IC50 was further investigated.
qRT-PCR of CD44 on resistant and sensitiveLCLs
To validate the relationship of CD44 expression to
cytotoxicity identified using exon array, qRT-PCR
was performed on eight LCLs with the highest
IC50 values (range: 91.3–34.7) and ten LCLs with
the lowest IC50 values (range: 10.4–13.3). The
mean normalised CD44 expression value of the
resistant LCLs was 2.3-fold higher than that of
sensitive cells (Student’s t-test: p ¼ 5.9 � 1023),
consistent with exon array data, indicating that CD44
expression confers resistance to carboplatin
Figure 2. Box plots and heritability (h2) values for 34 families are shown for 10, 20, 40 and 80 mM carboplatin. Centre d’Etude du
Polymorphisme Humain (CEPH) family identification pertaining to the box plot is located on the x-axis. The middle line within the box
represents the mean percentage survival of each family, while the box edges and whiskers represent the standard error of the mean
and twice the standard error of the mean, respectively.
PRIMARY RESEARCH Shukla et al.
134 # HENRY STEWART PUBLICATIONS 1479–7364. HUMAN GENOMICS. VOL 3. NO. 2. 128–142 JANUARY 2009
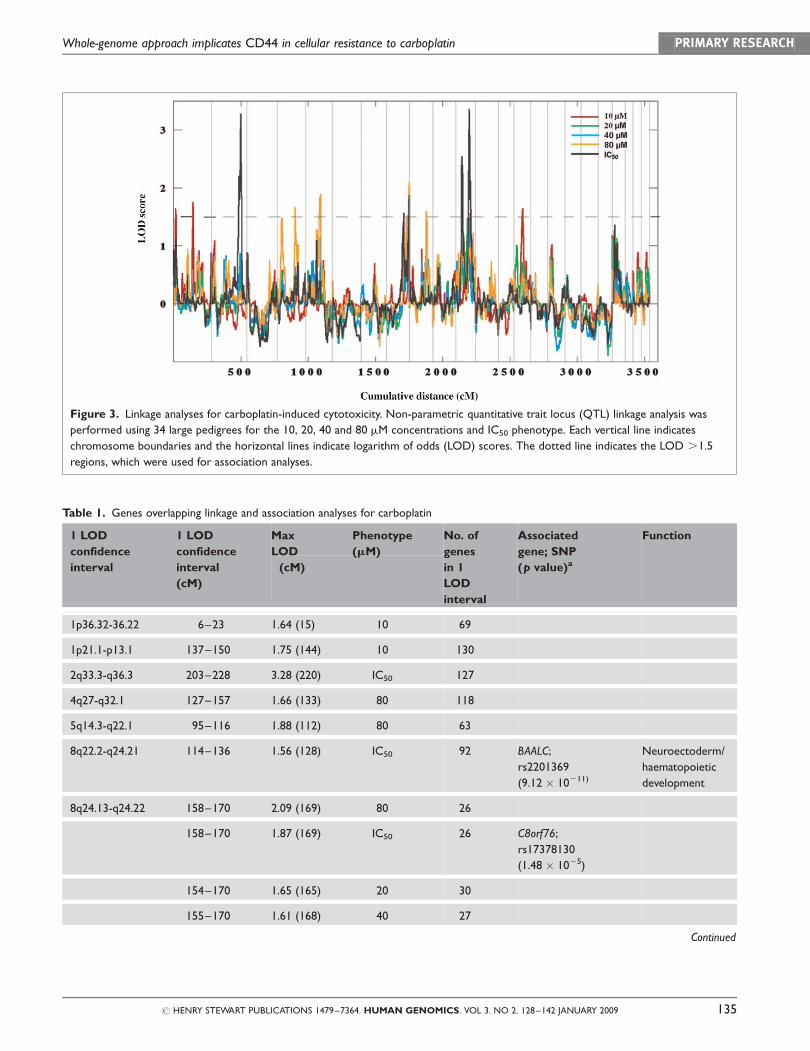
Figure 3. Linkage analyses for carboplatin-induced cytotoxicity. Non-parametric quantitative trait locus (QTL) linkage analysis was
performed using 34 large pedigrees for the 10, 20, 40 and 80 mM concentrations and IC50 phenotype. Each vertical line indicates
chromosome boundaries and the horizontal lines indicate logarithm of odds (LOD) scores. The dotted line indicates the LOD .1.5
regions, which were used for association analyses.
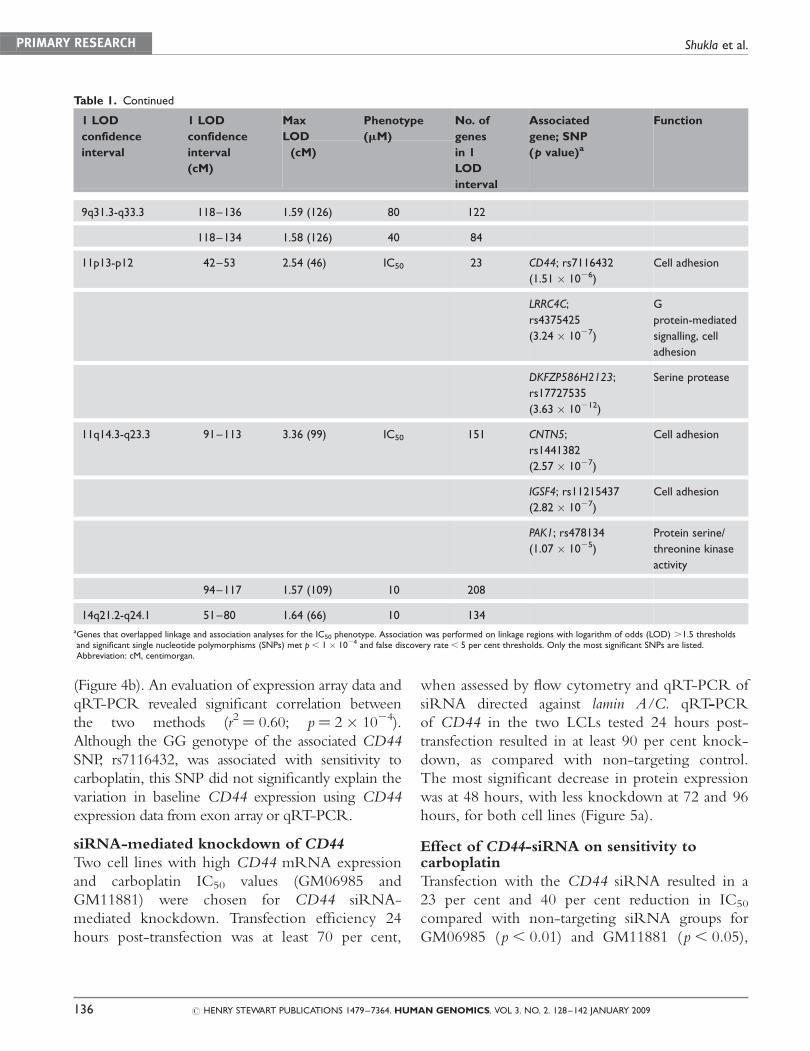
Table 1. Genes overlapping linkage and association analyses for carboplatin
1 LOD
confidence
interval
1 LOD
confidence
interval
(cM)
Max
LOD
Phenotype No. of
genes
in 1
LOD
interval
Associated
gene; SNP
(p value)a
Function
(cM)
(mM)
1p36.32-36.22 6–23 1.64 (15) 10 69
1p21.1-p13.1 137–150 1.75 (144) 10 130
2q33.3-q36.3 203–228 3.28 (220) IC50 127
4q27-q32.1 127–157 1.66 (133) 80 118
5q14.3-q22.1 95–116 1.88 (112) 80 63
8q22.2-q24.21 114–136 1.56 (128) IC50 92 BAALC;
rs2201369
(9.12 � 10211)
Neuroectoderm/
haematopoietic
development
8q24.13-q24.22 158–170 2.09 (169) 80 26
158–170 1.87 (169) IC50 26 C8orf76;
rs17378130
(1.48 � 1025)
154–170 1.65 (165) 20 30
155–170 1.61 (168) 40 27
Continued
Whole-genome approach implicates CD44 in cellular resistance to carboplatin PRIMARY RESEARCH
# HENRY STEWART PUBLICATIONS 1479–7364. HUMAN GENOMICS. VOL 3. NO 2. 128–142 JANUARY 2009 135
(Figure 4b). An evaluation of expression array data and
qRT-PCR revealed significant correlation between
the two methods (r2 ¼ 0.60; p¼ 2 � 1024).
Although the GG genotype of the associated CD44
SNP, rs7116432, was associated with sensitivity to
carboplatin, this SNP did not significantly explain the
variation in baseline CD44 expression using CD44
expression data from exon array or qRT-PCR.
siRNA-mediated knockdown of CD44
Two cell lines with high CD44 mRNA expression
and carboplatin IC50 values (GM06985 and
GM11881) were chosen for CD44 siRNA-
mediated knockdown. Transfection efficiency 24
hours post-transfection was at least 70 per cent,
when assessed by flow cytometry and qRT-PCR of
siRNA directed against lamin A/C. qRT-PCR
of CD44 in the two LCLs tested 24 hours post-
transfection resulted in at least 90 per cent knock-
down, as compared with non-targeting control.
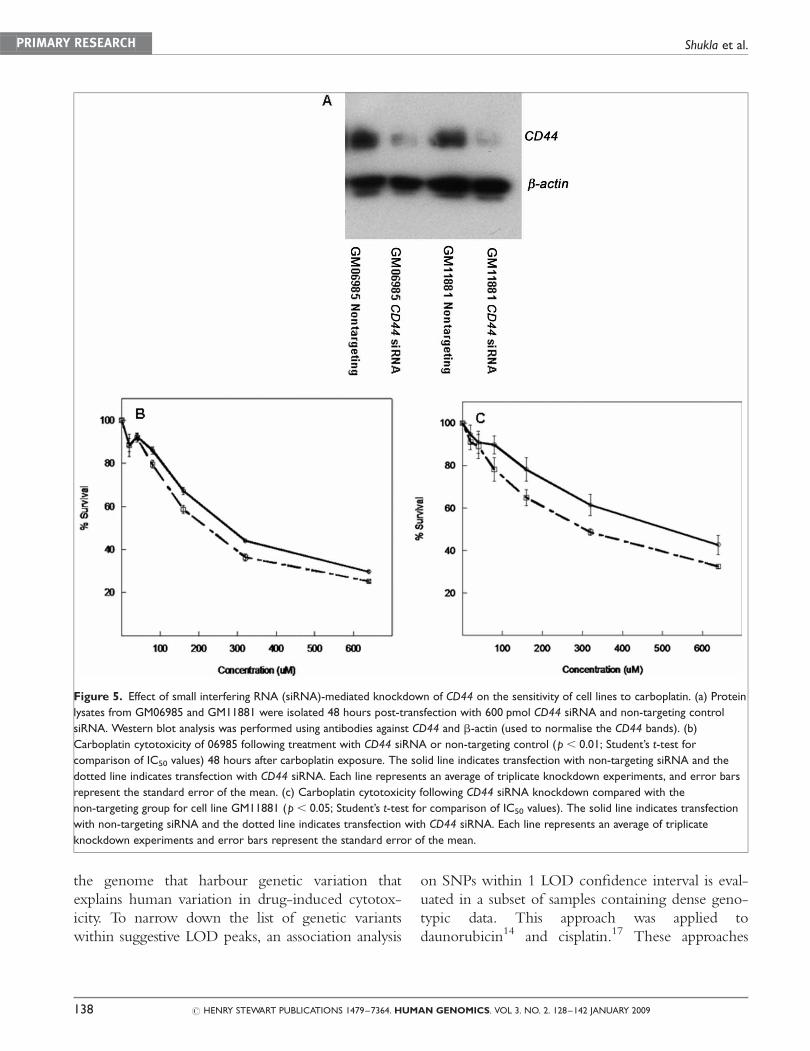
The most significant decrease in protein expression
was at 48 hours, with less knockdown at 72 and 96
hours, for both cell lines (Figure 5a).
Effect of CD44-siRNA on sensitivity tocarboplatin
Transfection with the CD44 siRNA resulted in a
23 per cent and 40 per cent reduction in IC50
compared with non-targeting siRNA groups for
GM06985 (p, 0.01) and GM11881 (p, 0.05),
Table 1. Continued
1 LOD
confidence
interval
1 LOD
confidence
interval
(cM)
Max
LOD
Phenotype No. of
genes
in 1
LOD
interval
Associated
gene; SNP
(p value)a
Function
(cM)
(mM)
9q31.3-q33.3 118–136 1.59 (126) 80 122
118–134 1.58 (126) 40 84
11p13-p12 42–53 2.54 (46) IC50 23 CD44; rs7116432
(1.51 � 1026)
Cell adhesion
LRRC4C;
rs4375425
(3.24 � 1027)
G
protein-mediated
signalling, cell
adhesion
DKFZP586H2123;
rs17727535
(3.63 � 10212)
Serine protease
11q14.3-q23.3 91–113 3.36 (99) IC50 151 CNTN5;
rs1441382
(2.57 � 1027)
Cell adhesion
IGSF4; rs11215437
(2.82 � 1027)
Cell adhesion
PAK1; rs478134
(1.07 � 1025)
Protein serine/
threonine kinase
activity
94–117 1.57 (109) 10 208
14q21.2-q24.1 51–80 1.64 (66) 10 134aGenes that overlapped linkage and association analyses for the IC50 phenotype. Association was performed on linkage regions with logarithm of odds (LOD) .1.5 thresholdsand significant single nucleotide polymorphisms (SNPs) met p, 1 � 1024 and false discovery rate , 5 per cent thresholds. Only the most significant SNPs are listed.Abbreviation: cM, centimorgan.
PRIMARY RESEARCH Shukla et al.
136 # HENRY STEWART PUBLICATIONS 1479–7364. HUMAN GENOMICS. VOL 3. NO. 2. 128–142 JANUARY 2009
respectively (Figure 5b and c). To test the effects of
experimental conditions and dose further, a mixed
model analysis of variance was used to compare the
two cytotoxicity curves for both cell lines. A sig-
nificant interaction between dose and experimental
condition was found (p , 0.01). These results indi-
cate that the magnitude of the difference between
the two conditions depended on the concentration
of the drug. There was little difference between the
two experimental conditions at less than 80 mM,
with greater differences seen at concentrations of
�80 mM. These differences reached statistical sig-
nificance (p , 0.05) at the 80 and 160 mM doses.
Discussion
The identification of pharmacogenetic variants
contributing to variation in chemotherapeutic sus-
ceptibility is an area of great promise. In the
present study, we utilised LCLs for genome-wide
linkage and association analyses to identify genes
and variants involved in carboplatin-induced cyto-
toxicity. Linkage-directed association identified
SNPs within eight genes associated with carbopla-
tin IC50, of which CD44 baseline expression
explained 20 per cent of the variation in carbopla-
tin IC50. Finally, the role of CD44 in resistance to
carboplatin was validated using siRNA-mediated
knockdown, resulting in greater sensitivity to car-
boplatin. Although cell-based approaches have been
used to identify genetic variants contributing to
chemotherapy, the validation of one such target
using this approach is presented.
LCLs have been successfully used to identify genes
involved in cytotoxicity,13–17,21 alternative splicing,22
expression23–25 and other complex traits.26–28
Furthermore, LCLs have been used to study
population and gender effects on quantitative
traits.29–31 Consistent with cisplatin-, daunorubicin-,
docetaxel- and 5-fluorouracil-induced cytotoxicity in
LCLs,13,14,17,21 carboplatin cytototoxic phenotypes
are significantly heritable. Realising that genetics
contributes significantly to susceptibility to
chemotherapeutic-induced cytotoxicity, our labora-
tory has developed two cell-based models for
identifying genetic variants contributing to che-
motherapeutic induced cytotoxicity. One model is a
sequential approach that integrates SNP genotype,
gene expression and chemotherapeutic cytotox-
icity.15,16 Specifically, a whole-genome association is
performed between HapMap SNP genotypes and
cytotoxicity, followed by the use of those SNPs
identified as being associated with cytotoxicity in a
second association with gene expression. Lastly,
linear regression is performed between gene
expression of the ‘target gene’ and cytotoxicity to
identify genes whose expression correlates with
chemotherapeutic cytotoxicity. The second cell-
based model is presented in this paper, in which
large pedigrees are used to determine heritability,
followed by the identification of regions in
Figure 4. Baseline expression correlation of CD44 with carboplatin IC50. (a) Linear regression of log2 transformed carboplatin IC50
values on log2 transformed baseline CD44 expression (from exon expression array) and in 57 unrelated HapMap cell lines.
(b) Quantitative real-time polymerase chain reaction analysis of normalised CD44 expression in lymphoblastoid cell lines with the
highest (resistant, n ¼ 8) and lowest (sensitive, n ¼ 10) carboplatin IC50 values. Each box represents biological triplicates run in
duplicate (*p , 0.01, Student’s t-test).
Whole-genome approach implicates CD44 in cellular resistance to carboplatin PRIMARY RESEARCH
# HENRY STEWART PUBLICATIONS 1479–7364. HUMAN GENOMICS. VOL 3. NO 2. 128–142 JANUARY 2009 137
the genome that harbour genetic variation that
explains human variation in drug-induced cytotox-
icity. To narrow down the list of genetic variants
within suggestive LOD peaks, an association analysis
on SNPs within 1 LOD confidence interval is eval-
uated in a subset of samples containing dense geno-
typic data. This approach was applied to
daunorubicin14 and cisplatin.17 These approaches
Figure 5. Effect of small interfering RNA (siRNA)-mediated knockdown of CD44 on the sensitivity of cell lines to carboplatin. (a) Protein
lysates from GM06985 and GM11881 were isolated 48 hours post-transfection with 600 pmol CD44 siRNA and non-targeting control
siRNA. Western blot analysis was performed using antibodies against CD44 and b-actin (used to normalise the CD44 bands). (b)
Carboplatin cytotoxicity of 06985 following treatment with CD44 siRNA or non-targeting control (p, 0.01; Student’s t-test for
comparison of IC50 values) 48 hours after carboplatin exposure. The solid line indicates transfection with non-targeting siRNA and the
dotted line indicates transfection with CD44 siRNA. Each line represents an average of triplicate knockdown experiments, and error bars
represent the standard error of the mean. (c) Carboplatin cytotoxicity following CD44 siRNA knockdown compared with the
non-targeting group for cell line GM11881 (p , 0.05; Student’s t-test for comparison of IC50 values). The solid line indicates transfection
with non-targeting siRNA and the dotted line indicates transfection with CD44 siRNA. Each line represents an average of triplicate
knockdown experiments and error bars represent the standard error of the mean.
PRIMARY RESEARCH Shukla et al.
138 # HENRY STEWART PUBLICATIONS 1479–7364. HUMAN GENOMICS. VOL 3. NO. 2. 128–142 JANUARY 2009
can be used as a springboard for further analysis and
validation of candidate SNPs in other model systems
and, ultimately, clinical trials. Some improvements in
this model include the utilisation of more CEPH
pedigrees (ie 34 compared with previous studies
using 24 to 27 pedigrees13,14) and the use of
ANOVA analysis on unrelated HapMap and
Perlegen LCLs instead of the quantitative trans-
mission disequilibrium test on 30 trios, providing
flexibility to test different genetic models for each
SNP. The current study incorporated an analysis of
gene expression to identify the contribution of base-
line gene expression of the associated genes to vari-
ation in drug sensitivity. Lastly, this study included
functional analysis by siRNA-mediated knockdown
studies to validate results from the whole-genome
approach. One interesting observation was the lack of
overlap in genetic variants associated with carboplatin-
and cisplatin-induced17 cytotoxicity using a linkage-
directed association analysis. Twenty-seven and 34
families were analysed for cisplatin and carboplatin
susceptibility, respectively. These drugs have different
toxicity profiles, and this model was designed to be
more relevant to drug toxicity than tumour response.
Nonetheless, one might expect some overlap between
the findings for these similarly acting drugs.
Therefore, resequencing in candidate genes will be
performed in future studies. In addition, we will
perform a directed study to evaluate the degree to
which genes found for one drug contribute to the
other drug, as we did with CD44 in this analysis.
We tested 68 SNPs from the HapMap and
Perlegen samples in the CD44 gene locus, in
which 54 of these SNPs had minor allele frequen-
cies greater than 5 per cent for association with
carboplatin IC50 or CD44 expression. Our linkage-
directed association identified rs7116432 —
an intronic SNP located in CD44 — as being
associated with the carboplatin IC50 (p ¼ 1.5 �1026; FDR ¼ 0.003). This SNP was not associated
with the variation in expression of CD44 or any
other genes, as measured on the Affymetrix exon
array; however, this particular SNP may contribute
to an induction in CD44 gene expression after car-
boplatin treatment. In addition, there were two
SNPs, rs7116739 and rs11607862, which were in
strong linkage disequilibrium with rs7116432.
These SNPs were not significantly associated with
carboplatin IC50, however, and did not associate
with CD44 baseline expression. It is notable that a
SNP, rs7894637, located in TCF8 on chromosome
10, significantly explained 25 per cent of the vari-
ation in baseline CD44 expression (p ¼ 2 � 1026).
This SNP is not within 1 confidence interval of
any LOD peaks .1.5 from the linkage scan,
however, and is not associated with the expression
of other genes (data not shown). Future studies will
focus more on the causal variants and haplotypes
affecting CD44 function and their role in carbopla-
tin resistance.
Proteins from one CD44 family are involved in a
wide variety of cellular processes, such as cell
adhesion, cell survival, regulation of growth, inva-
sion and proliferation.32,33 CD44 is a transmem-
brane glycoprotein involved in the adaptation of
cells to their microenvironment.33 CD44(s), which
is the smallest standard isoform, is expressed in the
majority of vertebrate tissues,32 whereas the alterna-
tively spliced transcripts are expressed in proliferat-
ing cells and many cancers.33 Regarding treatment
outcome, a recent haplotype derived from three
intronic SNPs and one SNP in the 30 untranslatedregion in CD44 was associated with an increased
risk of early adverse skin reactions after radiotherapy
in breast cancer patients.34 CD44 has also been
implicated in resistance (including resistance to
apoptosis) to various chemotherapeutic agents,
including alkylating agents, platinating agents, eto-
poside and dexamethasone.35–41 One study
revealed that enhanced expression of a CD44
variant isoform was associated with 1,3-bis(2-
chloroethyl)-1-nitrosourea (BCNU) resistance in
colon cancer lines.42 More specifically, hyaluronan
(HA)–CD44 signalling has also been implicated in
cellular resistance to cisplatin and methotrexate in
head and neck cancer cells and altered adriamycin
sensitivity in breast cancer.40,41,43,44 Previous
studies performed in tumour cell lines suggest that
epidermal growth factor receptor (EGFR)-
mediated downstream signalling events resulting
from the HA–CD44 interaction is a likely cause of
resistance.39–41 In this model, HA binding to
Whole-genome approach implicates CD44 in cellular resistance to carboplatin PRIMARY RESEARCH
# HENRY STEWART PUBLICATIONS 1479–7364. HUMAN GENOMICS. VOL 3. NO 2. 128–142 JANUARY 2009 139
CD44 promotes its association with, and phos-
phorylation of, EGFR, which signals the down-
stream phosphorylation of mitogen-activated
protein kinases to promote chemotherapy resist-
ance. In addition, HA–CD44 promotes other
intracellular signalling cascades through its inter-
action with phospholipase C-gamma-1, phospho-
inositide 3-kinase, Nanog–Stat3 and other
pathways.39–41,45–48
Overexpression of CD44 has been shown to
confer an anti-apoptotic effect following treatment
with etoposide in colon cancer cells36 and after treat-
ment with dexamethasone in T lymphocytes.49
Murine colon epithelium cells deficient in CD44
were assessed for apoptosis after total body
irradiation. Upregulation of apoptosis-associated
genes, such as the genes encoding caspases 3 and 9,
indicated that a mitochondrial pathway was involved
in apoptosis.37 In the current linkage study, we
observed several caspases (1, 4, 5 and 12) within a
high LOD score region on chromosome 11
(LOD ¼ 3.36) for the IC50 phenotype. Genetic
variation within the caspases, along with CD44,
could act in concert to increase resistance to carbo-
platin. In addition, a conserved intronic SNP across
multiple species, rs17727535 (located in
DKFZP586H2123), was the SNP most significantly
associated with carboplatin IC50 (p ¼ 3.63 � 10212;
FDR ,0.001). This gene is located underneath the
same linkage peak as CD44 and has serine protease
activity. Maquarre et al.50 recently demonstrated that
ligation of CD44 by a monoclonal antibody in leu-
kaemia cells induced apoptosis through a caspase-
and serine protease-dependent pathway. Thus, these
two pathways may act in concert to confer resistance
to carboplatin. Taken together, overexpression of
CD44 may mediate signalling, which can lead to
resistance to carboplatin, and possibly to other
co-administered drugs, by conferring an anti-apoptotic
effect. One could consider CD44 expression levels as
a biomarker of resistance to carboplatin.
It is important to note that cytotoxicity is a multi-
genic trait, and there are many genes whose
expression levels may be contributing to carboplatin
IC50 values and drug resistance. Since PAK1
expression also showed a significant contribution to
carboplatin IC50, the effect of knocking down PAK1
with CD44 and/or other genes might be considered.
Our unbiased genome-wide linkage-directed
association analyses, employing LCLs, identified
previously unknown genes and variants involved in
carboplatin-induced cytotoxicity. The use of LCLs
enabled us to demonstrate the involvement of
CD44 expression in resistance to carboplatin.
Overall, the experimental data elucidating the con-
tribution of CD44 to carboplatin resistance in
LCLs encourages the use of this sequential whole-
genome approach. In addition, all eight genes
could be further examined without a focus on gene
expression levels, since their contribution to sus-
ceptibility to cytotoxicity could be through other
means, such as post-translational modifications or
alternative splicing. Despite the identification of
interesting genes and variants through our genetic
analyses, there are many well-studied genes contri-
buting to chemotherapeutic resistance and toxicity
that were not identified through linkage analysis.
There were two caveats in our association study.
First, we were limited to the SNPs within the
International HapMap; therefore SNPs in candidate
genes may not be well represented. Secondly, 30
trios (90 samples) may lack the power to detect
some candidate genetic variants. On average, the
heritability estimates ranged from 17–35 per cent
in our pedigree study. Candidate genes that have
low or modest contributions to cytotoxicity or lack
genetic variation may not be found in the final
gene list. Future experiments will include
siRNA-mediated knockdown of candidate genes
whose expression may contribute to resistance to
carboplatin. Finally, genes and variants identified
through our approach should be also tested with
regard to chemotherapeutic susceptibility in appro-
priate tumour cell lines. One could consider this
whole-genome approach to identify genes and
mechanisms involved in other cellular phenotypes.
Acknowledgments
This Pharmacogenetics of Anticancer Agents Research
(PAAR) Group (http://pharmacogenetics.org) study was sup-
ported by NIH/NIGMS grant U01GM61393 and data
deposits are supported by U01GM61374 (http://
PRIMARY RESEARCH Shukla et al.
140 # HENRY STEWART PUBLICATIONS 1479–7364. HUMAN GENOMICS. VOL 3. NO. 2. 128–142 JANUARY 2009
pharmgkb.org/). This study was also supported by
P50CA125183 University of Chicago Breast Cancer SPORE
grant. We are grateful for excellent technical support provided
by Dr Jeong-Ah Kang in maintaining the cell lines. We are
also thankful to Dr Blanca Camoretti-Mercado for intellec-
tual contributions and use of the Amaxa Nucleofector device.
Data deposits: Phenotype data (PS207015) is deposited into
(http://www.pharmgkb.org/). The gene expression data
described in this paper have been deposited into GEO
(GenBank Accession No: GSE7851).
References1. Ho, Y.P., Au-Yeung, S.C. and To, K.K. (2003), ‘Platinum-based antican-
cer agents: Innovative design strategies and biological perspectives’, Med.
Res. Rev. Vol. 23, pp. 633–655.
2. Kelland, L. (2007), ‘The resurgence of platinum-based cancer
chemotherapy’, Nat. Rev. Cancer Vol. 7, pp. 573–584.
3. Efferth, T. and Volm, M. (2005), ‘Pharmacogenetics for individualized
cancer chemotherapy’, Pharmacol. Ther. Vol. 107, pp. 155–176.
4. Wang, D. and Lippard, S.J. (2005), ‘Cellular processing of platinum
anticancer drugs’, Nat. Rev. Drug Discov. Vol. 4, pp. 307–320.
5. Brabec, V. and Kasparkova, J. (2005), ‘Modifications of DNA by plati-
num complexes. Relation to resistance of tumors to platinum antitumor
drugs’, Drug Resist. Updat. Vol. 8, pp. 131–146.
6. Stewart, D.J. (2007), ‘Mechanisms of resistance to cisplatin and carbopla-
tin’, Crit. Rev. Oncol. Hematol. Vol. 63, pp. 12–31.
7. Vekris, A., Meynard, D., Haaz, M.C. et al. (2004), ‘Molecular determi-
nants of the cytotoxicity of platinum compounds: The contribution of in
silico research’, Cancer Res. Vol. 64, pp. 356–362.
8. Rabik, C.A. and Dolan, M.E. (2007), ‘Molecular mechanisms of resist-
ance and toxicity associated with platinating agents’, Cancer Treat. Rev.
Vol. 33, pp. 9–23.
9. Suk, R., Gurubhagavatula, S., Park, S. et al. (2005), ‘Polymorphisms in
ERCC1 and grade 3 or 4 toxicity in non-small cell lung cancer patients’,
Clin. Cancer Res. Vol. 11, pp. 1534–1538.
10. Olaussen, K.A., Dunant, A., Fouret, P. et al. (2006), ‘DNA repair by
ERCC1 in non-small-cell lung cancer and cisplatin-based adjuvant
chemotherapy’, N. Engl. J. Med. Vol. 355, pp. 983–991.
11. Olaussen, K.A., Mountzios, G. and Soria, J.C. (2007), ‘ERCC1 as a risk
stratifier in platinum-based chemotherapy for nonsmall-cell lung cancer’,
Curr. Opin. Pulm. Med. Vol. 13, pp. 284–289.
12. Bewick, M.A., Conlon, M.S. and Lafrenie, R.M. (2006),
‘Polymorphisms in XRCC1, XRCC3, and CCND1 and survival after
treatment for metastatic breast cancer’, J. Clin. Oncol. Vol. 24,
pp. 5645–5651.
13. Dolan, M.E., Newbold, K.G., Nagasubramanian, R. et al. (2004),
‘Heritability and linkage analysis of sensitivity to cisplatin-induced cyto-
toxicity’, Cancer Res. Vol. 64, pp. 4353–4356.
14. Duan, S., Bleibel, W.K., Huang, R.S. et al. (2007), ‘Mapping genes that
contribute to daunorubicin-induced cytotoxicity’, Cancer Res. Vol. 67,
pp. 5425–5433.
15. Huang, R.S., Duan, S., Bleibel, W.K. et al. (2007), ‘A genome-wide
approach to identify genetic variants that contribute to etoposide-induced
cytotoxicity’, Proc. Natl. Acad. Sci. USA Vol. 104, pp. 9758–9763.
16. Huang, R.S., Duan, S., Shukla, S.J. et al. (2007), ‘Identification of
genetic variants contributing to cisplatin-induced cytotoxicity by use of a
genomewide approach’, Am. J. Hum. Genet. Vol. 81, pp. 427–437.
17. Shukla, S.J., Duan, S., Badner, J.A., Wu, X. and Dolan, M.E. (2008),
‘Susceptibility loci involved in cisplatin-induced cytotoxicity and apoptosis’,
Pharmacogenet. Genomics Vol. 18, pp. 253–262.
18. Almasy, L. and Blangero, J. (1998), ‘Multipoint quantitative-trait
linkage analysis in general pedigrees’, Am. J. Hum. Genet. Vol. 62, pp.
1198–1211.
19. Abecasis, G.R., Cherny, S.S., Cookson, W.O. and Cardon, L.R. (2002),
‘Merlin — Rapid analysis of dense genetic maps using sparse gene flow
trees’, Nat. Genet. Vol. 30, pp. 97–101.
20. Zhang, W., Duan, S., Kistner, E.O. et al. (2008), ‘Evaluation of genetic
variants contributing to differences in gene expression’, Am. J. Hum.
Genet. Vol. 82, pp. 631–640.
21. Watters, J.W., Kraja, A., Meucci, M.A., Province, M.A. and McLeod,
H.L. (2004), ‘Genome-wide discovery of loci influencing chemotherapy
cytotoxicity’, Proc. Natl. Acad. Sci. USA Vol. 101, pp. 11809–11814.
22. Kwan, T., Benovoy, D., Dias, C. et al. (2007), ‘Heritability of alternative
splicing in the human genome’, Genome Res. Vol. 17, pp. 1210–1218.
23. Dixon, A.L., Liang, L., Moffatt, M.F. et al. (2007), ‘A genome-wide
association study of global gene expression’, Nat. Genet. Vol. 39,
pp. 1202–1207.
24. Morley, M., Molony, C.M., Weber, T.M. et al. (2004), ‘Genetic analysis
of genome-wide variation in human gene expression’, Nature Vol. 430,
pp. 743–747.
25. Stranger, B.E., Forrest, M.S., Dunning, M. et al. (2007), ‘Relative impact
of nucleotide and copy number variation on gene expression pheno-
types’, Science Vol. 315, pp. 848–853.
26. Baron, C.A., Liu, S.Y., Hicks, C. and Gregg, J.P. (2006), ‘Utilization of
lymphoblastoid cell lines as a system for the molecular modeling of
autism’, J. Autism Dev. Disord. Vol. 36, pp. 973–982.
27. Hu, V.W., Frank, B.C., Heine, S., Lee, N.H. and Quackenbush, J. (2006),
‘Gene expression profiling of lymphoblastoid cell lines from monozygotic
twins discordant in severity of autism reveals differential regulation of
neurologically relevant genes’, BMC Genomics Vol. 7, p. 118.
28. Nishimura, Y., Martin, C.L., Vazquez-Lopez, A. et al. (2007),
‘Genome-wide expression profiling of lymphoblastoid cell lines dis-
tinguishes different forms of autism and reveals shared pathways’, Hum.
Mol. Genet. Vol. 16, pp. 1682–1698.
29. Huang, R.S., Kistner, E.O., Bleibel, W.K., Shukla, S.J. and Dolan, M.E.
(2007), ‘Effect of population and gender on chemotherapeutic
agent-induced cytotoxicity’, Mol. Cancer Ther. Vol. 6, pp. 31–36.
30. Weiss, L.A., Pan, L., Abney, M. and Ober, C. (2006), ‘The sex-specific
genetic architecture of quantitative traits in humans’, Nat. Genet. Vol. 38,
pp. 218–222.
31. Zhang, W., Bleibel, W.K., Roe, C.A., Cox, N.J. and Dolan, M.E.
(2007), ‘Gender-specific differences in expression in human lymphoblas-
toid cell lines’, Pharmacogenet. Genomics Vol. 17, pp. 447–450.
32. Cheng, C., Yaffe, M.B. and Sharp, P.A. (2006), ‘A positive feedback loop
couples Ras activation and CD44 alternative splicing’, Genes Dev. Vol. 20,
pp. 1715–1720.
33. Ponta, H., Sherman, L. and Herrlich, P.A. (2003), ‘CD44: From
adhesion molecules to signalling regulators’, Nat. Rev. Mol. Cell Biol.
Vol. 4, pp. 33–45.
34. Suga, T., Ishikawa, A., Kohda, M. et al. (2007), ‘Haplotype-based analysis
of genes associated with risk of adverse skin reactions after radiotherapy
in breast cancer patients’, Int. J. Radiat. Oncol. Biol. Phys. Vol. 69,
pp. 685–693.
35. Hagel, C., Park, S.H., Puchner, M.J. and Stavrou, D. (2004), ‘CD44
expression and tumour cell density correlate with response to tamoxifen/
carboplatin chemotherapy in glioblastomas’, J. Neurooncol. Vol. 66,
pp. 139–146.
36. Lakshman, M., Subramaniam, V., Rubenthiran, U. and Jothy, S. (2004),
‘CD44 promotes resistance to apoptosis in human colon cancer cells’,
Exp. Mol. Pathol. Vol. 77, pp. 18–25.
37. Lakshman, M., Subramaniam, V., Wong, S. and Jothy, S. (2005), ‘CD44
promotes resistance to apoptosis in murine colonic epithelium’, J. Cell
Physiol. Vol. 203, pp. 583–588.
38. Ohwada, C., Nakaseko, C., Koizumi, M. et al. (2008), ‘CD44 and hya-
luronan engagement promotes dexamethasone resistance in human
myeloma cells’, Eur. J. Haematol. Vol. 80, pp. 245–250.
39. Wang, S.J. and Bourguignon, L.Y. (2006), ‘Hyaluronan and the inter-
action between CD44 and epidermal growth factor receptor in onco-
genic signaling and chemotherapy resistance in head and neck cancer’,
Arch. Otolaryngol. Head Neck Surg. Vol. 132, pp. 771–778.
Whole-genome approach implicates CD44 in cellular resistance to carboplatin PRIMARY RESEARCH
# HENRY STEWART PUBLICATIONS 1479–7364. HUMAN GENOMICS. VOL 3. NO 2. 128–142 JANUARY 2009 141
40. Wang, S.J. and Bourguignon, L.Y. (2006), ‘Hyaluronan-CD44 promotes
phospholipase C-mediated Ca2þ signaling and cisplatin resistance in
head and neck cancer’, Arch. Otolaryngol. Head Neck Surg. Vol. 132,
pp. 19–24.
41. Wang, S.J., Peyrollier, K. and Bourguignon, L.Y. (2007), ‘The influence
of hyaluronan-CD44 interaction on topoisomerase II activity and etopo-
side cytotoxicity in head and neck cancer’, Arch. Otolaryngol. Head Neck
Surg. Vol. 133, pp. 281–288.
42. Bates, R.C., Edwards, N.S., Burns, G.F. and Fisher, D.E. (2001), ‘A
CD44 survival pathway triggers chemoresistance via lyn kinase and phos-
phoinositide 3-kinase/Akt in colon carcinoma cells’, Cancer Res. Vol. 61,
pp. 5275–5283.
43. Misra, S., Ghatak, S. and Toole, B.P. (2005), ‘Regulation of MDR1
expression and drug resistance by a positive feedback loop involving hya-
luronan, phosphoinositide 3-kinase, and ErbB2’, J. Biol. Chem. Vol. 280,
pp. 20310–20315.
44. Misra, S., Ghatak, S., Zoltan-Jones, A. and Toole, B.P. (2003),
‘Regulation of multidrug resistance in cancer cells by hyaluronan’, J. Biol.
Chem. Vol. 278, pp. 25285–25288.
45. Entwistle, J., Hall, C.L. and Turley, E.A. (1996), ‘HA receptors:
Regulators of signalling to the cytoskeleton’, J. Cell Biochem. Vol. 61,
pp. 569–577.
46. Lin, Y.H. and Yang-Yen, H.F. (2001), ‘The osteopontin-CD44 survival
signal involves activation of the phosphatidylinositol 3-kinase/Akt signal-
ing pathway’, J. Biol. Chem. Vol. 276, pp. 46024–46030.
47. Turley, E.A., Noble, P.W. and Bourguignon, L.Y. (2002), ‘Signaling
properties of hyaluronan receptors’, J. Biol. Chem. Vol. 277, pp. 4589–4592.
48. Bourguignon, L.Y., Peyrollier, K., Xia, W. and Gilad, E. (2008),
‘Hyaluronan-CD44 interaction activates stem cell marker, nanog, stat-3-
mediated MDR1 gene expression and ankyrin-regulated multidrug
efflux in breast and ovarian tumor cells’, J. Biol. Chem. vol. 283,
pp. 17635–17651.
49. Ayroldi, E., Cannarile, L., Migliorati, G. et al. (1995), ‘CD44 (Pgp-1)
inhibits CD3 and dexamethasone-induced apoptosis’, Blood. Vol. 86,
pp. 2672–2678.
50. Maquarre, E., Artus, C., Gadhoum, Z. et al. (2005), ‘CD44 ligation
induces apoptosis via caspase- and serine protease-dependent pathways in
acute promyelocytic leukemia cells’, Leukemia Vol. 19, pp. 2296–2303.
Supplementary Table 1
Single nucleotide
polymorphism
Chromosome Position (bp) Gene p value False discovery
rate (%)
rs11784151 8 104275289 BAALC 3.6�1025 2.7
rs13255229 8 104279675 BAALC 1.0�1025 0.9
rs2201369 8 104291201 BAALC 9.1�10211 0.0
rs17799574 8 104298709 BAALC 9.1�10211 0.0
rs17378130 8 124310523 C8orf76 1.5�1025 1.2
rs7116432 11 35200634 CD44 1.5�1026 0.3
rs10790959 11 99152041 CNTN5 1.5�1026 0.3
rs1441382 11 99198199 CNTN5 2.6�1027 0.1
rs17727535 11 35501279 DKFZP586H2123 3.6�10212 0.0
rs11215437 11 114609382 IGSF4 2.8�1027 0.1
rs4375425 11 40183956 LRRC4C 3.2�1027 0.1
rs476925 11 76793285 PAKI 1.1�1025 0.9
rs538670 11 76766226 PAKI 1.1�1025 0.9
rs478134 11 76753207 PAKI 1.1�1025 0.9
rs495889 11 76796364 PAKI 1.1�1025 0.9
rs628325 11 76814368 PAKI 1.1�1025 0.9
rs3019258 11 76836767 PAKI 1.1�1025 0.9
rs674652 11 76785476 PAKI 1.1�1025 0.9
PRIMARY RESEARCH Shukla et al.
142 # HENRY STEWART PUBLICATIONS 1479–7364. HUMAN GENOMICS. VOL 3. NO. 2. 128–142 JANUARY 2009