Embed Size (px)
Citation preview
DNV GL © 2013 SAFER, SMARTER, GREENER
Mitch Rosenberg, Gomathi Sadhasivan, & Rachel Schiff
Whole House Retrofit Market Effects Study
1
CPUC EM&V WO54 – Market Assessment & Market
Effects
DNV GL © 2013
Table of Contents
Background
– Project Objectives & Methods
– Development of Whole House Retrofit/Home Performance Programs & Industry
– CA Program Activity
Customer View
– Prevalence of Energy Efficiency Measures in the Flow of Home Improvements
– Prevalence of Home Performance and Whole House Features
– Awareness, Knowledge, and Perceptions of Value for WH/HP Features
The Supply Chain
– Current Service Offerings v. the WH/HP Model
– Interest in offering WH/HP Services
– Case Studies of High Volume Contractors: Business Models and Practices
Conclusions and Implications for Program Strategies and Future Research
2
DNV GL © 2013
BACKGROUND
3
DNV GL © 2013
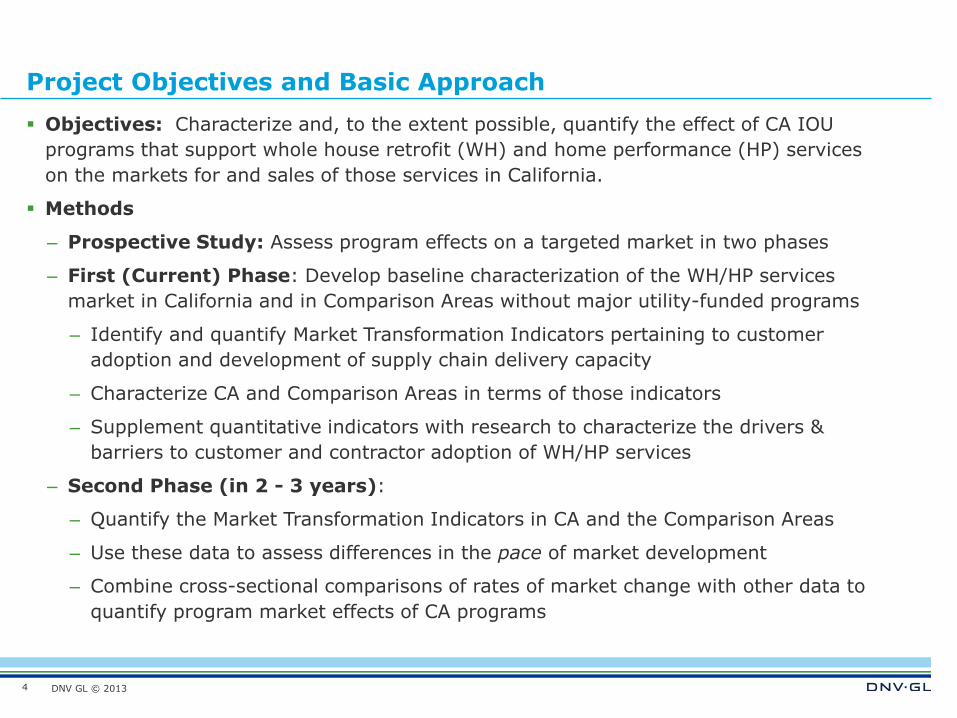
Project Objectives and Basic Approach
Objectives: Characterize and, to the extent possible, quantify the effect of CA IOU
programs that support whole house retrofit (WH) and home performance (HP) services
on the markets for and sales of those services in California.
Methods
– Prospective Study: Assess program effects on a targeted market in two phases
– First (Current) Phase: Develop baseline characterization of the WH/HP services
market in California and in Comparison Areas without major utility-funded programs
– Identify and quantify Market Transformation Indicators pertaining to customer
adoption and development of supply chain delivery capacity
– Characterize CA and Comparison Areas in terms of those indicators
– Supplement quantitative indicators with research to characterize the drivers &
barriers to customer and contractor adoption of WH/HP services
– Second Phase (in 2 - 3 years):
– Quantify the Market Transformation Indicators in CA and the Comparison Areas
– Use these data to assess differences in the pace of market development
– Combine cross-sectional comparisons of rates of market change with other data to
quantify program market effects of CA programs
4
DNV GL © 2013
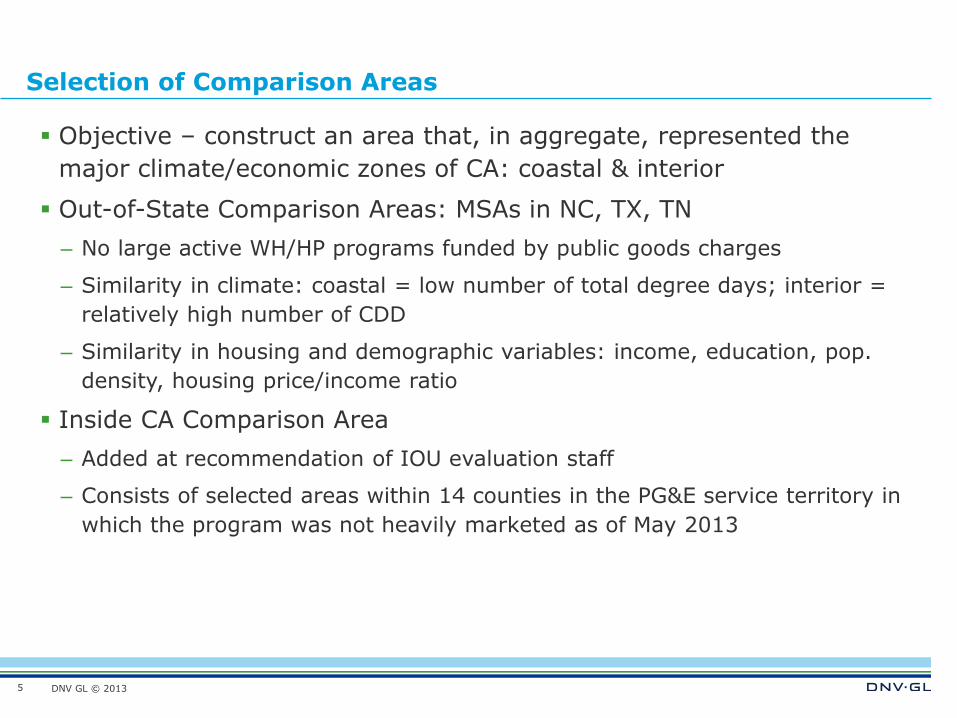
Selection of Comparison Areas
Objective – construct an area that, in aggregate, represented the
major climate/economic zones of CA: coastal & interior
Out-of-State Comparison Areas: MSAs in NC, TX, TN
– No large active WH/HP programs funded by public goods charges
– Similarity in climate: coastal = low number of total degree days; interior =
relatively high number of CDD
– Similarity in housing and demographic variables: income, education, pop.
density, housing price/income ratio
Inside CA Comparison Area
– Added at recommendation of IOU evaluation staff
– Consists of selected areas within 14 counties in the PG&E service territory in
which the program was not heavily marketed as of May 2013
5
DNV GL © 2013
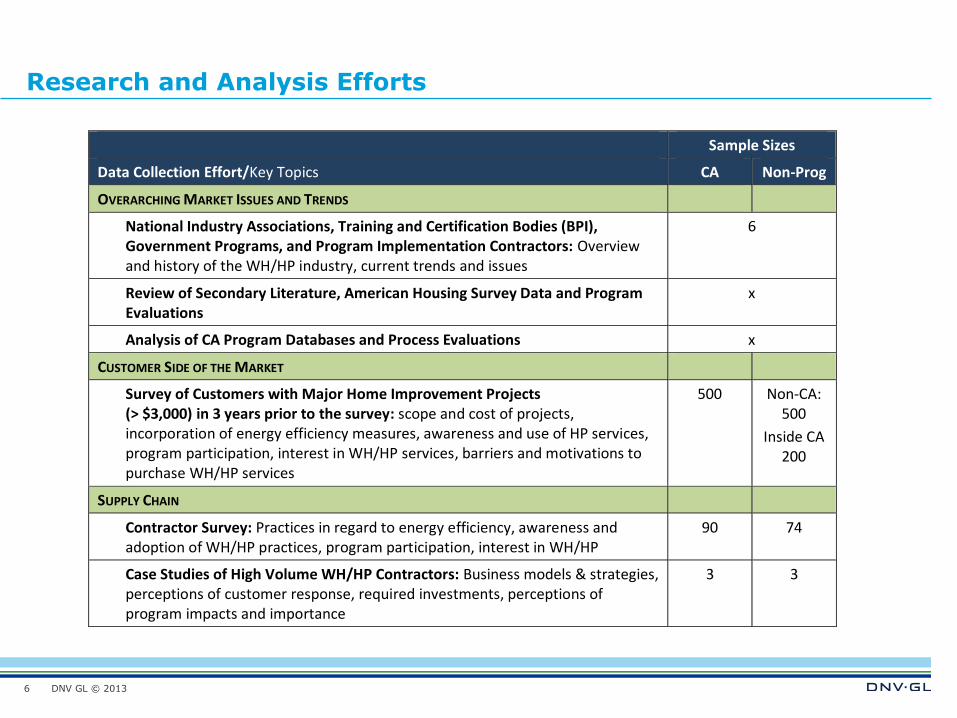
Research and Analysis Efforts
6
Sample Sizes
Data Collection Effort/Key Topics CA Non-Prog
OVERARCHING MARKET ISSUES AND TRENDS
National Industry Associations, Training and Certification Bodies (BPI), Government Programs, and Program Implementation Contractors: Overview and history of the WH/HP industry, current trends and issues
6
Review of Secondary Literature, American Housing Survey Data and Program Evaluations
x
Analysis of CA Program Databases and Process Evaluations x
CUSTOMER SIDE OF THE MARKET
Survey of Customers with Major Home Improvement Projects (> $3,000) in 3 years prior to the survey: scope and cost of projects, incorporation of energy efficiency measures, awareness and use of HP services, program participation, interest in WH/HP services, barriers and motivations to purchase WH/HP services
500 Non-CA: 500
Inside CA 200
SUPPLY CHAIN
Contractor Survey: Practices in regard to energy efficiency, awareness and adoption of WH/HP practices, program participation, interest in WH/HP
90 74
Case Studies of High Volume WH/HP Contractors: Business models & strategies, perceptions of customer response, required investments, perceptions of program impacts and importance
3 3
DNV GL © 2013
Selected Methodological Issues
Comparability of homeowner survey samples in the 3 study areas:
differences relatively small but some are statistically significant;
differences between areas not consistent across variables
– Age distribution: very little difference, skewed slightly older in CA
– Educational attainment: higher % of college grads in OOS (76%) v.
CA Program Area (67%)
– Income distribution more heavily weighted to middle in OOS than in
CA – which has more concentration in higher & lower ends
Over-representation of participants in program: 19% of CA sample v.
2% estimated from program records. Downweighted self-reported
participants in all study areas
Surveys conducted 2 years after program implementation
– Observed differences in between study areas in market indicators
likely reflect market effects, as well as other factors: code
differences, market effects of earlier programs.
7
DNV GL © 2013
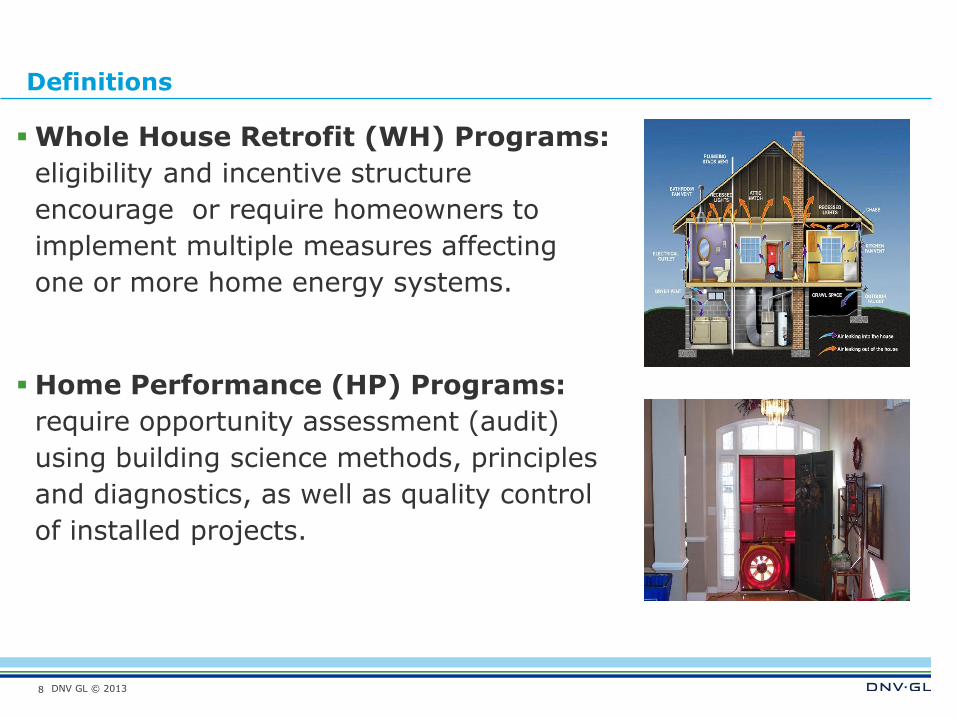
Definitions
Whole House Retrofit (WH) Programs:
eligibility and incentive structure
encourage or require homeowners to
implement multiple measures affecting
one or more home energy systems.
Home Performance (HP) Programs:
require opportunity assessment (audit)
using building science methods, principles
and diagnostics, as well as quality control
of installed projects.
8

DNV GL © 2013
Chronology of Key Events in Home Performance Industry Development
9
Year Key WH/HP Industry Events
1993 Building Performance Institute started as a program of New York State to improve standards of performance for weatherization programs
1996 BPI incorporated and issues first auditor certifications 1999 NYSERDA hires BPI and CSG to develop certification and delivery
protocols for private sector contractors 2001 EPA develops standards for Home Performance with Energy Star
programs. Hires CEE/NATE to develop standards and certification for HVAC installation; BPI to develop standards and certification for whole house contractors NYSERDA launches first Home Performance with Energy Star program
2004 EPA, DOE, and HUD hire CSG and BPI to promote national expansion of Home Performance programs
2008 Terms of stimulus funding for energy efficiency discussed 2009 ARRA funding released for home performance programs under
three programs ~$700 million 2010 ARRA programs in the field:
Programs listed in DSIRE - 126 2011 ARRA programs in the field 2012 ARRA programs wind down 2013 ARRA programs closed out except for some loan funds
Programs listed in DSIRE – 97
0
5
10
15
20
25
30
35
40
45
50
2008 2009 2010 2011 2012 2013
BP
I A
cti
ve C
erti
ficati
on
s
‘00
0s
The ARRA Era: The number of
WH/HP programs and BPI
certified technicians increased
significantly with ARRA funding
but have since declined sharply.
DNV GL © 2013
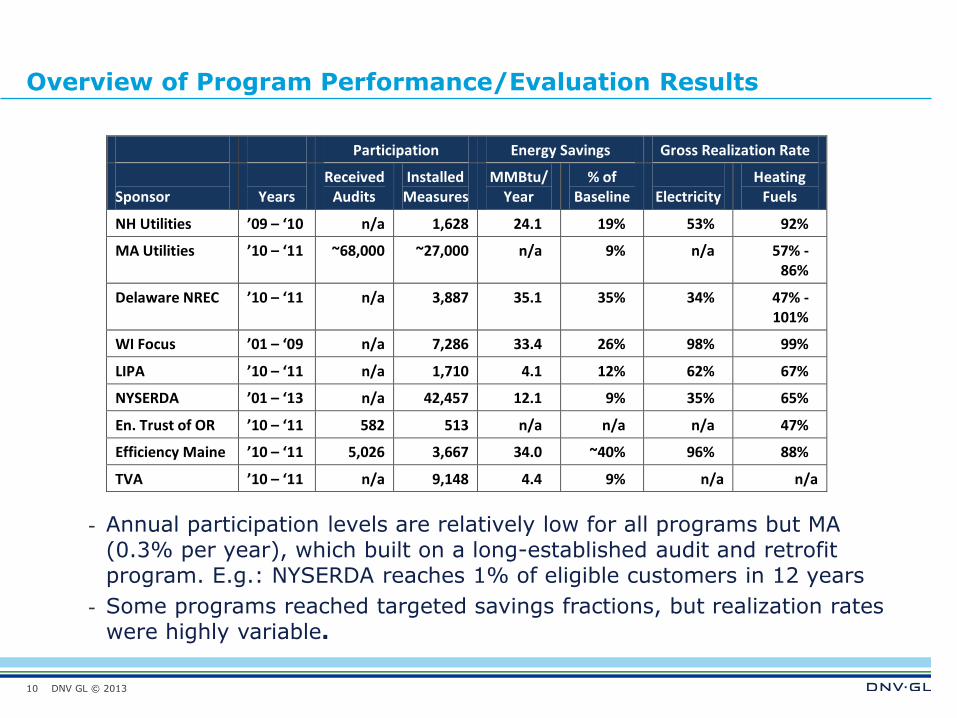
Overview of Program Performance/Evaluation Results
- Annual participation levels are relatively low for all programs but MA (0.3% per year), which built on a long-established audit and retrofit program. E.g.: NYSERDA reaches 1% of eligible customers in 12 years
- Some programs reached targeted savings fractions, but realization rates were highly variable.
Participation Energy Savings Gross Realization Rate
Sponsor
Years
Received Audits
Installed Measures
MMBtu/ Year
% of Baseline
Electricity
Heating Fuels
NH Utilities ’09 – ‘10 n/a 1,628 24.1 19% 53% 92%
MA Utilities ’10 – ‘11 ~68,000 ~27,000 n/a 9% n/a 57% - 86%
Delaware NREC ’10 – ‘11 n/a 3,887 35.1 35% 34% 47% - 101%
WI Focus ’01 – ‘09 n/a 7,286 33.4 26% 98% 99%
LIPA ’10 – ‘11 n/a 1,710 4.1 12% 62% 67%
NYSERDA ’01 – ‘13 n/a 42,457 12.1 9% 35% 65%
En. Trust of OR ’10 – ‘11 582 513 n/a n/a n/a 47%
Efficiency Maine ’10 – ‘11 5,026 3,667 34.0 ~40% 96% 88%
TVA ’10 – ‘11 n/a 9,148 4.4 9% n/a n/a
10
DNV GL © 2013
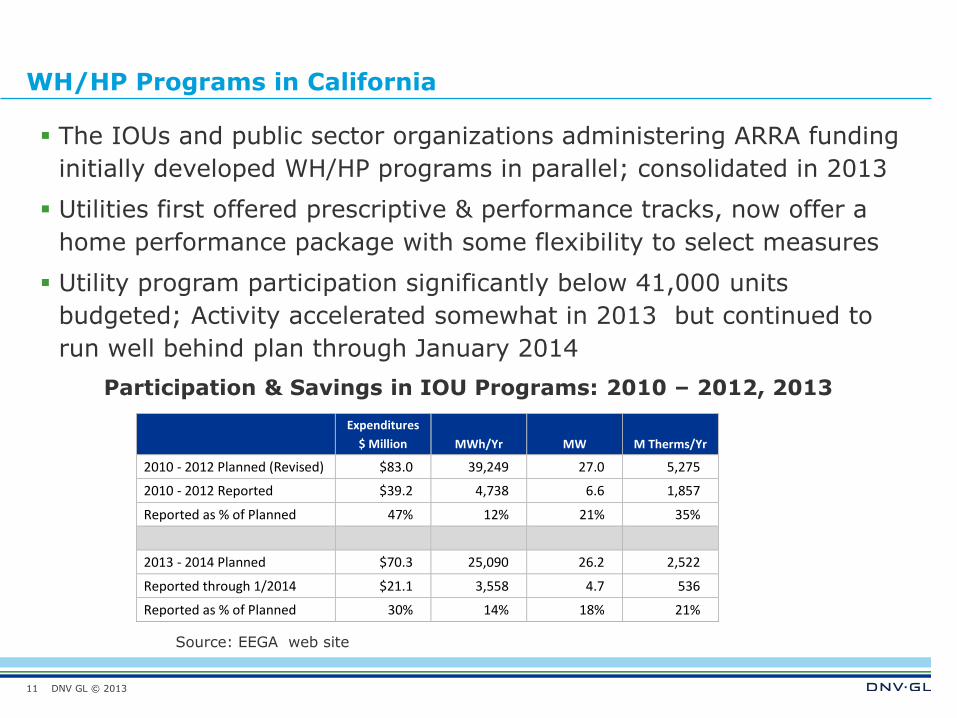
WH/HP Programs in California
The IOUs and public sector organizations administering ARRA funding
initially developed WH/HP programs in parallel; consolidated in 2013
Utilities first offered prescriptive & performance tracks, now offer a
home performance package with some flexibility to select measures
Utility program participation significantly below 41,000 units
budgeted; Activity accelerated somewhat in 2013 but continued to
run well behind plan through January 2014
Participation & Savings in IOU Programs: 2010 – 2012, 2013
11
Expenditures
$ Million MWh/Yr MW M Therms/Yr
2010 - 2012 Planned (Revised) $83.0 39,249 27.0 5,275
2010 - 2012 Reported $39.2 4,738 6.6 1,857
Reported as % of Planned 47% 12% 21% 35%
2013 - 2014 Planned $70.3 25,090 26.2 2,522
Reported through 1/2014 $21.1 3,558 4.7 536
Reported as % of Planned 30% 14% 18% 21%
Source: EEGA web site
DNV GL © 2013
THE CONSUMER MARKET
12
DNV GL © 2013
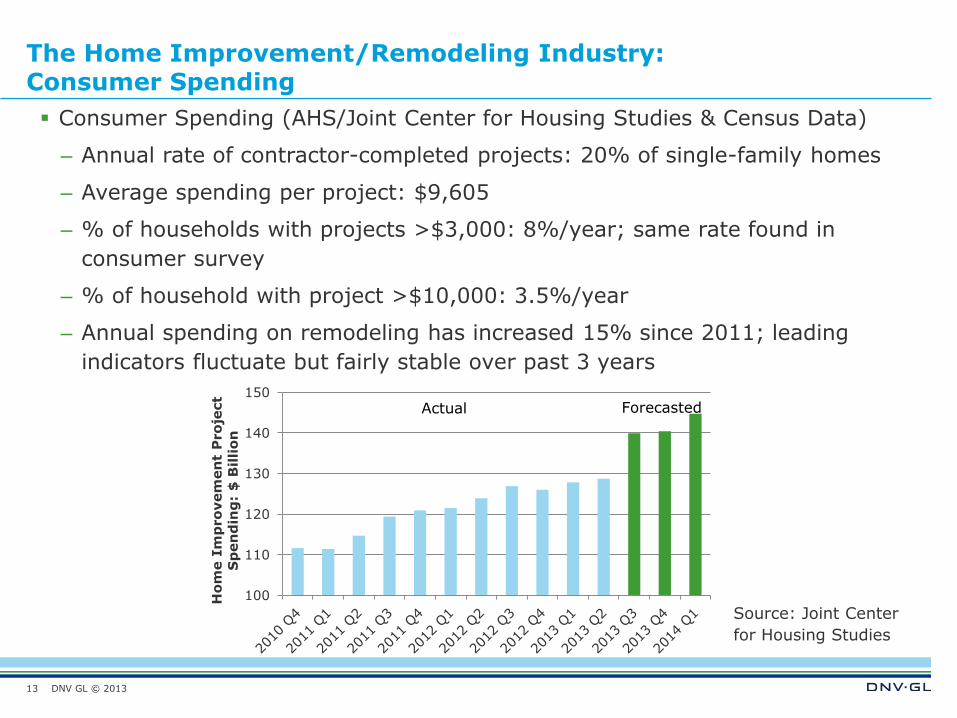
The Home Improvement/Remodeling Industry: Consumer Spending
Consumer Spending (AHS/Joint Center for Housing Studies & Census Data)
– Annual rate of contractor-completed projects: 20% of single-family homes
– Average spending per project: $9,605
– % of households with projects >$3,000: 8%/year; same rate found in
consumer survey
– % of household with project >$10,000: 3.5%/year
– Annual spending on remodeling has increased 15% since 2011; leading
indicators fluctuate but fairly stable over past 3 years
13
100
110
120
130
140
150
Ho
me I
mp
ro
vem
en
t P
ro
ject
Sp
en
din
g:
$ B
illio
n
Actual Forecasted
Source: Joint Center
for Housing Studies
DNV GL © 2013
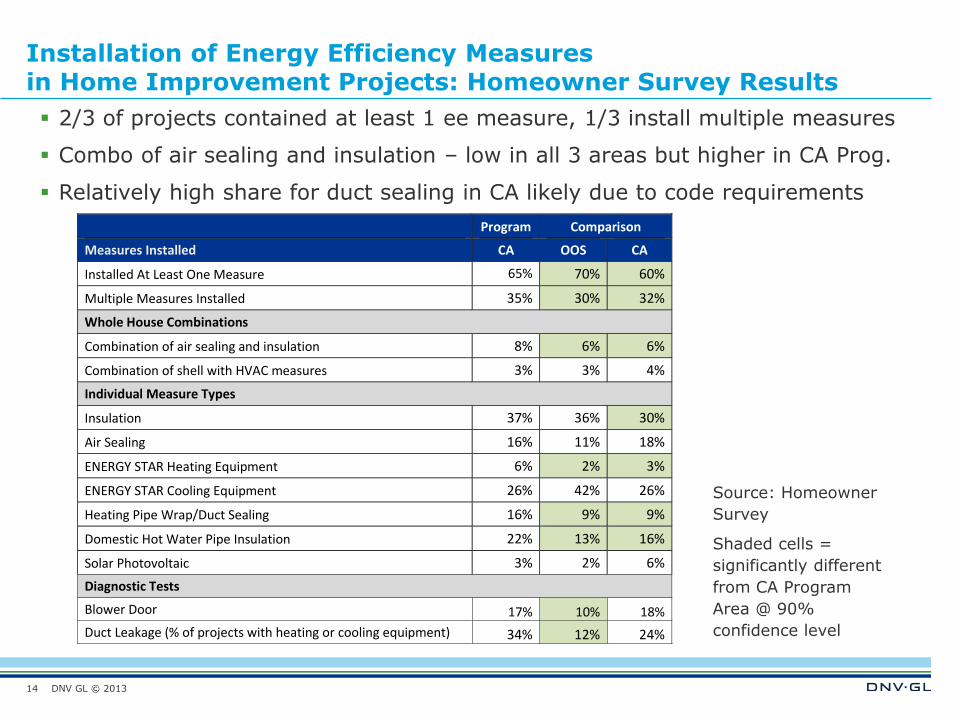
Installation of Energy Efficiency Measures in Home Improvement Projects: Homeowner Survey Results
2/3 of projects contained at least 1 ee measure, 1/3 install multiple measures
Combo of air sealing and insulation – low in all 3 areas but higher in CA Prog.
Relatively high share for duct sealing in CA likely due to code requirements
14
Program Comparison
Measures Installed CA OOS CA
Installed At Least One Measure 65% 70% 60%
Multiple Measures Installed 35% 30% 32%
Whole House Combinations
Combination of air sealing and insulation 8% 6% 6%
Combination of shell with HVAC measures 3% 3% 4%
Individual Measure Types
Insulation 37% 36% 30%
Air Sealing 16% 11% 18%
ENERGY STAR Heating Equipment 6% 2% 3%
ENERGY STAR Cooling Equipment 26% 42% 26%
Heating Pipe Wrap/Duct Sealing 16% 9% 9%
Domestic Hot Water Pipe Insulation 22% 13% 16%
Solar Photovoltaic 3% 2% 6%
Diagnostic Tests
Blower Door 17% 10% 18%
Duct Leakage (% of projects with heating or cooling equipment) 34% 12% 24%
Source: Homeowner
Survey
Shaded cells =
significantly different
from CA Program
Area @ 90%
confidence level

DNV GL © 2013
Installation of Energy Efficiency Measures in Home Improvement Projects by Program Participation Status
In CA program area, participation associated with higher rates of implementing
“Whole House Combinations”, air sealing, and duct sealing. This pattern not
present in non-program areas.
15
PROGRAM PARTICIPANTS NON-PARTICIPANTS
Program Comparison Program Comparison
CA OOS CA CA OOS CA
Received assistance from an ee program in completing project
19% 14% 13%
Multiple Measures Installed 52% 41% 31% 35% 30% 32%
Whole House Combinations
Combination of air sealing and insulation 19% 8% 4% 7% 6% 6%
Combination of shell with HVAC measures 13% 6% 4% 3% 3% 4%
Individual Measure Types
Insulation 44% 49% 28% 37% 36% 30%
Air Sealing 27% 14% 24% 16% 11% 18%
ENERGY STAR Heating Equipment 11% 3% 0% 6% 2% 3%
ENERGY STAR Cooling Equipment 36% 63% 42% 26% 41% 26%
Heating Pipe Wrap/Duct Sealing 32% 18% 9% 15% 9% 9%
Domestic Hot Water Pipe Insulation 24% 17% 8% 22% 13% 16%
Solar Photovoltaic 13% 4% 4% 3% 2% 6%
Diagnostic Tests
Blower Door 27% 14% 24% 14% 10% 16%
Duct Leakage (% of projects with heating or cooling equipment) 41% 22% 35% 29% 15% 26%
Source: Homeowner
Survey
Shaded cells =
significantly different
from CA Program
Area @ 90%
confidence level
DNV GL © 2013
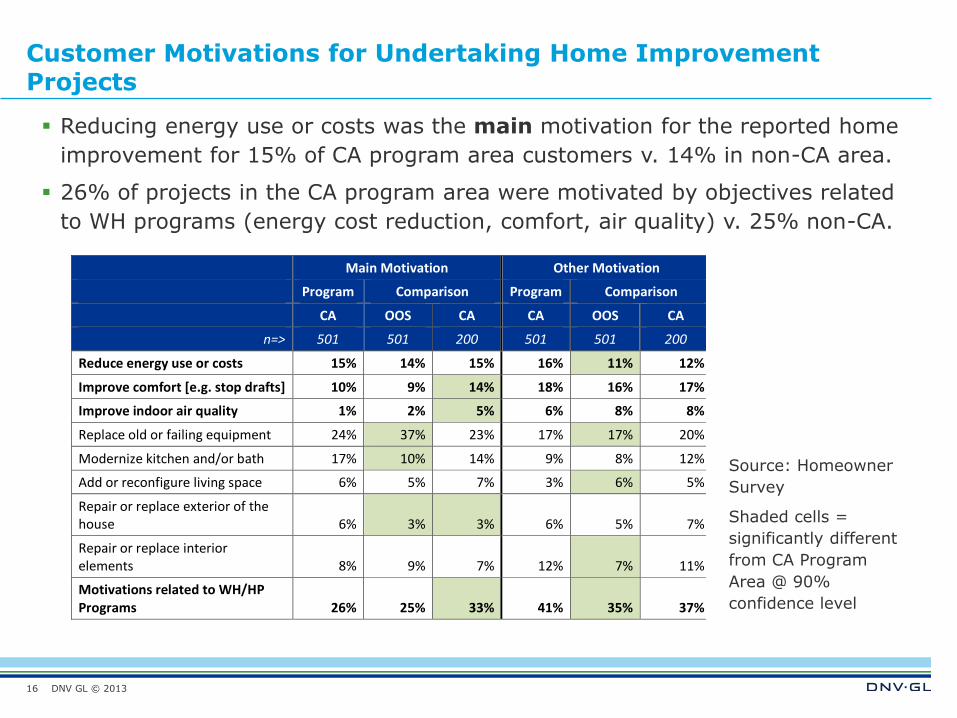
Customer Motivations for Undertaking Home Improvement Projects
Reducing energy use or costs was the main motivation for the reported home
improvement for 15% of CA program area customers v. 14% in non-CA area.
26% of projects in the CA program area were motivated by objectives related
to WH programs (energy cost reduction, comfort, air quality) v. 25% non-CA.
16
Main Motivation Other Motivation
Program Comparison Program Comparison
CA OOS CA CA OOS CA
n=> 501 501 200 501 501 200
Reduce energy use or costs 15% 14% 15% 16% 11% 12%
Improve comfort [e.g. stop drafts] 10% 9% 14% 18% 16% 17%
Improve indoor air quality 1% 2% 5% 6% 8% 8%
Replace old or failing equipment 24% 37% 23% 17% 17% 20%
Modernize kitchen and/or bath 17% 10% 14% 9% 8% 12%
Add or reconfigure living space 6% 5% 7% 3% 6% 5%
Repair or replace exterior of the house 6% 3% 3% 6% 5% 7%
Repair or replace interior elements 8% 9% 7% 12% 7% 11%
Motivations related to WH/HP Programs 26% 25% 33% 41% 35% 37%
Source: Homeowner
Survey
Shaded cells =
significantly different
from CA Program
Area @ 90%
confidence level

DNV GL © 2013
Cost of Home Improvement Projects
Roughly 50% of all reported projects in CA had reported costs above
$10,000.
Within areas, participation had little effect on the distribution of
program costs
17
0%
5%
10%
15%
20%
25%
30%
35%
Less than
$5000
Between
$5,000
and
$10,000
Between
$10,000
and
$25,000
$25,000 or
more
P: CA Prog
NP: CA Prog
0%
5%
10%
15%
20%
25%
30%
35%
Less than
$5000
Between
$5,000
and
$10,000
Between
$10,000
and
$25,000
$25,000
or more
P: Non-CA
NP: Non-CA
Distribution of Project Costs:
California Program Area
Distribution of Project Costs:
Outside California
Source: Homeowner Survey
DNV GL © 2013
Cost Barriers and Financing
Homeowner Survey Results: CA Program Area
– 13% report not installing all measures recommended by audit or
contractor
– 7% cite lack of funds as reason for not installing
– 24% of homeowners report financing projects
Process Evaluation Results
– 52% of sampled participants report not installing all recommended
measures
– 28% cite lack of funds as reason for not installing. Difference from
general homeowner population likely due to presentation of more
measures by AHU audits
– Percentage of HU/AHU projects financed: 50% in 2011; 21% in
2012
18
DNV GL © 2013
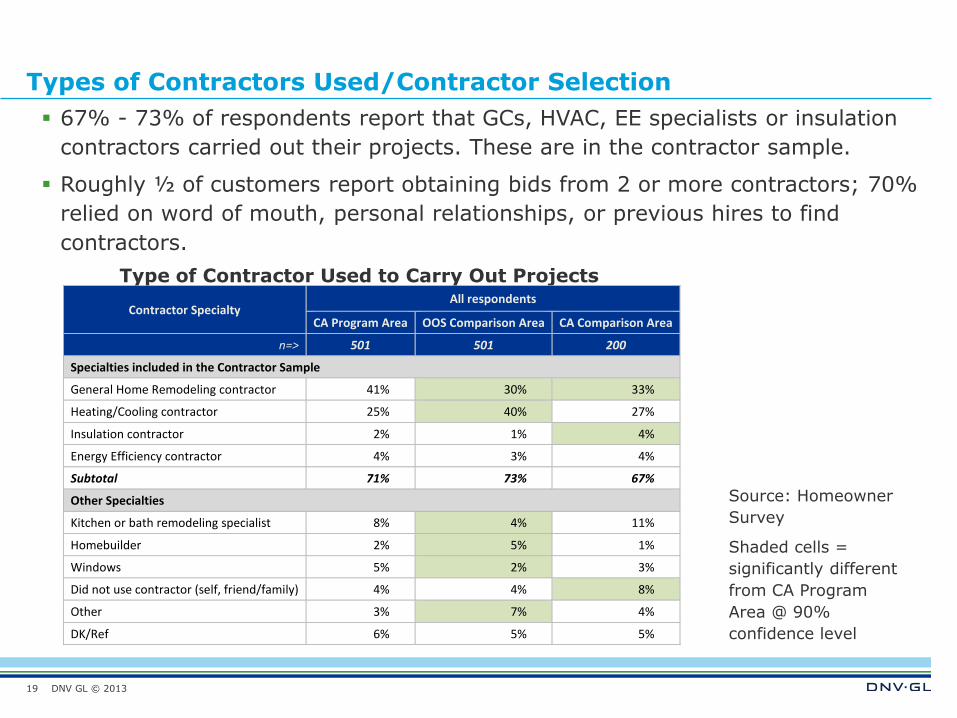
Types of Contractors Used/Contractor Selection
67% - 73% of respondents report that GCs, HVAC, EE specialists or insulation
contractors carried out their projects. These are in the contractor sample.
Roughly ½ of customers report obtaining bids from 2 or more contractors; 70%
relied on word of mouth, personal relationships, or previous hires to find
contractors.
19
Type of Contractor Used to Carry Out Projects
Contractor Specialty All respondents
CA Program Area OOS Comparison Area CA Comparison Area
n=> 501 501 200
Specialties included in the Contractor Sample
General Home Remodeling contractor 41% 30% 33%
Heating/Cooling contractor 25% 40% 27%
Insulation contractor 2% 1% 4%
Energy Efficiency contractor 4% 3% 4%
Subtotal 71% 73% 67%
Other Specialties
Kitchen or bath remodeling specialist 8% 4% 11%
Homebuilder 2% 5% 1%
Windows 5% 2% 3%
Did not use contractor (self, friend/family) 4% 4% 8%
Other 3% 7% 4%
DK/Ref 6% 5% 5%
Source: Homeowner
Survey
Shaded cells =
significantly different
from CA Program
Area @ 90%
confidence level
DNV GL © 2013
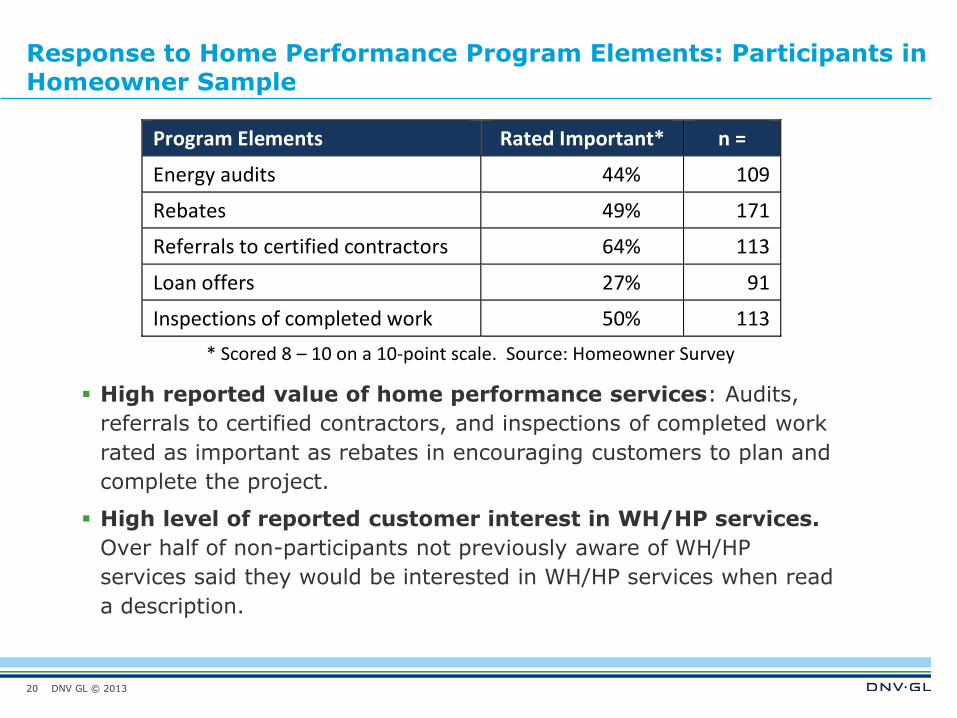
Response to Home Performance Program Elements: Participants in Homeowner Sample
High reported value of home performance services: Audits,
referrals to certified contractors, and inspections of completed work
rated as important as rebates in encouraging customers to plan and
complete the project.
High level of reported customer interest in WH/HP services.
Over half of non-participants not previously aware of WH/HP
services said they would be interested in WH/HP services when read
a description.
Program Elements Rated Important* n =
Energy audits 44% 109
Rebates 49% 171
Referrals to certified contractors 64% 113
Loan offers 27% 91
Inspections of completed work 50% 113
* Scored 8 – 10 on a 10-point scale. Source: Homeowner Survey
20

DNV GL © 2013
Nonparticipant Awareness of and Interest Whole House Programs
29% of non-participants in CA Program area were aware of program.
Similar results to Process Evaluation; significantly higher compared to OOS
and CA Program Areas
High level of reported customer interest in WH/HP services. Half of
non-participants not previously aware of WH/HP services said they would be
interested in WH/HP services
Willingness to Pay. Roughly ½ of nonparticipants report being willing to add
$5000 to project costs for energy efficiency measures with 5-year peayback
21
Perceptions of and Interest in Program Non – Participants
CA Program
OOS Comparison
CA Comparison
n=> 408 429 172
Aware of WH/HP program/program concepts 29% 13% 17%
Aware of WH/HP program prior to undertaking project 17% 8% 9%
Would have sought an assessment of energy savings opportunities if they had been aware of program prior to project.
49% 38% 53%
Would have incorporated energy saving measures that cost an additional $5000 and with a payback period of under 5 years (as a % of those willing to seek assessment of energy savings opportunities)
49% 57% 52%
Source: Homeowner Survey
DNV GL © 2013
THE CONTRACTOR MARKET
22

DNV GL © 2013
The Home Improvement/Remodeling Contracting Industry: Characterized by Very Small Firms
Forty-five percent of establishments with the majority of receipts from work on
existing homes are self-employed individuals. In 2007, over 85% had receipts
under $300,000.
Firms active in remodeling generate the majority of their revenues from new
construction.
Concentration in the remodeling industry beginning to increase. In 2007, the
largest 50 firms accounted for 7.9% of receipts.
36% of firms active in remodeling in 2003 were no longer in business in 2007.
Contractor Type
# Establishments w/ Remodeling
Receipts
Value of Total Construction
Receipts ($ Billion)
Value of Remodeling
Receipts ($ Billion)
Total Receipts/ Establishment
($ ‘000s)
General Contractor 119,400 $150.6 $64.0 $1,261
Plumbing/HVAC 57,800 $52.0 $28.7 $900
Drywall/Insulation 12,000 $13.9 $4.3 $1,158
Number and Receipts of Relevant Establishments
23
Sources: Joint Center for Housing Studies; U. S. Census
DNV GL © 2013
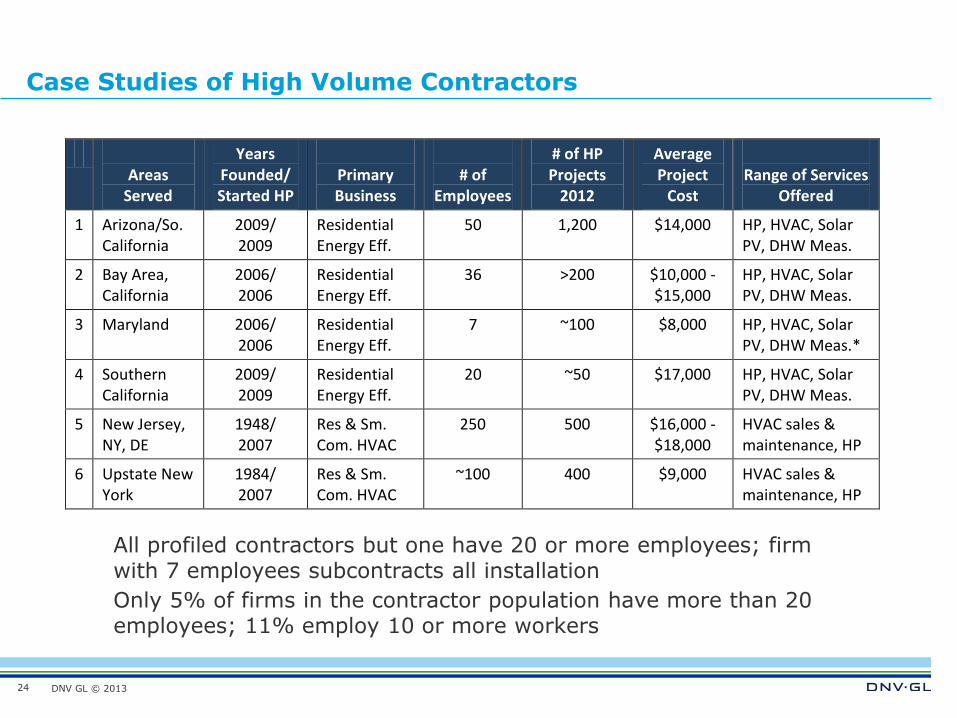
Case Studies of High Volume Contractors
24
All profiled contractors but one have 20 or more employees; firm with 7 employees subcontracts all installation
Only 5% of firms in the contractor population have more than 20 employees; 11% employ 10 or more workers
Areas
Served
Years Founded/ Started HP
Primary Business
# of
Employees
# of HP Projects
2012
Average Project
Cost
Range of Services
Offered
1 Arizona/So. California
2009/ 2009
Residential Energy Eff.
50 1,200 $14,000 HP, HVAC, Solar PV, DHW Meas.
2 Bay Area, California
2006/ 2006
Residential Energy Eff.
36 >200 $10,000 - $15,000
HP, HVAC, Solar PV, DHW Meas.
3 Maryland 2006/ 2006
Residential Energy Eff.
7 ~100 $8,000 HP, HVAC, Solar PV, DHW Meas.*
4 Southern California
2009/ 2009
Residential Energy Eff.
20 ~50 $17,000 HP, HVAC, Solar PV, DHW Meas.
5 New Jersey, NY, DE
1948/ 2007
Res & Sm. Com. HVAC
250 500 $16,000 - $18,000
HVAC sales & maintenance, HP
6 Upstate New York
1984/ 2007
Res & Sm. Com. HVAC
~100 400 $9,000 HVAC sales & maintenance, HP

DNV GL © 2013
Value Propositions and Business Models
HVAC Contractors: Add services to boost revenues and retain
customers
Today, it doesn't take a very savvy homeowner to …go on the Internet
and buy [a] furnace for the exact same cost you can go to your
wholesaler and buy it for. So there's no real margins on equipment and
you are trying to sell your quality of installation and service, which is
fine, but it becomes more and more difficult when you limit service to
just HVAC.
One Stop Shop for all benefits of energy-related home improvement
If we had bigger weather extremes, I think we'd be much busier. When
we talk to homeowners that are only focused on return on investment, I
say this program probably isn't for you. We live in paradise for a
reason. … The main motivating factors for clients are comfort and
safety. I can make every room in their house no more than two degrees
temperature difference no matter what floor it is. And that's a pretty
big selling point to people.
25
DNV GL © 2013
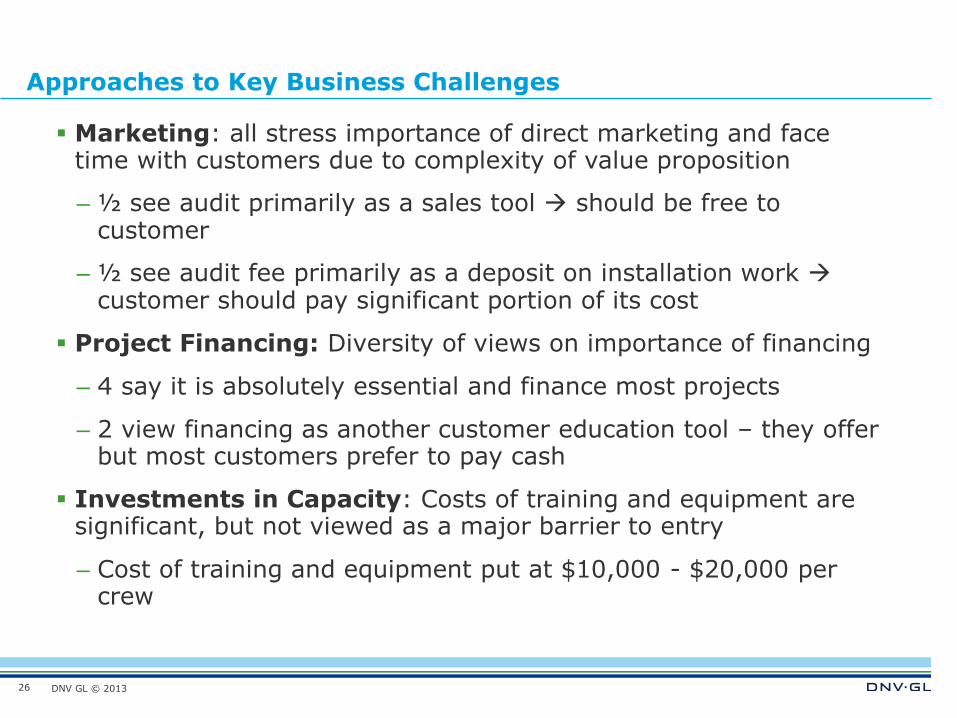
Approaches to Key Business Challenges
26
Marketing: all stress importance of direct marketing and face time with customers due to complexity of value proposition
– ½ see audit primarily as a sales tool should be free to customer
– ½ see audit fee primarily as a deposit on installation work customer should pay significant portion of its cost
Project Financing: Diversity of views on importance of financing
– 4 say it is absolutely essential and finance most projects
– 2 view financing as another customer education tool – they offer but most customers prefer to pay cash
Investments in Capacity: Costs of training and equipment are significant, but not viewed as a major barrier to entry
– Cost of training and equipment put at $10,000 - $20,000 per crew
DNV GL © 2013
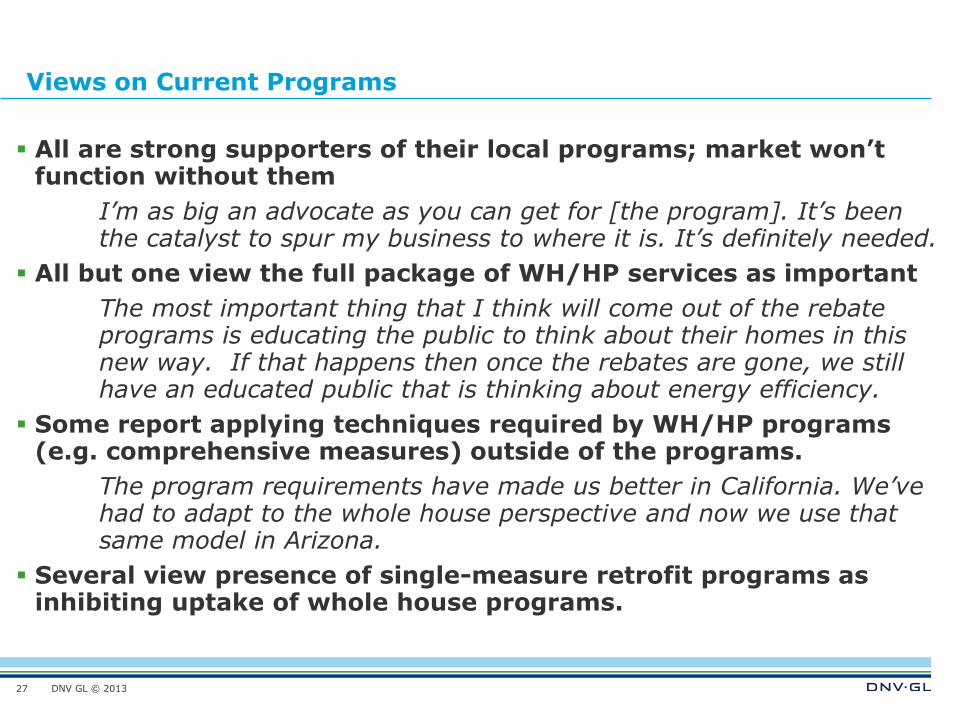
Views on Current Programs
All are strong supporters of their local programs; market won’t function without them
I’m as big an advocate as you can get for [the program]. It’s been the catalyst to spur my business to where it is. It’s definitely needed.
All but one view the full package of WH/HP services as important
The most important thing that I think will come out of the rebate programs is educating the public to think about their homes in this new way. If that happens then once the rebates are gone, we still have an educated public that is thinking about energy efficiency.
Some report applying techniques required by WH/HP programs (e.g. comprehensive measures) outside of the programs.
The program requirements have made us better in California. We’ve had to adapt to the whole house perspective and now we use that same model in Arizona.
Several view presence of single-measure retrofit programs as inhibiting uptake of whole house programs.
27
DNV GL © 2013
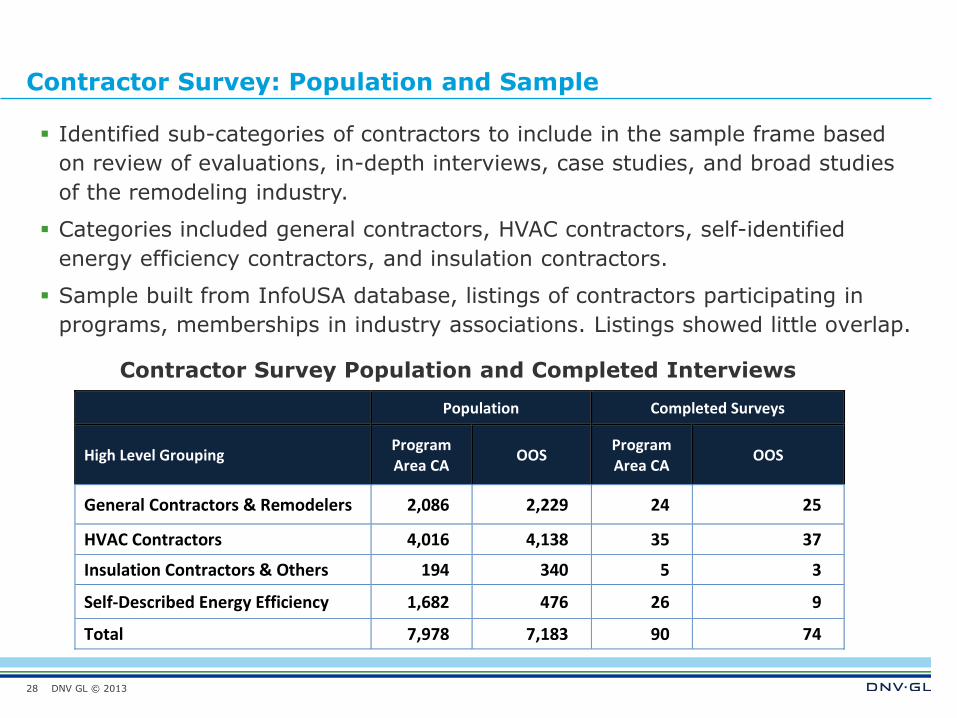
Contractor Survey: Population and Sample
Identified sub-categories of contractors to include in the sample frame based
on review of evaluations, in-depth interviews, case studies, and broad studies
of the remodeling industry.
Categories included general contractors, HVAC contractors, self-identified
energy efficiency contractors, and insulation contractors.
Sample built from InfoUSA database, listings of contractors participating in
programs, memberships in industry associations. Listings showed little overlap.
Contractor Survey Population and Completed Interviews
Population Completed Surveys
High Level Grouping Program Area CA
OOS Program Area CA
OOS
General Contractors & Remodelers 2,086 2,229 24 25
HVAC Contractors 4,016 4,138 35 37
Insulation Contractors & Others 194 340 5 3
Self-Described Energy Efficiency 1,682 476 26 9
Total 7,978 7,183 90 74
28
DNV GL © 2013
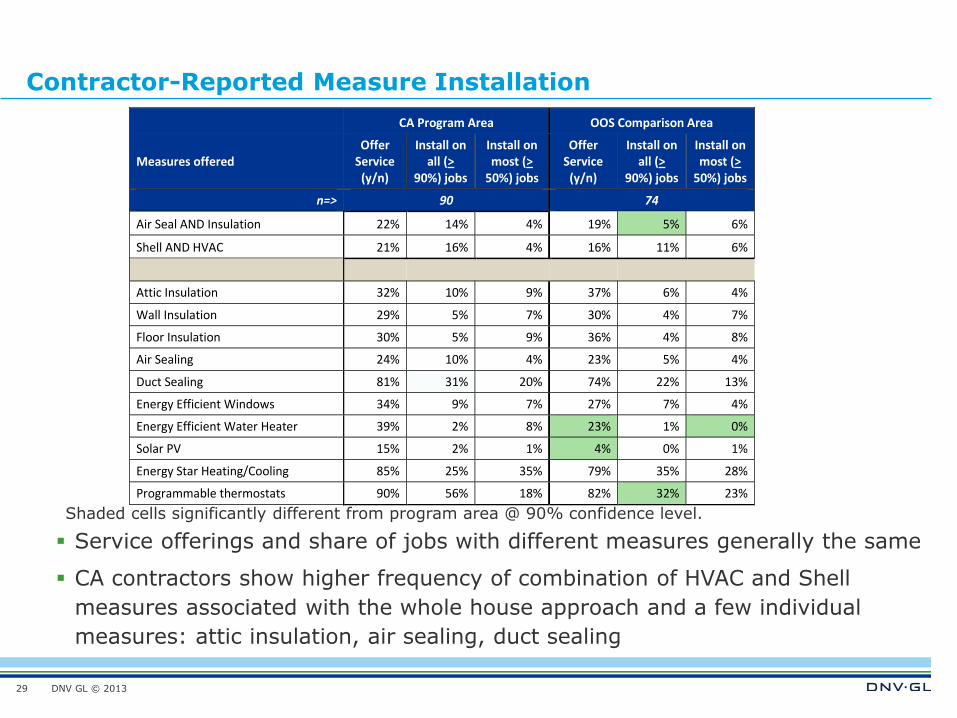
Contractor-Reported Measure Installation
29
Shaded cells significantly different from program area @ 90% confidence level.
Service offerings and share of jobs with different measures generally the same
CA contractors show higher frequency of combination of HVAC and Shell
measures associated with the whole house approach and a few individual
measures: attic insulation, air sealing, duct sealing
CA Program Area OOS Comparison Area
Measures offered Offer
Service (y/n)
Install on all (>
90%) jobs
Install on most (>
50%) jobs
Offer Service
(y/n)
Install on all (>
90%) jobs
Install on most (>
50%) jobs
n=> 90 74
Air Seal AND Insulation 22% 14% 4% 19% 5% 6%
Shell AND HVAC 21% 16% 4% 16% 11% 6%
Attic Insulation 32% 10% 9% 37% 6% 4%
Wall Insulation 29% 5% 7% 30% 4% 7%
Floor Insulation 30% 5% 9% 36% 4% 8%
Air Sealing 24% 10% 4% 23% 5% 4%
Duct Sealing 81% 31% 20% 74% 22% 13%
Energy Efficient Windows 34% 9% 7% 27% 7% 4%
Energy Efficient Water Heater 39% 2% 8% 23% 1% 0%
Solar PV 15% 2% 1% 4% 0% 1%
Energy Star Heating/Cooling 85% 25% 35% 79% 35% 28%
Programmable thermostats 90% 56% 18% 82% 32% 23%
DNV GL © 2013
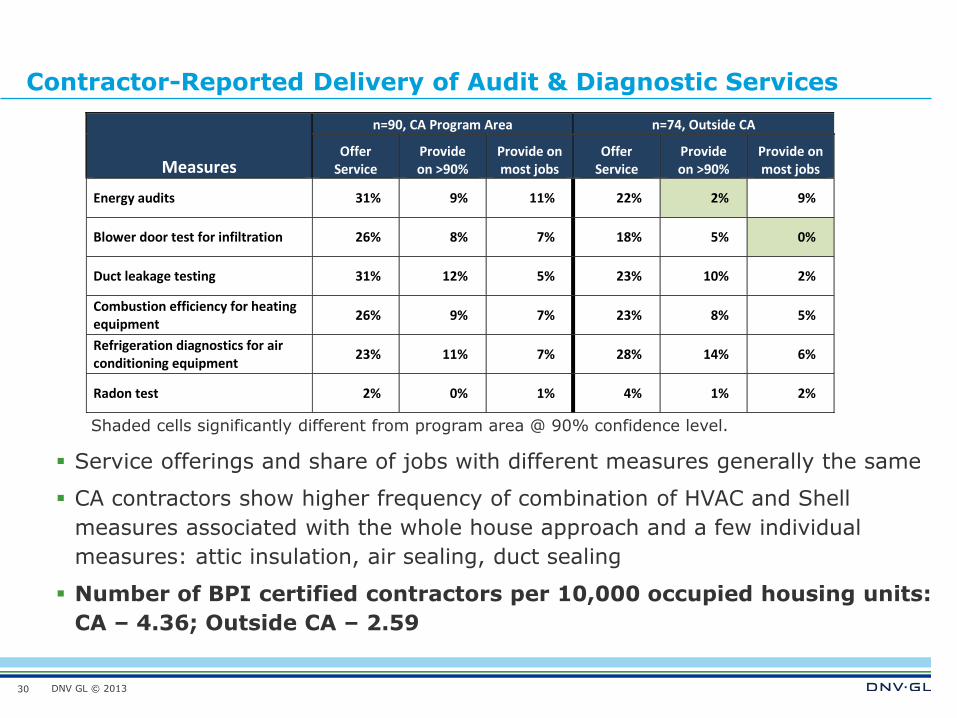
Contractor-Reported Delivery of Audit & Diagnostic Services
30
Shaded cells significantly different from program area @ 90% confidence level.
Service offerings and share of jobs with different measures generally the same
CA contractors show higher frequency of combination of HVAC and Shell
measures associated with the whole house approach and a few individual
measures: attic insulation, air sealing, duct sealing
Number of BPI certified contractors per 10,000 occupied housing units:
CA – 4.36; Outside CA – 2.59
Measures
n=90, CA Program Area n=74, Outside CA
Offer Service
Provide on >90%
Provide on most jobs
Offer Service
Provide on >90%
Provide on most jobs
Energy audits 31% 9% 11% 22% 2% 9%
Blower door test for infiltration 26% 8% 7% 18% 5% 0%
Duct leakage testing 31% 12% 5% 23% 10% 2%
Combustion efficiency for heating equipment
26% 9% 7% 23% 8% 5%
Refrigeration diagnostics for air conditioning equipment
23% 11% 7% 28% 14% 6%
Radon test 2% 0% 1% 4% 1% 2%
DNV GL © 2013
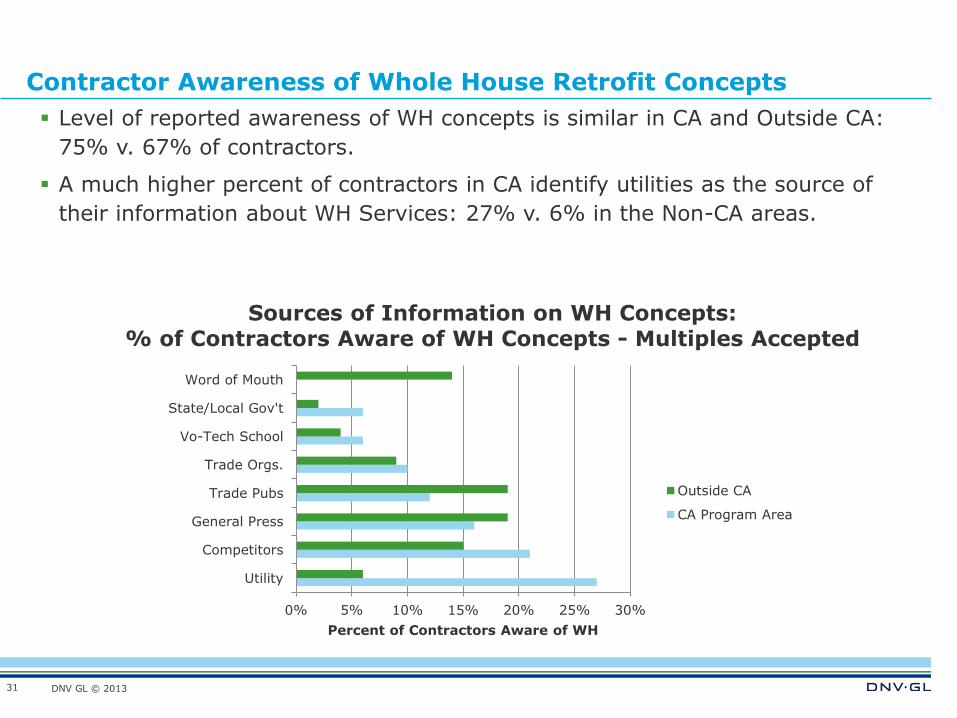
Contractor Awareness of Whole House Retrofit Concepts
31
Sources of Information on WH Concepts: % of Contractors Aware of WH Concepts - Multiples Accepted
Level of reported awareness of WH concepts is similar in CA and Outside CA:
75% v. 67% of contractors.
A much higher percent of contractors in CA identify utilities as the source of
their information about WH Services: 27% v. 6% in the Non-CA areas.
0% 5% 10% 15% 20% 25% 30%
Utility
Competitors
General Press
Trade Pubs
Trade Orgs.
Vo-Tech School
State/Local Gov't
Word of Mouth
Percent of Contractors Aware of WH
Outside CA
CA Program Area

DNV GL © 2013
Contractor Interest in Investing in WH/HP Services and Self-Assessed Capability to Deliver
32
A significantly higher portion of CA v. non-CA contractors believe that they
deliver WH/HP services now.
Prospective interest in delivering WH/HP services is equivalent in CA and the
comparison areas.
Most sample contractors believe they can deliver WH/HP services with their
current staff, with a slightly higher portion so believing outside of CA.
CA Program Area Outside CA
n=90 n=74
Would it be worthwhile for your company to invest in developing WH/HP delivery capability
Already provide 12% 4%
Yes 46% 47%
Maybe 14% 15%
No 25% 32%
Do you think you could market and deliver this kind of service with current employees? (Among those who believe WH is or may be a worthwhile investment.)
Market and deliver w current employees –yes 68% 81%
Market and deliver w current employees –no 22% 10%
Market and deliver w current employees -maybe 6% 0%
DNV GL © 2013
CONCLUSIONS AND IMPLICATIONS FOR PROGRAM STRATEGY AND
FURTHER RESEARCH
33
DNV GL © 2013
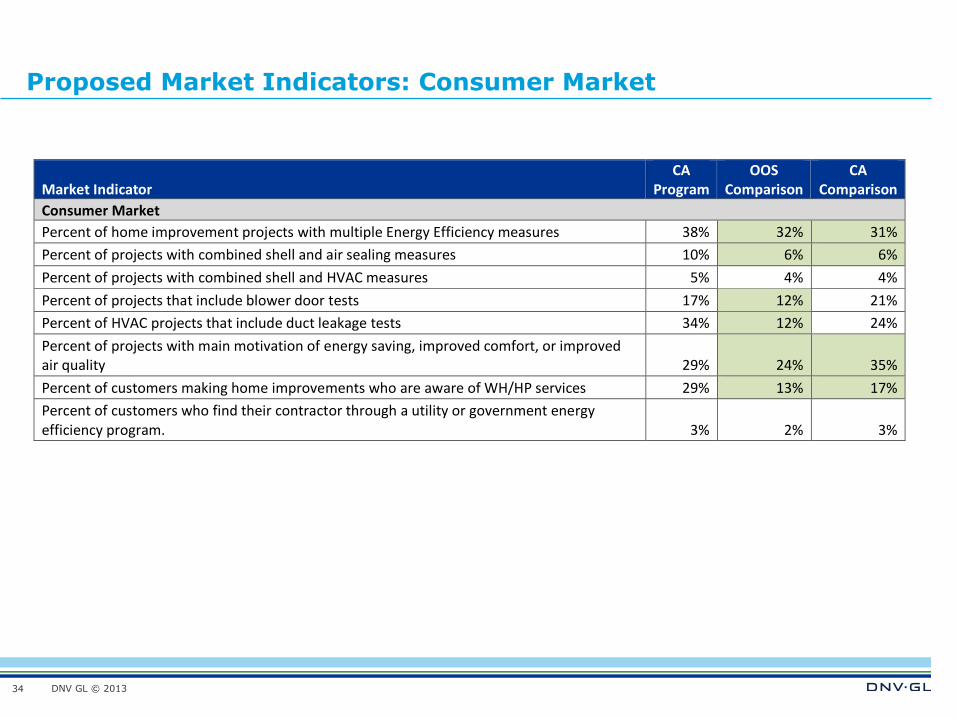
Proposed Market Indicators: Consumer Market
34
Market Indicator CA
Program OOS
Comparison CA
Comparison
Consumer Market
Percent of home improvement projects with multiple Energy Efficiency measures 38% 32% 31%
Percent of projects with combined shell and air sealing measures 10% 6% 6%
Percent of projects with combined shell and HVAC measures 5% 4% 4%
Percent of projects that include blower door tests 17% 12% 21%
Percent of HVAC projects that include duct leakage tests 34% 12% 24%
Percent of projects with main motivation of energy saving, improved comfort, or improved air quality 29% 24% 35%
Percent of customers making home improvements who are aware of WH/HP services 29% 13% 17%
Percent of customers who find their contractor through a utility or government energy efficiency program. 3% 2% 3%

DNV GL © 2013
Proposed Market Indicators: Supply Chain
35
Market Indicator CA
Program OOS
Comparison CA
Comparison
Supply Chain
Number of BPI-certified contractors per 10,000 occupied housing units 4.36 2.59
Share of market represented by contractors who deliver combined shell and air sealing measures in all or most projects 18% 11%
Share of market represented by contractors who deliver combined shell and HVAC measures in all or most projects 20% 17%
Share of market represented by contractors who deliver energy audits in all or most projects 20% 11%
Share of market represented by contractors who use blower door tests in all or most projects 15% 5%
Share of market represented by contractors who use duct leakage tests in all or most projects 17% 12%
Share of market represented by contractors aware of whole house retrofit concepts 75% 67%
Share of market represented by contractors who can accurately describe WH/HP practices 33% 30%
Share of market represented by contractors who are aware of WH/HP programs in their local markets 59% 44%
Share of market represented by contractors who report that they currently deliver WH/HP services 12 4%
DNV GL © 2013
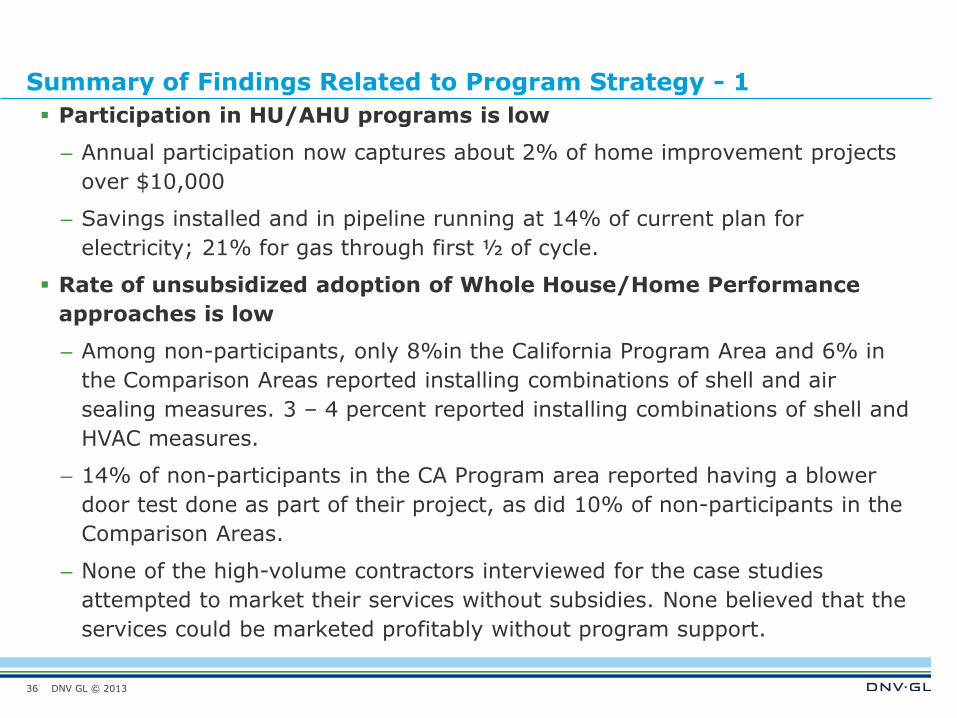
Summary of Findings Related to Program Strategy - 1
Participation in HU/AHU programs is low
– Annual participation now captures about 2% of home improvement projects
over $10,000
– Savings installed and in pipeline running at 14% of current plan for
electricity; 21% for gas through first ½ of cycle.
Rate of unsubsidized adoption of Whole House/Home Performance
approaches is low
– Among non-participants, only 8%in the California Program Area and 6% in
the Comparison Areas reported installing combinations of shell and air
sealing measures. 3 – 4 percent reported installing combinations of shell and
HVAC measures.
– 14% of non-participants in the CA Program area reported having a blower
door test done as part of their project, as did 10% of non-participants in the
Comparison Areas.
– None of the high-volume contractors interviewed for the case studies
attempted to market their services without subsidies. None believed that the
services could be marketed profitably without program support.
36
DNV GL © 2013
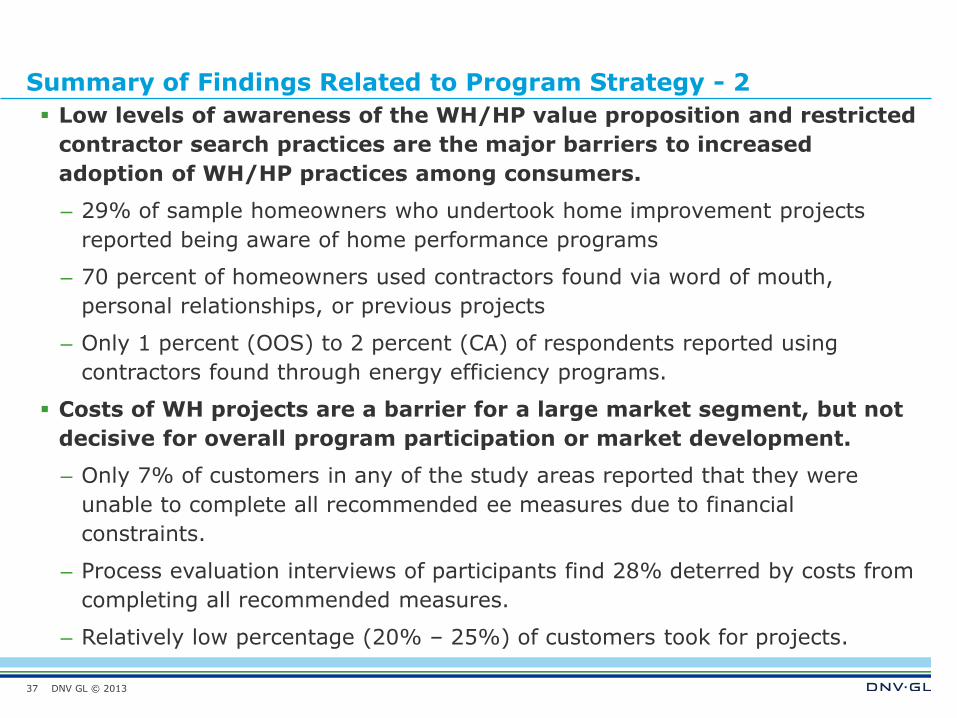
Summary of Findings Related to Program Strategy - 2
Low levels of awareness of the WH/HP value proposition and restricted
contractor search practices are the major barriers to increased
adoption of WH/HP practices among consumers.
– 29% of sample homeowners who undertook home improvement projects
reported being aware of home performance programs
– 70 percent of homeowners used contractors found via word of mouth,
personal relationships, or previous projects
– Only 1 percent (OOS) to 2 percent (CA) of respondents reported using
contractors found through energy efficiency programs.
Costs of WH projects are a barrier for a large market segment, but not
decisive for overall program participation or market development.
– Only 7% of customers in any of the study areas reported that they were
unable to complete all recommended ee measures due to financial
constraints.
– Process evaluation interviews of participants find 28% deterred by costs from
completing all recommended measures.
– Relatively low percentage (20% – 25%) of customers took for projects.
37
DNV GL © 2013
Summary Findings Related to Program Strategy - 3
Effective delivery of WH/HP services and participation in WH/HP
programs requires a scale of contractor operations beyond the
capability of the large majority home improvement industry firms.
– Case studies demonstrate that success requires investment in marketing the
services, maintaining consistency and quality of delivery, and managing flow
of technical and administrative work required by programs.
– All but one of the six high-volume contractors employed 20 or more workers.
Only 5 percent of the California contractors employed 20 or more workers.
Lack of understanding of WH/HP services and their potential business
value is the major barrier to adoption of WH/HP practices and program
participation among contractors.
– 75 percent of the home improvement market in the CA Program area
reported being aware of WH/HP service concepts, but only roughly half of
those could accurately describe the WH/HP approach.
– About ½ of all contractors in the California Program Area sample reported
being interested in the WH/HP approach. However, the population of capable
firms is limited.
38

DNV GL © 2013
Summary Findings Related to Program Strategy - 4
Progress in developing the California market: consumer market. Despite
the challenges described above to the growth of WH/HP services market
indicators do show evidence of some program effects.
– Higher level of use of multiple measures, combination of air sealing and
insulation measures and blower door tests in CA Program Area v. OOS.
– Significantly higher percentage of homeowners in CA Program area aware of
WH/HP concepts and programs (29 percent v. 13 percent in OOS)
Progress in developing the California market: supply chain. Although
contractors in the CA Program Area report offering and installing WH/HP
components in a larger share of projects than their counterparts in the OOS
Comparison Area, these differences are small. Two clear-cut differences
– The number of BPI-certified contractors, normalized for market size, is 70%
higher in the CA Program Area than in the comparison area.
– Contractor awareness of WH/HP programs higher in CA: 59% v. 44%
– Reported rate of participation is higher in CA: 28% v. 14%
– Reported adoption of WH/HP practices is higher in CA: 12% v. 4%
39
DNV GL © 2013
Implications for Program Strategy
Building Customer Demand
– Structure messaging to emphasize the full range of consumer benefits:
energy savings, comfort, preservation of home value, green values;
convenience; quality product, reduced risk due to certification/quality control
– Target direct marketing to homebuyers – many undertake large remodeling
projects upon moving in.
Build contractor motivation and capacity to deliver WH/HP services
– Focus outreach to larger contracting firms
– Equip and motivate participating contractors to do personal selling.
– Materials, case studies, scripts, organizational tools, incentives and
recognition for high volume
– Competitions among contractors on volume, innovation in marketing and
delivery
– Stable incentive system
– Stable technical rules and procedures with consistency across sponsors
40
DNV GL © 2013
Future Research
Research methods generally worked as anticipated, with some issues
– Identification of non-program areas: relatively few areas with
climate/housing stock resembling parts of CA. Program sponsors may start
up Whole House programs at any point, but the popularity of the approach
seems to be stable or declining.
– The population of contractors in the CA non-program area is very small. We
would need to offer significant incentives from the start to attract
participation in the survey.
– Generally, completing interviews with contractors was difficult. We
recommend offering significant incentives ($100 or more) to ensure timely
completion and mitigate bias.
We believe the study design can be repeated with minor modifications
to provide a meaningful comparison of market status to the baseline
conditions documented here.
Given relatively slow market progress, suggest delaying follow up
study until 2016 at the earliest.
41

DNV GL © 2013
SAFER, SMARTER, GREENER
www.dnvgl.com
42