Embed Size (px)
Citation preview
2015 PSE IRP
G - 1
Appendix G: Wholesale Market Risk
WHOLESALE MARKET RISK The Pacific Northwest (PNW) has experienced a surplus of energy and capacity since the mid-2000s, and that surplus has made it less expensive for utilities like Puget Sound Energy to meet its load needs by purchasing energy and capacity in the wholesale market rather than building new generating plants. Now that the region is forecast to move from a capacity surplus to a deficit in the next decade, it is time to re-evaluate this strategy. Currently, PSE relies on up to 1,666 MW of wholesale market purchases to meet its winter peak load obligations, but continuing this degree of reliance on wholesale market purchases will expose
PSE and its customers to increasing financial and physical supply risks under regional deficit conditions. This appendix explores those risks.
Contents: G-2. EXECUTIVE SUMMARY G-4. REGIONAL RESOURCE BALANCE IS CHANGING
• The Origins of the Surplus • The Origins of the Deficit • Regional Load/Resource Forecasts • Questions Raised by the Regional
Forecasts G-12. PSE’S MARKET RELIANCE
• Time to Re-evaluate Strategy • Growing Risks • Mechanisms for Reducing Risk
G-16. HOW THE PACIFIC NORTHWEST POWER MARKETS WORK
• General Market Structure • Spot and Forward Markets • Key Market Characteristics • The WSPP Agreement • Price Caps
G-22. WHOLESALE MARKET RELIABILITY ANALYSIS
• Modeling Physical Supply Risk • The GENESYS Model • The PSE Wholesale Purchase
Curtailment Model (WCPM) • Calculating the Capacity
Contribution of Wholesale Market Purchases
• Other Modeling Considerations and Uncertainties
2015 PSE IRP
G - 2
Appendix G: Wholesale Market Risk
EXECUTIVE SUMMARY The long-term load/resource studies developed by several of the region’s major energy organizations, NPCC, PNUCC and BPA,1 differ in some details, but all of the forecasts point in the same direction: The Pacific Northwest (PNW) energy and capacity surplus will cross over to deficit at some point in the next decade unless new resources are developed. Based upon current information, and assuming that all independently owned generation located within the PNW will be available to serve PNW peak loads, the region will transition from a winter peak surplus of 1,975 MW in 2016 to a winter peak deficit of 3,110 MW in 2025.2 Several analyses indicate that under deficit conditions PNW load curtailment events will be much larger than has been typically experienced – averaging 1,950 MW and in excess of 10,000 MW for some hours – and may last much longer.3 The current loss of load probability planning standard, which measures the frequency of potential load curtailment events, may not be sufficient to fully assess the risks that the region faces under capacity deficit conditions. As the region approaches resource inadequacy, we must sharpen our pencils and consider the magnitude and duration of potential load curtailments in addition to their frequency. Load curtailments would impose significant costs and inconvenience on PSE’s customers; on the other hand, additional resources to improve reliability are also costly. PSE would be particularly vulnerable to large PNW load curtailments, since it is one of the region’s largest purchasers of wholesale power; how such curtailments would ripple through the market is a key concern. Some of PSE’s wholesale power supplies originate with other load-serving utilities, and those utilities may need to withhold or withdraw market sales in order to serve their own loads as their own capacity surpluses shrink under deficit conditions, further limiting supplies available to PSE.
1 / The Northwest Power and Conservation Council (NPCC or the Council), the Pacific Northwest Utilities Conference Committee (PNUCC) and the Bonneville Power Administration (BPA). 2 / Based on information provided in PNUCC’s 2015 Northwest Region Forecast and BPA’s 2014 Pacific Northwest Loads and Resources Study. The cited figures include firm imports from California but do not include other short-term imports that may be available. 3 / Based on the Northwest Power and Conservation Council’s draft Pacific Northwest Power Supply Adequacy Assessment for 2020 and 2021 (May 6, 2015).
2015 PSE IRP
G - 3
Appendix G: Wholesale Market Risk
Certain characteristics of the region’s wholesale market transactions also contribute to the risk profile in deficit conditions. Three are particularly important: Many transactions are financially firm but not physically firm. Any wholesale physical power sale is subject to curtailment. And, aside from paying liquidated damages, the non-performing party may have no obligation to replace the physical supply of power to the buyer; the buyer must locate and contract for replacement power. Those who rely heavily on wholesale market power purchases would be exposed to financial and physical risks that are very high, and potentially even extreme. Prices can rise dramatically in times of scarcity, and in some conditions, there may not physically be enough energy or capacity within the region to meet firm loads. SUMMARY OF FINDINGS In prior IRPs, PSE assumed that wholesale market purchases were 100 percent reliable. Although past NPCC adequacy analyses had demonstrated that technically, regional capacity would not be sufficient in all circumstances, the region continued to pass peak load adequacy tests, so refining that assumption was not a high priority. In this IRP, we align our Resource Adequacy Model (RAM) with the regional reliability models to translate the regional load curtailments forecast by the NPCC and BPA models to PSE-level impacts. Once we accomplished this, we applied the same analytical approach to evaluating the capacity contribution of wholesale market purchases that we use for all other resources. Capacity contribution refers to the peak capacity contribution of a resource relative to that of a gas-fired peaking plant (this is also referred to as the incremental capacity equivalent). It is calculated as the change in capacity of a generic natural gas peaking plant that results from adding a different resource with any given energy production characteristics to the system while keeping the target reliability metric constant. Figure G-1, summarizes the findings of this analysis. It shows the peak capacity contribution of wholesale market purchases to PSE’s portfolio, starting in 2021.4
Figure G-1: Capacity Contribution of Wholesale Market Purchases
2021
Maximum Capacity of Market Reliance (MW) 1,666
Effective Capacity Contribution 1,397
Reduction in Capacity Contribution with Risk in Market Reliance 269
Incremental Capacity Equivalence (ICE) 84% (= 1,397 / 1,666)
4 / Additional details regarding the peak capacity contribution of wholesale market purchases are contained in Appendix N.
2015 PSE IRP
G - 4
Appendix G: Wholesale Market Risk
REGIONAL RESOURCE BALANCE IS CHANGING The Origins of the Surplus One response to the 2000-2001 west coast energy crisis was the development of many new generating plants in California and the Pacific Northwest. By 2005, approximately 3,500 MW of new generating capacity had been added in the PNW, most of it in the form of gas-fired combined-cycle combustion turbine (CCCT) plants. Some were developed by load-serving utilities, others by independent power producers (IPPs) who built “merchant plants” to sell power directly into the region’s short- and long-term wholesale markets. By the mid-2000s, however, conditions had changed. The rapid utility load growth of the late 1990s had slowed, and natural gas prices were relatively low. This combination of events resulted in large energy and capacity surpluses in the PNW region. For a decade, these surpluses have enabled many utilities, including PSE, to use wholesale market purchases to meet load obligations with a high degree of confidence in the reliability of both physical supply and reasonable prices. The Origins of the Deficit Today, a different combination of circumstances is expected to produce a capacity deficit in the region within the next 10 years. Factors include load growth, the increasing need for balancing capacity and generating plant retirements.
• Load Growth: The region’s loads – especially peak loads – are slowly growing again after the 2008-2009 recession.
• Growth in Intermittent Resources: Renewable wind and solar plants have been the focus of most new construction in the region, primarily due to state-mandated renewable energy portfolio targets. The variability of these intermittent resources has substantially increased the region’s need for balancing capacity.
• Coal Plant Retirements: Between 2020 and 2025, the Pacific Northwest will lose 2,045 MW of generating capacity and approximately 1,750 aMW of annual energy production as several coal plants are shut down: Boardman (585 MW capacity) and Centralia Unit 1 (730 MW capacity) in 2020, and Centralia Unit 2 in 2025 (730 MW capacity).
In particular, the region’s ability to reliably meet firm winter season peak loads and operating reserve obligations is a concern even after including imports from California, as will be discussed below.
2015 PSE IRP
G - 5
Appendix G: Wholesale Market Risk
Several regional entities, including NPCC, the PNUCC and BPA have forecast that the combination of moderate PNW load growth and the loss of over 2,000 MW of coal-fired generation in 2020 and 2025 will result in large future regional winter capacity deficits. Regional Load/Resource Forecasts The long-term load/resource studies developed by NPCC, PNUCC and BPA differ in some details, but all of the forecasts point in the same direction: The Pacific Northwest capacity surplus will cross over to deficit at some point in the next decade unless new resources are developed. These studies are summarized below, and copies or web links to the reports are included in Appendix F, Regional Resource Adequacy. NPCC Regional Adequacy Studies for 2020 and 2021. On May 6, 2015, the NPCC published its draft Pacific Northwest Power Supply Adequacy Assessment for 2020-21. These studies focused on the region’s ability to meet the peak load planning criteria adopted by the Council, which is a 5 percent Loss of Load Probability (LOLP). These LOLP studies incorporated complex modeling of the region’s hydroelectric resources and included IPP plants located in the PNW, potential short-term power imports from California, and demand-side management consistent with the Sixth Power Plan. Rather than producing traditional load/resource tables, the NPCC studies produced a series of regional PNW load curtailment events that occur under different scenarios that model varying levels of hydro and wind generation, regional loads and thermal plant forced outages.
NPCC’s 2021 study indicates that in order for the PNW to meet the 5 percent LOLP planning standard, the region would need to add 1,150 MW of new gas-fired generating capacity. The NPCC analysis assumes the following conditions.
• That approximately 700 MW of “emergency” generating resources could be used (on an annual energy-limited basis) to help meet regional peak loads, including 300 MW of backup diesel generators owned by Portland General Electric (PGE) and 300 MW at the Keys pumped storage plant.
• That the 650 MW Grays Harbor gas-fired CCCT plant located in the Puget Sound area could be fully utilized to meet regional peak load needs. (This is problematic, however, since the plant has neither firm gas pipeline capacity nor backup oil supply.)
• That spot market power amounting to 2,500 MW (for on-peak hours) and 3,000 MW (for off-peak hours) could be imported from California during winter peak conditions.
2015 PSE IRP
G - 6
Appendix G: Wholesale Market Risk
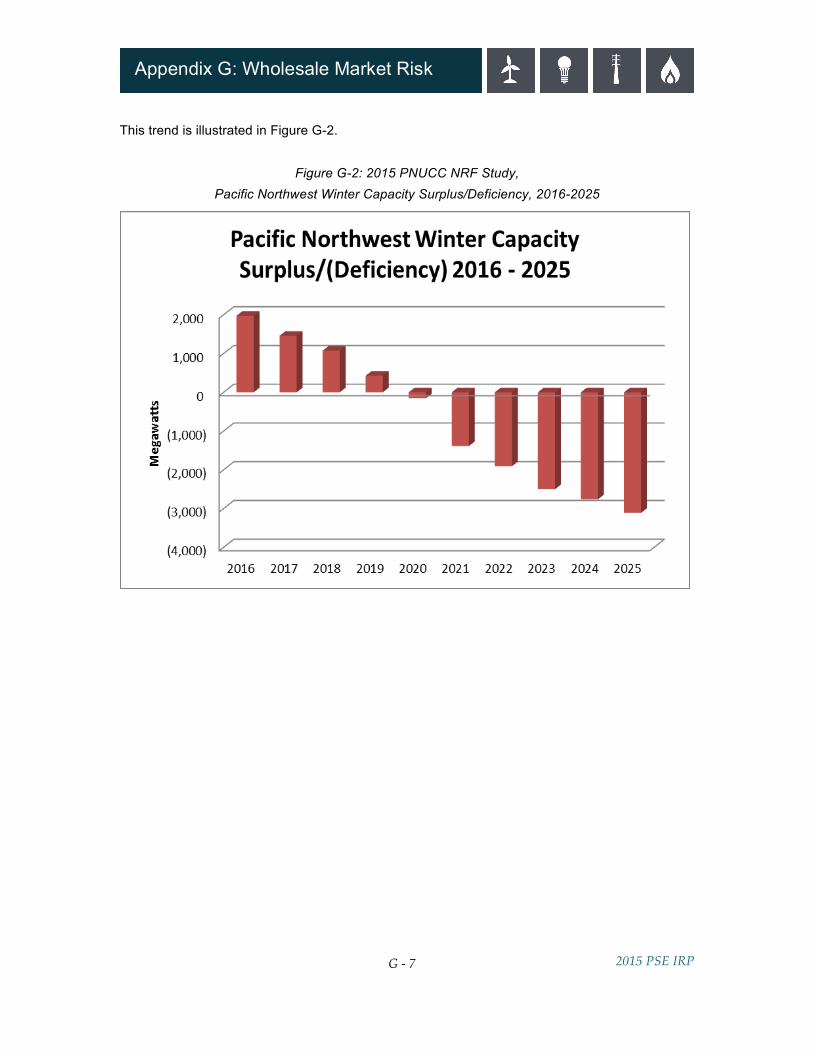
PNUCC Northwest Regional Forecast for 2016 – 2025. PNUCC’s annual Northwest Regional Forecast of Power Loads and Resources (the NRF) was published in April 2015. This analysis aggregates data from the region’s electric utilities to produce region-wide load/resource projections over a 10-year time frame (net of conservation), with particular focus on annual energy and winter season capacity surpluses and/or deficits. The NRF also provides information on the amount of IPP generation located in the region that may be available to serve PNW firm loads. The 2015 NRF covers the period 2016 – 2025. The results of the 2015 NRF indicate that in 2021 the region is forecasted to be 4,288 MW deficient in meeting its winter peak load obligations. This figure is based upon the utility-owned or controlled resources located within the PNW region that are known to be dedicated to serving firm PNW loads, plus 425 MW of long-term firm purchased power agreement (PPA) imports from California. In the PNUCC forecast, if all IPP owned generation located within the region is assumed to be available to serve PNW winter peak loads, the 2021 winter capacity deficit is approximately 1,390 MW. The NRF forecast does not include any potentially available spot market imports from California. While looking at surplus/deficit figures for the year 2021 is useful, it is even more important to recognize the long-term trend. Based upon current information, and assuming that all IPP generation will be available to serve PNW peak loads, the region will transition from a 2016 winter season peak load surplus of approximately 1,975 MW to a peak load deficit of 3,110 MW in 2025.
2015 PSE IRP
G - 7
Appendix G: Wholesale Market Risk
This trend is illustrated in Figure G-2.
Figure G-2: 2015 PNUCC NRF Study, Pacific Northwest Winter Capacity Surplus/Deficiency, 2016-2025
2015 PSE IRP
G - 8
Appendix G: Wholesale Market Risk
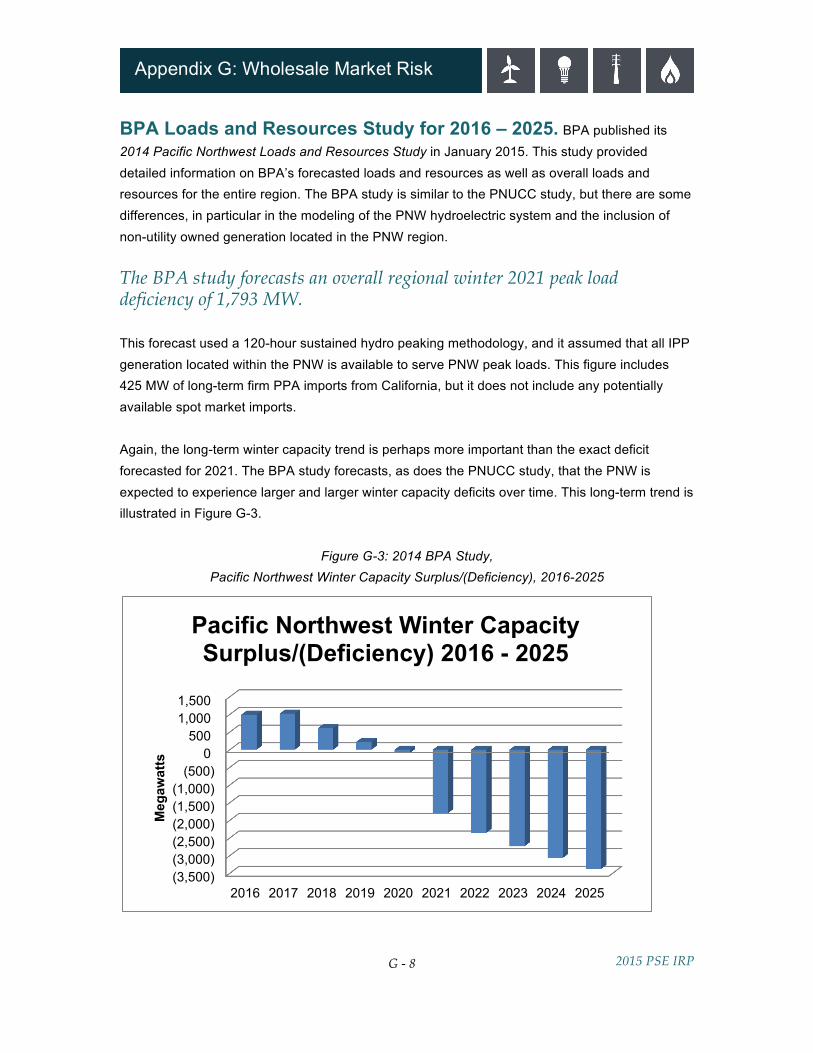
BPA Loads and Resources Study for 2016 – 2025. BPA published its 2014 Pacific Northwest Loads and Resources Study in January 2015. This study provided detailed information on BPA’s forecasted loads and resources as well as overall loads and resources for the entire region. The BPA study is similar to the PNUCC study, but there are some differences, in particular in the modeling of the PNW hydroelectric system and the inclusion of non-utility owned generation located in the PNW region. The BPA study forecasts an overall regional winter 2021 peak load deficiency of 1,793 MW. This forecast used a 120-hour sustained hydro peaking methodology, and it assumed that all IPP generation located within the PNW is available to serve PNW peak loads. This figure includes 425 MW of long-term firm PPA imports from California, but it does not include any potentially available spot market imports. Again, the long-term winter capacity trend is perhaps more important than the exact deficit forecasted for 2021. The BPA study forecasts, as does the PNUCC study, that the PNW is expected to experience larger and larger winter capacity deficits over time. This long-term trend is illustrated in Figure G-3.
Figure G-3: 2014 BPA Study,
Pacific Northwest Winter Capacity Surplus/(Deficiency), 2016-2025
(3,500) (3,000) (2,500) (2,000) (1,500) (1,000)
(500) 0
500 1,000 1,500
2016 2017 2018 2019 2020 2021 2022 2023 2024 2025
Meg
awat
ts
Pacific Northwest Winter Capacity Surplus/(Deficiency) 2016 - 2025
2015 PSE IRP
G - 9
Appendix G: Wholesale Market Risk
Questions Raised by the Regional Forecasts Do additional metrics need to be considered? The NPCC’s study analyzes PNW regional electric reliability from the perspective of the LOLP planning metric developed by the Council and adopted by some utilities – including PSE. This planning standard requires utilities to have sufficient peaking resources available to fully meet their firm peak load and operating reserve obligations in 95 percent of simulated market conditions. The LOLP metric measures the likelihood of having one or more regional load curtailment events in a sample year, but it provides no information about the frequency of events within a simulation, the magnitude or duration of those events, nor the benefits or costs to customers of electric service reliability. Some analyses suggest that both the length and breadth of potential outages could increase significantly under regional capacity deficit conditions. Several PNW utilities and NPCC staff have expressed interest in evaluating and potentially adopting additional metrics to provide regional resource planning stakeholders with a more complete picture of the region’s ability to reliably meet peak load and reserve obligations.
• The Expected Unserved Energy (EUE) metric is a quantitative measure of the magnitude of the load curtailments.
• The Loss of Load Expectation (LOLE) metric, also called the Loss of Load Hours (LOLH), provides information about the duration of the curtailment events.
With this IRP, PSE is shifting from LOLP to EUE as the primary reliability metric for computing its capacity planning margin, since the EUE metric can be used to determine the value of lost loads (VOLL) for the PSE system. This information, in turn, is utilized to identify the economically optimal point where the marginal costs of adding new generating capacity to increase reliability to customers is equal to the marginal benefit created by avoiding supply-driven customer outages.5
5 / A complete discussion of VOLL and the associated benefit/cost analysis for increasing customer reliability is included in Appendix N.
2015 PSE IRP
G - 10
Appendix G: Wholesale Market Risk
LARGER CURTAILMENTS. The EUE metric and the PNW load curtailment volumes from the Council’s 2020-21 resource assessment studies are of particular concern to PSE. Several of the curtailment events from the Council’s LOLP model are extremely large – in excess of 10,000 MW for some hours – and the average hourly curtailment value in simulations where there is an outage is approximately 1,950 MW. Since PSE is a large purchaser of wholesale market capacity in the winter months (up to 1,666 MW in 2021, with an average peak deficiency of approximately 1,600 MW), it is possible that under some conditions PSE may not physically be able to purchase enough capacity to meet its peak load and operating reserve obligations. Are energy and capacity imports from California a solution? The high-voltage AC and DC interties that connect the Pacific Northwest with California were designed to facilitate large transfers of energy and capacity between the two regions. Imports and exports on these interties allow load-serving utilities to take advantage of seasonal load variations, since California peaks in the summer and the Pacific Northwest peaks in the winter. How much power from California will be available to import for meeting winter peak loads in the future? This is a topic of great interest to the region’s resource planners. Determining the amount of power that can reliably be imported from California under winter peak conditions is a complex exercise that involves modeling all of the loads and resources within the Western Electricity Coordinating Council (WECC) and all of the associated transmission lines’ transfer path ratings. Recent BPA studies that have been vetted by several regional stakeholders (including the NPCC’s Resource Adequacy Advisory Committee) have determined that up to 3,400 MW of energy and capacity could be imported from California under winter peaking conditions during on-peak hours. However, currently only 425 MW of imports from California are contracted under long-term firm PPAs for the on-peak hours of the winter of 2020-2021. Of that amount, 300 MW is associated with PSE’s power exchange agreement with PG&E (Pacific Gas & Electric). The remaining 2,975 MW of south-to-north intertie capability could be used to import spot market power purchases from California.
2015 PSE IRP
G - 11
Appendix G: Wholesale Market Risk
Curtailment Risks. The potential for forced outages and/or derates on the transmission interties to California is an area of concern for both the PNW region and PSE. Under the conditions discussed above, both the long-term firm imports (425 MW) and the spot market purchases (up to 2,975 MW) would be subject to curtailment.
• According to the regional load/resource forecasts described above, the region will be relying on approximately 1,400 MW to 3,000 MW of California spot market purchases to meet peak loads and operating reserve obligations for the winter of 2020-2021. Should the California interties go out of service during a winter peaking event, the region as a whole could face an immediate, large load curtailment event, since it may not have enough internal generating capacity to meet its firm peak loads.
• For PSE, a forced outage or derate on the California interties could mean losing up to 300 MW of PG&E exchange capacity plus any spot market purchases PSE might be making from California suppliers.
2015 PSE IRP
G - 12
Appendix G: Wholesale Market Risk
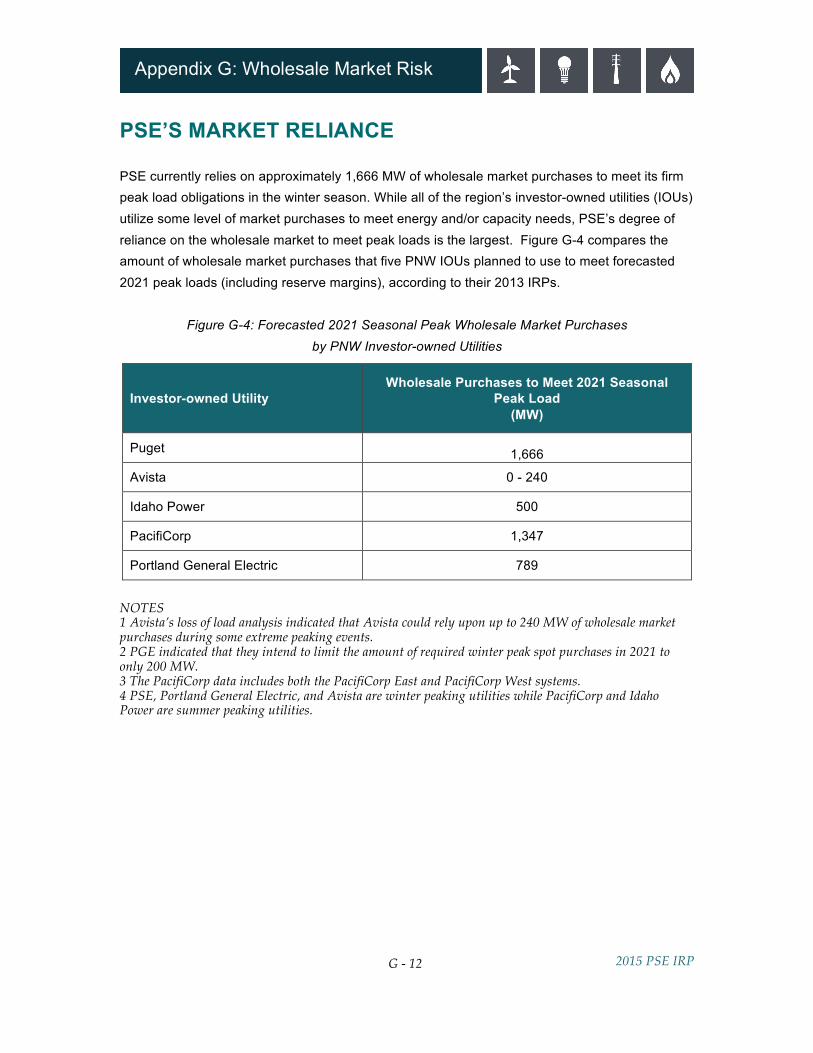
PSE’S MARKET RELIANCE PSE currently relies on approximately 1,666 MW of wholesale market purchases to meet its firm peak load obligations in the winter season. While all of the region’s investor-owned utilities (IOUs) utilize some level of market purchases to meet energy and/or capacity needs, PSE’s degree of reliance on the wholesale market to meet peak loads is the largest. Figure G-4 compares the amount of wholesale market purchases that five PNW IOUs planned to use to meet forecasted 2021 peak loads (including reserve margins), according to their 2013 IRPs.
Figure G-4: Forecasted 2021 Seasonal Peak Wholesale Market Purchases by PNW Investor-owned Utilities
Investor-owned Utility Wholesale Purchases to Meet 2021 Seasonal
Peak Load (MW)
Puget 1,666
Avista 0 - 240
Idaho Power 500
PacifiCorp 1,347
Portland General Electric 789
NOTES 1 Avista’s loss of load analysis indicated that Avista could rely upon up to 240 MW of wholesale market purchases during some extreme peaking events. 2 PGE indicated that they intend to limit the amount of required winter peak spot purchases in 2021 to only 200 MW. 3 The PacifiCorp data includes both the PacifiCorp East and PacifiCorp West systems. 4 PSE, Portland General Electric, and Avista are winter peaking utilities while PacifiCorp and Idaho Power are summer peaking utilities.
2015 PSE IRP
G - 13
Appendix G: Wholesale Market Risk
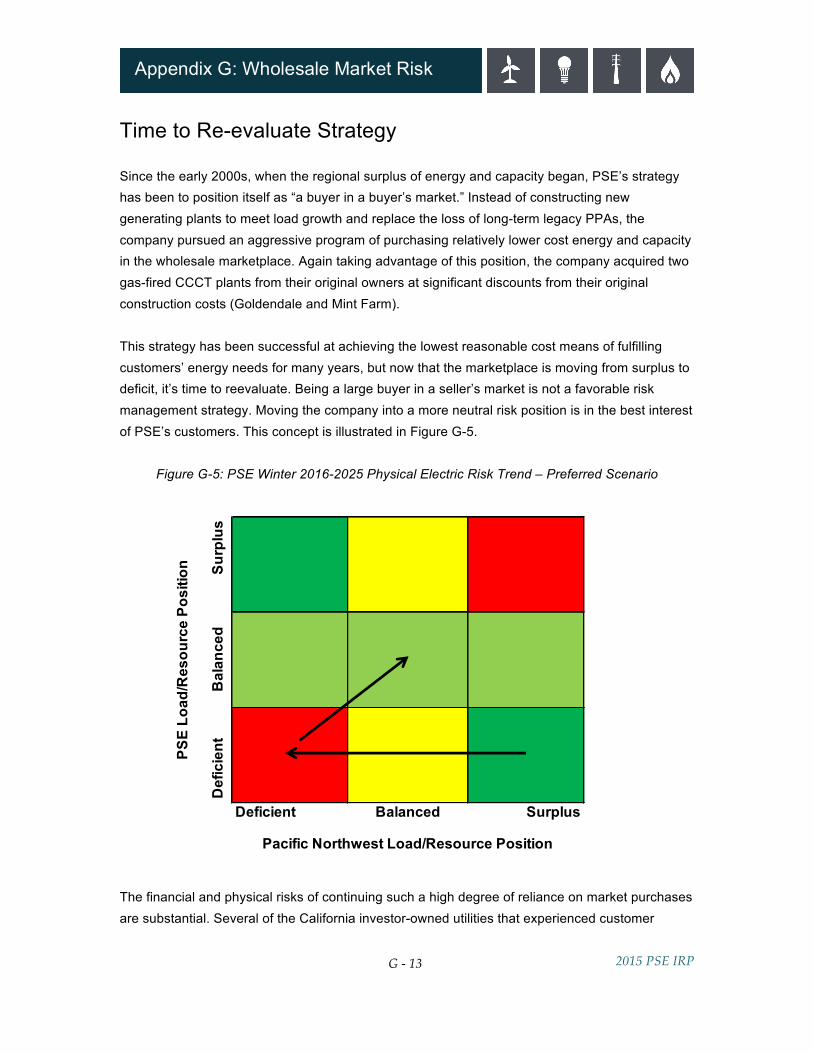
Time to Re-evaluate Strategy Since the early 2000s, when the regional surplus of energy and capacity began, PSE’s strategy has been to position itself as “a buyer in a buyer’s market.” Instead of constructing new generating plants to meet load growth and replace the loss of long-term legacy PPAs, the company pursued an aggressive program of purchasing relatively lower cost energy and capacity in the wholesale marketplace. Again taking advantage of this position, the company acquired two gas-fired CCCT plants from their original owners at significant discounts from their original construction costs (Goldendale and Mint Farm). This strategy has been successful at achieving the lowest reasonable cost means of fulfilling customers’ energy needs for many years, but now that the marketplace is moving from surplus to deficit, it’s time to reevaluate. Being a large buyer in a seller’s market is not a favorable risk management strategy. Moving the company into a more neutral risk position is in the best interest of PSE’s customers. This concept is illustrated in Figure G-5.
Figure G-5: PSE Winter 2016-2025 Physical Electric Risk Trend – Preferred Scenario
The financial and physical risks of continuing such a high degree of reliance on market purchases are substantial. Several of the California investor-owned utilities that experienced customer
Deficient Surplus
PSE
Load
/Res
ourc
e Po
sitio
n Surp
lus
Def
icie
nt
Pacific Northwest Load/Resource Position
Balanced
Bal
ance
d
2015 PSE IRP
G - 14
Appendix G: Wholesale Market Risk
blackouts in 2000 and 2001 found themselves exposed in exactly this way when Pacific Northwest and Desert Southwest wholesale power supplies became limited. This combination of circumstances resembles the PNW today in some respects. Factors included 1) long-term load growth, 2) little new power plant development within the state, 3) drought conditions in the Pacific Northwest, and 4) out-of-California utilities needing to conserve scarce power supplies in order to meet their own load-serving obligations. Growing Risks The following risks are of greatest concern to PSE. The Size and Duration of Potential Curtailments. The LOLP studies conducted by NPCC indicated that the region could experience very large load curtailments during the winter of 2020-2021. Under some sets of weather, load and resource availability conditions, they could exceed 10,000 MW. In simulations where outages do occur, the average load curtailment amount – approximately 1,950 MW – is significant. How Curtailments May Be Implemented. If and when regional load curtailments occur, what will they look like? Some of PSE’s future wholesale power supplies will likely originate with load-serving utilities in the region. As these load-serving utilities move closer to load/resource balance, the power supplies that PSE has relied upon for purchase from these entities may be limited – or no longer available at all – as they strive to meet their own load-serving obligations. Physical Supply Availability. Under the conditions in the regional forecasts described earlier, there may not physically be enough energy and capacity available within the PNW (including from spot market imports from California) to meet all of the region’s firm loads. So, one or more PNW load-serving entities would be forced to curtail service to its customers. Since PSE is the largest purchaser of winter capacity in the region, PSE’s customers would be especially exposed during regional curtailment events, because large portions of the energy and capacity that PSE was counting on to purchase would simply not be available.
2015 PSE IRP
G - 15
Appendix G: Wholesale Market Risk
Mechanisms for Reducing Risk Acquiring new sources of generation or building new generation are two mechanisms for reducing exposure to the financial and physical risks of the wholesale market. They have very different impacts on regional conditions. If PSE were to acquire currently existing sources of generation, it would act as a hedge against the uncertainties and volatility of the wholesale power markets. It would also help PSE reduce its dependence on entities that may or may not have surplus power available to meet the needs of PSE’s customers. However, acquiring an existing resource located in the region would not change the region’s overall surplus/deficit picture. Building new generation, on the other hand, would add new incremental supply to the PNW region, which in turn would reduce PSE’s wholesale market physical and financial supply risk.
2015 PSE IRP
G - 16
Appendix G: Wholesale Market Risk
HOW THE PACIFIC NORTHWEST POWER MARKETS WORK To understand the physical and financial risks that will confront load-serving utilities as energy and capacity supplies grow tighter, it is helpful to understand how the region’s wholesale power market is structured and the rules that govern purchase and sale transactions. These are described below. Three conditions are particularly important:
• Many transactions are financially firm but not physically firm. • Any sale is subject to curtailment. • And, aside from paying liquidated damages, the non-performing party may have no
obligation to replace the physical supply of power to the buyer; the buyer must locate and contract for replacement power.
General Market Structure Most wholesale power transactions that take place in the WECC are bilateral transactions.6 The seller and purchaser (sometimes aided by a broker) negotiate the terms and conditions of each individual transaction. No central market entity establishes a price that applies to all transactions. For the same power product and delivery period, the price and terms established for a transaction between counterparties A and B has no direct impact on a transaction negotiated between counterparties C and D. For each transaction, participants are free to negotiate power delivery durations as short as 15 minutes or as long as many years, and purchase/sale commitments can be entered into at almost any time, especially for transactions that are several days in duration or longer.
6 / One area of the WECC has a different market structure. This is the CAISO system that covers a large portion of California. The CAISO uses a centralized bidding process to operate several short-term, single-price auction markets for capacity, energy and ancillary services products. For a specific delivery period, market participants submit the price at which they are willing to purchase or sell a specific quantity of a specific power product. The purchase bids and sales offers are then aggregated, and the CAISO establishes a single clearing price for each product. All buyers and sellers who had their bids/offers accepted receive the identical price for that particular product.
2015 PSE IRP
G - 17
Appendix G: Wholesale Market Risk
Spot and Forward Markets “Spot” markets and “forward” markets describe different types of power transactions. The key features of the spot and forward markets of the WECC are described below. Spot Market. In the WECC wholesale power markets, a spot transaction usually refers to transactions of less than 24 hours in duration that is entered into on a day-ahead or day-of basis. (The FERC has also adopted this definition of a spot transaction for the WECC bilateral markets.) DAY-AHEAD. The day-ahead (or preschedule) market is designed to handle power deliveries across the next full 24-hour day. For instance, on any given Monday, preschedulers and day-traders will be negotiating power transactions and identifying delivery and receipt information for each of the 24 hours on Tuesday. Transactions can be for an individual hour or for multiple hours. To accommodate weekends, transactions that cover Fridays and Saturdays are usually scheduled on Thursday, and those for Sundays and Mondays are scheduled on Fridays. Holidays are handled in a similar fashion. SAME-DAY/HOUR-AHEAD. In the same-day market, real-time traders may negotiate and establish transactions for any mutually agreed to volume/price/number of hours. They may also adjust previously negotiated transactions, and these prices may be different than the prices established in the day-ahead market. Price differentials between the day-ahead and same-day markets occur mainly when the real-time condition of the bulk power system differs from what was forecasted on the previous day. Such condition changes include, for instance, a change in weather, a forced outage at a generating plant, higher or lower hydro/wind/solar generation than forecasted, or a transmission line outage. Forward Power Markets. The WECC’s “forward” market allows counterparties to negotiate long-term and/or specialized transactions. The only timing requirement is that they must be established prior to the first day that power is to be delivered under the agreement. Forward transactions often have a first day of delivery that is several months, or even years, following the execution date of the agreement. Most WECC forward transactions fall into one of five categories: (1) balance of month, (2) monthly, (3) quarterly, (4) one calendar year, or (5) multiple calendar years. The monthly, quarterly and one-year markets tend to be the most active, because counterparties can easily purchase and sell these products in standard 25 MW increments under the Western Systems Power Pool Agreement (WSPP). In contrast, multi-year forward wholesale agreements tend to be “one off” agreements that usually contain customized terms and conditions.
2015 PSE IRP
G - 18
Appendix G: Wholesale Market Risk
Key Market Characteristics NO PROOFS REQUIRED. In the WECC power markets, counterparties are not usually required to make any demonstrations regarding either the source or the use of power deliveries at the time they enter into a forward transaction. So, an entity offering to sell power under a forward transaction – say the next calendar month – does not have to “prove” to a potential buyer that it actually has the power it is promising to deliver, and a buyer does not have to prove it can actually accept the power it is purchasing. This feature allows buyers and sellers to take “unbalanced” or “speculative” positions in the forward markets. The forward position of power marketers and IPPs is difficult to know, since they consider such information proprietary. Load-serving utilities often provide information on their long-term forward positions in their IRPs; however at any given point, their forward positions could differ significantly from what was reported in their last IRP. SOURCES NEED NOT BE DISCLOSED. Unless the buyer and seller agree in advance to a specific source for the power deliveries, the seller can source power from different entities and/or generators as long as he or she delivers the specified amounts of power at the agreed upon point of delivery. Buyers usually do not learn the exact source of the power being delivered until the completion of the day-ahead preschedule process. For long-term transactions – those spanning monthly/quarterly/annual periods – the source can change many times over the term of the transaction. The WSPP Agreement Most of the spot and forward market transactions in the WECC use the Western Systems Power Pool (WSPP) Agreement, a standardized, multi-party contract that allows any member of the WSPP to contract for the purchase or sale of energy and/or capacity with any other member. WSPP members can quickly and easily enter into wholesale power transactions with over 300 individual utilities, power marketers and IPPs without having to separately negotiate all of the associated underlying transaction terms and conditions. NOT PHYSICALLY FIRM. Wholesale power deliveries from a seller to a purchaser are not guaranteed to be physically firm transactions under the standard terms of the WSPP Agreement. Under some conditions specified in the WSPP Agreement, the seller can elect not to physically deliver the contracted energy and/or capacity; likewise, the buyer can elect to not physically receive the contracted energy and/or capacity.
2015 PSE IRP
G - 19
Appendix G: Wholesale Market Risk
Three Rate Schedules. The current version of the WSPP Agreement offers parties three different rate schedules for the purchase, sale and exchange of wholesale energy and/or capacity. These are described below.
SCHEDULE A Schedule A transactions are defined as “non-firm” and either the buyer or seller can curtail the contracted delivery amount at any time and for any reason, and neither party is obligated to pay financial damages to the other party. Schedule A transactions are rare. SCHEDULE B Schedule B transactions are associated with a specific generating unit or units, so they are often called “unit contingent” transactions. A seller commits to deliver a contracted amount of power to a purchaser from a specified unit(s). However, if the unit(s) cannot produce the contracted amount of power – due to an unscheduled forced outage, for instance – the seller can reduce the sales amount. SCHEDULE C The vast majority of WSPP transactions are conducted pursuant to Schedule C. These “firm” transactions are backed by the entire systems of the seller and purchaser. A member’s “system” consists of all of the loads and generating units that it owns or controls, and any wholesale purchase or sale contracts that it has in place or may enter into in the future. Sellers are not required to identify the specific source of the power they are contracting to sell until the completion of the day-ahead scheduling process.
Schedule C transactions may be financially firm, but they are not physically firm.
If the seller or purchaser fails to satisfy their obligations (and the failure is not excused under Section C-3.7 of the WSPP Agreement), the other party may be entitled to receive a financial payment called liquidated damages based on the market price of wholesale power at the time the non-performance event(s) occurred.
2015 PSE IRP
G - 20
Appendix G: Wholesale Market Risk
Curtailments and Schedule C Transactions • Any sale is subject to physical curtailments regardless of the length of the transaction,
and curtailments can take place with very little advance notice. • All sales are treated as equal with regard to curtailments; a one-year transaction could be
curtailed ahead of a day-ahead transaction or vice versa. • The seller chooses which specific transaction or transactions are to be curtailed.
A seller (or buyer) may curtail a Schedule C firm transaction with no financial damages owed to the other party under three conditions:
1. The transaction is curtailed within a “recall period” specified in the agreement between the parties.
2. The transaction is curtailed due to an Uncontrollable Force as defined in Section 10 of the WSPP Agreement. NOTE: Drought is considered an Uncontrollable Force, which is especially relevant in the hydro-dependent PNW.
3. The transaction is curtailed to meet the seller’s public utility or statutory obligations to its customers (i.e., reliability of service to native load).
Aside from paying liquidated damages, the non-performing party has no obligation to replace the physical supply of power to the buyer; the buyer must locate and contract for replacement power. Should there be a physical shortage of power in the market at the time, the buyer shoulders all of the physical supply risk.
2015 PSE IRP
G - 21
Appendix G: Wholesale Market Risk
Price Caps WSPP Price Caps. WSPP Schedules A, B and C contain rate caps that limit the prices for energy and/or capacity, but they apply to very few WSPP members.7 The vast majority of members are free to negotiate purchase and sale transactions at any mutually agreeable price. WECC Price Caps. From time to time, the FERC establishes price caps in the wholesale power markets under its jurisdiction. These are market-wide price caps that apply to all sellers making wholesale power sales in that particular market. In response to the 2000-2001 West Coast power crisis, the FERC established a WECC-wide price cap of $250 per MWh in June, 2001. The current cap of $1,000 per MWh was established by FERC order in October 2010.8 The FERC’s price cap has many exceptions.
• The cap applies only to spot market sales in the WECC, which the order defines as “…sales that are 24 hours or less and are entered into the day of or day prior to delivery.”
• Sellers can make spot sales at prices higher than the cap if they provide sufficient cost justification to the FERC.
• The order does not address the sale of capacity in either the spot or forward markets. While the FERC can modify market-wide price caps at any time and on relatively short notice, it is not possible to predict how the agency might react in the case of PNW load curtailments caused by regional energy or capacity shortages. Price Risk to PSE. Given these conditions, it is possible that PSE could be forced to pay more than $1,000 per MWh in order to meet its load and operating reserve obligations. If the region as a whole experienced a load curtailment event, wholesale prices could experience steep increases as multiple load-serving utilities scramble to locate and purchase scarce amounts of energy and/or capacity to meet their load serving obligations. For example, during a cold weather event in December 2000, day-ahead power prices at the Mid-C reached $3,322 per MWh. In addition, during a summer 2011 capacity shortage in ERCOT, the Electric Reliability Council of Texas, market prices briefly exceeded $3,000 per MWh.
7 / WSPP rate caps apply only to members who: 1) are FERC jurisdictional entities that have not been granted blanket market-based rate authority, or 2) have been restricted by the FERC to selling at cost-based rates in certain market areas where the seller has been found to possess unacceptable levels of horizontal market power. When the FERC does grant blanket market-based rate authority, these individual entity tariffs generally do not include price caps. 8 / FERC Docket No. EL10-56, October 8, 2010
2015 PSE IRP
G - 22
Appendix G: Wholesale Market Risk
WHOLESALE MARKET RELIABILITY ANALYSIS To prepare for the coming shift in the region’s load/resource balance, PSE has developed a methodology for incorporating the potential impacts of the shift into its IRP planning models. Two main concerns need to be addressed: physical supply risk and financial risk. Our goal is to produce a set of quantifiable metrics that objectively address both types of risk. This is new territory. There is no established method for incorporating the potential risks associated with region-wide energy and capacity deficits into long-range resource plans, so we began by establishing the following criteria.
• Use existing analytical modeling tools whenever possible, including PSE’s LOLP/RAM and financial portfolio cost models.
• Use the results of publically available, region-wide load/resource studies as inputs to PSE’s IRP models when possible, primarily the NPCC and BPA LOLP studies for calendar year 2021.
• “Sync up” the inputs and outputs of the NPCC and BPA LOLP model, GENESYS, with PSE’s LOLP model, the Resource Adequacy Model (RAM).
• Develop a methodology for translating the regional load curtailments forecast by the NPCC and BPA models into PSE-level impacts. (The result is the Wholesale Purchase Curtailment Model, or WPCM.)
• Introduce regional load curtailments into PSE’s RAM model by reducing the amount of wholesale market purchases PSE is able to import into its system.
• Include forced outage events at PSE-owned or jointly owned thermal plants shown in the NPCC and BPA LOLP models in PSE’s RAM model in a consistent manner.
• Include the impact of scarcity in the wholesale power price forecasts used in PSE IRP financial models.
The following sections describe how PSE has integrated these physical and financial risks into its IRP modeling process.
2015 PSE IRP
G - 23
Appendix G: Wholesale Market Risk
Modeling Physical Supply Risk Since PSE is a winter-peaking utility, winter peak load and winter resource capacity are its primary focus with regard to evaluating physical power supply risks. The company’s main analytical tool for evaluating the reliability of power supply is its Resource Adequacy Model (RAM). RAM performs a multi-simulation analysis that includes the impacts of variable loads, hydro generation, wind generation, generating plant forced outages (and repair times if plants are on forced outage), and available short-term wholesale market imports to identify the frequency of potential outages under varying conditions, and it calculates reliability metrics including LOLP, EUE, and LOLH/LOLE. From 2009 to 2013, PSE configured its IRP electric resource portfolio to meet a 5 percent LOLP standard; with this IRP, we update that standard and shift from the 5 percent LOLP target to an EUE MWh target that minimizes the total cost of reliability. For a more detailed discussion of this change, see “Updating the Planning Standard” in Chapter 6, Electric Analysis. Key changes and additions incorporated into PSE’s 2015 IRP models are as follows:
• Under some conditions, the amount of wholesale power available for PSE to purchase will be limited to less than its maximum available Mid-C transmission capability of 1,666 MW.
• Limitations on PSE’s available supply of wholesale peaking capacity will be tied to the regional load/resource conditions from the NPCC and BPA regional resource adequacy analyses using their GENESYS model.
• Specific hourly reductions will be determined using a newly developed PSE wholesale purchase curtailment model, the WPCM.
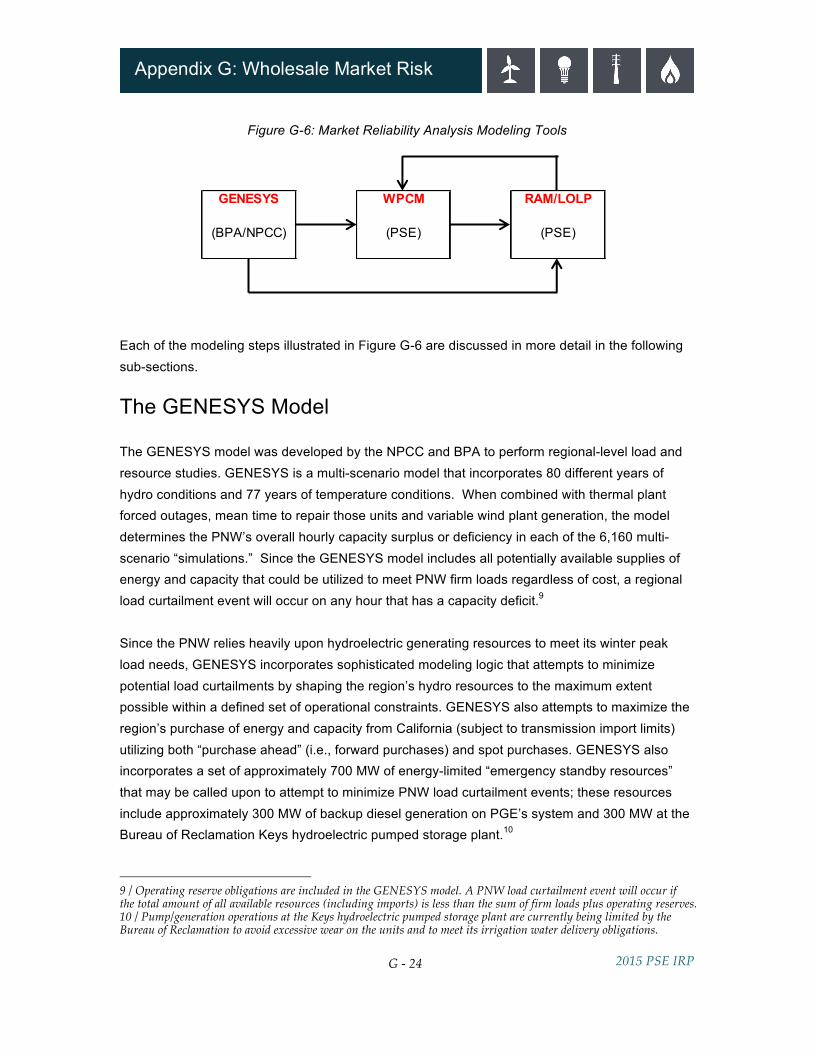
In this IRP, PSE is modifying its RAM model to incorporate the most recently available set of PNW regional resource adequacy forecasts for 2021. In particular, PSE is introducing into its RAM model the equivalent of forced outage events for PSE’s wholesale market purchases when regional deficit conditions are forecast. Figure G-6 illustrates the individual modeling tools utilized by PSE in the 2015 IRP to evaluate physical supply risk and how the inputs and outputs of these models are linked:
2015 PSE IRP
G - 24
Appendix G: Wholesale Market Risk
Figure G-6: Market Reliability Analysis Modeling Tools
Each of the modeling steps illustrated in Figure G-6 are discussed in more detail in the following sub-sections. The GENESYS Model The GENESYS model was developed by the NPCC and BPA to perform regional-level load and resource studies. GENESYS is a multi-scenario model that incorporates 80 different years of hydro conditions and 77 years of temperature conditions. When combined with thermal plant forced outages, mean time to repair those units and variable wind plant generation, the model determines the PNW’s overall hourly capacity surplus or deficiency in each of the 6,160 multi-scenario “simulations.” Since the GENESYS model includes all potentially available supplies of energy and capacity that could be utilized to meet PNW firm loads regardless of cost, a regional load curtailment event will occur on any hour that has a capacity deficit.9 Since the PNW relies heavily upon hydroelectric generating resources to meet its winter peak load needs, GENESYS incorporates sophisticated modeling logic that attempts to minimize potential load curtailments by shaping the region’s hydro resources to the maximum extent possible within a defined set of operational constraints. GENESYS also attempts to maximize the region’s purchase of energy and capacity from California (subject to transmission import limits) utilizing both “purchase ahead” (i.e., forward purchases) and spot purchases. GENESYS also incorporates a set of approximately 700 MW of energy-limited “emergency standby resources” that may be called upon to attempt to minimize PNW load curtailment events; these resources include approximately 300 MW of backup diesel generation on PGE’s system and 300 MW at the Bureau of Reclamation Keys hydroelectric pumped storage plant.10
9 / Operating reserve obligations are included in the GENESYS model. A PNW load curtailment event will occur if the total amount of all available resources (including imports) is less than the sum of firm loads plus operating reserves. 10 / Pump/generation operations at the Keys hydroelectric pumped storage plant are currently being limited by the Bureau of Reclamation to avoid excessive wear on the units and to meet its irrigation water delivery obligations.
GENESYS WPCM RAM/LOLP
(BPA/NPCC) (PSE) (PSE)
2015 PSE IRP
G - 25
Appendix G: Wholesale Market Risk
Regional Curtailment Events. PSE utilized two different GENESYS model runs in order to evaluate physical supply risk in the 2015 IRP.11 The first study (referred to as the base case) evaluated PNW load and resource conditions for calendar year 2021; it was produced by BPA. One of the available outputs from this study is the set of all simulations where there is a PNW-wide load curtailment event (of any magnitude) on any given hour. The GENESYS base case output contained 19,194 hourly load curtailments for the PNW (ranging from 0.2 MW to 10,133 MW) that occurred in 683 of the 6,160 total simulations. This resulted in a region-wide LOLP of approximately 11.1 percent (not including the emergency standby resources).12 The second GENESYS model run (referred to as the Grays Harbor case) was also performed by BPA. It was identical to the first study with the exception that the 650 MW Grays Harbor gas-fired CCCT plant was removed from the list of available resources.13 This second GENESYS model run contained 28,680 hourly load curtailments for the PNW (ranging from 0.2 MW to 10,785 MW) that occurred in 801 of the total 6,160 simulations. This resulted in a PNW region-wide LOLP of approximately 13.0 percent (not including the emergency standby resources). PSE modified the hourly PNW load curtailments derived by the GENESYS model in both the base case and Grays Harbor case in two ways. In the model runs, several very large PNW curtailment events occurred during off-peak hours (in particular on hours 5, 6, 23 and 24). After consultation with BPA and NPCC staff, PSE performed a re-shaping calculation to smooth out some of the large “spike” events to better reflect actual operating conditions on the PNW hydro system. In addition, PSE limited the maximum hourly PNW load curtailment volume to 6,000 MW to avoid potential spurious computational effects associated with very large curtailment events. This limitation was applied to only 241 of the 19,194 curtailment hours in the base case GENESYS output dataset and 743 of the 28,680 curtailment hours in the Grays Harbor case output dataset.
11 / Support from BPA and NPCC staff was essential for this analysis – PSE is grateful for the assistance they provided and for help from the staff of PNUCC. 12 / The impacts of PGE’s backup generation and the Keys pumped storage plant are incorporated into the IRP analysis via the PGE and BPA peaking resources that are included in PSE’s Wholesale Purchase Curtailment Model. Including the emergency standby resources in the GENESYS run would result in a PNW LOLP of approximately 8.1 percent. 13 / As has been previously discussed, the Grays Harbor plant’s natural gas supply is subject to curtailment during cold weather events and the plant does not have a backup fuel supply.
2015 PSE IRP
G - 26
Appendix G: Wholesale Market Risk
PSE Wholesale Market Reliability Scenarios. Using the adjusted hourly PNW load curtailments from the two GENESYS studies described above, PSE developed seven separate Wholesale Market Reliability Scenarios in order to evaluate physical supply risks and financial risks. The seven scenarios are as follows:
1. No Wholesale Market Risk: This scenario assumes unlimited wholesale market supplies are available with no risk of interruption under any condition.
2. NPCC 2015 Resource Adequacy Assumptions: This scenario assumes market reliability – or the risk of interruption – consistent with the base assumptions for the resource builds, Southwest energy and capacity imports, and fuel supply availability used in the NPCC’s 2015 Resource Adequacy Assessment.
3. NPCC 2015 Assumptions plus 475 MW of additional Imports from California: The NPCC’s base analysis assumes 3,400 MW of transmission capacity is available from California, but only 2,925 MW of winter season on-peak resources were included in the NPCC’s analysis (2,500 MW of spot market purchases plus 425 MW of long-term contracts). The 3,400 MW figure is based on a BPA transmission study that analyzed historical volumes of power imports from California; this figure represents the 95th percentile level of imports from California during winter season on-peak hours. This scenario adds the spot market import amounts necessary such that total imports from California equal 3,400 MW on all hours.14
4. NPCC 2015 Assumptions minus the Grays Harbor Plant: This scenario assumes the 650 MW Grays Harbor is not available to operate during PNW load curtailment events. This gas-fired generating plant appears to rely solely on wholesale market purchases of interruptible fuel supply. It has neither firm pipeline capacity for natural gas fuel supply nor oil backup, which means that under extreme cold weather conditions – when the region is most likely to have a capacity deficit – the plant may not be able to operate until weather conditions improve and wholesale market gas supplies are available again. This assumption is consistent with how PSE’s treats its own firm CCCT and CT capacity resources.
14 / Total imports from California during the summer on-peak hours were assumed to be zero in the NPCC’s study. This assumption was not changed in any of the Reliability Scenarios.
2015 PSE IRP
G - 27
Appendix G: Wholesale Market Risk
5. NPCC 2015 assumptions plus PGE’s Carty 2 Project: This scenario assumes that Portland General Electric will build the 440 MW generating plant (Carty 2) that it is currently planning to construct, on a timeline roughly consistent with the early retirement of the Boardman coal plant in 2020. While PGE has not announced the specific project technology, this analysis assumes Carty 2 will be a CCCT plant similar to Carty 1. The current status of Carty 2 did not meet the NPCC’s criteria for inclusion in the 2015 regional resource adequacy assessment; however, PSE was concerned that leaving this plant out of the regional analysis might overstate our customers’ future resource needs.
6. NPCC 2015 assumptions plus PGE Carty 2 plus 475 MW additional CA Imports: This scenario combines assumptions from scenarios 3 and 5 as described above.
7. NPCC 2015 assumptions plus PGE Carty 2 plus 475 MW additional CA Imports minus the Grays Harbor plant: This combines scenarios 3, 4 and 5 as described above.
PSE chose Wholesale Market Reliability Scenario 7 for evaluating resource adequacy impacts in the 2015 IRP. The PSE Wholesale Purchase Curtailment Model (WPCM) The Wholesale Purchase Curtailment Model (WPCM) was developed specifically to quantify the impacts of region-wide load curtailment events on PSE. It analyzes PSE’s ability to make wholesale market purchases for the amounts of energy and capacity that it needs to meet firm peak load and operating reserve obligations. As described in the previous sub-section, NPCC and BPA rely upon a multi-scenario modeling tool (the GENESYS model) to provide detailed information regarding the frequency, duration and magnitude of forecasted PNW-wide load curtailment events. However, the GENESYS model is configured to analyze conditions for the region as a whole, so it cannot determine which specific load-serving utility or utilities will bear all, or a portion of, an overall regional load-curtailment event. PSE developed the WPCM to link PNW-wide load curtailment events, as determined in the GENESYS model, to the specific impacts of those events on PSE. In essence, the WPCM translates, on an hourly basis, a regional load curtailment event (measured in MW) into a reduction in PSE’s wholesale market purchases (also measured in MW). In some cases, reductions to PSE’s initial desired volume of wholesale market purchases could trigger a PSE load curtailment event in the PSE RAM.

2015 PSE IRP
G - 28
Appendix G: Wholesale Market Risk
The WPCM Computational Methodology. During a PNW-wide load curtailment event, there is not enough physical power supply available in the region (including available imports from California) for all of the region’s load serving utilities to fully meet their firm loads plus operating reserve obligations. The WPCM uses a multi-step approach that mimics how the PNW wholesale markets would likely operate in a physical capacity shortage situation to “allocate” the regional capacity deficiency to the region’s individual utilities. These individual capacity shortages are reflected via a reduction in each utility’s forecasted level of wholesale market purchases. The WPCM assumes that under PNW capacity shortage conditions:
1. that all entities that need to purchase capacity in order to meet their own native load-serving obligations will be willing to purchase power up to the same threshold price,
2. that all purchasers in the PNW wholesale marketplace have equal opportunity and ability to locate and purchase needed capacity, and
3. that any load-serving entity that manages to purchase more capacity than it needs to meet its own load-serving obligations will re-sell the surplus capacity to other, still-deficient load serving utilities.
It should be noted that in actual operations, there is no central entity in the PNW charged with allocating scarce supplies of energy and capacity to individual utilities during regional load curtailment events (although Peak Reliability, as the Security Coordinator for the region, would be actively working with the region’s utilities to maintain transmission system stability during such events). The PNW wholesale marketplace would, in effect, be the allocating mechanism as multiple parties scramble to enter into purchase and sale transactions under abnormal and probably hectic conditions. It is likely that forward market wholesale transactions would be partially curtailed or fully unwound to the extent allowed under the governing purchase/sale contracts. The WSPP Agreement used for most wholesale power transactions in the PNW markets explicitly allows load-serving utilities to curtail or terminate firm Schedule C sales transactions to meet their own load-serving obligations. Regional Utility Load Inputs. Because the amounts of capacity that other load-serving entities in the region need to purchase in the wholesale marketplace has a direct impact on the amount of capacity that PSE would be able to purchase, it was necessary to assemble load and resource data for both the region as a whole and for many of its individual utilities, especially those that would be expected to purchase relatively large amounts of energy and capacity during winter peaking events.
2015 PSE IRP
G - 29
Appendix G: Wholesale Market Risk
For this analysis, PSE chose to use the capacity data contained in BPA’s 2014 Pacific Northwest Loads and Resources Study, because it contained useful differentiation at the regional level and because it treated individual utility data more consistently than other available sources. BPA’s study tabulates forecasted loads and resources of non-BPA entities by class (i.e., IOUs, PUDs, municipalities, etc.), and it generally applies the same forecasting assumptions and methodologies to all regional utilities, while the computational methodologies used in individual utility IRPs can vary significantly. Using the 2020-2021 capacity data contained in the 2014 BPA study and applying some general assumptions, PSE constructed winter 2021 load/resource tables for eight classes of market participants:
1) federal entities 5) marketers 2) cooperatives 6) municipalities 3) direct service Industries 7) public utility districts 4) investor-owned utilities 8) other
From this data, PSE computed the surplus/deficiency positions for each of the eight entity classes under 2021 winter peaking conditions using BPA’s 120-hour sustained hydro peaking case. To create winter peak load/resource tables for the region’s investor-owned utilities (several of which are large purchasers of wholesale energy and capacity), PSE assembled load and resource data from 2013 IRPs to create winter 2021 peak load/resource tables for each utility. Forecasted winter 2021 peaking surplus/deficiencies were then determined for each of the following IOUs: PacifiCorp, PGE, Avista, and Idaho Power.
2015 PSE IRP
G - 30
Appendix G: Wholesale Market Risk
PSE then trued up the 2021 winter peaking surplus/deficiencies between the 2014 BPA study, the IRPs of the above utilities and PSE’s own 2015 IRP load/resource data to create a simplified model of the PNW wholesale market for use in the WPCM.15 Additional information and computational steps were required to incorporate PacifiCorp load/resource information since PacifiCorp East (PACE) is a summer-peaking system and PacifiCorp West (PACW) is a winter-peaking system.16 The WPCM model input data also included information regarding the IPP plants located within the region. For these plants, it was assumed that 100 percent of the net winter season capacity, as reported in the 2014 BPA study, would be available to meet PNW loads. Also, since Idaho Power is a summer peaking utility and Idaho’s 2013 IRP indicated that it expects to have a moderate winter season capacity surplus for 2021, Idaho’s surplus was also assumed to be available to meet PNW winter peak loads. In addition to deriving base winter 2021 surplus and deficiency values, PSE also computed a set of “sensitivity ratios” for PSE, PGE, BPA, PACW, other utilities, and the combination of the PNW IPPs and Idaho Power. The purpose of the sensitivity ratios is to scale each utility’s base surplus/deficiency (which were computed on a single-point deterministic basis) up or down to match the varying hourly PNW load curtailment values from the GENESYS model. The sensitivity ratios are a measure of the relative size of each PNW entity and were computed as follows: Entity Sensitivity Ratio = (Absolute Value Entity 2021 Peak Load + Entity 2021 Peak Resources) / (Absolute Value PNW Total 2021 Peak Load + PNW Total 2021 Peak Resources). The sensitivity ratios were computed as a function of both load and resources since the multi-scenario GENESYS model varies both load and generation quantities; therefore, a regional PNW load curtailment event could be the result of either a load-driven event, a generation-driven event, or both.
15 / PSE performed a series of preliminary sensitivity studies using varying amounts of PSE and other PNW utility winter surpluses and deficiencies to gauge the sensitivity of the WPCM’s outcomes to the relative size and number of surplus and deficient utilities in the PNW region. The results of these studies indicated that utilities with small surpluses or deficiencies relative to PSE’s average of approximately 1,600 MW, 2021 winter peak deficiency had very little (or no) impact on the level of PSE’s computed wholesale purchase curtailments. It was therefore possible to significantly simplify the WPCM by aggregating the smaller utility capacity surpluses and deficits into one proxy “other” utility system. 16 / Deriving winter 2020/21 load and resource information for the PACW system proved challenging given the fact that PacifiCorp overall is a summer peaking system and PacifiCorp’s 2013 IRP did not contain separate PACW and PACE load/resource tables under winter peaking conditions. PSE therefore estimated PACW’s winter 2021 peak load using a combination of the limited information contained in PacifiCorp’s 2013 IRP and publically available historical load data from multiple FERC reports.
2015 PSE IRP
G - 31
Appendix G: Wholesale Market Risk
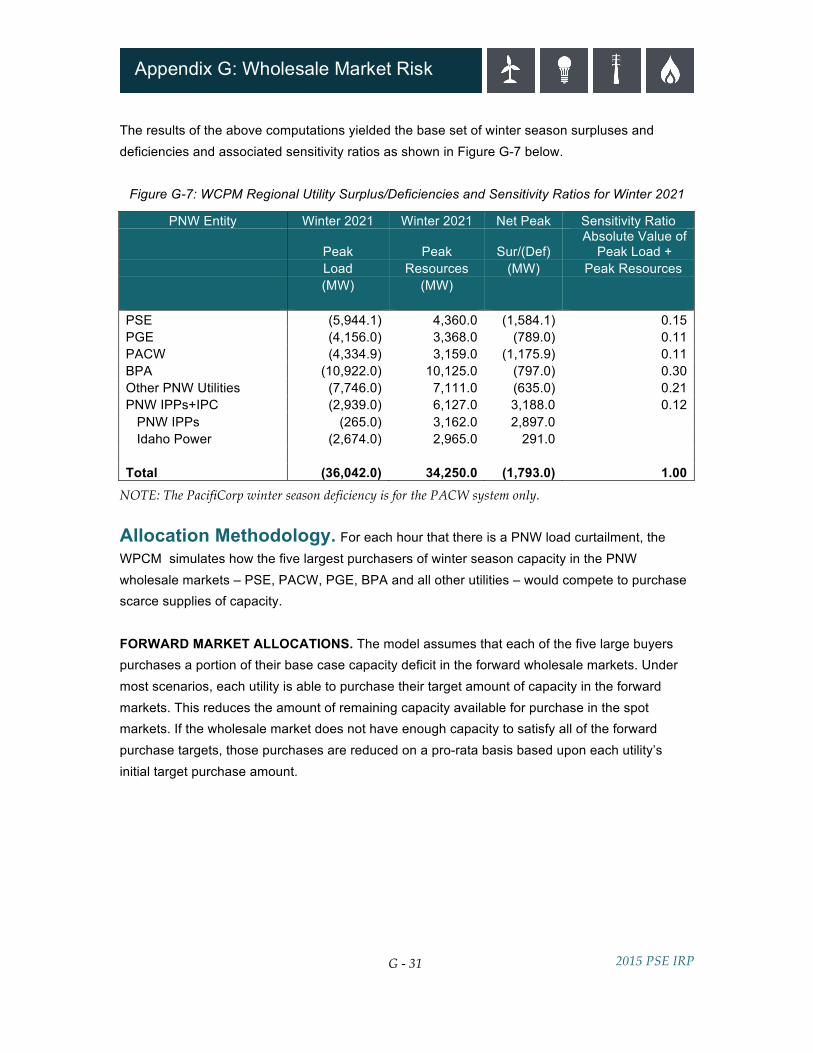
The results of the above computations yielded the base set of winter season surpluses and deficiencies and associated sensitivity ratios as shown in Figure G-7 below.
Figure G-7: WCPM Regional Utility Surplus/Deficiencies and Sensitivity Ratios for Winter 2021
PNW Entity Winter 2021 Winter 2021 Net Peak Sensitivity Ratio
Peak Peak Sur/(Def) Absolute Value of
Peak Load + Load Resources (MW) Peak Resources (MW) (MW)
PSE (5,944.1) 4,360.0 (1,584.1) 0.15 PGE (4,156.0) 3,368.0 (789.0) 0.11 PACW (4,334.9) 3,159.0 (1,175.9) 0.11 BPA (10,922.0) 10,125.0 (797.0) 0.30 Other PNW Utilities (7,746.0) 7,111.0 (635.0) 0.21 PNW IPPs+IPC (2,939.0) 6,127.0 3,188.0 0.12 PNW IPPs (265.0) 3,162.0 2,897.0 Idaho Power (2,674.0) 2,965.0 291.0 Total (36,042.0) 34,250.0 (1,793.0) 1.00
NOTE: The PacifiCorp winter season deficiency is for the PACW system only. Allocation Methodology. For each hour that there is a PNW load curtailment, the WPCM simulates how the five largest purchasers of winter season capacity in the PNW wholesale markets – PSE, PACW, PGE, BPA and all other utilities – would compete to purchase scarce supplies of capacity. FORWARD MARKET ALLOCATIONS. The model assumes that each of the five large buyers purchases a portion of their base case capacity deficit in the forward wholesale markets. Under most scenarios, each utility is able to purchase their target amount of capacity in the forward markets. This reduces the amount of remaining capacity available for purchase in the spot markets. If the wholesale market does not have enough capacity to satisfy all of the forward purchase targets, those purchases are reduced on a pro-rata basis based upon each utility’s initial target purchase amount.
2015 PSE IRP
G - 32
Appendix G: Wholesale Market Risk
SPOT MARKET ALLOCATIONS. For spot market capacity allocation, each of the five large utility purchasers is assumed to have equal access to the PNW wholesale spot markets (including available imports from California). The spot market capacity allocation is not based on a straight pro-rata allocation, because in actual operations, the largest purchaser (which is usually PSE) would not be guaranteed automatic access to a fixed percentage of its capacity need. Instead, all of the large purchasers would be aggressively attempting to locate and purchase scarce capacity from the exact same sources. Under deficit conditions, the largest of the purchasers would tend to experience the biggest MW shortfalls between what they need to buy and what they can actually buy. This situation is particularly true for small to mid-sized regional curtailments where the smaller purchasers may be able to fill 100 percent of their capacity needs but the larger purchasers cannot. WPCM Outputs. For each simulation and hour in which there is PNW load curtailment event (as determined in the GENESYS model), the WPCM model outputs the following PSE specific information:
• PSE’s initial wholesale market purchase amount (in MW), limited only by PSE’s overall Mid-C transmission rights.
• The curtailment to PSE’s market purchase amount (in MW) due to the PNW regional capacity shortage.
• PSE’s final wholesale market purchase amount (in MW) after incorporating PNW regional capacity shortage conditions.
As discussed above, the amount of PSE’s wholesale purchase reductions is not a straight pro-rata calculation; rather PSE’s percentage reduction in its initial target wholesale purchase amount varies depending upon
1. the magnitude of the PNW regional load curtailment event, and 2. the capacity deficits of PSE and the other large capacity purchasers under each specific
PNW load-curtailment event.
2015 PSE IRP
G - 33
Appendix G: Wholesale Market Risk
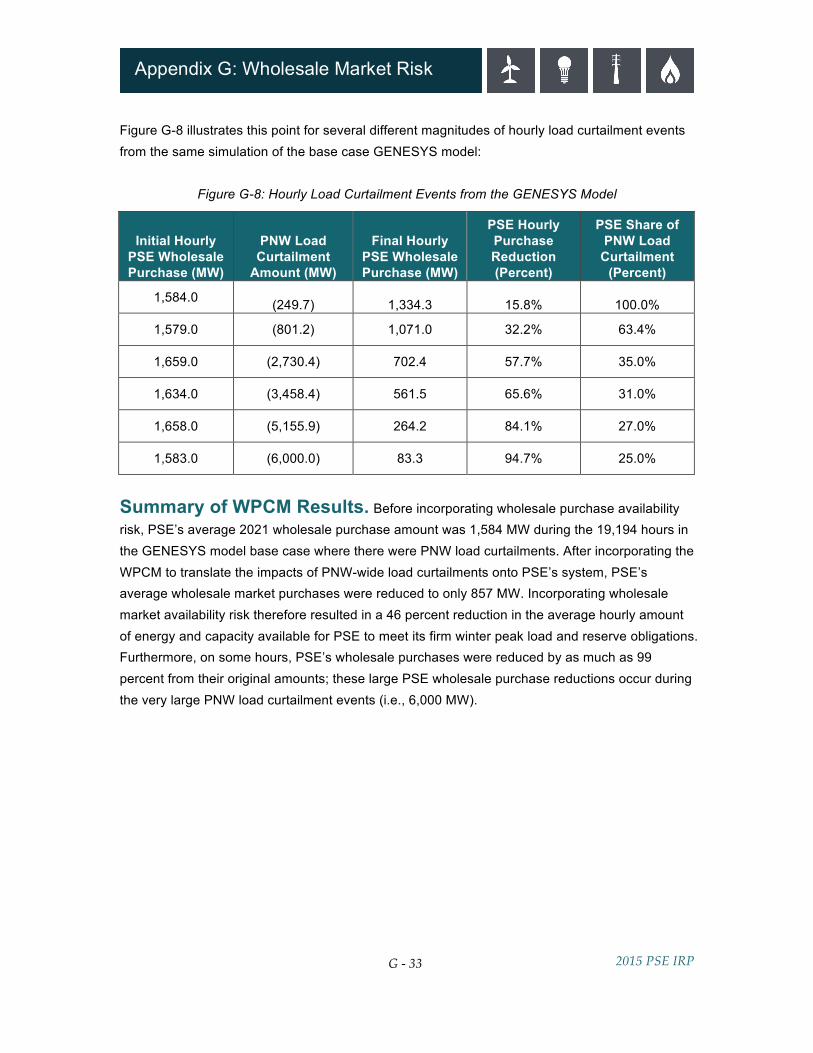
Figure G-8 illustrates this point for several different magnitudes of hourly load curtailment events from the same simulation of the base case GENESYS model:
Figure G-8: Hourly Load Curtailment Events from the GENESYS Model
Initial Hourly PSE Wholesale Purchase (MW)
PNW Load Curtailment
Amount (MW)
Final Hourly PSE Wholesale Purchase (MW)
PSE Hourly Purchase Reduction (Percent)
PSE Share of PNW Load
Curtailment (Percent)
1,584.0 (249.7) 1,334.3 15.8% 100.0%
1,579.0 (801.2) 1,071.0 32.2% 63.4%
1,659.0 (2,730.4) 702.4 57.7% 35.0%
1,634.0 (3,458.4) 561.5 65.6% 31.0%
1,658.0 (5,155.9) 264.2 84.1% 27.0%
1,583.0 (6,000.0) 83.3 94.7% 25.0%
Summary of WPCM Results. Before incorporating wholesale purchase availability risk, PSE’s average 2021 wholesale purchase amount was 1,584 MW during the 19,194 hours in the GENESYS model base case where there were PNW load curtailments. After incorporating the WPCM to translate the impacts of PNW-wide load curtailments onto PSE’s system, PSE’s average wholesale market purchases were reduced to only 857 MW. Incorporating wholesale market availability risk therefore resulted in a 46 percent reduction in the average hourly amount of energy and capacity available for PSE to meet its firm winter peak load and reserve obligations. Furthermore, on some hours, PSE’s wholesale purchases were reduced by as much as 99 percent from their original amounts; these large PSE wholesale purchase reductions occur during the very large PNW load curtailment events (i.e., 6,000 MW).
2015 PSE IRP
G - 34
Appendix G: Wholesale Market Risk
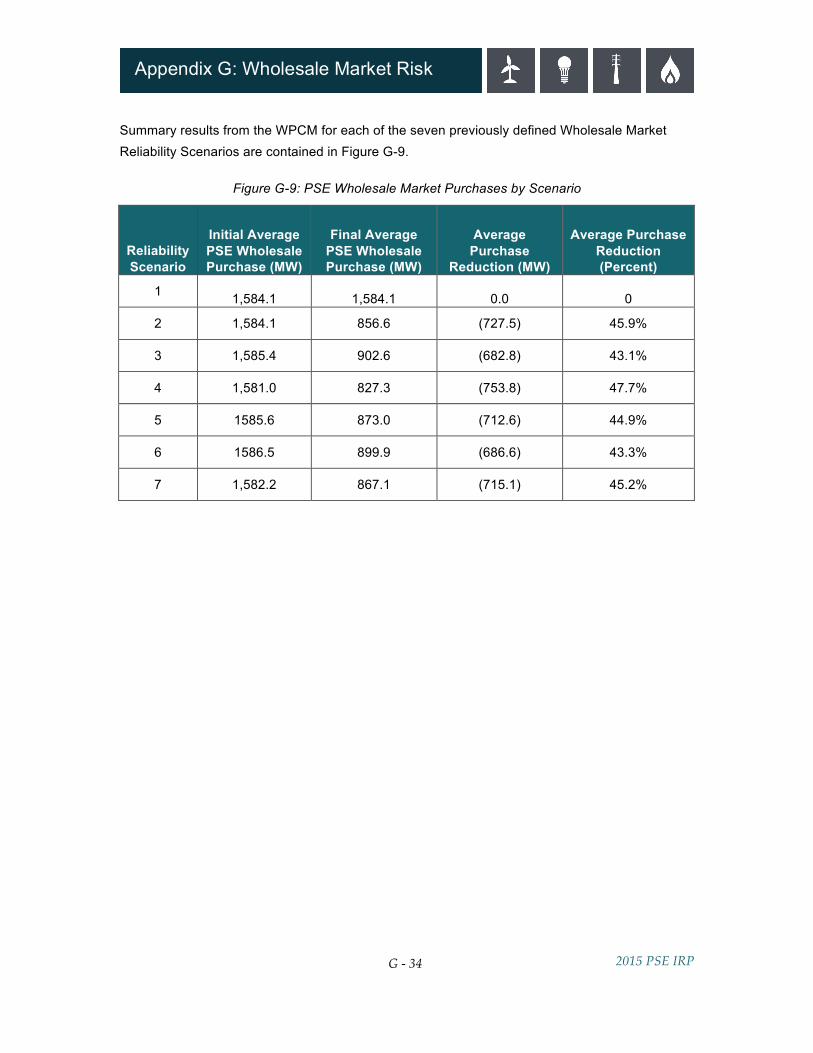
Summary results from the WPCM for each of the seven previously defined Wholesale Market Reliability Scenarios are contained in Figure G-9.
Figure G-9: PSE Wholesale Market Purchases by Scenario
Reliability Scenario
Initial Average PSE Wholesale Purchase (MW)
Final Average PSE Wholesale Purchase (MW)
Average Purchase
Reduction (MW)
Average Purchase Reduction (Percent)
1 1,584.1 1,584.1 0.0 0
2 1,584.1 856.6 (727.5) 45.9%
3 1,585.4 902.6 (682.8) 43.1%
4 1,581.0 827.3 (753.8) 47.7%
5 1585.6 873.0 (712.6) 44.9%
6 1586.5 899.9 (686.6) 43.3%
7 1,582.2 867.1 (715.1) 45.2%

2015 PSE IRP
G - 35
Appendix G: Wholesale Market Risk
Linking the WPCM and RAM Models. PSE’s RAM operates much like the GENESYS model, except that it is designed to analyze load/resource conditions for PSE’s power system rather than the entire PNW region.17 Like the GENESYS model, PSE’s RAM is a multi-scenario model that varies a set of input parameters across 6,160 individual simulations, and the result of each simulation is PSE’s hourly capacity surplus or deficiency. The loss of load probability, expected unserved energy and loss of load hours/expectations for the PSE system is then computed across the 6,160 simulations. The hourly wholesale market purchases that PSE imports into its system using its long-term Mid-C transmission rights are one of the RAM input variables. The initial set of hourly imports is computed as the difference between PSE’s maximum import rights (which total approximately 2,300 MW in 2021) less the amount of transmission capability used to import generation from PSE’s Wild Horse wind plant and PSE’s contracted shares of the Mid-C hydro plants. To reflect regional deficit conditions, this initial set of PSE hourly wholesale market imports is reduced on the hours when a PNW load curtailment event is identified by the WCPM. The final set of hourly PSE wholesale imports from the WPCM is then used as a data input into the PSE RAM, and PSE’s loss of load probability (LOLP), expected unserved energy (EUE), and loss of load expectation (LOLH) are then determined. In this fashion, the LOLP, EUE and LOLH metrics determined in the RAM incorporate PSE’s wholesale market reliance risk.
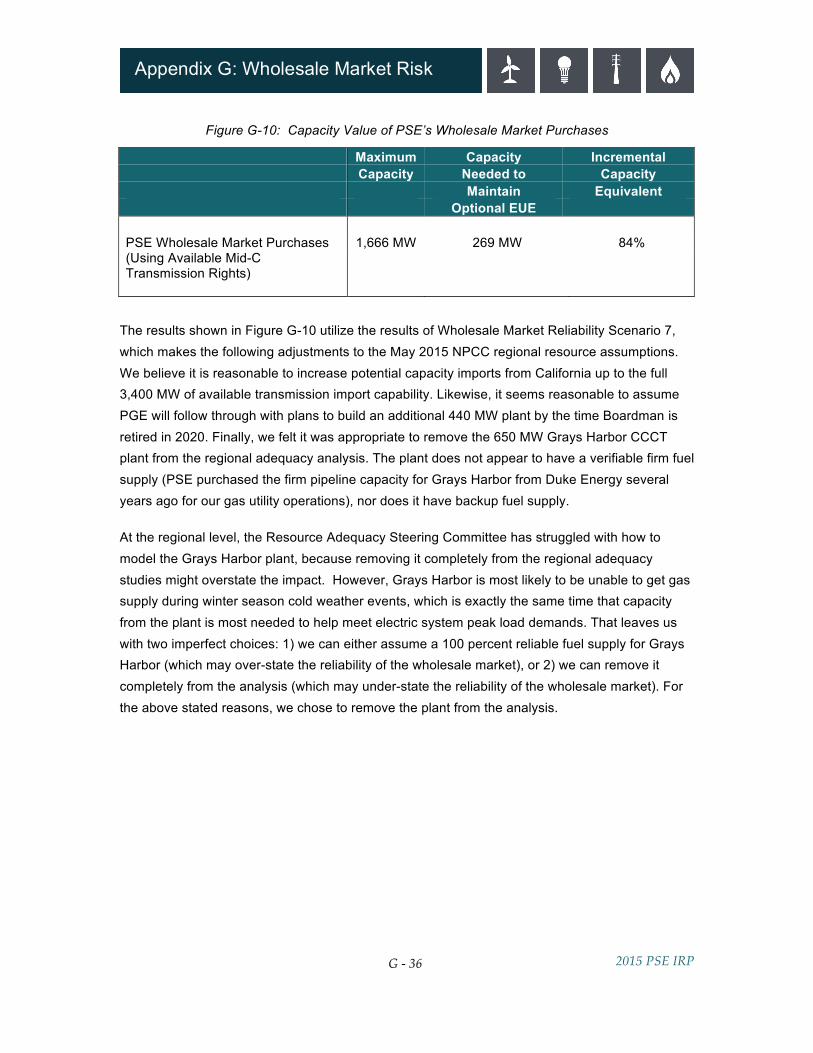
Calculating the Capacity Contribution of Wholesale Market Purchases With the reliability of wholesale market purchases now reflected in PSE’s RAM, we applied the same analytical process to estimate the capacity value of wholesale market purchases that we use for other resources, including existing and new wind resources and Colstrip. That is, just as PSE cannot count on the full nameplate capacity of a wind plant to meet peak capacity needs because the wind doesn’t blow all the time, we cannot always count on the full 1,666 MW of wholesale market purchases to meet our peak need, because the wholesale market is not perfectly reliable. To make this assessment of capacity value, we use Incremental Capacity Equivalence (ICE) analysis.18 The results of this capacity value analysis are summarized in Figure G-10.
17 / PSE’s RAM is described in detail in Appendix N. 18 / The ICE analysis for PSE’s wholesale market purchases and other resource types are discussed in Appendix N.
2015 PSE IRP
G - 36
Appendix G: Wholesale Market Risk
Figure G-10: Capacity Value of PSE’s Wholesale Market Purchases
Maximum Capacity Incremental Capacity Needed to Capacity Maintain Equivalent Optional EUE PSE Wholesale Market Purchases 1,666 MW 269 MW 84% (Using Available Mid-C Transmission Rights)
The results shown in Figure G-10 utilize the results of Wholesale Market Reliability Scenario 7, which makes the following adjustments to the May 2015 NPCC regional resource assumptions. We believe it is reasonable to increase potential capacity imports from California up to the full 3,400 MW of available transmission import capability. Likewise, it seems reasonable to assume PGE will follow through with plans to build an additional 440 MW plant by the time Boardman is retired in 2020. Finally, we felt it was appropriate to remove the 650 MW Grays Harbor CCCT plant from the regional adequacy analysis. The plant does not appear to have a verifiable firm fuel supply (PSE purchased the firm pipeline capacity for Grays Harbor from Duke Energy several years ago for our gas utility operations), nor does it have backup fuel supply. At the regional level, the Resource Adequacy Steering Committee has struggled with how to model the Grays Harbor plant, because removing it completely from the regional adequacy studies might overstate the impact. However, Grays Harbor is most likely to be unable to get gas supply during winter season cold weather events, which is exactly the same time that capacity from the plant is most needed to help meet electric system peak load demands. That leaves us with two imperfect choices: 1) we can either assume a 100 percent reliable fuel supply for Grays Harbor (which may over-state the reliability of the wholesale market), or 2) we can remove it completely from the analysis (which may under-state the reliability of the wholesale market). For the above stated reasons, we chose to remove the plant from the analysis.
2015 PSE IRP
G - 37
Appendix G: Wholesale Market Risk
Other Modeling Considerations and Uncertainties PSE plans to continue to refine its wholesale market risk analysis models in a number of areas; six of these are described below. Several of these areas have also been identified by NPCC and PNUCC staff as areas for improvements to the PNW-wide load/resource models. Market Friction. The various PNW-level load/resource models used by the NPCC, PNUCC and BPA, as well as PSE’s own RAM and WPCM models, assume that the wholesale markets always operate in an optimally efficient fashion. However, many real-world uncertainties and behaviors are difficult to incorporate into the models. For instance, during a severe winter cold weather event, the region’s load-serving utilities would be expected to be very conservative with regard to meeting their statutory native load obligations. This could lead some utilities to forego making wholesale power sales in advance of the delivery hour, even though, after the fact, some surplus capacity may have been available. In addition, utilities operating energy-limited hydroelectric-based systems may not be willing to sell “surplus” water today if they think they may need that same increment of water at a future point in time to meet their own load-serving obligations. Incorporating this “market friction” impact could therefore result in more frequent and/or severe PNW load-curtailment events than the current set of models indicate. California Intertie Outages and Derates. The aforementioned regional load/resource models do not fully incorporate the potential for outages and/or derates on the interties that interconnect the PNW with California. Such transmission outages could cause additional PNW load curtailment events (above and beyond what the current set of models indicate). This is an especially important issue for PSE since it relies upon 300 MW of firm imports from California to meet winter peak loads, under a long-term PSE/PG&E Exchange Agreement. PSE’s IRP models currently assume that PG&E Exchange deliveries are 100 percent firm, even though in actual operations, the full 300 MW amount is occasionally reduced due to transmission derates.
2015 PSE IRP
G - 38
Appendix G: Wholesale Market Risk
Balancing Reserves for Intermittent Resources. The BPA and NPCC versions of the GENESYS model used to produce PNW-level load/resource studies include real-time balancing reserves for the wind plants located within the BPA Balancing Authority Area (BAA), but they do not include balancing reserves that must be maintained by other BAAs in the region, including PSE. For instance, under PSE’s Open Access Transmission Tariff (OATT) PSE has an obligation to provide real-time capacity reserves for all of our transmission customers in addition to providing these reserves for its own 273 MW Wild Horse wind plant (unless the customer specifically requests to provide their own reserves). By excluding the wind and solar balancing reserves that are required to be maintained by non-BPA entities, the GENESYS model is likely understating the region’s overall operating reserve requirement, and in turn may be understating the frequency and magnitude of potential PNW load curtailment events. Fuel Supplies for Generating Plants. Generating plant fuel supplies are an issue of concern for regional load/resource planners. Since the PNW is a heating-load driven/winter-peaking region, demand for natural gas supplies tends to peak at the same time as the demand for electricity. A shortage of gas supply or limitations on gas pipeline capacity could lead to natural gas deliveries being curtailed to some gas-fired CCCT and CT generating plants. While many PNW gas-fired generating plants have backup fuel supplies (generally oil), at least one major plant – the 650 MW Grays Harbor CCCT plant – does not have a backup fuel supply. As an Independent Power Producer, the status of this plant’s fuel supply is first and foremost a contractual issue between the plant’s owner (Invenergy) and the entities that are purchasing power from the plant. However, since the NWPP’s adequacy studies assume that all PNW IPP generating capacity will be available to meet regional peak loads, the firmness of the plant’s fuel supply is a regional-level issue as well. Syncing Up Thermal Plant Forced Outages. Forced outages at the region’s thermal generating plants are a contributing factor to potential PNW load curtailment events. Both the regional GENESYS model and PSE’s RAM model incorporate this impact, but the two models determine forced outages events independently of each other. However, if the GENESYS model has a thermal plant outage that occurs at one of PSE’s owned (or jointly owned) thermal plants, it should also be included in PSE’s RAM model (for the exact same simulation and hour) so that PSE can more accurately “sync up” its hourly system capacity surplus or deficit with PNW regional resource conditions. Limitations on extracting data from the GENESYS model prevented PSE from being able to fully synchronize forced outage events between the two models for this analysis.
2015 PSE IRP
G - 39
Appendix G: Wholesale Market Risk
Operating Reserves Available from Third Parties. The utilities and generators that are members of the Northwest Power Pool (which includes PSE) operate a reserve-sharing program. Under this program, members pool their individual contingency (i.e., forced outage) reserve obligations such that the amount of reserves each member is required to maintain is lower than it would be in the absence of the program. If an NWPP member has a qualified forced outage event, and if it has used all of the reserves that it is required to maintain under the reserve-sharing program, that member is entitled to request and receive additional amounts of energy and capacity from other members up to the full amount of the outage for up to 60 minutes following the initiation of the outage event. PSE’s LOLP model incorporates this reserve-sharing feature. However, should PSE suffer a forced outage when the region is experiencing a load curtailment event, it is unlikely that PSE would be able to access the amount of additional operating reserves it is entitled to receive under the NWPP reserve-sharing program. This potential impact was not included in PSE’s 2015 IRP LOLP modeling.