Embed Size (px)
Citation preview

Chatham House, 10 St James’s Square, London SW1Y 4LET: +44 (0)20 7957 5700 E: [email protected]: +44 (0)20 7957 5710 www.chathamhouse.org.uk
Charity Registration Number: 208223
Who Owns OurLow Carbon Future?Intellectual Propertyand Energy Technologies
A Chatham House Report
Bernice Lee, Ilian Iliev and Felix Preston
www.chathamhouse.org.uk
Who
Ow
nsO
urLow
Carbon
Future?B
erniceLee
etal.
0322247818629
ISBN 9781862032224

www.chathamhouse.org.uk
Who Owns Our Low Carbon Future?
Intellectual Property and Energy Technologies
A Chatham House Report
Bernice Lee, Ilian Iliev and Felix Preston
September 2009

www.chathamhouse.org.uk
ii
© Royal Institute of International Affairs, 2009
Chatham House (the Royal Institute of International Affairs) is an independent body which promotes the rigorous study of international questions and does not express opinion of its own. The opinions expressed in this publication are the responsibility of the authors.
All rights reserved. No part of this publication may be reproduced or transmitted in any form or by any means, electronic or mechanical including photocopying, recording or any information storage or retrieval system, without the prior written permission of the copyright holder. Please direct all enquiries to the publishers.
Chatham House10 St James’s SquareLondon, SW1Y 4LET: +44 (0) 20 7957 5700F: +44 (0) 20 7957 5710 www.chathamhouse.org.uk
Charity Registration No. 208223
ISBN 978 1 86203 222 4A catalogue record for this title is available from the British Library.
Designed and typeset by Soapbox Communications Limitedwww.soapboxcommunications.co.uk
Printed and bound in Great Britain by Latimer Trend and Co Ltd
The material selected for the printing of this report is Elemental Chlorine Free and has been sourced from well-managed forests. It has been manufactured by an ISO 14001 certified mill under EMAS.
Chatham House has been the home of the Royal Institute of International Affairs for over eight decades. Our mission is to be a world-leading source of independent analysis, informed debate and influential ideas on how to build a prosperous and secure world for all.

www.chathamhouse.org.uk
iii
Contents Acknowledgments iv Authors v Executive Summary and Recommendations vii
Introduction 1
1 IPR and Climate Change: Friends or Foes? 3 1.1 Meeting climate challenges through smart technology policies 4 1.2 IPR and business strategies 6 1.3 Patents and technological innovation in the energy sector 8 1.4 Moving beyond business-as-usual 9
2 Innovation in Energy Technologies: The State of Play 12 2.1 Patenting trends since the 1970s 12 2.2 Geographical and organizational distribution of patent ownership 14 2.3 Patent ownership concentration, patent families and patent volumes 18
3 Patent Landscapes of Individual Energy Sectors 21 3.1 Wind 22 3.2 Solar photovoltaic (PV) 25 3.3 Biomass-to-electricity 29 3.4 Concentrated solar power 32 3.5 Cleaner coal 36 3.6 Carbon capture 39
4 Understanding Technology Diffusion 44 4.1 Technology systems interaction/migration 44 4.2 Diffusion channels 46 4.3 Capitalizing on the global market 55
5 Policy Implications 57 5.1 Business-as-usual is not an option 57 5.2 Building a global low carbon industrial future 58
Appendix: Methodology for Patent Landscaping 62

www.chathamhouse.org.uk
iv
Acknowledgments
This report is part of a project on ‘Trade, Finance and Climate Change: Building a Positive Agenda for Developing Countries’, funded by the United Kingdom Department for International Development (DFID) and managed by the Energy, Environment and Resource Governance research team at Chatham House. The project aims to challenge some of the myths and establish the evidence around the climate and trade agendas, and to generate new thinking and suggest creative solutions for policy-makers and stake-holders. This report builds on previous research and publi-cations from one stream of the project, entitled ‘Next steps on intellectual property rights and climate technologies’.
Chatham House would like to thank DFID and the International Institute for Sustainable Development (IISD) for their financial support for this study. The authors are grateful to Climate Strategies (Karsten Neuhoff and Jim Cust), who kindly allowed the research team to build on their datasets on coal and biomass tech-nologies; to Sean Tooze for his work on the value-added database; and to Mark Meyer, Arthur Lallament, Emily Michie and Helena Van Der Merwe (CambridgeIP), and Benjamin Zala, Lucy Ellinas, Tim Eaton and Glada Lahn (Chatham House), for their research assistance and support. Comments on earlier drafts were provided by Nick Ashton-Hart, Kate Hampton, Andrew Jarvis, Nick Mabey, John Mitchell, Karsten Neuhoff, Walt Patterson,
Shane Tomlinson and Pelin Zorlu, to whom the authors would like to extend their sincere appreciation. Also thanks to Ahmed Abdel Latif, Jelena Babajeva, David Bailey, Keith Barnham, Christophe Bellmann, Martin Blunt, Hannah Chalmers, Jeff Chapman, Aaron Cosbey, Graham Ford, Vera Franz, Jon Gibbons, Tomas Kaberger, Konstantinos Karachalios, Achim Krebs, Ricardo Melendez-Ortiz, Jennifer Morgan, Bo Nomark, Claire Planner, Erik Rensfelt, Christoph Richter, Peter Sage, Jesse Scott, Martin Sedgwick, Deborah Seligsohn, Lars Waldheim, Matthew Webb and Jacob Werksman.
The authors would also like to thank the participants at the following workshops for their insights and questions on presentations of earlier research findings:
• Side event organized by Chatham House and IISD at the UNFCCC COP-14 on ‘Trade and Investment, Technology Transfer and Climate Change: The Sustainable Development Nexus’, in Poznan in December 2008;
• Event organized by Climate Change Capital and the Natural Resource Defense Council on ‘Emerging Strategies for International Climate & Investment Policy’ in Washington, DC in January 2009;
• Side event organized by Chatham House and the International Centre for Trade and Sustainable Development at the Standing Committee on Patents of the World Intellectual Property Organization, on ‘Innovation and Diffusion of Climate Technologies: What Role for WIPO?’, in Geneva in March 2009;
• Workshop organized by the Brookings Institution and E3G on ‘Building Transatlantic Consensus on Developing Country Actions to Address Climate Change’, in Washington, DC in June 2009.
Last but not least, this report is dedicated to the memories of Professor John H. Barton and Bernard Schlamadinger. Their wisdom will be sorely missed.
www.chathamhouse.org.uk
v
The following outputs from this stream of work are available online
• Background papers and report of a workshop on ‘IPRs and the Innovation and Diffusion of Climate Technologies’
held in London in November 2007: www.chathamhouse.org.uk/publications/papers/view/-/id/722/.
• William Blyth (2008), ’Linking Carbon Markets and Technology Support Mechanisms: Making Sense of the EU
Climate Change Package’: www.chathamhouse.org.uk/research/eedp/papers/view/-/id/668/.
• John H. Barton (2008), ‘International Diffusion of Climate Change Technologies in the Transport Sector’: www.chatham-
house.org.uk/research/eedp/papers/view/-/id/723/.
• Shane Tomlinson, Pelin Zorlu and Claire Langley (2008), ‘Innovation and Technology Transfer: Framework for
a Global Climate Deal’ (co-published with E3G): www.chathamhouse.org.uk/research/eedp/papers/view/-/
id/685/.
• John H. Barton (2008), ‘Mitigating Climate Change through Technology Transfer: Addressing the Needs of
Developing Countries’ IPRs’: www.chathamhouse.org.uk/research/eedp/papers/view/-/id/671/.
• Jerome Reichman, Arti K. Rai, Richard G. Newell and Jonathan B. Wiener (2009), ‘Intellectual Property and
Alternatives: Strategies for Green Innovation’: www.chathamhouse.org.uk/research/eedp/papers/view/-/id/691/.

www.chathamhouse.org.uk
vi
Authors
Bernice Lee is Research Director for Energy, Environment and Resource Governance at Chatham House.
Ilian Iliev is co-founder and Chief Executive Officer of CambridgeIP.
Felix Preston is Research Fellow for Energy, Environment and Resource Governance at Chatham House.

www.chathamhouse.org.uk
vii
Executive Summary and Recommendations
Ensuring access to climate-friendly technologies at affordable prices is a critical issue for international public policy – and one that cuts across economic, legal, security and geopolitical concerns. To keep the rise in average global temperatures below 2oC, global greenhouse gas emissions must peak before 2020 and be reduced to 50–85 per cent below 2000 levels by 2050. Achieving these ambitious targets requires a critical mass of low carbon investment, innovation and deployment that meets mid- and long-term goals. The implications for corporate strategies and business models are profound.
This report examines two issues: patent ownership of climate-friendly technologies, and the rate of technology diffusion. A polarized debate continues between proponents of strengthening intellectual property rights (IPR) regimes to encourage innovation of climate technologies on the one hand, and those calling for more IP-related flexibilities to ensure access to key technologies by developing countries on the other.
In order to bring empirical evidence to these discus-sions in advance of the Copenhagen Summit in December 2009, Chatham House and CambridgeIP have conducted an extensive analysis of patent ownership and the market adoption rates of six energy technologies: wind, solar photovoltaic (PV), concentrated solar power (CSP), biomass-to-electricity, cleaner coal and carbon capture. The study involved nine months of research across the technologies (and over 30 sub-sectors). A database of close to 57,000 patents over 30 years has been compiled and profiles were developed of selected patent owners. In addition, the team reviewed aspects of corporate
strategy and practice, such as collaboration, licensing, litigation and mergers and acquisitions.
Most energy technologies are part of complex global tech-nology systems. Their development does not often follow a linear logic or evolve within the boundaries of individual economic sectors. Many breakthrough innovations occur when different fields interact. For example, innovation in solar PV technologies has benefited from developments in consumer and industrial electronics, and advances in CSP derive from aerospace and satellite technologies.
Findings
Policy-makers managing the transition to a global low carbon economy will struggle when making the critical choices unless they have a clear understanding of the range of technological options available from different sectors within specific time horizons, and they will also require an appreciation of how their technological interactions will affect industrial structures.
Technological innovation and diffusion take too long under business-as-usual practices. Our findings confirm the mismatch between the urgency of climate challenges as set out by the Intergovernmental Panel on Climate Change (IPCC), and the time taken historically for technology systems to evolve and provide a return on investment. Sticking to what we know – and business-as-usual practices – will not bring these much-needed technologies to markets fast enough.
Analysis shows that inventions in the energy sector have generally taken two to three decades to reach the mass market. This time lag is mirrored by the time it takes for any patented technology to become widely used in subsequent inventions. Data on the top 30 most-cited patents from each of the six sectors examined here indicate that it takes between 19 and 30 years with an average of around 24 years. The process of regis-tering a patent can take up to three years. The diffusion time for clean technologies globally will need to be halved by 2025 to have a realistic chance of meeting climate goals.
Targeted policies will be needed if accelerated and wholesale deployment of these technologies is to be achieved. There is encouraging evidence that policy inter-ventions to encourage demonstration and deployment –
www.chathamhouse.org.uk
Who Owns Our Low Carbon Future?
viii
learning-by-doing – can be a major accelerator of the inno-vation process. Patenting rates and deployment in wind, solar PV and CSP (a good indicator of innovative activities) took off from the late 1990s, driven by policy interventions to create market demand in key countries such as Germany and Japan, and at regional level in the United States.
Companies and institutions in OECD countries will determine the speed of diffusion of the most advanced energy technologies in the next decade. Innovation and technological development primarily take place within the OECD countries and companies. This research finds no exceptions among the six selected technologies, including all the sub-sectors. Apart from in carbon capture, where the United States is far ahead of all other countries in terms of patents registered, companies and research insti-tutions from the United States, Japan and Germany are clear leaders in energy innovations. Much has been made of the fast growth in innovation capacities in emerging economies such as Brazil, China and India. But these countries have no companies or organizations in the top 10 positions in any of the sectors and sub-sectors analysed. (A few can be found among the top 20, pointing to these economies’ growing innovation capacities.)
Further data analysis shows that large incumbent companies – whether multinationals or national corpora-tions – are the main players today. Small and medium-sized enterprises (SMEs) account for a relatively small part of overall patenting in these sectors, in contrast to biotech-nology and information technology. The median age of wind-energy patent owners – the ‘youngest’ sector – is 54 years. This suggests that the most successful strategy for developing countries wishing to enter these areas may initially be driven by larger firms and be pursued through acquisition of foreign technologies rather than internal growth. It is important that such strategies for technological acquisitions are complemented by investment in indigenous innovation capacities in developing economies.
High-carbon companies control some of the key knowledge assets needed for the low carbon economy. Seven out of the top 20 owners of cleaner-coal patents are from the steel sector. Carbon capture and storage (CCS) technologies originate in a range of applications in the petrochemical, fertilizer and enhanced oil-recovery sectors.
The use of advanced alloys is critical for the next generation of wind, PV, CSP and cleaner-coal power generation.
The key question is how to identify the assets in high-carbon industries and harness them for low carbon technologies, in developing and developed countries alike. It is also important to ensure that climate policies offer sufficient incentives for inno-vation among important technology players. The current trend towards excluding heavy industry from climate-change regulations (e.g. by issuing free emission permits) may reduce these incentives, with negative spillover effects on the rest of the economy.
The concentration of patent ownership cannot be assumed to be synonymous with a lack of competition or a monopoly, but it can slow innovation and diffusion in some types of markets depending on companies’ business models. Company strategies will vary owing to differences in the composition of industries, the level of competi-tion, stages of development and market structure of specific energy systems. There are also fundamental differ-ences in terms of organizational and capital requirements between (for instance) the manufacture of solar cells and CCS retrofitting of 1GW coal power plants. In practice, companies with smaller patent portfolios can be more influential than is suggested by their patent rankings. But ownership (and maintenance) of a large number of related patents does imply a recognition of the commercial value of the inventions.
‘The top four wind-energy patent
owners – who collectively own 13
per cent of all wind patents – have
a 57 per cent share of the global
market for wind turbines, whereas
for solar PV, many of the top 10
manufacturers are not patent
holders ’

www.chathamhouse.org.uk
ix
Executive Summary and Recommendations
This study finds considerable variation in the levels of patent-ownership concentration. For instance, in terms of cleaner coal technology, the top 20 companies own around 42 per cent of total patents, whereas in CSP, the top 20 only have around 12 per cent of total patents. Consolidation is expected across the solar energy sector in the near future – a development that will change the composition of patent ownership. There are wide vari-ations across sectors: the top four wind-energy patent owners – who collectively own 13 per cent of all wind patents – have a 57 per cent share of the global market for wind turbines, whereas for solar PV, many of the top 10 manufacturers are not patent holders.
Intellectual property rights can be a factor affecting the speed of technology diffusion. A patent portfolio is a form of currency that can be used to attract venture capital, facilitate entry into strategic alliances, provide protection against litigation, and create opportunities for mergers and acquisitions. Many of the energy patent owners listed in this report are established industrial giants. Their perception of market conditions and of the level of IP protection in developing economies will do much to determine the rate of roll-out of the next generation of low carbon technologies – whether through investment, licensing, joint ventures or other forms of knowledge-sharing.
One worrying trend is the increase in patent-related litigation in fast-maturing technologies. While it is understandable that patent owners seek to assert their right to protect their inventions and markets, protracted lawsuits can slow the diffusion of key technologies by decades. Litigation poses particular difficulties for smaller companies with only a few key inventions.
Transformative change cannot be achieved by domestic action alone. Cross-border trade and investment in low carbon and energy-efficient goods, services and technolo-gies need to be encouraged and scaled up. Stimulating low carbon trade will create virtuous cycles, creating further investment opportunities and expanding the market for key technologies.
In a global market, the cost of technology can come down quickly as economies of scale are achieved through large-scale deployment. Since the 1970s, with the
exception of nuclear power, the costs of energy produc-tion and use from all technologies have fallen systemati-cally as innovation and economies of scale have increased in manufacture and use. An ultra-supercritical power plant – using an advanced cleaner-coal technology – can now cost a third less in China than a less efficient coal-fired power station of similar scale in the United States, largely because China is building many identical power plants at the same time.
By adopting advanced technologies – and strength-ening their innovation capabilities – developing countries have an opportunity to leapfrog the resource-intensive, highly polluting growth phase experienced by Western countries, but they will need a great deal of help to do so. Among emerging economies, China is in a unique position to bring new, clean energy technologies to maturity because of the size of its domestic market and its position as a supplier of consumer and industrial goods to international markets.
The analysis in this report also demonstrates that as energy technologies mature, advances in design, site selection and operation increasingly depend on innova-tion in information and communication systems. Many energy technologies are also dependent on innovation in advanced materials, e.g. alloys. This means that developing countries such as India and South Africa with strengths in these sectors are well placed to capitalize on the growth opportunities that will emerge as these technology systems evolve, since they can benefit from shifts in global invest-ment patterns towards low carbon energy and production methods with targeted assistance. There is mutual global benefit in ensuring that climate and technology policies would support such a shift.
Greater international cooperation is needed to double technology diffusion rates. Today, cooperation on inno-vation is primarily a national, not an international, activity. Across the six sectors, only 1.5 per cent of total patents are co-assigned (i.e. list more than one company or institution as co-owners). No fewer than 87 per cent of co-assigned patents are the results of collaboration between companies and/or institutions from the same country. This internalization of collaboration is especially noticeable in the data for Japan. While there is some

www.chathamhouse.org.uk
Who Owns Our Low Carbon Future?
x
collaboration among OECD countries, only two per cent of joint patents are shared between companies and institutions from developed and developing countries. The lack of data means it is impossible to analyse intra-company cooperation across borders.
Technological-system overlaps mean that no one country can provide all the options. Analysis of inventor networks shows a very high level of private-sector cross-fertilization among companies and insti-tutions in the development of new technologies. To speed up diffusion, there is a need to broaden these inventor networks to encourage faster cross-fertili-zation between inventions from different sectors in different countries.
Government policy that aims to be technology-neutral and support national champions may hinder global inno-vation in energy systems. To some extent, existing indus-trial structures, regulatory regimes, research capabilities of private and public institutions as well as other supporting infrastructure are already pre-determining the types of investments or technologies that are most likely to take off in the coming decades. Given the importance of innova-tion from outside the energy sector to the development of energy technologies, proactive innovation and climate change policy-makers face a complex challenge in both monitoring technological and commercial developments across a wide range of sectors and devising interventions that promote change.
International cooperation is needed to build and strengthen innovation linkages among different indus-trial sectors, especially those between developed and developing economies. Ultimately, the bulk of the decar-bonization needed in fast-industrializing countries will be delivered by their own businesses and institutions. Coordinated action is not just optimal but critical. In designing global solutions it will be necessary to strike a careful balance between private interests and the delivery of global public goods, and to take into account the social and economic needs of developing countries. New incentive systems and collaborative mechanisms at bilateral, regional and international levels will be essential to encourage technological innovation, demon-stration and diffusion.
Recommendations
Transforming the marketplace through international
cooperation
At the global level, the Copenhagen Summit must send credible and unambiguous signals to the global markets that far-reaching change is imminent and inevitable. Joint-venture companies, cross-training programmes, cross-licensing arrangements, trade tariff exemptions on selected technologies and joint manufacturing programmes are all tried-and-tested methods that could be stepped up at national and local levels. Governments can also help shape the global value chains of clean energy sectors through:
• Supporting global demonstration programmes. These are required for large-scale, high-risk technologies such as CCS and CSP. The size and complexity of demonstrating these technologies, which often includes intricate planning and infrastructural support, make it difficult for the private sector to independently finance demonstration. Public funding in the form of grants, loans and risk guarantees is therefore necessary to ensure these technologies can become fully commercial. The joint nuclear-fusion project ITER is an example of a wide-ranging international collaboration project.
• Maximizing the potential of technology standards bodies. Technology standards can play an important role in accelerating innovation in an industry, by removing bottlenecks and encouraging economies of scale. This report demonstrates the value of maintaining ongoing maps of potential technology standard hotspots, including the patents that underpin them. There is scope for the formation of industry-level technology standards bodies to set increasingly high standards, bring in the laggards and accelerate diffusion.
• Supporting open innovation mechanisms. A range of climate technology prizes should be established to promote innovation in all areas that support climate mitigation and adaptation. Other forms of open innovation platforms should be developed to strengthen incentive structures for innovation and knowledge-sharing.

www.chathamhouse.org.uk
xi
Executive Summary and Recommendations
Forging more collaborative rules of the game
There are significant opportunities to accelerate bilateral and multilateral collaboration on R&D and technology develop-ment. Greater incentives are needed to accelerate collabora-tion across national boundaries, without relegating national priorities to second place (something that is unlikely to be politically sustainable). Potential avenues include:
• ‘Model’ R&D cooperation agreements. Government support for clean energy innovation is more likely to be effective at the early stages of the develop-ment of technology systems. There is a need for ‘model’ technology cooperation agreements that would limit the potential of patent-related conflicts and encourage joint development, especially those between developed and developing economies.
• Publicly backed energy patent pools and knowledge-sharing platforms. Through tax, other fiscal or investment incentives, the public sector should support the design and creation of patent pools and cross-licensing schemes to encourage innova-tion and mass diffusion for relevant technologies. These patent pools can be used to support innova-tion in SMEs and emerging markets in exchange for a royalty fee. Collaborative initiatives such as the European Commission’s European Technology
Platform for Zero Emissions Fossil Fuel Power Plants (ZEP) demonstrate the potential of stake-holder advice platforms, and can provide support for knowledge-sharing structures at the regional level (in this case the EU). Such initiatives could be emulated in other regions or used as a starting point for multilateral efforts.
• A global database on licensing data and best practices. Very few data on licensing deals, cross-licensing initiatives or patent pools are available in the public domain. The development of a reliable patent-licensing database could assist in setting benchmarks and sharing best practices. As a first step, there is a role for an escrow service, provided by a trusted third party, through which private-sector data are pooled and shared on an anonymous basis on the open market to set bench-marks. There is also a role for institutions such as the World Intellectual Property Organization (WIPO) to set up global databases on licensing and cross-licensing regimes as well as patent pools on climate-friendly technologies. Patent owners could register their licensing deals (and showcase their latest commercial success) within a specified time period (such as 18 months) to protect their latest commercial interests.


www.chathamhouse.org.uk
1
Introduction
Decarbonizing global energy use will require the deploy-ment of new and existing technologies to unlock the potential of a wide range of energy sources, user-tech-nologies such as lighting, vehicles, motors as well as infrastructure such as buildings. This report aims to add clarity and empirical research to the crucial yet increas-ingly polarized debates around intellectual property rights (IPR) and energy technology by using data on the patents registered by researchers to protect their techno-logical inventions.
A patent gives its owner protection over the covered invention from unauthorized use within a given territory for a limited period of time (generally 20 years). The patent owner – known as the assignee – can provide a licence to others to use the technology in return for royalties. This means that patents are not just a tool for protecting property rights but are in fact strategic tools used by their owners for a variety of purposes.
Many assertions have been made by governments, companies and non-governmental organizations about the role of IPR in facilitating or hindering the innovation, commercialization and diffusion of low-carbon technolo-gies. For the proponents of a patents-based innovation system, IPR are the bedrock of societal innovation and the propeller of the diffusion of key technologies. But some developing countries question the basis for the temporary monopolistic rights granted to assignee/owners, especially when the knowledge is essential for promoting public-policy goals such as climate change mitigation and adapta-tion. Today, there is a polarized debate between advocates for strengthened IPR laws to encourage innovation and diffusion of climate technologies on the one hand, and those
calling for more IP-related flexibilities to encourage access to key technologies by developing countries on the other.
Chatham House and Cambridge IP have over the past nine months conducted an extensive patent-landscaping exercise on six energy technologies to analyse concentra-tion in patent ownership by countries and companies. This involved creating a unique collection of patent databases drawn from all the publicly available sources of patent data. The goal of this analysis is to assist stakeholders in moving away from an ideological stance towards evidence-based analysis and set a new standard for debate on issues around IP and climate change.
Patent-landscaping involves creating specific databases for individual sectors or ‘technology areas’. It is a tried-and-tested exercise used by the private sector – including venture capital groups and acquisi-tive corporations – to identify competitors, including as yet unknown or underappreciated ones. It can provide a comprehensive understanding of the new drivers for innovation within a specific sector, and identity oppor-tunities for investments.
So far, most policy-related energy patents analysis have relied on International Patent Classification (IPC) patent codes to define each technology space and have stopped short of sub-sectoral analysis.1 (IPC patent codes are used by patent authorities to provide for a hierar-chical system of language-independent symbols to classify patents according to the different areas of technology to which they pertain.) While a useful first step, the IPC-led approach has many shortcomings as the codes do not account for overlap of technology systems.
This report demonstrates that it is possible to get a handle on the ever more complex international patent landscape, and to extract critically important business intelligence information that can inform private-sector and public policy alike. The micro and macro data that the analysis provides can be used in the development of targeted policies and in interactions with stakeholders.
Six emerging energy technologies are analysed: wind, solar photovoltaic (PV), concentrated solar power (CSP), biomass-to-electricity, carbon capture and cleaner coal. These were selected because of their current and future importance to energy supply around the world.

www.chathamhouse.org.uk
Who Owns Our Low Carbon Future?
2
The first three are examples of renewable technologies at different stages on the innovation pathway: wind, solar PV and concentrated solar power. A fourth, biomass-to-electricity, is also sustainable if the fuel source is managed carefully. Each of these technologies has the potential to make a deep and permanent contribution to the decarbon-ization of our energy systems.
Carbon capture is not a renewable technology but has the potential to make a dramatic impact by capturing emissions from coal and gas plants that would otherwise be vented to the atmosphere. Carbon capture (and storage, which is not covered by this study) is a complicated system of technologies requiring high levels of international coop-eration, a dimension which patent rates can shed light on.
Finally, coal technology continues to be installed apace, especially in emerging economies. Ultimately, installing more efficient, cleaner coal power production will add to global emissions, not reduce them. But in the short term it can make a contribution by avoiding even greater emissions where the construction of more coal plants – for now – appears inevitable. This will depend on the best technologies being available to emerging economies. The distribution of patents in this mature technology space gives us particular insight into the level of capacity and collaboration in an advanced energy technology.
This report addresses the following set of questions:
1. Overview of the patent landscape. What is the comparative rate of technological innovation across the six energy sectors? What is the volume of patents in each energy field and sub-field? Who are the key owners of patents within each sector? What is the geographical distribution of patents by location of assignees and coverage? How does patent ownership differ among technologies when compared by patent filings and patent families?
2. IP ownership concentration. What is the concen-tration of patent ownership in individual sectors? What are the characteristics of patenting strategies in individual sectors? How do firms use their patent portfolios to achieve strategic commercial goals? What is the level of collaboration among assignees?
How important is IP for companies in informing their commercial and investment strategies?
3. Relationship between technology systems. How do technology systems overlap? What are the impli-cations for policy-makers? How does the role of patents differ between technology systems? Have patents been used by companies to block innova-tion or diffusion of key climate technologies as part of their commercial development strategies in competing sectors?
4. Policy implications. How can the value of public and private investment in low carbon technologies be maximized? How can systems and mechanisms to speed up the diffusion of low carbon technologies be created? What are the implications for climate and other negotiations?
Note on limitations of project methodology
There is a lag of up to 18 months in the publication of patent data by various patent offices. Rapid changes are anticipated for the energy sector in the coming decade.
Only a limited amount of information is available elec-tronically on patents from India. This may have resulted in an underestimate of Indian innovation in many of the focus areas of this report.
The searches were performed in English. These capture the vast majority of commercially relevant patents and patent families – from their point of entry into the Patent Cooperation Treaty (PCT) system. It is likely that owing to language differences a small number of patents still in the national phase have been missed.
Notes1 Copenhagen Economics A/S and the IPR Company ApS (2009), Are
IPR a Barrier to the Transfer of Climate Change Technology?, 19 January,
http://trade.ec.europa.eu/doclib/docs/2009/february/tradoc_142371.
pdf; Johnstone, N., Hascic, I. and Popp, D. (2008), ‘Renewable Energy
Policies and Technological Innovation: Evidence Based on Patent Counts’,
NBER Working Paper 13760, January; Antoine Dechezleprêtre, Matthieu
Glachant, Ivan Hascic, Nick Johnstone and Yann Ménière (2008),
Final Report on Invention and Transfer of Climate Change Mitigation
Technologies on a Global Scale: A Study Drawing on Patent Data, CERNA,
December, http://www.nccr-climate.unibe.ch/conferences/climate_
policies/working_papers/Dechezlepretre.pdf.
www.chathamhouse.org.uk
3
1. IPR and Climate Change: Friends or Foes?
The Fourth Assessment Report of the Intergovernmental Panel on Climate Change (IPCC) concludes that for the rise in average global temperatures to keep within 2oC above pre-industrial levels, global emissions must peak before 2020 and be reduced to 50–85 per cent below 2000 levels by 2050.1 Delaying action will require much faster rates of reduction later. If there is a 10-year delay in reducing emissions, the rate of cuts required increases over a five-year period from 14 per cent to 31 per cent.
Delivering these policy outcomes will be difficult at a time of global economic crisis and volatile energy prices unless these forces themselves can be harnessed in support of lower carbon investment. According to the International Energy Agency (IEA), states and markets need to stimulate opportunities in low-carbon and energy-efficient investments across the globe, and generate $44 trillion of investment by 2030 (above business-as-usual projections).2 This means:
1. Aggressive deployment of existing and near-to-market technologies for global emissions to peak and reduce by 2020, and to avoid carbon lock-in. These include energy efficiency across all sectors, large-scale renewable energy, and cleaner coal with carbon capture and storage (CCS) to cover the residual need for large-scale fossil-fuel-based industrial and power generation;
2. Investment in research and development (R&D) and demonstration of new generations of breakthrough
technological solutions to build the capacity to make deep long-term emission cuts by 2050;
3. Deploying technologies simultaneously in developed and developing countries through equitable interna-tional collaboration mechanisms to lower the cost and risk of technology investment and to encourage national action in developing countries, and
4. Balancing the search for cost-effective approaches with the need for a strong mix of policy interventions.
As the countdown towards the post-Kyoto negotiations in Copenhagen in December 2009 continues, innova-tion and technology have become key features of the international debate. Promising signs emerged from the Major Economies Forum (MEF) in July 2009 as developed countries declared their intent to double their current commitments on technology assistance by 2015. Perhaps even more promising is the fact that a pre-Copenhagen deadline of November was set for outlining ‘action plans and roadmaps’ for how this will be achieved.
Against this background, dealing head-on with the issue of intellectual property rights (IPR) now becomes critical. The United Nations Framework Convention on Climate Change (UNFCCC) negotiating text (released in May 2009) has made explicit reference to different options, including compul-sory licensing, patent pools of publicly funded technologies and using the precedent set by multilateral action such as the Doha Declaration on the World Trade Organization’s Agreement on Trade Related Aspects of Intellectual Property Rights (TRIPS) and Public Health. Perhaps the most radical proposal set out in the draft document is that which calls for least developed countries (LDCs) to be
exempted from patent protection of climate-related
technologies for adaptation and mitigation, as required
for capacity-building and development needs. Genetic
resources, including germplasms of plant and animal
species and varieties that are essential for adaptation in
agriculture, shall not be patented by multinational or any
other corporations.
Such broad language in the draft text has not only resulted in a heavily bracketed document for negotiations in the
www.chathamhouse.org.uk
Who Owns Our Low Carbon Future?
4
run-up to Copenhagen, but also led to a strongly worded resolution passed in the US House of Representatives calling on the president to ensure the protection of IPR in the climate negotiations. This was followed by a number of media interventions by the US Chamber of Commerce’s Global Intellectual Property Center, similarly calling for the upholding of existing IPR laws at Copenhagen.
To date, civil society groups have been somewhat divided on exactly what the role of IPR should be in a global climate deal. The NGO Copenhagen Treaty, written by a team of 47 experts from a range of environment and development NGOs, simply calls for a clear framework for reducing and eliminating IPR barriers to the deploy-ment, diffusion and transfer of technology, based on the approach of ‘protect and share’, with little sense of which mechanism is best suited to achieving this goal.
1.1 Meeting climate challenges through smart technology policies
Despite broad agreement on the importance of clean-energy technology, there has been only slow progress on developing and implementing a practical and effective technological innovation and diffusion system to drive the transition to a global low carbon economy at scale.
While the traditional concept of ‘technology transfer’ implies a process through which a piece of equipment or a blueprint is transferred to a recipient company or country, this is only half the story. Moving up the technology ladder for a company or country is as much about having access to the hardware as it is about acquiring the know-how to use it effectively.3 As production processes become more knowledge-intensive, technology transfer increas-ingly demands ‘learning by doing’, through use and inter-action with experts, rather than solely through physical ownership of a particular technology.4
Two complementary forces govern the incentives for innovation: technology push – targeted R&D investment by governments and the private sector to move scientific discovery towards commercialization – and market pull – incentives to bring products to market that include pricing mechanisms and regulatory standards.
Both push and pull instruments can be used by govern-ments to shape and accelerate the innovation chain. In competitive markets, firms tend to under-spend on R&D relative to the optimal level for society, for fear of being unable to capture adequate returns to justify the upfront investment.5 Governments have sought to correct this market failure by offering some types of reward to encourage innovation. These ‘market pull’ efforts include granting innovators (temporary) monopoly rents through, for example, patent protection. This is often comple-mented by other inducements and subsidies for research in priority areas (e.g. small population diseases, environ-mental controls). Market ‘push’ incentives can include research grants, tax credits, and direct or partnership-based research by governmental agencies. Making these incentives accessible to new entrants is critical.6
There are many known and studied barriers to techno-logical innovation and diffusion. These include investment conditions and infrastructural constraints as well as absorp-tive and innovation-generative capacities in developing countries. US academics have led analysis of the technology ‘valley of death’, in which publicly funded energy innova-tions languish for decades without being taken forward as commercial developments owing to a combination of failures around ‘technology push’ and ‘demand pull’ forces in the energy sector.7 Uncertainties around both domestic and international regulations and pricing structures can stall investment, discourage collaborative projects and generally dampen investor confidence. Persistent policy uncertainty, for example, has entrenched a pattern of boom and bust in the renewables and energy efficiency sectors.
The incentive structures change along the innovation chain. The appropriateness of measures and incentives may vary according to the technology (including its market structure), the countries to and from which it is to be transferred and deployed, national and regional industrial strengths, and other local considerations. The stage of development of the technology is also important. Pre-commercial power generation technologies such as integrated gasification combined cycle (IGCC), for example, pose different risks and different IPR issues from commercial end-use technologies such as onshore wind energy where the challenge is to achieve wider diffusion.
IPR and Climate Change: Friends or Foes?

www.chathamhouse.org.uk
5
Despite the urgent need for next generation technologies, it is critical that the substantial gains achievable through better energy efficiency are not overlooked. Achieving them requires the diffusion of incremental technologies (e.g. improved insulation and furnace technologies) as well as of practices (e.g. congestion charges, industrial process optimization training, lean manufacturing/quality management and SCADA systems). These soft practices and incremental improvements also have different barriers to implementation than large-scale capital investment in technologies currently on the horizon. They also involve a wider range of technologies and industries.
For the energy sector, the general assumption is that the development and dissemination of low carbon options suffer from two major market imperfections.8 First, signif-ican research and development (R&D) is required, but their benefits are not necessarily appropriable to the firm making the investment. Use of patents and other forms of IP protection (such as design rights or trade secrets) is one way in which companies increase their ability to recoup their R&D investments. The second market imperfec-tion is that the social benefit of reducing greenhouse gas emissions is not yet generally reflected in pricing struc-tures. Without regulations and subsidies, it may not be profitable to deploy socially desirable technologies.
Patents are intended to act as incentives for innova-tion – providing exclusive rights to the use of particular
inventions for a fixed period. The expectation is that the exclusivity will enable the firm holding the patent to charge a price above the marginal cost of production and thus to recoup the investment. In return, inventors are required to disclose sufficient information in their patents, so that society can benefit from the increased knowledge about technologies. Traditional economic analyses have frequently taken for granted that patents are liquid and tradable goods, and have not explored inter-sectoral differences in how they are used in practice.9
‘Compulsory licensing’ describes a number of mecha-nisms for non-voluntary authorization to use patents. While contentious, it is a tool used by many governments to accelerate the diffusion of the latest technologies,10 and they justify its use as necessary to correct a market failure in the service of a public good. The US Clean Air Act, for example, mandates the compulsory licensing of patented technologies needed to meet agreed standards. In August 2006, a court in the United States granted Toyota a compulsory licence on three Paice patents for hybrid transmissions, for a royalty of $25 per automobile.11 The most important global norm for the use of compulsory licences is Article 31 of the WTO’s TRIPS Agreement, which addresses uses ‘of a patent without the authorization of the right holder, including use by the government or third parties authorized by the government.’12
Box 1.1: How are disputes over IP settled?
Disputes under World Trade Organization TRIPS: Settling disputes is the responsibility of the Dispute
Settlement Body (the General Council in another guise), which consists of all WTO members. The Dispute
Settlement Body has the sole authority to establish ‘panels’ of experts to consider the case, and to accept or
reject the panels’ findings or the results of an appeal. It monitors the implementation of the rulings and recom-
mendations, and has the power to authorize retaliation when a country does not comply with a ruling.
Disputes at EU level: The European Court of Justice is the dispute mechanism that would be used where
disputes arise between European Union member states. The Court has the power to settle legal disputes
between member states, EU institutions, businesses and individuals.
Individual company disputes: The World Intellectual Property Organization (WIPO) Arbitration and Mediation
Center (established in 1994) offers Alternative Dispute Resolution (ADR) options for the resolution of interna-
tional commercial disputes between private parties.
Source: UKIPO, www.ipo.gov.uk
IPR and Climate Change: Friends or Foes?
www.chathamhouse.org.uk
Who Owns Our Low Carbon Future?
6
1.2 IPR and business strategies
In practice, there are wide differences in the ways IPR are used by companies, both within and among industrial sectors. These range from highly protective practices to active advocacy for open innovation models. The choice of IP-management strategy is dictated by context, the strategic behaviour of individual actors, as well as industrial history. No single IPR usage or practice can be said to be optimal for all companies or industries. This is an important policy lesson. A good understanding of how IPR are used in practice by companies is helpful to policy-makers as they engage with the private sector in developing an optimal IPR management regime for climate technology diffusion in different sectors. The different ways in which companies can use their IP as part of their business practices are outlined below.
1.2.1 Licensing13
Licences are frequently used as part of business practice. Patent owners license the use of IP in return for a fee, rather than resorting to litigation or other enforcement actions. Models include:
a. Pure-play: This is demonstrated by companies such as ARM (in developing central processing units for mobile phones) and CSR (in Bluetooth technology), which focus on prototyping technologies used by a network of suppliers. The ease of use and utility of the licensed technology is critical to their business models.
b. Start-up licensing: The patent owner grants a licence to a newly formed company (such as a corporate spin-off) with the express purpose of commercial-izing a technology.
c. Divestiture licensing: When exiting a business area, the technology owner may seek to recoup past R&D investments.
d. Controlled licensing: The owner of a superior tech-nology, also a commercial operator, rations the flow of licences to limit expansion by competitors.
1.2.2 Financing and investment
Patent portfolios can be a strong signal of quality and market potential for technology start-ups in science-
intensive industries such as biotech and nanotech, but also increasingly in software.14 A strong patent portfolio can be seen as a prerequisite for investment by venture capital (VC) companies. Control over the company’s core technology is crucial in securing an open space in which a product can be developed and launched. The typical VC funding round will include a budget for expanding the patent portfolio. Patent infringement lawsuits are frequently timed to coincide with the preparations for an IPO (initial public offering) or a trade sale – times at which the investors cannot afford the negative publicity of litiga-tion, and may therefore be forced to settle out of court.15 In some cases IP can be directly securitized, with some niche German banks also providing company funding to family-owned businesses with strong patent portfolios. In Silicon Valley some of the VC-focused law firms have also used patent rights as collateral or payment in kind in return for early start-up services.
1.2.3 Blockage
Patents can be used to block entry into a market space or the sale of a product that infringes the rights of the patent-holders. Decisions by patent owners to assert their rights (through a patent lawsuit) are mainly informed by strategic and economic considerations – whether such an action supports the company’s growth strategy and whether the monetary and strategic benefits justify the litigation costs. Some companies have been found to use patents as a complement to a market dominance strategy.
In the 1980s South Korean companies such as Samsung were gearing up their presence in the US market. In 1988 Samsung was sued by Texas Instruments for violation of patents in a US court. Samsung lost the case and had to pay over US$90 million, incurring huge damage to its brand in the US market. Following the lawsuit, Samsung overhauled its patent management strategy. This resulted in to a vastly increased patent portfolio and increased use of licensing-in of technology. By the 1990s Samsung was suing Texas Instruments on patent-related issues.
In Europe, a case was brought against Tetra Pak – a global leader in packaging – which had pursued an aggres-sive patenting strategy to block new developments and protect its strong market position.16 A lawsuit brought by
IPR and Climate Change: Friends or Foes?

www.chathamhouse.org.uk
7
Zond Energy Systems (subsequently acquired by Enron and then GE) against Enercon blocked the German company from operating in the United States until a joint-licensing agreement was signed with GE in 2004.17
1.2.4 Industry cross-licensing
Members of a cross-licensing agreement can use one another’s IP. Depending on the terms, outsiders can be prevented from joining an alliance. The terms of licensing and renewals, governance structures and continued inno-vation around a standard are some of the factors that influence the innovation impact of such alliances. A cross-licensing regime can make it easier for new entrants to avoid infringement and benefit from the technology efforts. Enforcement of a cross-licensing regime can also be achieved through litigation (or the threat of litigation), sometimes used to induce new players to enter the cross-licensing arrangements.
1.2.5 Technology standards bodies
Technology standards bodies are industry associations administering key technology standards on behalf of the market. Typically the entrants will contribute IP for mutual use, which means cross-licensing agreements are often part of these associations. All members can use IP within agreed boundaries and may be required to pay royalties into a common pool. Examples of such technology standards bodies include the European Telecommunications Standards Institute (ETSI), which has had an important role around the management of GSM, GPRS, 3G, WiMax and other related standards, and the Continua Alliance, which develops common inter-compatibility standards for medical diagnostics devices. South Africa’s ESKOM co-founded the STS Association, a standards body tasked with admin-istering the standards around pre-paid metering (now a globally accepted standard). Technology standards bodies may also act as a protective umbrella against infringement litigation by non-members.
1.2.6 Licensing for production
Licensing for production sees IP used in ways prescribed by the technology owner: typically to enhance quality of production, and ensure that the quality and design of
components are consistent with those of other suppliers, and final assembly requirements. The IP that is licensed may be patented or trade secrets. In sophisticated systems assembly the lead company will play a central role as a design, production and assembly co-ordinator. It will also coordinate business development and deployment with final consumers. Collaborative production however means that the consortium/supplier group as a whole is commer-cially exposed to weaknesses in IP. For example, each components supplier for the Airbus 380 programme has its own supplier chain. Innovations developed within the A380 programme are patented by the different suppliers, shared under the A380 programme, but also used in other sides of the operation of the respective suppliers.18
1.2.7 University-to-industry technology transfer
Universities increasingly license the use of their research or form a spin-off business. A variety of business models is used, including in-house models (primarily used by large, well-resourced universities), pooling resources through a regional partnership or small conglomerate of similar-sized institutions, partnering with a specialist IP organiza-tion or a corporatization model which sees a university’s technology transfer office turned into a private (and often listed) corporation.
1.2.8 Risk pooling
This involves consortia of major players seeking to pool risks and resources for highly capital-intensive and risky ventures. IP is pooled or shared, but arrangements differ. Again, the A380 programme is one example.
1.2.9 Strategic leadership
Companies may license technology to partners or others in the market to influence the strategic development path of technologies. For example, by opening up the Symbian platform to other industry players, Nokia has achieved market dominance for its operating system. Users of the S60 software platform are licensed under a non-discrim-inatory, capabilities-based accreditation programme. This strategy was primarily aimed at addressing competi-tion, initially from Microsoft’s Windows Mobile platform, and more recently from Google and Apple. The goal
IPR and Climate Change: Friends or Foes?

www.chathamhouse.org.uk
Who Owns Our Low Carbon Future?
8
of maintaining strategic leadership in an industry was a powerful motive for opening up a proprietary and patented platform. Nokia remains at the centre of a huge and increasingly diverse value chain of suppliers, competi-tors and application developers.
1.2.10 Enforcement licensing
Here the seller or licensor seeks to enforce patent claims against a licensee that may have overstepped the param-eters of the licensing agreement, or an infringer. In most cases enforcement licensing will take place out of court, and will target companies that have already commercial-ized a technology.
1.2.11 Patent trolls
Patent trolls are a special case of enforcement licensing where ‘non-practising’ or ‘non-manufacturing’ entities accumulate patent rights and strategically position them-selves to collect licensing revenues. While this practice is legal, patent trolls are often regarded as ‘free-riders’ in the IP industry.19
1.3 Patents and technological innovation in the energy sector
Many have pointed to the differences in incentive structure for technological development in the energy sector as compared to others, such as the pharmaceutical industry within which there has been much debate over the patent-based model of product development. The relative uniformity of the pharmaceutical sector stands in contrast to the emerging diversity of the technological development and business models in the energy sector. The expectation is that there will be competition both within the general product area (e.g. wind turbines) and among different methods of producing electricity or fuel.
According to the World Business Council for Sustainable Development (WBCSD), the royalty cost for energy patents represents a small share of the total investment cost.20 It argues that the bulk of the cost of bringing a new technology to market relates to the ‘soft’ aspects, for example operation and maintenance
practices, training and organizational procedures, which are not patentable. From their perspective, the real issue for developing countries is not the accessibility of technologies or the price of the patents, but the lack of capital and management. This view is echoed by the Stern Review on the economics of climate change.21
Regardless of the actual cost associated with royalty, patents provide powerful financial and strategic incentives for companies that can shape the incentive calculus for innovation and diffusion. In addition to attracting VC, a patent portfolio is also a currency for use in strategic alliances and protection against litigation, as well as in opportunities for mergers and acquisitions. The interplay between financing and access to patents is a critical issue for the new entrants – in developed and developing countries alike.
Previous studies have noted that patents can be used to deter the entry of competitors and shape the industry into an oligopoly able to charge prices above marginal costs and thus to support further research to entrench this position.22 Others have argued that patents are necessary to attract investment in research and that they do not give an unfair advantage to incumbents.23 Patented innovations are also likely to provide a basis for developing a differentiated product with features that will help gain larger market share for companies. Clearly, the costs of the innovations are not shared by competitors, unless there is a cross-licence, and prices may be somewhat above marginal costs. The likeli-hood that the patent system will greatly encourage research, that there will be cross-licences to spread the technology, and whether such cross-licences will encourage innovation and its adoption are all dependent on the competitive condi-tions of the industry. While IP can incentivize R&D invest-ments, it is not a sufficient condition for diffusion.
Weak IP protection certainly slows diffusion efforts in some developing countries.24 Leading firms have openly cited weak IP protection in host countries as reasons for with-holding their latest technologies from certain markets. Their willingness to license for production or sale may depend on their confidence that they can do so without losing control. Aside from the strength of the host countries’ IP systems, these decisions are also a function of IPR management norms, which differ from one industry to another.25
IPR and Climate Change: Friends or Foes?
www.chathamhouse.org.uk
9
Before specific technologies and business models emerge as the successful option, market processes on their own may slow the rate of technology diffusion, locking in to business models that are subsequently revealed as sub-optimal.26 Early leaders of new technolo-gies may also have disproportionate influence – partly backed by their strong IP position, their participa-tion in the setting of standards, or control of supplier and distributor networks. Their business models often determine the shape of market institutions to come.
Consider the example of electric versus combustion engine automotive systems in the early 1900s. Electric cars at one point out-sold combustion-engine cars, holding the land speed record until 1899. But the emergence of the mass-produced combustion-engine car (led by Ford), the discovery of oil in the United States, and an under-developed electricity network contributed to the rapid adoption of the combustion-engine, supported by the network externalities of an enabling infrastructure of fuel stations and refineries.27 It has taken more than 100 years for electric vehicles to become a viable alternative again on the back of high gasoline taxes, higher oil prices, climate concerns, changing consumer preferences, new battery technologies and public support for urban recharging networks. But in the absence of these factors, an ‘on paper’ more efficient technology could be too expensive to adopt owing to the lack of a support infrastructure.
Many prototypes compete for resources (from theoret-ical and applied R&D to demonstration efforts), especially in the early stages of technological development. While innovators may come to realize that their technologies are unlikely to be commercialized, they often remain reluctant to share proprietary knowledge gained as a result of ‘failed’ efforts. This can escalate the cost of developing viable technologies considerably by preventing successors from building on the lessons of past efforts.
Innovation and diffusion in some sectors will be driven by technical standards, not just price. To meet prescribed standards, users may need to use patented technologies. In a small number of cases standards and technical regula-tions may (inadvertently or by design) reduce options for the use of existing and future technologies – whether in the form of technical production methods or product-specific
features. At the same time, when designed appropriately, technology standard agreements can accelerate innova-tion and protect the participants from patent infringement lawsuits from those outside the alliances. The implications of dual ‘lock-in’ – proprietary/closed standards and patent protection – for the diffusion of existing and horizon climate technologies (from fuel efficiency to low carbon industrial production standards) must be factored into policy and regulations.28
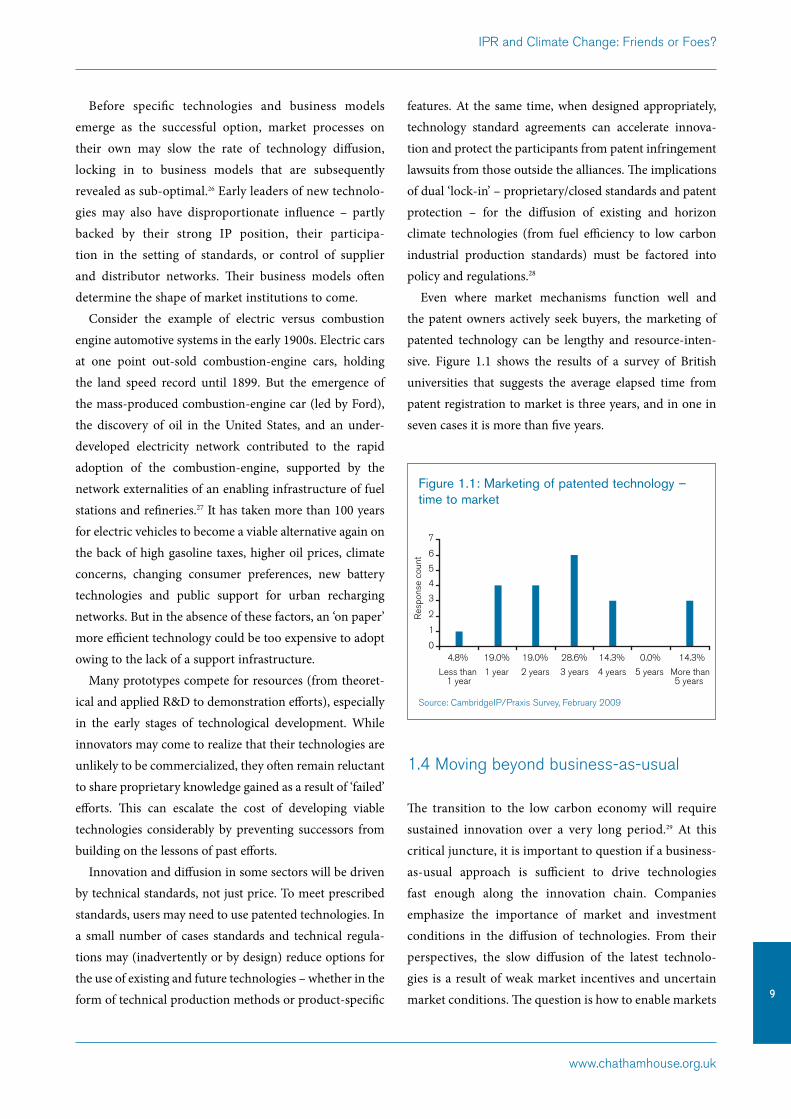
Even where market mechanisms function well and the patent owners actively seek buyers, the marketing of patented technology can be lengthy and resource-inten-sive. Figure 1.1 shows the results of a survey of British universities that suggests the average elapsed time from patent registration to market is three years, and in one in seven cases it is more than five years.
Figure 1.1: Marketing of patented technology – time to market
1.4 Moving beyond business-as-usual
The transition to the low carbon economy will require sustained innovation over a very long period.29 At this critical juncture, it is important to question if a business-as-usual approach is sufficient to drive technologies fast enough along the innovation chain. Companies emphasize the importance of market and investment conditions in the diffusion of technologies. From their perspectives, the slow diffusion of the latest technolo-gies is a result of weak market incentives and uncertain market conditions. The question is how to enable markets
Res
pons
e co
unt
7
6
5
4
3
2
1
04.8% 19.0% 19.0% 28.6% 14.3% 0.0% 14.3%
Less than 1 year
1 year 2 years 3 years 4 years 5 years More than5 years
Source: CambridgeIP/Praxis Survey, February 2009
IPR and Climate Change: Friends or Foes?

www.chathamhouse.org.uk
Who Owns Our Low Carbon Future?
10
to push technologies along the innovation chain at the pace we need.
Estimates vary as to the rate at which low carbon tech-nologies need to be introduced in order to stabilize the global climate. However, in all cases these proposed targets far exceed the current rate of deployment and in most cases they will require a rate far higher than the greatest ever annual deployment of the particular technology. Table 1.1 indicates the scales required in the electricity sector, according to the International Energy Agency.
Many steps are needed to take technologies from theory to market. The speed at which new technologies are developed and diffused will be crucial in meeting objectives in the reduction of emissions and in the security of supply. The following chapters look at the lessons from patent-mapping for the design of more strategic, precise and large-scale technological develop-ment policies that have the best chance of fast-tracking these critical technologies to market. They explore the linkages between the micro-dimensions of technological development (individual inventors, company strategies, and organizations) to the macro picture of relative
national strengths in specific low-carbon energy sectors and subsectors.
Notes1 Intergovernmental Panel on Climate Change (2007), Summary for
Policymakers, in Climate Change 2007: Fourth Assessment Report,
Synthesis Report (AR4), Cambridge University Press.
2 International Energy Agency (2008), Energy Technology Perspectives
2008.
3 Cheng, C. (2005), ‘Electricity Demand-side Management for an Energy
Efficient Future in China: Technology Options and Policy Priorities’.
Doctoral Thesis dissertation. MIT, p. 262.
4 Mytelka, Lynn K. (1999), Competition, Innovation and Competitiveness: in
Developing Countries, OECD, 1999.
5 Jones, C. I. and Williams, J.C. (1998), ‘Measuring the Social Return to
R&D’ in Quarterly Journal on Economics, 113 (4), 1119–35, http://
www-econ.stanford.edu/faculty/workp/swp97002.pdf.
6 Ashford, N. (2001), ‘Innovation – The Pathway to Threefold Sustainability’,
in The Steilmann Report: The Wealth of People: An Intelligent
Economy for the 21st Century, 233–74, http://dspace.mit.edu/
bitstream/1721.1/1584/1/3-fold_sustainability.pdf.
7 Holdren, J.P. et al. (1997), Federal Energy Research and Development for
the Challenges of the 21st Century, President’s Committee of Advisors
on Science and Technology, Panel of Energy Research and Development,
Washington, DC, Office of Science and Technology Policy, Executive
Office of the President of the United States, November; Sagar, A. and
Holdren, J.P. (2002), ‘Assessing the global energy innovation system:
some key issues’, Energy Policy, 30, 465–69.
8 Jaffe, A., Newell, R. and Stavins, R. (2003), Technology Policy for Energy and
the Environment, NBER Innovation Policy and the Economy Meeting, 15 April.
Installed electrical capacity
(2006)
Net deployment in
2008 (MW)
Annual capacity installed
(MW) under IEA’s
Climate Protection
scenarioa
Net installed capacity
by 2050 (GW)
at 2008 rate of
deployment
Coal-fired with CCS 0 MW 0 17,500 700
Gas-fired with CCS 0 MW 0 10,000 800
Nuclear 372 GW(e) (2008) -408b 32,000 1,280
Hydro 919 GW 16,000 (2005) 13,424 1,481
Biomass and Waste Plants 45 GW N/A 5,000 225
Wind – onshore 119 GW (2008) 26,790 56,000 2,520
Wind – offshore 1,461 MW (2008) 240 15,000 6,75
Solar PV 5 GW 2,800 10,000 2,584 TWh
CSP 430 MW (2008) 69,500 2,780
Table 1.1: Rate of deployment by 2050
IPR and Climate Change: Friends or Foes?
a Based on the scenario put forward in the International Energy Agency’s Energy Technology Perspectives report of 2008.
b No new reactors were connected to the grid in 2008 and one 440 MW reactor was closed in Slovakia.

www.chathamhouse.org.uk
11
9 Dasguptha, Partha and David, P.A. (1994), ‘Toward a New Economics
of Science’, Research Policy, 23, 487–521; Arrow, Kenneth J. (1962),
‘Economic Welfare and the Allocation of Resources for Invention in the
Rate and Direction of Inventive Activity’, in Nelson, R., ed.,The Rate and
Direction of Inventive Activity; Griliches, Z. (1980), R&D and the Productivity
Slowdown, American Economic Association, 70 (2), 343-48.
10 See, for example, Reichman, Jerome H., with Hasenzahl, Catherine,
(2003), Non-voluntary Licensing of Patented Inventions: Historical
Perspective, Legal Framework under TRIPS, and an Overview of the
Practice in Canada and the USA, Issue Paper No. 5, UNCTAD/ICTSD.
11 Paice LLC v. Toyota Motor Corporation, 2006 WL 2385139, (E.D.Tex. Aug
16, 2006) (NO. 2:04CV211DF).
12 See Packard Love, James (2007) ‘Recent examples of the use of compul-
sory licenses on patents’, Knowledge Ecology International Research Note
2. Other TRIPS provisions that are important are Articles 1, 6, 7, 8, 31 bis,
40 and 44, as well as the provisions of the 2001 Doha Declaration on
TRIPS and Public Health.
13 Razgaitis, R. ( 2003), Valuation and Pricing of Technology-based Intellectual
Property, John Wiley & Sons.
14 Increasing levels of patenting in the software space (particularly in the
United States) mean that non-US startups seeking entry in areas such
as search or mobile phone applications increasingly need to acquire US
patent protection to enable a US market entry strategy, and to increase
their attractiveness to potential corporate buyers.
15 Wessing and Go4Venture (2009), Back to Basics: Creating Value Through
IP During a Recession, Workshop, 25 June.
16 ‘In the Tetra Pak 1 case, the Commission found that Tetra Pak had
abused its dominant position by acquiring an exclusive license when it
took over a smaller competitor. The license was formally covered by the
patent licensing block exemption then in effect, Regulation 2349/84, but
a block exemption regulation, unlike an individual exemption, does not
imply a positive evaluation of the individual case.’ in Ritter, L. and Braun,
D. (2005), European Competition Law: A Practitioner’s Guide, Kluwer Law
International, Alphen aan den Rijn, Netherlands.
17 Fortnightly (2006), Wind Turbines Take Off, June, http://www.fortnightly.
com/pubs/06012006_MAINSTREAM.pdf.
18 Morgan Stanley Research (2006), EADS – The A380 Debate, 5 September.
19 Law.com (2006), Meet the Original Patent Troll, 20 July, http://www.law.
com/jsp/article.jsp?id=1153299926232.
20 WBCSD (2009), Towards a Low Carbon Economy: A Business
Contribution to the International Energy & Climate Debate.
21 HM Treasury (2006), Stern Review: Economics of Climate Change.
22 Barton, J. (2001), ‘Antitrust treatment of oligopolies with mutually blocking
patent portfolios’., Antitrust Law Journal 69: 851–82.
23 See, for example, Johnson, Daniel K.N. and Lybecker, Kristina M.
(2009), ‘Innovating for an Uncertain Market: A Literature Review of the
Constraints on Environmental Innovation’. Colorado College Working
Paper 2009-06.
24 See, for example, Center for American Progress and Global Climate
Network (2009), Breaking Through on Technology: Overcoming the
Barriers to the Development and Wide Deployment of Low-carbon
Technology, July 2009: http://www.americanprogress.org/
issues/2009/07/pdf/gcn_report.pdf
25 Barton, John H. (2007), ‘IP and Climate Technology’, Background Paper,
Chatham House, http//www.chathamhouse.org.uk/research/eedp/
papers/view/-/id/724/.
26 Arthur, W. (1989), ‘Competing technologies, increasing returns and lock-in
by historical events’, The Economic Journal 99; Dosi, Giovanni (1982),
‘Technological Paradigms and Technological Trajectories: A Suggested
Interpretation of the Determinants and Directions of Technical Change’,
Research Policy 11.
27 Kirsh, D. (1997), ‘The Electric Car and the Burden of History: Studies
in Automotive Systems Rivalry in America, 1890-1996’, Business and
Economic History, 26 (2).
28 There are examples of badly managed and better managed technology
standards agreements or institutes. Within the mobile telephony industry,
participants generally consider the ETSI (European Telecommunications
Standards Institute) as a relative success story, as it has been able to
assist the diffusion of the GSM and other standards globally, while also
opening up the market for developing economy players. See www.etsi.org.
29 Delay, T. (2007), The Low Carbon Economy, The Carbon Trust, www.
carbontrust.co.uk/climatechange/policy/lce.htm.
IPR and Climate Change: Friends or Foes?

www.chathamhouse.org.uk
12
2. Innovation in Energy Technologies: The State of Play
This chapter discusses the patenting trends for the six energy technologies analysed in this report. It provides a global picture in terms of leading geographical regions and organiza-tions in terms of patent ownership and concentration.
2.1 Patenting trends since the 1970s
The patenting rate of the six energy technologies has been surprisingly sluggish in the past 30 years. Many of the
innovations that began in the 1970s and 1980s are only now coming onto the market. But following the introduction of stronger policies in key markets, private and public invest-ments in R&D have accelerated. Patenting rates duly surged in the mid-1990s, with a rapid increase in deployment coming a few years later.
Figure 2.1 outlines the year-by-year patenting rate across the six energy technologies selected for this study. From the mid-1990s, steep increases are recorded for wind and solar photovoltaic (PV), with carbon capture and concentrated solar power (CSP) rising around the turn of the century. For cleaner coal, there have been around 200 to 300 patents per year for the past three decades.
Growth in patenting activities is not merely a result of R&D investments; it is also a response to shifts in market conditions, for example when the perceived commercial value of inventions grows and where emerging technologies create opportunities for new entrants to access profitable energy markets. Both of these factors are likely contributors to the dramatic rise in patenting levels for both solar PV and wind. The 10 years after 1996 saw a nine-fold increase in wind patents and a five-fold increase for solar PV. The timing of their take-off may also reflect the impact of policy incentives such as feed-in tariffs in key wind markets such as the United States (1992), Germany (1991) and Denmark
Figure 2.1: Patenting trends for six sectors (1976–2007)
Biomass Cleaner coal Carbon capture CSP PV Wind
Res
pons
e co
unt
1976
1978
1980
1982
1984
1986
1988
1990
1992
1994
1996
1998
2000
2002
2004
2006
1,600
1,400
1,200
1,000
800
600
400
200
0
Innovation in Energy Technologies: The State of Play

www.chathamhouse.org.uk
13
(1993). It is also consistent with the EU renewable energy target introduced in 1997 (12 per cent of energy consump-tion by 2010, equivalent to a doubling of the contribution over the period). In the United States, the first state-level renewable portfolio standards were introduced in Nevada in 1997, Ohio in 1998 and Texas in 1999.
2.1.1 Patenting and deployment rate
For wind power, as Figure 2.2 demonstrates, the rate of deployment closely correlates with patenting growth – particularly if we consider that several years can be expected before a patent finds its way into the technology. Figure 2.3 shows a similar correlation between rate of patenting and production of solar cells.
Deployment of concentrated solar power (CSP) instal-lations is far lower than that of wind and solar PV and project data are incomplete, as shown in Figure 2.4. However, using recently compiled figures we can see that a steep increase in the rate of patenting again predates the take-off of deployment by a few years.1 In this case, projects under construction and in planning have been included, where the target completion date is available. It is unlikely that all of these will come to fruition, but a large amount of CSP will come online in the next few years.
Figure 2.5 shows the relationship between patenting and deployment at the national level. In wind, innovation has often gone hand-in-hand with local deployment – roughly one patent for every gigawatt (GW) of power installed. In solar PV, although the three major patent-holding countries are also the top three in terms of deployment, the relationship is much less clear overall. This reflects the more complex history of PV innovation and the ease of transporting and exporting the technology (to where incentives for installation are strongest).
Some countries have been more successful than others in building local innovation capacity on the back of deployment. For example, Spain is the third highest in terms of deployment, but is significantly below the trend in terms of patents hosted (see dotted line). The United States punches above its weight in both wind and PV.
2.1.2 Comparison with other sectors
While the growth in wind and PV patents looks impressive when compared with the other four energy technologies,
Ann
ual P
v S
hipm
ents
(Mw
p/yr
)
Ann
ual g
loba
l pro
duct
ion
of s
olar
PV
cel
ls (M
W)
Patent Filings
Patent filings
0
200
400
600
800
1000
1200
1400
1600
0
500
1000
1500
2000
2500
3000
3500
4000
4500
1976
1978
19801982
19841986
19881990
19921994
19961998
20002002
20042006
19811983
19851987
19891991
19931995
19971999
20012003
20052007
Annual PV shipments
Annual patents registered
Global PV production
Annual patents
0
200
400
600
800
1000
1200
1400
1600
0
500
1,000
1,500
2,000
2,500
3,000
3,500
4,000
0
200
400
600
800
1000
1200
1400
1600
0
500
1,000
1,500
2,000
2,500
3,000
3,500
4,000
1980
1981
1982
1983
1984
1985
1986
1987
1988
1989
1990
1991
1992
1993
1994
1995
1996
1997
1998
1999
2000
2001
2002
2003
2004
2005
2006
2007
pate
nt
lings
annu
al g
loba
l pro
duct
ion
of s
olar
PV
cel
ls (
MW
)
global PV production
annual patents
Figure 2.2: Wind – patenting level and deployment
Figure 2.3: Solar PV - patenting level and deployment
Add
ition
al c
apac
ity in
stal
led
/pla
nned
(MW
e)
Patent filings
0
100
200
300
400
500
600
0
500
1000
1500
2000
2500
3000
1981
1983
19851987
19891991
19931995
19971999
20012003
20052007
20092011
Additional CSP capacity
Annual patents
Ann
ual c
apac
ity a
dded
(MW
)
Patent filings
0
200
400
600
800
1000
1200
1400
1600
0
5000
10000
15000
20000
25000
1996
1997
1998
1999
2000
2001
2002
2003
2004
2005
2006
2007
Additional wind capacity
Annual patents
Source: Data on installed capacity are from Global Wind Energy Council.
Source: Data on global production of PV cells are from Vital Signs,
Worldwatch Institute, May 2008
Source: Greenpeace, Concentrating Solar Power Global Outlook 2009
Figure 2.4: CSP – patenting level and deployment
Innovation in Energy Technologies: The State of Play

www.chathamhouse.org.uk
Who Owns Our Low Carbon Future?
14
it is important to put this in context by comparing these numbers with those in other growth industries.
As shown in Figure 2.6, patenting in one component of mobile telecoms accelerated dramatically in the late 1990s. A diverse range of companies entered the market, espe-cially small and medium-sized enterprises (SMEs) and from emerging markets. These trends are underpinned by an industry-wide cross-licensing agreement around mobile-telecoms standards.2 In contrast, one typical medical diagnostic device is characterized by a highly proprietary IP regime, dominated by several big players. In total, there have been only around 2,000 patents for the device (Table 2.1).
Table 2.1: Total number of patents
Technology
areas
Total number
of patents
identified
Technology
areas
Total
number
of patents
identified
Solar PV 15,989 Biomass 5,305
Cleaner coal 7,059 Carbon capture 9,160
Wind 12,264 Mobile telephony 11,363
Concentrated
solar power7,193
Medical
diagnostic device1,984
2.2 Geographical and organizational distribution of patent ownershipThe location of the patent assignee provides a broad indi-cation of where innovative activities are taking place. But patents are not necessarily filed where the inventor is based and not only filed in the home country of the assignee. They
are also registered in potential markets, where the patent owner intends to sell, license or manufacture products containing the patented innovation.
2.2.1 Where are the innovation hubs?
Across the six sectors, the top 10 reported locations of patents assignees or owners are primarily OECD economies. As shown in Figure 2.7, the United States leads and is followed by Germany, Japan, Denmark and South Korea. The exception is China, which is fourth across the six technologies by this measure and has a significant share in all except carbon capture. The location of patent assignees indicates the extent of local technological and innovation capacities.
The ultimate ownership of these capacities may have a quite different geographical distribution, however, because some patents are registered by the local subsidiaries of parent companies in another country. For example, a number of patents with US assignees may refer to the US subsidiary of European or Japanese global enterprises.
Pat
ents
Installed wind capacity 2008 (GW)
0 0 5 1510 20 25 30
500
1500
1000
2000
2500
3000USA
China
DenmarkJapanUK
Germany
R2=0.7345
Spain
Pat
ents
Installed solar PV capacity (GW)
0 0 1 2 3 4 5
1000
2000
3000
4000
5000
USA
Japan
Germany
SpainSouth Korea
Pat
ents
Installed capacity 2008 (GW)
0 0 5 1510 20 25 30
500
1500
1000
2000
2500
3000
USA
China
DenmarkJapanUK
Germany
R2=0.7345
Spain
Pat
ents
Installed capacity (GW)
0 0 1 2 3 4 5
1000
2000
3000
4000
5000
USA
Japan
Germany
SpainSouth Korea
Pat
ent fi
lings
6000 -
5000 -
4000 -
3000 -
2000 -
1000 -
0 -
19
76
-
19
80
-
19
84
-
19
88
-
19
92
-
19
96
-
20
00
-
20
04
-
Six energy technologies
Solar PV
Wind
Mobile telecoms-related
Figure 2.5: Wind and solar PV – location of assignees, patenting level, installed capacity
Figure 2.6: Comparing patenting rates in
energy with other sectors
Innovation in Energy Technologies: The State of Play
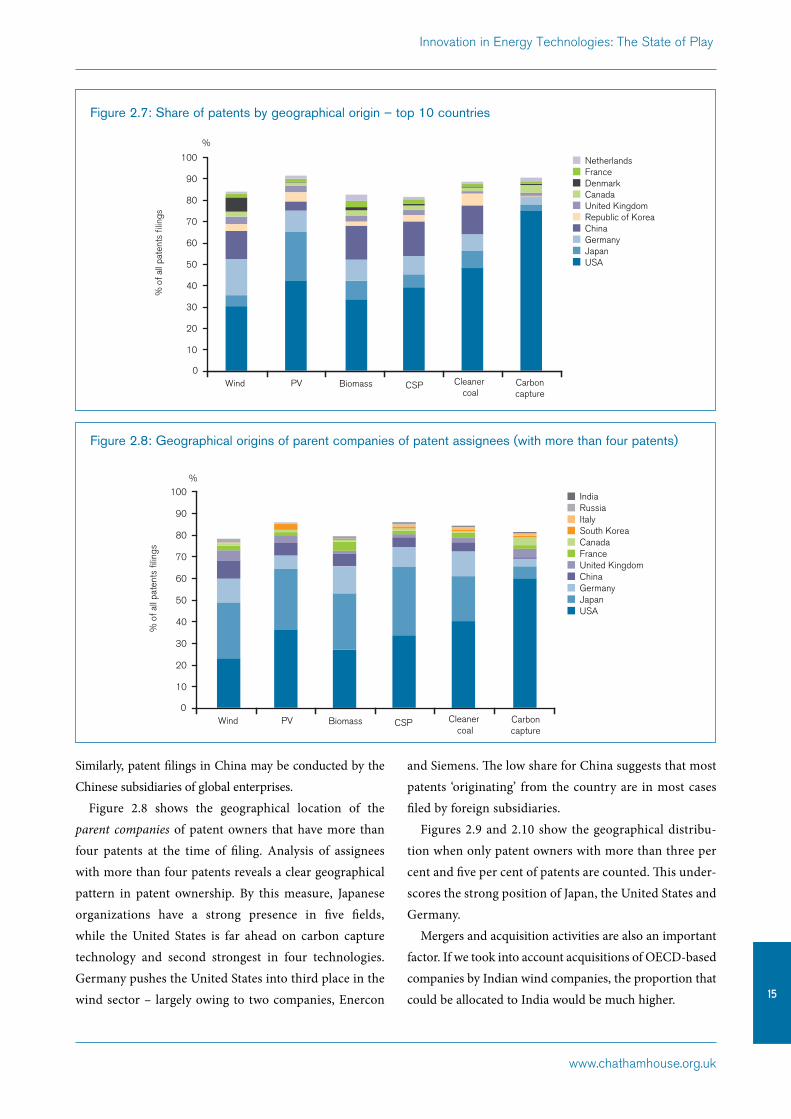
www.chathamhouse.org.uk
15
Similarly, patent filings in China may be conducted by the Chinese subsidiaries of global enterprises.
Figure 2.8 shows the geographical location of the parent companies of patent owners that have more than four patents at the time of filing. Analysis of assignees with more than four patents reveals a clear geographical pattern in patent ownership. By this measure, Japanese organizations have a strong presence in five fields, while the United States is far ahead on carbon capture technology and second strongest in four technologies. Germany pushes the United States into third place in the wind sector – largely owing to two companies, Enercon
and Siemens. The low share for China suggests that most patents ‘originating’ from the country are in most cases filed by foreign subsidiaries.
Figures 2.9 and 2.10 show the geographical distribu-tion when only patent owners with more than three per cent and five per cent of patents are counted. This under-scores the strong position of Japan, the United States and Germany.
Mergers and acquisition activities are also an important factor. If we took into account acquisitions of OECD-based companies by Indian wind companies, the proportion that could be allocated to India would be much higher.
Biomass Cleaner coal
Carboncapture
CSPPVWind
NetherlandsFranceDenmarkCanadaUnited KingdomRepublic of KoreaChinaGermanyJapanUSA
% o
f all
pate
nts
filin
gs
0
20
30
10
40
50
60
70
90
80
100
%
Figure 2.7: Share of patents by geographical origin – top 10 countries
Wind Biomass Cleaner coal
Carboncapture
CSPPV
IndiaRussiaItalySouth KoreaCanadaFranceUnited KingdomChinaGermanyJapanUSA
% o
f all
pate
nts
filin
gs
0
20
30
10
40
50
60
70
90
80
100
%
Figure 2.8: Geographical origins of parent companies of patent assignees (with more than four patents)
Innovation in Energy Technologies: The State of Play
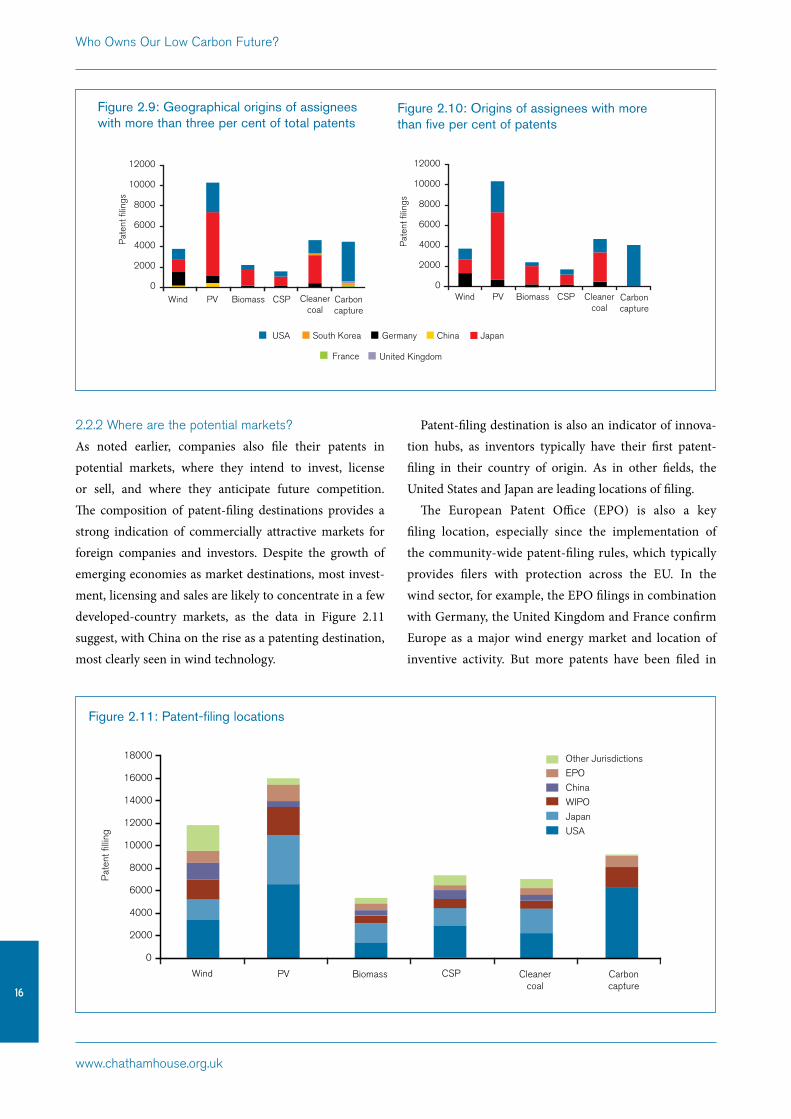
www.chathamhouse.org.uk
Who Owns Our Low Carbon Future?
16
Biomass Cleanercoal
Carboncapture
CSPPVWind
Other Jurisdictions
EPO
China
WIPO
Japan
USA
Pat
ent fi
lling
0
2000
4000
6000
8000
10000
12000
16000
14000
18000
USA South Korea JapanGermany China
Pat
ent fi
lings
0
2000
4000
6000
10000
8000
12000
Pat
ent fi
lings
0
2000
4000
6000
10000
8000
12000
Biomass Cleanercoal
Carboncapture
CSPPVWindBiomass Cleanercoal
Carboncapture
CSPPVWind
France United Kingdom
2.2.2 Where are the potential markets?
As noted earlier, companies also file their patents in potential markets, where they intend to invest, license or sell, and where they anticipate future competition. The composition of patent-filing destinations provides a strong indication of commercially attractive markets for foreign companies and investors. Despite the growth of emerging economies as market destinations, most invest-ment, licensing and sales are likely to concentrate in a few developed-country markets, as the data in Figure 2.11 suggest, with China on the rise as a patenting destination, most clearly seen in wind technology.
Patent-filing destination is also an indicator of innova-tion hubs, as inventors typically have their first patent-filing in their country of origin. As in other fields, the United States and Japan are leading locations of filing.
The European Patent Office (EPO) is also a key filing location, especially since the implementation of the community-wide patent-filing rules, which typically provides filers with protection across the EU. In the wind sector, for example, the EPO filings in combination with Germany, the United Kingdom and France confirm Europe as a major wind energy market and location of inventive activity. But more patents have been filed in
Figure 2.9: Geographical origins of assignees with more than three per cent of total patents
Figure 2.10: Origins of assignees with more than five per cent of patents
Figure 2.11: Patent-filing locations
Innovation in Energy Technologies: The State of Play

www.chathamhouse.org.uk
17
China than at the EPO – an indication of the rapidly growing importance of China as a market and a manu-facturing location for both Chinese and multinational corporations (MNCs).
Several macro factors can account for the increasing levels of activity seen in China – both in terms of patent filings and assignees. First, China has been used as an outsourced manufacturing location by multinationals. Second, there has been a rapid growth in the deploy-ment of renewables in recent years, responding to China’s current target of 15 per cent renewable energy by 2020 and the range of supporting measures that have been put in place. China’s ambitions for wind deployment have been raised dramatically, from 20GW by 2020 to 120GW.3 The combination of a growing domestic market (on the back of increasing govern-ment support), large export markets and the increasing global ambitions of Chinese companies is resulting in greater domestic capability for innovation. This, in turn, translates into more patent filings in China and internationally.
The rise in patent-filings in China can also be attributed to a backlog of patentable innovations and products of Chinese or OECD-based companies waiting to enter the Chinese market. As the Chinese patent system strengthens and IP practices mature, companies’ willingness to use its national patent system will further increase. Some observers have expressed concern about the quality of patents currently being granted in China, specifically around the distinction between design and utility patents. Something to watch for over the next few years is whether the boom in China patents will be translated into PCT patents (patents filed under the Patent Cooperation Treaty) and national-stage filings in the United States, EU and Japan.
2.2.3 Organization mix
Patents can be held by a wide range of organizational types. Figures 2.12 and 2.13 (which consider only assignees with more than four patents) show that multinationals own the majority of patents across the six sectors covered here. These are major international companies featuring in the Forbes Global 2000 list. The second largest share is owned
by ‘national corporations’; these are defined as national firms with more than 250 employees but are typically much larger. In wind, national corporations have a larger share than multinationals. SMEs (companies with fewer than 250 employees) own about 5–10 per cent of the patents in each technology.
The share of patents owned by public institutions is similar to that owned by universities in each technology space, though they have a larger share in concentrated solar technologies. These institutions are almost all non-university, publicly funded research organizations such as national laboratories. The few cases where countries or regions own the patents have also been included.
Average of all Fields
Biomass Cleanercoal
Carboncapture
CSPPVWind
Multinational
Pat
ent fi
ling
0
20
10
40
30
60
50
90
70
80
100
UnknownSMENational Corporation
%
OtherPublicUniversity
Biomass CleanerCoal
CarbonCapture
CSP PV Wind
Other Jurisdictions
EPO
China
WIPO
Japan
USA
Pat
ent fi
lling
0
2000
4000
6000
8000
10000
12000
16000
14000
18000
60
50
40
30
20
10
0
Sha
re o
f pat
ent fi
lings
Mul
tinat
iona
l
Nat
iona
l Cor
pora
tion
SM
E
Pub
lic
Uni
vers
ity
Oth
er
Unk
now
n
%
Figure 2.13: Type of patent holder by technology
Figure 2.12: Share of patents by organization type
Innovation in Energy Technologies: The State of Play

www.chathamhouse.org.uk
Who Owns Our Low Carbon Future?
18
2.3 Patent ownership concentration, patent families and patent volumes
2.3.1 Corporate age and the role of incumbents
Regardless of their institutional background, older institutions and incumbents continue to have a strong influence over innovation in energy sectors, having accu-mulated patents over time (see Figure 2.14). The median age of assignees in biomass, cleaner coal and carbon capture is between 80 and 90 years, and between 50 and 60 years for wind, solar PV and CSP. A typical SME in the wind, biomass and solar PV fields would have been established in about 1995 – but while these are much younger organizations, they own a relatively small share of patents.
It is important to note the natural bias towards higher age in MNCs and national corporations, many of which can trace their origins back decades and sometimes even a century. When a corporation acquires a smaller company, the brand adopted is typically that of the purchasing company, so only the age of the acquiring corporations is shown here.
2.3.2 Concentration of patent ownership
In principle, the concentration of patent ownership in a sector could affect the overall level of innovation – either positively because the large players have strong innovative capacities, or negatively owing to a combination of weak
incentives and potential use of blocking strategies (where patents are used to block entry into a market space).
In four out of the six technology areas, the top 20 assignees own between 25 and 35 per cent of the total patents (see Figures 2.15 and 2.16). These include the two most patented technologies (wind and solar PV) but also the least patented – biomass-to-electricity. Moreover the technology with the highest concentration, cleaner coal, has a similar number of patents to the technology with the least concentration, CSP. There is no simple correlation between concentration of patent ownership and the overall number of patents (taken as a proxy for the level of inno-
IPR
ow
ners
hip
conc
entr
atio
n: to
p 2
0 c
ompa
nies
Field Size: Total Number of Patents
0
5
15
10
25
20
45
40
35
30
6,0004,000 10,0008,000 14,00012,000 18,00016,000
Average of all fieldsWindPV
BiomassCSP
Cleaner coalCarbon capture
%
Figure 2.14: Age of patent owners by organization type
Figure 2.15: IPR concentration – top 20 companies
Innovation in Energy Technologies: The State of Play
0
20
40
60
80
100
120
140
6 Tech
nolog
ies
Wind
PV
Biomas
s CSP
Cleane
r coa
l
Carbon
captu
re
Med
ian
age
(yea
rs)
All patent holders Multinational National Corporation SME Public University Other

www.chathamhouse.org.uk
19
vation activities). The absence of a clear pattern suggests that concentration of patent ownership does not imply monopolistic behaviour or a lack of competition.
In cleaner coal, the top 10 assignees hold over 30 per cent of all patents, with a few companies having consider-able influence. This reflects a high degree of consolidation and market concentration in fossil-fuel and power markets compared to renewable technology sectors. It could also be related to the high cost of R&D as well as high levels of vertical integration of the operations. The more established companies feature strongly here – the average corporate age of assignees in cleaner coal is over 80 years – perhaps reflecting the longer history of coal energy development.
Analysis of patent families – explained in the next section – may reveal an even higher concentration of patent ownership. This has implications for the design of new tools to promote technological cooperation, which may be need to be markedly different when a small number of actors in any given sphere achieve a particular importance.
2.3.3 Understanding patent families: concentration of
commercial value
A patent family comprises all the patents and patent appli-cations resulting from one initial patent application. As discussed earlier, a patent application for an invention is originally filed in one country, typically the home country of the assignee or inventor. Where the invention proves commercially valuable, the original patent application will form the basis for patent-filing applications in other
countries. Each of these new patent applications can become the basis for the filing of subsequent patent appli-cations. Thus a single patent occasionally results in many patents throughout the world.
There is a relatively high concentration of patent ownership across the six energy sectors, especially cleaner coal (Figure 2.17). In each technology space there are between 250 and 600 patent families with more than 10 patents. Between 60 and 85 per cent of all patents from the six sectors belong to patent families.
The number of patent families in each sub-sector can indicate where commercial value is concentrated within a sector. The larger the patent family, the more likely it is that the underlying technology or invention is valuable or has been commercialized. It is much more expensive to maintain a large patent family than a single one, as patent owners must pay a fee periodi-cally to extend the term of protection of each patent in each jurisdiction. Patent owners would only maintain large patent families if the value outweighed the cost. The value of maintaining a patent family may come from licensing revenue, the ability to protect market leadership (as in the case of blockbuster drugs), or as a means to determine a preferred technological pathway in a field. Patent owners may also use their portfolio to protect their commercial position in key export markets, to prevent ‘copycat’ products from entering the market. Where inward trade or parallel imports may be a concern, they will seek to minimize the likelihood of reverse engineering in certain markets.
0
20
30
10
40
50
60
WindAverage of all fields
PV CSPBiomass Cleanercoal
Carboncapture
Top 20 AssigneesTop 50 Assignees
%
0
10,000
12,000
8,000
6,000
4,000
2,000
14,000
16,000
18,000
Cleanercoal
Biomass Carboncapture
CSPPVWind
Total number of patentsTotal patent familiesPatent families w. > 5 membersPatent families w. > 10 members
Figure 2.16: Patent-ownership concentration: Top 20 and top 50 assignees
Figure 2.17: Patent families across six technology areas
Innovation in Energy Technologies: The State of Play

www.chathamhouse.org.uk
Who Owns Our Low Carbon Future?
20
In practice, only companies with substantial resources (and successful products) are likely to invest in increasingly complex patenting strategies. Hence patent ownership concentration rates are likely to be even higher than is suggested by total patent data.
In rapidly growing fields key technologies may not have been patented or may be awaiting approval, or patent families may still be maturing. It may take up to three to five years for one patent family generation to be rolled out across the world. For example, while over 9,000 patents are associated with carbon capture technology as a whole, there are only around 1,000 patent families with
more than five members. This may be an indication of its relatively early stage of development for power-sector use, and reflect the perception that market conditions for deploying carbon capture technologies at scale are yet to be put in place.
Notes1 Project and project planning data sourced from Greenpeace (2009),
Concentrating Solar Power Global Outlook 2009. Where a range of dates
is provided, the later date has been included.
2 Bekkers, R. et al. (2002), ‘Intellectual property rights and standardization:
the case of GSM’, Telecommunications Policy, 26 (3-4), 171–88.
3 www.chinadaily.com.cn/bizchina/2009-07/06/content_8380826.htm and
www.chinadaily.com.cn/bizchina/2009-06/30/content_8335789.htm.

www.chathamhouse.org.uk
21
3. Patent Landscapes of Individual Energy Sectors
Most energy technologies are part of complex technology systems. Individual companies may specialize in manufac-turing one or several components, or in their assembly and operation, while companies from other industries may try to adapt existing technologies to novel applications.
Disaggregating the patent mapping of energy tech-nologies into the constituent components of individual
value chains allows policy-makers and stakeholders to identify core areas of innovation. It also brings to light the leading players in key parts of the value chain that may go unnoticed in a macro-level analysis.
The level of granularity in the picture that emerges also enables easier identification of the different origins of system components. For example, recent patenting in the area of wind turbine blades has focused on the use of improved materials and sensors that can allow longer product life-cycles and decreased system costs, while enzyme-based carbon separation methods can be traced to advances in the biotech industry. Box 1 below describes some of the innovation hotspots identified in this analysis.
This chapter describes the patent landscape for six energy technologies, including their sub-sectors, that were selected because of their current and future importance to energy supply around the world. The first three are examples of renewable technologies at different stages on the innovation pathway: wind, solar PV and concen-trated solar power. A fourth, biomass-to-electricity, is also sustainable if the fuel source is managed carefully. Each of these technologies has the potential to make a deep and permanent contribution to the decarbonization of our energy systems.
Wind
• Composite materials: cheaper and lighter, also allowing larger wingspan (especially for offshore)• Sensors related to extreme environments (e.g. icing, stalling)• Advanced blade coatings for offshore applications• Pitch-rotation/optimization of lift
Cleaner coal• Advanced alloys to allow lower costs of supercritical boilers• Innovations related to adaptation of technologies to CCS (see CCS section)• Increasing operating temperature of PCC and PCFBC boilers
Carbon capture• Novel carbon separation processes, such as enzymes• Incremental innovation around existing technologies, such as absorbents, adsorbents, membranes• New power plant design: ‘all-in-one’
Biomass• Gasification field: scalability• improved biomass quality and yields
Solar PV
• Nano-related innovations • High temperature tolerance• Solar concentrators • Integration with buildings, fabrics and other materials
CSP
• High Temperature Collectors• Convergence between CSP & Concentrated Photovoltaic: improved economies• Heat transfer liquids (air, hydrogen, molten salt)• Heat storage (molten salt), batteries, plus hydrogen as a by-product
Table 3.1 Innovation hotspots

www.chathamhouse.org.uk
Who Owns Our Low Carbon Future?
22
The fifth technology space, coal, continues to be installed apace, especially in emerging economies. Ultimately, installing more efficient, ‘cleaner’ coal will add to global emissions, not reduce them. But in the short term it can make a contribution by avoiding even greater emissions where the construction of more coal plants – for now – appears inevitable. This will depend on the best technolo-gies being available to emerging economies. The distribu-tion of patents in this mature technology space gives us particular insight into the level of capacity and collabora-tion in an advanced energy technology.
The last technology is carbon capture. This is not a renewable technology, but has the potential to make a dramatic impact by capturing emissions from coal and gas plants that would otherwise be vented to the atmosphere. Carbon capture (and storage, which is not covered by this study) is a complicated system of technologies requiring high levels of international cooperation, a dimension which patent rates can shed light on.
For each of the six technologies an initial list of up to 10 technology sub-spaces was compiled. For each subsystem sets of technology descriptors were developed and fed through CambridgeIP’s patent ranking tool to generate patent datasets representative of a given technology sub-system. The list of systems and components described in this chapter is not exhaustive, but it demonstrates differ-ences and commonalities between the most important systems components. It is also a scalable method that can be extended to a more complete definition of the tech-nology systems. The datasets were then manually cross-checked to identify duplications and false positives.
3.1 Wind
In the last 20 years, the wind energy sector has evolved from a source of energy only used in niche applications into a mainstream and multi-billion-dollar market. The sector saw the emergence of new players that specialize in wind technology, such as Vestas, a Danish company, and German wind turbine manufacturer Enercon. As seen in Table 3.2, leading companies also include global equipment manufacturers General Electric (GE), Siemens
and Mitsubishi. Component suppliers such as Hansen International (gear-transmission systems) and ABB (elec-trical-distribution equipment) also feature.
Assignee No. of patents
Total 12,264
1 Enercon 612
2 General Electric Co 525
3 Vestas Wind Systems A/S 316
4 Mitsubishi 239
5 LM Glasfiber A/S 171
6 Hitachi Ltd 146
7 Siemens 140
8 United Technologies Corp 122
9 ABB AB 116
10 RePower Systems AG 111
11 Gamesa Innovation & Technology Sl 89
12 Nordex Energy GmbH 86
13 NTN Corp 77
14 Aerodyn Engineering Gmbh 68
15 Hansen Transmissions International 60
16 Neg Micon A/S [Vestas: 2003] 59
17 Matsushita Electric Ind Co Ltd 56
18 Shinko Electric Co Ltd 55
19 Fuji Jukogyo KK 34
20 Ebara Corp 30
20 Toshiba 30
In 2008 global installed wind capacity reached 93,864 MW. The installed capacity is forecast to triple at least in the next decade.1 As wind-energy operations grow worldwide, so has the level of patenting, as described in Chapter 2. Recent patents include innovations in new niche applications. They also attempt to address technical and social issues arising from the wind operators’ learning from running wind farms and their interaction with the energy system and local commu-nities.2 Areas of interest include short-term energy storage, a shift from gearboxes to direct-drive genera-tors and software systems for optimizing wind energy operations. The fast growth of offshore-related wind turbine patents also reflects increased attention given to offshore deployment.
Table 3.2: Wind – top patent holders

www.chathamhouse.org.uk
23
As an industry expands, its knowledge assets become more valuable to market players. Companies become more mindful of protecting their innovations and patents, sometimes adopting more aggressive and complex IP-related business strategies as a result. In the wind sector the numbers of both patent-related litigations and cross-licensing deals have gone up in the past decade as the technology matures. One of the best-known patent disputes in the wind sector concerns Enercon, which lost a patent lawsuit to Zond Energy Systems in the 1990s. Meanwhile, GE acquired wind assets in the early 2000s from Enron (which had acquired Zond in 1997). Enercon could not sell a range of turbines in the US market until a cross-licensing deal was reached with GE in 2004.3
3.1.1 Areas of innovation within wind sub-spaces
Patent landscaping can reveal the changing focus of tech-nological innovation and relative growth of sub-sectors of particular energy systems – as in the example of wind, shown in Figure 3.1.
The early focus of innovation in wind was in blades (harnessing mechanical energy from the air), the generator (efficient conversion of mechanical energy into electricity) and the gearbox, a frequent cause of breakdowns. These three sub-spaces continued to dominate patent trends after the rapid growth in patenting in the late 1990s. In recent years, wind has become a conventional energy source – placing a greater premium on effective integration with the grid, accurately modelling wind patterns and building in more difficult locations with high wind speeds. Investment
in innovation has spread to software and control systems, short-term energy storage and offshore technologies.
Across the whole technology space there has also been a trend towards larger-scale turbines.4 For instance, RePower has 5 MW turbines with a 125m rotor diameter (larger than the wingspan of an Airbus 380) under way off Scotland, and it is expected that future offshore wind farms may have even larger unit sizes.
3.1.2 Key trends: geographical distribution and IP
ownership concentration
Patent ownership and key markets The United States and Japan are the leading locations of patent filing for wind energy (Figure 3.2), together with EU countries including the European Patent Office (EPO). As discussed in Chapter 2, Europe is both a major market and a location of inventive activity for this sector. The rapid rise of patent filings in China reflects its rising significance as a potential market and a manufacturing location for both Chinese and multinational corporations. Market develop-ments in both China and India are also attracting significant investments by key technology owners in the space.
The majority of assignees are based in OECD countries, led by the United States, Germany, Denmark and Japan (Figure 3.3). However, the rate of patenting by China-based assignees is accelerating and China is now third overall. Patents with Russia-based assignees are also growing in number. Reported assignee location may reflect local subsidiaries, rather than the parent company, and thus provide a misleading guide to ultimate patent
19761978
19801982
19841986
19881990
19921994
19961998
20002002
20042006
Gearbox & drive train
0
500
1,000
1,500
2,000
2,500
Software/control systemsGeneratorOffshore related
Blade/wingsEnergy storage
WIPO 14.2%
Japan 14.8%
USA 27.2%
China 12.2%
EPO 8.9%
Germany 4.5%
Canada 3.3%
Australia 2.2%United Kingdom 2.2%
New Zealand 0.7%Other Patent Authorities 4.6%
Republic of Korea 2.1%
Russian Federation 3.0%
Figure 3.1: Wind – patenting rates by subsector since 1976
Figure 3.2: Wind – patent filing locations
Patent Landscapes of Individual Energy Sectors
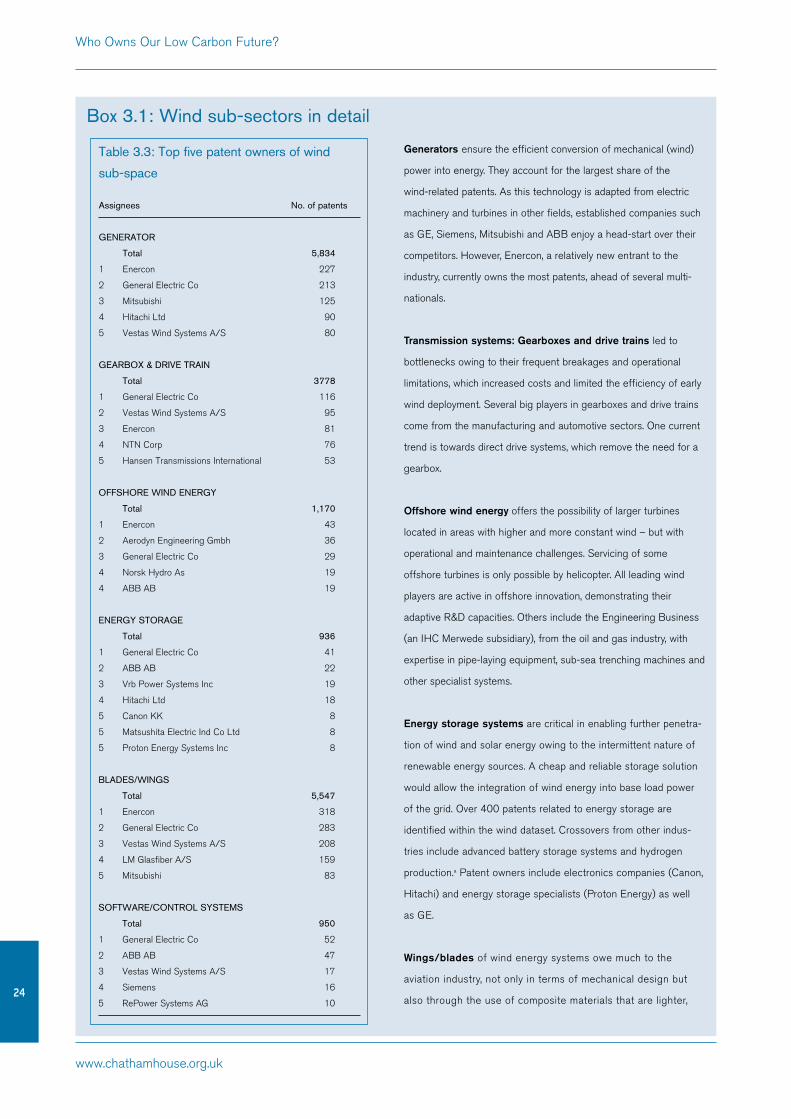
www.chathamhouse.org.uk
Who Owns Our Low Carbon Future?
24
Box 3.1: Wind sub-sectors in detail
Generators ensure the efficient conversion of mechanical (wind)
power into energy. They account for the largest share of the
wind-related patents. As this technology is adapted from electric
machinery and turbines in other fields, established companies such
as GE, Siemens, Mitsubishi and ABB enjoy a head-start over their
competitors. However, Enercon, a relatively new entrant to the
industry, currently owns the most patents, ahead of several multi-
nationals.
Transmission systems: Gearboxes and drive trains led to
bottlenecks owing to their frequent breakages and operational
limitations, which increased costs and limited the efficiency of early
wind deployment. Several big players in gearboxes and drive trains
come from the manufacturing and automotive sectors. One current
trend is towards direct drive systems, which remove the need for a
gearbox.
Offshore wind energy offers the possibility of larger turbines
located in areas with higher and more constant wind – but with
operational and maintenance challenges. Servicing of some
offshore turbines is only possible by helicopter. All leading wind
players are active in offshore innovation, demonstrating their
adaptive R&D capacities. Others include the Engineering Business
(an IHC Merwede subsidiary), from the oil and gas industry, with
expertise in pipe-laying equipment, sub-sea trenching machines and
other specialist systems.
Energy storage systems are critical in enabling further penetra-
tion of wind and solar energy owing to the intermittent nature of
renewable energy sources. A cheap and reliable storage solution
would allow the integration of wind energy into base load power
of the grid. Over 400 patents related to energy storage are
identified within the wind dataset. Crossovers from other indus-
tries include advanced battery storage systems and hydrogen
production.a Patent owners include electronics companies (Canon,
Hitachi) and energy storage specialists (Proton Energy) as well
as GE.
Wings/blades of wind energy systems owe much to the
aviation industry, not only in terms of mechanical design but
also through the use of composite materials that are lighter,
Table 3.3: Top five patent owners of wind
sub-space
Assignees No. of patents
GENERATOR
Total 5,834
1 Enercon 227
2 General Electric Co 213
3 Mitsubishi 125
4 Hitachi Ltd 90
5 Vestas Wind Systems A/S 80
GEARBOx & DRIVE TRAIN
Total 3778
1 General Electric Co 116
2 Vestas Wind Systems A/S 95
3 Enercon 81
4 NTN Corp 76
5 Hansen Transmissions International 53
OFFSHORE WIND ENERGy
Total 1,170
1 Enercon 43
2 Aerodyn Engineering Gmbh 36
3 General Electric Co 29
4 Norsk Hydro As 19
4 ABB AB 19
ENERGy STORAGE
Total 936
1 General Electric Co 41
2 ABB AB 22
3 Vrb Power Systems Inc 19
4 Hitachi Ltd 18
5 Canon KK 8
5 Matsushita Electric Ind Co Ltd 8
5 Proton Energy Systems Inc 8
BlADES/WINGS
Total 5,547
1 Enercon 318
2 General Electric Co 283
3 Vestas Wind Systems A/S 208
4 LM Glasfiber A/S 159
5 Mitsubishi 83
SOFTWARE/CONTROl SySTEMS
Total 950
1 General Electric Co 52
2 ABB AB 47
3 Vestas Wind Systems A/S 17
4 Siemens 16
5 RePower Systems AG 10

www.chathamhouse.org.uk
25
control (see Chapter 2). If acquisitions by Indian companies of OECD-based players in the wind industry are considered (such as Hansen International), the proportion of patents controlled by India would be much higher than that shown by the raw data.
Even though the top tier of the field appears dominated by OECD-based companies, non-OECD-based companies are climbing up the ranks, sometimes through mergers and acqui-sitions (M&A). Suzlon is an Indian wind turbine manufacturer group founded in the 1990s. A key part of its strategy has been to acquire European technology companies. In addition to Hansen International, these purchases include rotor-blade designer AE-Rotor Techniek in 2000, and Suzlon is currently involved in a takeover bid for RePower, another leading European wind turbine manufacturer.5
As Table 3.3 shows, the top 20 players in wind own about 25 per cent of all patents, less than in solar PV or biomass-to-electricity. There are a number of specialized niche players in each of the sub-systems, who are competing with the major players who are present in all sub-spaces.
In this sector, the major patent holders are the leading manufacturers. The top four wind patent owners – who collectively own 13 per cent of all wind patents – have a 48 per cent share of the global wind turbine market.6
With significant level of M&A in this industry, patent concentration levels should increase over time. In the more novel areas of the industry (software, offshore), more M&A activity can be anticipated, with the leading industry players seeking to capture a higher market -share of the technology. However, it is in the nature of crossover industries that exposure to other fields may increase their independence and inventiveness. This may reduce the prospect of a small group of players consolidating control over IPRs in this space.
3.2 Solar photovoltaic (PV)
Since the 1980s, improved efficiency and lower produc-tion costs – including the introduction of feed-in tariffs in key markets – have propelled solar photovoltaic (PV)
cheaper and more durable for wing manufacture. Among the
top 10 companies in this sub-sector is United Technology
Companies, which is more closely associated with aviation than
wind.
Software and control systems only became commercially attractive
after wind-energy use increased. Examples of innovations include intel-
ligent grid-management systems, predictive modelling of wind ‘stock’ for
a farm or at the turbine level and advanced sensor or control systems.
0
1000
1500
500
2000
2500
3000
US
A
Ger
man
y
Den
mar
k
Japa
nU
K
Rep
of K
orea
Spa
in
Can
ada
Sw
eden
Fran
ce
Chi
na
BRICsTop 10 OECD
Rus
sia
Bra
zil
Indi
a
> 5 years agoLast 5 years
Pat
ent a
ssig
nmen
t orig
ins
Figure 3.3: Wind – top patent assignee origins
Table 3.4: Wind – concentration of IPR
Field/sub-fieldTop 20 assignees patents as
% of all patents in field
Average of all 6 technologies 28.5
Wind – overall 25.4
Gearbox & drive train 20.2
Generator 21.3
Blade/wings 28.8
Software/control systems 23.3
Offshore wind energy 22.3
Energy storage 20.9
a There is a much broader field of energy storage systems that was not explicitly researched, but the importance of which is apparent as a link-up of
different renewable sources of energy, for instance, the use of hydro-systems to store surplus power or larger-scale hydrogen and battery systems.
Patent Landscapes of Individual Energy Sectors

www.chathamhouse.org.uk
Who Owns Our Low Carbon Future?
26
technology into the mainstream of power generation, both off-grid and on-grid. Global installed capacity of solar PV grew from 1.3 GW in 2001 to 15.2 GW by 2008.
As the levels of PV deployment capacity have grown, annual patent filings have increased rapidly. As in the wind sector, increased maturity and value of technology has been accompanied by increasing levels of patent portfolio complexity, litigation and cross-licensing. However, in the PV space the crossover between different fields is significantly higher: there is a battle going on between competing approaches to next generation PV (discussed in the section below).
3.2.1. Areas of innovation within PV sub-spaces
Advances in this sector centre on the next generation of PV technologies. Second and third generation technolo-gies are focused on using materials that improve thin film efficiency. Emerging non-silicon technologies have signifi-cant advantages in terms of efficiency, ability to absorb higher levels of radiation, or lower material and manufac-turing costs. However, they have an entry barrier owing to the high fixed investment costs in manufacturing facilities and technological requirements. Silicon-based approaches benefit from the computer industry infrastructure and a decade of experience of PV panel production. Micro-crystalline PV allows higher conductivity, while proto-crystalline PV allows the stacking or tandem operation of cells.
In the 20 years after 1976 PV patent rates were low and focused on four sub-fields, each with its own crossovers with other manufacturing applications, as shown in Figure 3.4. Amorphous silicon is a key ingredient in LCD displays. It can be used over larger areas than traditional crystalline silicon and can be printed onto plastic as well as glass to make large solar cells. CIS and CIGS are copper alloys used in thin-film PV. Thin-film PV requires less light-absorbing material (reducing manufacturing costs) and is also easier to integrate with other materials. Cadmium telluride-based PV is suitable for high-temperature conditions and has been developed from the use of advanced alloys in
Table 3.5: Solar PV – top patent holders
Assignee No. of patents
Total 15,989
1 Sharp 608
2 Canon 561
3 Sanyo 483
4 Asahi Glass Co Ltd 478
5 Matsushita Electric 359
6 Fuji Electric Co Ltd 258
7 Hitachi 223
8 Merck Patent Gmbh 198
9 Kyocera Corporation 190
10 Kanegafuchi Kagaku Kogyo KK 184
11 Samsung Electronics Co Ltd 178
12 DuPont 172
13 General Electric Co 164
14 Shin Etsu Handotai Co Ltd 160
15 Sumitomo 159
16 Sony Corp 157
17 Honda Motor Co Ltd 155
18 Seiko Epson Corp 144
19 Atlantic Richfield Company 129
19 Siemens 129
1976
1978
19801982
19841986
19881990
19921994
19961998
20002002
20042006
Pat
ent fi
lings
0
200
400
600
800
1000
1200
1400
1600Organic/PolyesterDye sensitizedCIS & CIGSCdTeAmorphous siliconNanotech related
Figure 3.4: Solar PV – patenting rates by
subsector since 1976

www.chathamhouse.org.uk
27
solar panels on satellites and lasers. Organic PV is related to developments in light-emitting diodes. These involve mounting plastic onto glass – a less efficient but cheaper approach that could in future be found on the surface of mobile phones, for example.
When PV patent rates took off in the late 1990s each of these four categories expanded. Organic PV and CIS/CIGS combined still make up over half of all patenting activity. At the same time, however, advances in materials science opened new avenues for PV tech-nology development, with nanotech and dye-sensitized approaches (which can be painted on to surfaces) emerging strongly.
3.2.2 Key trends: geographical distribution and IP
ownership concentration
Filing destinationsThe United States and Japan are leading locations for patent filing in solar PV energy, followed by WIPO and the EPO. While the trend broadly reflects current markets and R&D capacity, emerging markets such as China are also seeing increasing patenting rates. PV patent-filings in China are lower than those of wind despite the fact that a significant proportion of world PV production is based in China. This is partly because first generation PV (where much of past Chinese PV production is focused) has not been patented as heavily as the emerging thin-film PV technologies.
WIPO 15.0%
EPO 9.3%
China 3.5%Rep of Korea 0.9%
Germany 0.5%Canada 0.4%
Taiwan 0.4%UK 0.4%
Russian Federation 0.3%France 0.2%
Other Patent Authorities 0.2%
Japan 28.3%
USA 40.4%
Location of assignees While the United States and Japan are leaders, Germany, South Korea, the United Kingdom, France and Switzerland all have a significant presence. Our sub-sectoral research showed that particular country strengths are also reflected. The United Kingdom owes its presence to strength in nanotechnology and advanced alloys, while Switzerland is home to both dye-sensitized method inventors and nanotech PV manufacturers.
Figure 3.6: Solar PV – top patent assignee origins
IPR concentration Today, there are different and competing technology approaches to next generation PV, and none has gained dominance or full market acceptance. While some of these technology approaches may end up dominating the next phase in PV deployment, as yet the key players in these subsectors do not appear in the overall top 20 patent ranking. In addition, different dynamics are going on in each of these subsectors: as demonstrated by significant differences in their patent ownership concentration rates – ranging from 23 to 46 per cent. In clear contrast to wind, only two of the top 10 manufacturers of PV modules7 (Sharp and Kyocera) are among the top 20 patent holders. The probable explanation for this is a high degree of cross-licensing.
The maturation of the PV industry is accompa-nied by an increase in the number of patent-related litigations. For instance, Nanosys is a US producer of nanotech quantum dots, which are used in lighting,
10001500
500
2000
30002500
40003500
45005000
Pat
ent a
ssig
nmen
t orig
ins > 5 years ago
Last 5 years
0 U
SA
Ger
man
y
Den
mar
k
Japa
nU
K
Rep
of K
orea
Spa
in
Can
ada
Sw
eden
Fran
ce
Chi
na
BRICsTop 10 OECD
Rus
sia
Bra
zil
Indi
a
Figure 3.5: Solar PV – patent filing locations
Patent Landscapes of Individual Energy Sectors

www.chathamhouse.org.uk
Who Owns Our Low Carbon Future?
28
Amorphous silicon production offers a step-change in the
use of traditional crystalline silicon-based PV panels. One of
the main advantages is that amorphous silicon is much more
uniform over large areas. It can be deposited on plastic as
well as glass.a Key players include glass manufacturers such
as Asahi Glass, a specialist in high-spec glass material for
the buildings and other areas, who provides high-resistance
glass covers for silicon PV cells.
Nanotechnology is related to about 31 per cent of all
PV patents, including some 50 per cent of all organic PV
patents. Large corporations and universities are active in
this space, as well as younger companies such as Konarka
Technologies and Nanosolar. The latter received nearly
$500m in investment in 2008 from venture capital and
utility companies to finance production plant expansion
aimed at 1GW p.a. production capacityb in what has been
termed a race to expand production to capture increasing
market demand.c
Cadmium Telluride-based PV (Cd Te) owes its advances
to uses of advanced alloys in solar panels on satellites and
lasers. Resistant to high radiation and solar intensity in space
conditions (or under a laser), they are suitable for use with
concentrator technology in CSP applications. Improvements in
crystal-growth methods have also led to their increased use
in security- and medical-related applications (e.g. 3D X-ray
machines). These developments have created a global market
for the underlying base metals, and for crystal growth facilities.
Several oil and gas companies also feature in this space, very
likely through their capabilities around materials processing
Dye-sensitized cells (also known as Grätzel cells, after their
Swiss inventor) use photo-sensitive dyes as a thin film, allowing
the PV cells to be painted onto surfaces. The materials are very
low-cost, and the panels are robust to scratches or hail but
they have relatively low efficiency rates. Potentially they can be
used in automobile and building coatings.
Copper Indium Diselenide (CIS) and Copper Indium
Gallium Selenide (CIGS) are alloys used in polycrystal-
line thin-films, with reported laboratory-level efficiencies of
Table 3.5: Top 5 patent owners in solar PV sub-spaces
Top Assignees No. of patents
AMORPHOuS SIlICON
Total 993
1 Sanyo 57
2 Canon 49
3 Kanegafuchi Kagaku Kogyo Kk 36
4 Atlantic Richfield Company 33
4 Fuji Electric Co Ltd 33
5 Asahi Glass Co Ltd 29
NANOTECH RElATED
Total 1,667
1 University California 42
2 Nanosolar Inc 41
3 Konarka Technologies Inc 40
4 General Electric Co 34
5 Samsung Electronics Co Ltd 30
CcTe-BASED
Total 730
1 Matsushita Electric 27
2 Atlantic Richfield Company 19
3 Energy Conversion Devices Inc 15
4 Nanosolar Inc 14
5 First Solar Inc 13
5 University California 13
DyE SENSITIzED
Total 987
1 Sharp 49
2 Ngk Spark Plug Co Ltd 43
3 Dupont 40
3 Fujikura Ltd 40
5 Samsung Electronics Co Ltd 37
CIS & CIGS
Total 1,810
1 General Electric Co 50
2 Shell Oil Company 42
3 Boeing 37
4 Energy Conversion Devices Inc 29
4 Nanosolar Inc 29
ORGANIC PV/ OlEDS
Total 4,991
1 Merck Patent Gmbh 182
2 General Electric Co 99
3 DuPont 96
4 Canon 78
5 Konarka Technologies Inc 67
Box 3.2: Solar PV subsectors in detail

www.chathamhouse.org.uk
29
solar power and electronic display systems. In July 2009 it settled a patent infringement lawsuit against Nanoco Technologies Ltd of the United Kingdom. The lawsuit claimed that the British firm’s quantum dot technology infringes upon five seminal quantum dot patents held by Nanosys.8
Australia has historically held a strong technology position in solar power – both PV and CSP. Yet many of its solar entrepreneurs moved to California where they had access to capital and a rapidly growing solar market. Another example
is the technology used in Russia’s PV industry, which has its origins in space technology. Alongside the United States, Russia was a pioneer in the use of solar power in military and civilian space applications, as demonstrated by Soviet-era patents in the field. Yet that capability has waned and has remained unexplored.
3.3 Biomass-to-electricity
As with other energy technologies, investments of R&D in biomass-to-electricity systems are sensitive to changing market conditions. Patenting rates peaked after the twin oil shocks of the 1970s and early 1980s but then subsided in the mid-1990s. There has been a steady growth since 1995, but annual registrations still fall short of those in wind or PV. Current patenting rates are similar to those seen in the wind sector in the late 1990s.
As Table 3.7 shows, adaptation of technologies from coal-based electricity generation puts traditional players, such as the major Japanese corporations, at the forefront of biomass-to-electricity patenting activity. The significant presence of research institutions may reflect public-sector investments in coal-related R&D. Outside the top 20, there is an emerging group of companies in biomass use/produc-tion or waste management.
up to 19.9 per cent.d While having lower efficiency levels
than Crystalline Silicon cells, CIGS and CIS-based PV are
expected to be cheaper because the photovoltaic material
can be deposited directly onto glass.
Organic PV/OLEDs is one of the fastest moving sub-
sectors of solar PV energy. Key players include GE, DuPont,
Merck and Japanese electronics companies. Less well
known is Konarka Technologies, which has attracted a lot
of investments from venture capital as well as Total in the
past few years. It develops printable nano-enabled polymer
PV materials, which could theoretically enable for everyday
devices, systems or structures to have embedded sources of
renewable power. Konarka has developed strategic partner-
ships with many companies and institutions, including Air
Products, 24 Innovations, Kurz, SkyShades, Chevron, Merck,
Toppan Forms, Dupont and Siemens as well as the US Air
Force.e
a Amorphous Semiconductors Research Group, Amorphous Silicon, http://www.ayil.hacettepe.edu.tr/pages/Amorphous/Amorphous%20silicon.html.
b Nanosolar Blog (2008), Nanosolar Ups Funding to $0.5B; Partners Strategically for Solar Utility Power, 27 August, http://www.nanosolar.com/
blog3/?p=138.
c Greenbeat (2008), Nanosolar outshines the competition with $300 million financing, 27 August 2008, http://green.venturebeat.com/2008/08/27/
nanosolar-outshines-the-competition-with-a-300m-financing/.
d Repins, I., Contreras, M. A., Egaas, B., DeHart, C., Scharf, J., Perkins, C. L., To, B. and Noufi, R. (2008),19.9%-efficient ZnO/CdS/CuInGaSe2 solar cell
with 81.2% fill factor, Progress in Photovoltaics: Research and Applications, 16, 235.
e See www.konarka.com/index.php/company/our-partners/.
Table 3.6: Solar PV – concentration of IPR
ownership
Top 20 Assignee patents as % of all patents in field
Average all 6 fields 28.5
PV: overall 31.8
Nanotech-related 25.4
Amorphous-silicon 46.1
CdTe-based 31.1
CIS & CIGS 24.6
Dye sensitized 49.9
Organic and polymers 22.8

www.chathamhouse.org.uk
Who Owns Our Low Carbon Future?
30
3.3.1 Areas of innovation within biomass-to-electricity
sub-spaces
The various biomass-to-electricity technologies have emerged via different pathways. Combustion-based appli-cations are relatively mature, with patenting rates steadily growing since the late 1970s. By contrast, approaches based on gasifying biomass prior to combustion are only maturing today, with accelerating patenting rates since 2000, as seen in Figure 3.7.
There are overlaps between biomass and coal tech-nologies, such as in combustion and gasification. However, biomass technologies involve a range of fuels (see Table 3.9) and fuel quality, consistency and emissions control are major issues. Cleaning or purification-related patents
have been important since the beginning, and have grown in line with the overall rise in patenting.
Patents related to biomass co-firing with coal have become prominent only in the last 10 years, reflecting the perceived commercial prospects.
3.3.2 Key trends: geographical distribution and IP
ownership concentration
Filing destinations The leading location for biomass-to-electricity patents is Japan, followed by the United States (Figure 3.7). This reflects the leading role of Japanese companies in this space, but it may also be linked to behavioural differences – Japanese companies, for example, are perceived as prof-ligate patent filers. The low number of patents in Germany should be interpreted in the context of the EPO being an alternative option for patenting within the EU. China comes fourth after Japan, the United States and the EU. There are more patents filed in Russia than South Korea.
Table 3.7: Biomass-to-electricity – top patent
holders
Assignee No. of Patents
Total 5,305
1 Hitachi 334
2 Mitsubishi Heavy Industries 265
3 Kawasaki Heavy Ind Ltd 116
4 Ishikawajima-Harima Heavy Industries 97
5 Nippon Steel Corp 94
6 Ebara Corp 87
6 Sumitomo 87
8 NKK Corp 69
9 Mitsui 62
10 Toshiba Corp 36
11 Fuji Electric Co Ltd 27
11 Nippon Kokan KK 27
13 General Electric Co 25
14 Kubota Ltd 24
14 Ube Industries Ltd 24
16 Chugai Ro Co 22
16 Takuma Co Ltd 22
18Chinese Academy of Sciences (and
Affiliates)21
19 Kobe Steel Ltd 20
19 Union Carbide Corporation 20
19 University of California 20
1976
1978
19801982
19841986
19881990
19921994
19961998
20002002
20042006
2008
Pat
ent fi
lings
0
100
200
300
400
500
600
700 Combustion-based systemsGasification-based systemCo-firingCleaning/purification
WIPO 15.0%
EPO 9.3%
China 3.5%Rep of Korea 0.9%
Germany 0.5%Canada 0.4%
Taiwan 0.4%UK 0.4%
Russian Federation 0.3%France 0.2%
Other Patent Authorities 0.2%
Japan 28.3%
USA 40.4%
Figure 3.7: Biomass-to-electricity: patenting
rates by subsector since 1976
Figure 3.8: Biomass – filing by patent authority

www.chathamhouse.org.uk
31
Location of assigneesAs Figure 3.9 shows, OECD leaders include the United States, Germany and Japan lead, but China appears as the second most important assignee location – it also has the third highest growth rate in this space. India, Russia and Brazil are less active but they are
likely to become important in this sector owing to their endowment of natural resources. Less obvious in these numbers is the relative specialization of European countries in biomass-to-electricity technology related to the type of biomass available locally: e.g. wood in the Nordic countries.
Combustion-based systems are the oldest technology in this field, with
most market-leading technologies incubated in the 1980s. There are
significant overlaps with coal combustion technologies, including adapta-
tion of fluidized bed systems for use in biomass, and co-firing of coal
with biomass mixes. Key areas of innovation include efficiency gains, the
quality of feedstock and utilizing non-steam working fluids. At small scale,
innovation focuses on the organic Rankine Cycle, an approach that is
more efficient at lower working pressures and temperatures.
Gasification-based systems avoid some problems associated with
combustion, but are more recent developments.a While there are
commonalities between coal and biomass combustion technologies,
there are few overlaps between biomass-gasification and integrated
gasification combined cycle (IGCC), except post-gasification technolo-
gies for carbon capture. Research institutes feature strongly in the top
15 patent assignees. The Chinese Academy of Sciences (including
CAS affiliates) has more patents than GE and other industrial leaders.
Co-firing systems, such as mixing low-grade coal powder with
biomass fuel, are used to increase the output from the burn cycle.
Much of the effort has focused on retrofitting coal fluidized bed
combustion systems for use with biomass.
Cleaning/purification: A key consideration for all biomass-to-electricity
systems is the quality of biomass. This is a function of consistency of the
feed, storage requirements, by-products or residues, as well as ensuring
greater compatability between the energy conversion processes and
multiple biomass types. Each combination of fuel source and energy
generation type may have its own cleaning/purification requirements.
Therefore a key area of innovation lies in purification and quality control
as well as the cleaning of equipment. While among the top 10 the
largest patent portfolio holders are Japanese, there is a wider composition of patent owners in the top 20, with companies from Germany,
the Netherlands, Finland and other EU countries.
Table 3.8: Top five patent owners in biomass-
to-electricity sub-spaces
Top assignees No. of patents
COMBUSTION-BASED SYSTEMS
Total 1,715
1 Hitachi 109
2 Mitsubishi Heavy Industries 89
3 Ebara Corp 34
3 Kawasaki Heavy Ind Ltd 34
5 Ishikawajima-Harima Heavy Industries 30
GASIFICATION-BASED SYSTEMS
Total 1,511
1 Mitsubishi Heavy Industries 68
2 Hitachi 45
3 Kawasaki Heavy Ind Ltd 38
4 Ebara Corp 37
5 Nkk Corp 35
CO-FIRING
Total 693
1 Hitachi 46
2 Mitsubishi Heavy Industries 27
3 General Electric Co 14
3 Sumitomo 14
5 Kawasaki Heavy Ind Ltd 11
CLEANING/PURIFICATION RELATED TECHNOLOGIES
Total 1,455
1 Hitachi 55
2 Mitsubishi Heavy Industries 41
2 Sumitomo 41
4 Nippon Steel Corp 40
5 Kawasaki Heavy Ind Ltd 31
Box 3.3: Biomass sub-sectors in detail
a A key barrier is related to the drying of biomass: it usually comes with 50 per cent water content, which needs to be reduced to 15 per cent.
Gasification-based systems operators have found a use for waste heat from the process as a cheap way of drying biomass.
Patent Landscapes of Individual Energy Sectors

www.chathamhouse.org.uk
Who Owns Our Low Carbon Future?
32
IPR ownership concentration The IPR ownership rates in the biomass field are similar to the average for the six fields researched. Within the biomass-to-electricity space, one driver towards greater concentration is the relationship between some of the sub-fields and cleaner coal (which was found to have the highest IPR ownership concentration rate). M&A have played a significant role in consolidating IP ownership in the biomass-to-electricity sector. For instance, in 2002 GE acquired the Austrian gas turbine manufacturer Jenbacher, which has been investing in technologies for co-generation, synthetic gas (Syngas) and waste gas areas. Jenbacher is now GE’s Global Center of Excellence For Gas Engine Products.9
In markets served by smaller-scale turbines, ownership of IP is more dispersed. There is a greater diversity of players among those focused on specific types of biomass or waste. As the use of biomass for electricity generation (and transport fuel) spreads globally, it is likely that a lot of activity will be located in land-rich developing economies.
It remains an open question whether they will be able to leverage such activities to develop indigenous innovation activities and specializations.
3.4 Concentrated solar power
Concentrated solar power (CSP) holds the promise of cheaper, more scalable electricity generation in regions with good levels of sunlight. The opportunity to store heat means that power can be delivered at peak times. In terms of maturity of designs and deployed capacity, however, CSP technology lags behind solar PV, despite its invention over 100 years ago when a series of solar power generators using parabolic troughs were developed in France.
Recent developments have seen major industrial initia-tives around the large-scale deployment of CSP from the EU and the United States.10 CSP is on the cusp of becoming part of the core mix of low carbon energy technologies.
Several aerospace giants, including Boeing, UTC and NASA, are active in this area, developing technologies such as advanced tracking systems, high-temperature-resistant materials, and concentrator technologies as used in satellites.
In this rapidly growing area, the profile of leading patent owners is set to change dramatically in the next few years. The patent portfolios of emerging players (particularly those based in California) are likely to grow significantly on the back of a large number of venture capital (VC) investments between 2006 and 2009, and as CSP farms enter into operation.
At this early stage of technology development the relative patent portfolio size of even the leading players in the field is fairly small. Components suppliers that work with other industries are important since relevant technol-ogies may be in use in other industries, whereas, to date, technology integrators or genuinely innovative companies have relatively small patent portfolios protecting the core of their technological innovation.
As technology deployment increases, the new leaders in a technology space are likely to increases the size of their patent portfolios, as they protect higher parts of their value chain and the number of patentable inventions increases. In the wind sector, for example, the leading players each
Table 3.9: Biomass-to-electricity – concentration
of IPR (%)
Average all 6 fields 28.5
Biomass: overall 28.0
Combustion-based systems 28.0
Gasification-based systems 27.8
Co-firing 29.4
Cleaning/purification 32.6
400
200
600
800
1000
1200
Pat
ent a
ssig
nmen
t orig
ins > 5 years ago
Last 5 years
0
US
A
Ger
man
y
Den
mar
k
Japa
nU
K
Rep
of K
orea
Spa
in
Can
ada
Sw
eden
Fran
ce
Chi
na
BRICsTop 10 OECD
Rus
sia
Bra
zil
Indi
a
Figure 3.9: Biomass – top patent assignee origins

www.chathamhouse.org.uk
33
have hundreds of patents protecting their overall tech-nology systems.
3.4.1. Areas of innovation within CSP sub-spaces
It took until 2000 for patenting in CSP to return to the level of late 1970s, but the number doubled again in the following six years (see Figure 3.10). This acceleration reflects the renewed interest in the technology around the world.
Which of the competing technologies in CSP will emerge most strongly is still unclear, and may vary according to local conditions. Owing to historical investments in the area, trough-based systems are expected to be prevalent until 2012 or 2013, after which these could be displaced
by heliostat/power towers systems, compact linear Fresnel reflectors (CLFR) and dish-engine developers if that tech-nology advances more quickly (see Box 3.4).
Sub-fields such as trackers and sensors (both developed from space applications) apply across these competing CSP technology options, and their even contribution in patenting trends suggest that advances in a range of areas are still ongoing – in other words, there is no single key to CSP technology development.
3.4.2 Key trends: geographical distribution and IP
ownership concentration
Filing destinations Key filing destinations are the United States, Japan and China. However when EPO filings are considered jointly with those in country authorities, the European total is higher than that of China. The large number of US filings is probably due to a combination of component-level patents that precede the take-off in CSP (such as in aerospace), in addition to recent increased interest in the space. However, as most of the deployed CSP capacity is likely to be in developing economies, it is likely that we will see increased patenting into such markets (such as South Africa).
Location of assigneesThe origins of several world leaders in CSP technology, such as California-based Ausra, can be traced to Australian
Table 3.10: CSP – top patent holders
Assignee No. of patents
Total 7,193
1 Matsushita Electric 95
2 Mitsubishi Heavy Industries 94
3 Sanyo 73
4 Toshiba Corp 69
5 Hitachi 62
6Agency of Industrial Science & Technology
56
7 Boeing/Rockwell Intl. 45
8United Technologies Corp/ Pratt & Whitney
41
9 Sharp 35
10 Sumitomo 34
11Deutsches Zentrum für Luft-und Raumfahrt EV
32
11 US Department of Energy 32
13 Canon 30
14Yeda Research and Development (Weizmann Institute)
29
15 NEC Corporation 27
16 General Electric Co 26
17 Siemens 24
18Fraunhofer-Gesellschaft zur Förderung der Angewandten Forschung EV
21
18 3M 21
18 NASA 21
EngineTrackerComputing & SensorsHeat TransferMirror
1976
1978
19801982
19841986
19881990
19921994
19961998
20002002
20042006
Pat
ent fi
lings
0
200
100
300
400
500
600
700
800
900
Figure 3.10: CSP – patenting rates by subsector since 1976
Patent Landscapes of Individual Energy Sectors
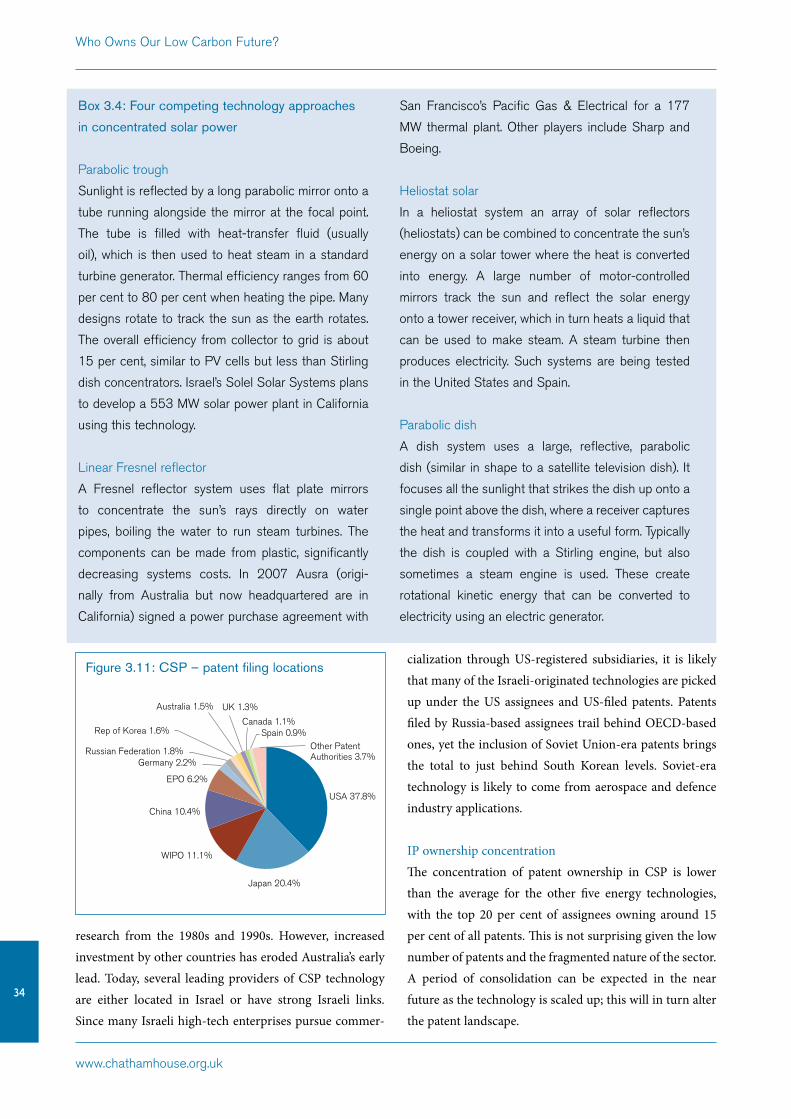
www.chathamhouse.org.uk
Who Owns Our Low Carbon Future?
34
research from the 1980s and 1990s. However, increased investment by other countries has eroded Australia’s early lead. Today, several leading providers of CSP technology are either located in Israel or have strong Israeli links. Since many Israeli high-tech enterprises pursue commer-
cialization through US-registered subsidiaries, it is likely that many of the Israeli-originated technologies are picked up under the US assignees and US-filed patents. Patents filed by Russia-based assignees trail behind OECD-based ones, yet the inclusion of Soviet Union-era patents brings the total to just behind South Korean levels. Soviet-era technology is likely to come from aerospace and defence industry applications.
IP ownership concentration The concentration of patent ownership in CSP is lower than the average for the other five energy technologies, with the top 20 per cent of assignees owning around 15 per cent of all patents. This is not surprising given the low number of patents and the fragmented nature of the sector. A period of consolidation can be expected in the near future as the technology is scaled up; this will in turn alter the patent landscape.
WIPO 11.1%
EPO 6.2%
China 10.4%
Rep of Korea 1.6% Spain 0.9%
Germany 2.2%
UK 1.3%
Canada 1.1%
Australia 1.5%
Russian Federation 1.8% Other Patent Authorities 3.7%
Japan 20.4%
USA 37.8%
Box 3.4: Four competing technology approaches
in concentrated solar power
Parabolic trough
Sunlight is reflected by a long parabolic mirror onto a
tube running alongside the mirror at the focal point.
The tube is filled with heat-transfer fluid (usually
oil), which is then used to heat steam in a standard
turbine generator. Thermal efficiency ranges from 60
per cent to 80 per cent when heating the pipe. Many
designs rotate to track the sun as the earth rotates.
The overall efficiency from collector to grid is about
15 per cent, similar to PV cells but less than Stirling
dish concentrators. Israel’s Solel Solar Systems plans
to develop a 553 MW solar power plant in California
using this technology.
Linear Fresnel reflector
A Fresnel reflector system uses flat plate mirrors
to concentrate the sun’s rays directly on water
pipes, boiling the water to run steam turbines. The
components can be made from plastic, significantly
decreasing systems costs. In 2007 Ausra (origi-
nally from Australia but now headquartered are in
California) signed a power purchase agreement with
San Francisco’s Pacific Gas & Electrical for a 177
MW thermal plant. Other players include Sharp and
Boeing.
Heliostat solar
In a heliostat system an array of solar reflectors
(heliostats) can be combined to concentrate the sun’s
energy on a solar tower where the heat is converted
into energy. A large number of motor-controlled
mirrors track the sun and reflect the solar energy
onto a tower receiver, which in turn heats a liquid that
can be used to make steam. A steam turbine then
produces electricity. Such systems are being tested
in the United States and Spain.
Parabolic dish
A dish system uses a large, reflective, parabolic
dish (similar in shape to a satellite television dish). It
focuses all the sunlight that strikes the dish up onto a
single point above the dish, where a receiver captures
the heat and transforms it into a useful form. Typically
the dish is coupled with a Stirling engine, but also
sometimes a steam engine is used. These create
rotational kinetic energy that can be converted to
electricity using an electric generator.
Figure 3.11: CSP – patent filing locations

www.chathamhouse.org.uk
35
CSP developments attracting most public attention today are desert applications of CSP at scale, requiring the transportation of energy to the point of consumption and thus raising the prospect of a need for high-voltage
long-distance transmission lines. The lesson from wind deployment is that the growing deployment of CSP could create niches of applications where new entrants can develop relevant technologies. Emerging markets such as
Reflective/concentrator systems in use include parabolic trough,
linear Fresnel reflectors, heliostat systems and parabolic disc (see
above). The concentrator system is the determining factor of the
types of technology platform, while other components (such as
engines) can cut across CSP systems. Each has had some success
in commercial operations.
Heat transfer systems include patents on various types of
materials. It is usually a fluid but can be a solid used in storing
systems. The use of molten salt as a heat transfer fluid allows
the longer storage of energy (potentially overnight), while the
use of air as a heat transfer unit allows higher temperature
levels than the use of water/steam.
Engines of three family types are used with different
concentrator systems: Stirling, Brayton and Rankine
engines. Suppliers of engines may be from other fields:
for instance Organic Rankine Cycle engines were developed for
the biomass field by Italian company Turboden (bought by UTC’s
Pratt & Whitney in 2009).
The tracker system is a key CSP component. Each concen-
trator system entails specific technology challenges. For helio-
stats, for example, dozens or more mirrors are used to track the
sun and to ensure that reflected rays centre on a single point
in the solar tower. Components are closely related to software
and control systems.
Sensor systems, computing systems and software are
critical for optimizing the tracking system, adaptation to the
environment (such as high wind), and the control of engine
uses. There is a large overlap between the players in this
segment and those in ‘tracking systems’.
Table 3.12: Top patent holders of CSP sub-spaces
Top Assignees No. of patents
CONCENTRATOR SYSTEMS
Total 2,291
1 Boeing 22
2 US Department of Energy 21
3 Agency of Industrial Science & Technology 20
4 Sanyo 18
5 Yeda Research and Development (Weizmann) 16
HEAT TRANSFER
Total 3,221
1 Mitsubishi Heavy Industries 42
2 Matsushita Electric 29
3 Toshiba Corp 28
4 Hitachi 21
5 Agency of Industrial Science & Technology 20
5 Siemens 20
5 US Department of Energy 20
ENGINES
Total 1,308
1 United Technologies Corp/ Pratt&Whitney 31
2 Matsushita Electric 17
3 General Electric Co 16
4 Aisin Seiki Co Ltd 14
5 Daikin Ind Ltd 12
TRACKER SYSTEMS
Total 2,069
1 Sanyo 37
2 Toshiba Corp 23
3 Matsushita Electric 20
4 Yeda R&D (Weizmann Institute) 18
5 Boeing 15
COMPUTER/SENSOR SYSTEMS
Total 2,268
1 Matsushita Electric 28
1 Sanyo 28
3 Mitsubishi Heavy Industries 22
4 Toshiba Corp 19
5 Boeing 15
5 Hitachi 15
5 Yeda R&D (Weizmann Institute) 15
Box 3.5: CSP subsectors in detail
Patent Landscapes of Individual Energy Sectors

www.chathamhouse.org.uk
Who Owns Our Low Carbon Future?
36
South Africa and Mexico may become key users of the technology. While their presence in the space as patent owners or patent-filing destinations is as yet minimal, the number of patents – albeit low – indicates the presence of some level of technology-absorptive capacity.
3.5 Cleaner coal
Coal power makes a significant contribution to power generation in most developed and developing economies. A large number of coal power plants built in the recent past have been in emerging markets, with many more planned.11
China on its own accounted for 42 per cent of global coal consumption in 2008 (compared to 16 per cent for Europe and Eurasia). But some developed economies are also an important market for cleaner coal applications; in 2008 the US economy relied on coal for up to 40 per cent
of its generation capacity, and coal accounted for 17 per cent of global coal consumption.12
Given the prevalence of coal use across the world, the deployment of cleaner coal technologies is of critical importance. Yet in terms of growth in patenting rates, they are among the ‘laggards’, especially considering the proportionately larger role that coal has played histori-cally in energy systems. Most companies patenting in this space are from OECD economies. They come from diverse industries: steel, turbine equipment, oil and gas, and air-supply equipment.
Table 3.13: Cleaner coal – top patent holders
AssigneeNo. of
patents
Total 7,059
1 Babcock Hitachi Kk 557
2 Mitsubishi Heavy Ind Ltd 404
3 Hitachi Ltd 265
4 Nippon Steel Corp 227
5 Kawasaki Heavy Ind Ltd 210
6 Ishikawajima-Harima Heavy Industries Co Ltd 190
7 Posco 141
8 Sumitomo Metal Industries Ltd 137
9 NKK Corp 126
10 ExxonMobil 111
11 Combustion Engineering 108
12 General Electric Co 96
13 Air Products and Chemicals Inc 68
14 Voest-Alpine Industrieanlagenbau GmbH & Co 67
15 Babcock & Wilcox Co 65
16 Ebara Corp 63
17 Kobe Steel Ltd 57
18 Siemens Power Generation Inc 52
18 Chevron Texaco 52
20 Foster Wheeler Energy Corp 50
3.5.1 Areas of innovation within cleaner coal combustion
sub-spaces
Three types of cleaner coal applications are explored in this research: pulverized coal combustion (PCC), pulverized coal fluidized bed combustion (PCFBC)13 and integrated
400200
600800
10001200
16001400
18002000
Pat
ent a
ssig
nmen
t orig
ins > 5 years ago
Last 5 years
0
US
A
Ger
man
y
Den
mar
k
Japa
nU
K
Rep
of K
orea
Spa
in
Can
ada
Sw
eden
Fran
ce
Chi
na
BRICsTop 10 OECD
Rus
sia
Bra
zil
Indi
a
Figure 3.12: CSP – top patent assignee origins
Table 3.12: CSP – concentration of IPR
Top 20 assignee patents as
% of all patents in field
Average all 6 fields 28.5
CSP: overall 14.9
Engines 14.9
Tracker systems 12.3
Computer/sensor systems 11.2
Heat transfer 10.2
Concentrator systems 9.8

www.chathamhouse.org.uk
37
gasification combined cycle (IGCC) technologies (see Box 3.6).
In PCC and PCFBC systems the coal is ground into powder to improve efficiency. These technologies are already globally deployed. In contrast, only five IGCC power plants have been launched globally, each with a capacity of around 300 MW. In IGCC, the coal is gasified prior to combustion. While the technology is proven, innovative steps are needed to scale it up cost-effectively.
Part of the early wave of environmentally focused innovation in coal power generation was focused on the reduction of sulphur oxide and nitrous oxide emissions in response to acidification of the environment. Some of the technologies developed for flue gas cleaning (espe-cially amine-based systems for SO2 control) are now being adapted for absorbent-based carbon capture (see section 3.6).
3.5.2 Key trends: geographical distribution and IP
ownership concentration
Filing destinationsWhile the United States and Japan dominate the patent filings space, Chinese patent filings now represent 7.9 per cent of all patents – a significant rise from a very low base only five years ago. The low level of filings in Germany can be accounted for partially by filings through the EPO. South Korea also emerges as an important patent filing jurisdiction, on the back of local industrial capabilities in this space.
Location of assigneesThe number of assignees is dominated by organizations based in the United States, followed by Japan, Germany and South Korea. The United Kingdom and France are also in the top 10 in the OECD. These countries broadly correspond to the location of some of the leading turbine engineering companies globally. However, China comes ahead of Germany and Japan on the back of strong patent growth in recent years.
Figure 3.14: Cleaner coal – top patent assignee origins
IP ownership concentrationHigher IP ownership concentration of cleaner coal tech-nologies is partly explained by vertical integration within the industry. Most are owned by US and European companies. Today, China, India and Russia are major markets for modernizing and installing new coal power plants. Specific market conditions play an important role in the extent to which IPRs may be a barrier to deployment of the latest technologies.
Table 3.14: Cleaner coal – concentration of IPR
Top 20 assignee patents as % of all patents in field
Average all 6 fields 28.5
Cleaner coal: overall 43.2
PCC & PCFBC 42.9
IGCC 43.3
Emissions control 44.2
Biomass/co-firing 32.1
Advanced alloys 45.4
> 5 years agoLast 5 years
0 U
SA
Ger
man
y
Den
mar
k
Japa
nU
K
Rep
of K
orea
Spa
in
Can
ada
Sw
eden
Fran
ce
Chi
na
BRICsTop 10 OECD
Rus
sia
Bra
zil
Indi
a
400200
600800
10001200
16001400
18002000
Pat
ent a
ssig
nmen
t orig
ins
WIPO 9.0%
EPO 8.6%
China 7.9%
Rep of Korea 2.7%
Germany 0.7%Poland 0.6%
UK 0.6%Canada 2.3%
Australia 1.4%Russian Federation 1.1% Other Patent
Authorities 2.4%
Japan 31.5%
USA 31.3%
Figure 3.13: Cleaner coal – patent filing
locations
Patent Landscapes of Individual Energy Sectors

www.chathamhouse.org.uk
Who Owns Our Low Carbon Future?
38
PCC: Coal is ground into powder, mixed with air and burned.
Process efficiency is increased from the traditional 35 per cent
to 45–50 per cent through higher burning process tempera-
tures of up to 700°C, increasing the pressure of the steam.
Key areas of innovation include improved alloy materials for
the boilers, and improved emissions control (SO2 and NOx).
PCFBC: Coal powder is mixed with crushed limestone, and placed
on a bed or vessel, where it is turned to liquid at high heat – up
to 800°C. The level of efficiency is similar to that of PCC, and the
advantage is that NOx formation is lower in PCFBC (though N2O
is higher). Scaling up this technology remains a key challenge.
While PCC plants can reach up to 1,000 MW in one boiler, for
PCFBC so far maximum boiler capacity is 300 MW. That makes
the technology less attractive for emerging markets such as India
and China which have been focusing on rapid scaling up of their
generation capacity.
IGCC: Ground coal is burnt in a low-oxygen environment:
resulting in incomplete combustion; synthetic gas fuel is the
side-product. The gas is then burnt in a combined cycle. While
the technology is proven, innovative steps are needed for scaling
it up cost-effectively. Part of the early wave of environmentally
focused innovation in the coal-power generation space was
focused on SOx and NOx emissions reduction. Some of the
technologies developed for flue gas cleaning (especially amine-
based systems for SO2 control) are now being adapted for
absorbent-based carbon capture.
Co-firing of coal plants with various types of biomass is seen as
an intermediate step in the ‘cleaning-up’ of coal power genera-
tion, as discussed in section 3.4 above.
Advanced alloys are used to lower costs and increase the the
performance of cleaner coal power generation at high tempera-
ture. Nickel-based alloys in particular have been used in many of
the super-critical boiler applications.
Table 3.15: Top five patent owners in cleaner
coal sub-spaces
No. of patents
PCC & PCFBC
Total 2,190
1 Hitachi 225
2 Mitsubishi Heavy Ind Ltd 103
3 Kawasaki Heavy Ind Ltd 63
4 Exxon Research and Engineering Co 54
5 Voest-Alpine Industrieanlagenbau GmbH & Co 45
IGCC
Total 1,333
1 Mitsubishi Khehvi Indastriz Ltd 86
2 Hitachi 72
3 General Electric Co 54
4 Air Products and Chemicals Inc 53
5 Toshiba Corp 35
BIOMASS/CO-FIRING
Total 305
1 General Electric Co 18
2 Hitachi 9
3 Ishikawajima-Harima Heavy Industries Co Ltd 7
4 Future Energy GmbH and Manfred Schingnitz 6
5 Manufacturing and Technology Conversion 5
EMISSIONS CONTROL
Total 1,635
1 Hitachi 321
2 Mitsubishi Khehvi Indastriz Ltd 82
3 Ishikawajima-Harima Heavy Industries Co Ltd 40
4 Kawasaki Heavy Ind Ltd 34
5 General Electric Co 30
BIOMASS/CO-FIRING
Total 305
1 General Electric Co 18
2 Hitachi 9
3 Ishikawajima-Harima Heavy Industries Co Ltd 7
4 Future Energy GmbH and Manfred Schingnitz 6
5 Manufacturing and Technology Conversion 5
ADVANCED ALLOYS
Total 262
1 Texaco Inc 21
2 Inco Alloys International Inc 9
3 Hitachi 8
3 Sumitomo 8
5 Conoco Inc 7
Box 3.6: Cleaner coal subsectors in detail

www.chathamhouse.org.uk
39
3.6 Carbon capture
A number of technology families underpin the different stages in carbon capture and storage (CCS) systems. Despite significant industrial experience in individual areas, there remain great opportunities for advancing the integration of the CCS components, scaling up the process and de-costing the various processes.14 The analysis here focuses on the technologies for carbon capture (see Box 3.7).
Carbon dioxide is a commonly found ’impurity‘ in oil deposits, natural gas and other industrial processes. Consequently CO2 separation techniques have been applied in various industrial contexts by the oil and gas industry, including enhanced oil recovery, liquefied natural gas and oil refineries. Carbon separation processes are also used in fertilizer production and other chemical industry applications. While not all the existing technologies and approaches are directly trans-ferable to carbon capture in power generation, signifi-cant capabilities in many carbon intensive industries can be deployed in scaling up carbon capture technolo-gies in the near future.
Different technologies are required at different steps in the process: so chemical engineers may focus on the CO2 removal step, oil companies on transport and storage, and turbine companies in gasification.
Table 3.16 therefore includes oil and gas companies (ExxonMobil, Shell, Texaco, Chevron, BP), equipment manufacturers (Alstom, General Electric, Mitsubishi), chemicals industry players (Air Liquide, Dow Chemical, BASF) and specialists service providers (such as Honeywell).
Most of the largest patent portfolio owners in this area are major players in the power generation, oil and gas and chemicals production. Oil companies ExxonMobil and Shell have respectively three times and twice as many patents as the third company on the list. In addition, ExxonMobil has top one or two positions in all the tech-nology subsets analysed.
The strong presence of oil and gas companies and their suppliers reflects their capabilities in enhanced oil recovery and refinery operations. But there is a wider mix of organiza-tion types, including universities and research institutes, the US Department of Energy, and new entrants with novel tech-
nologies (outside the top 20 but across the whole technology space).
3.6.1 Areas of innovation within key sub-spaces
Current R&D and CCS demonstration efforts focus around several types of coal power generation: post-combustion, pre-combustion and oxyfuel. To overcome the high energy overhead or penalty and the relatively high investment costs, some industrial approaches are focusing on improvements through incremental inno-vation around proven technologies such as adsorbents, absorbents and solvents. Step-changes approaches centre on the use of membranes, enzymes and other novel approaches to capture carbon. Both approaches are examined in this analysis.
Post-combustion technologies are particularly relevant
Patent Landscapes of Individual Energy Sectors
Table 3.16: Carbon capture – top patent holders
Rank Assignee No. of patents
Total 9,160
1 ExxonMobil 978
2 Shell 414
3 UOP Inc (Honeywell Subsidiary) 223
4 Air Products And Chemicals Inc 180
5 Texaco Inc 120
6 Chevron 117
7 Conoco Phillips 111
8 General Electric Co 101
9 Praxair Technology Inc 100
10 Ashland Inc 83
11 Alstom 76
11 BP 76
13 Air Liquide 75
14 Mitsubishi 70
15 Dow Chemical Company 49
16 Ebara Corp 43
17 Engelhard Corp 40
18 Basf AG 39
18 Occidental Petroleum Corp 39
20 Union Carbide Corp 34

www.chathamhouse.org.uk
Who Owns Our Low Carbon Future?
40
for retrofitting existing power plants to remove CO2 from flue gas, usually through a chemical separation process. Pre-combustion carbon capture involves the removal of CO2 prior to combustion, typically in the context of coal gasification (within an integrated gasification combined cycle plant design),15 or another gas.
In oxyfuel combustion coal is burned in pure oxygen rather than air. The combustion process results in flue gas with 95 per cent or more CO2 concentration, which can then be compressed for transportation and carbon sequestration. The majority of patents that explicitly note the combustion type are focused on pre-combustion. However, many relevant patents in this space do not make explicit mention of the applicable combustion type. Box 3.7 shows key types of CO2 separation processes in more detail.
As shown in Figure 3.15, patents on sorbents remained higher from the mid-1980s onwards. With the exception of enzymes, patents across all the sub-spaces started to climb in the mid-1990s, a trend which continues to the present. There is a pronounced increase in separation technology patenting since 2000 across all technology types.
3.6.2 Key trends: geographical distribution and IP
ownership concentration
Filing destinations More patents were filed in the United States than in all other countries taken together. In combination with the data on location of assignees, this finding confirms overall US leadership in the carbon capture space.
Location of assignees US-based assignees dominate the space. This can be attributed to factors including an early focus on enhanced oil recovery and industrial uses of separation technology in refineries and petrochemical plant. In addition, in the carbon storage field (which is not part of the analysis here), US-based oil companies pioneered reservoir studies and later brine reservoir studies, which can be used for ‘sinks’ for carbon sequestration. Even where non-US companies are operating in the carbon capture or EoR space, they often do so in partnership with US companies.
IP ownership concentration There is a relatively high IP ownership concentration in this field, with the top 20 assignees accounting for 32.4 per cent of all patents. The level of concentration is even higher in selected technology fields, such as membranes. Many of the most likely ‘first deployment’ technologies have been in industrial use for decades. As mass deploy-ment is only expected around 2020, it is likely that many of the fundamental technology patents will have expired. Provided that the patent owners are willing to participate, invest or share, patents in this area should be not pose significant barriers given their use in many industrial fields.
However, when patents expire, the owners of the technologies can protect their IP by use of trade secrets, know-how embedded in their technologies, and also
WIPO 19.5%
EPO 10.8%
China 0.4%
Rep of Korea 0.1%UK 0.1%
Germany 0.1%
Canada 0.3%
Japan 0.2%
Other Patent Authorities 0.2%
USA 68.4%
0
50
100
150
200
250
300
Adsorbents
Solvents Sorbents
Enzymes Membranes
1976
1978
19801982
19841986
19881990
19921994
19961998
20002002
20042006
Figure 3.15: Patenting rates by selected
carbon capture technologies since 1976
Figure 3.16: Carbon capture – patent filing
locations

www.chathamhouse.org.uk
41
by extending and renewing design rights around the product systems. Also, current R&D in scaling up and integrating carbon capture in plant design as well as the development of novel approaches will result in a fresh generation of patents which will be valid for up to another 20 years – spanning the critical mass deploy-ment period. In addition, crossover technologies such as enzyme-based carbon capture may already be backed by strong patent portfolios from within the biotech industry.
Table 3.17: Carbon capture – concentration
of IPR (%)
Average all 6 fields 28.5
Carbon capture – overall 31.8
Adsorbents 34.7
Solvents 25.4
Absorbents 46.1
Membranes 31.1
While developers of novel carbon capture methods are not dominant in this space, the novelty of their approaches may increase their relative impact in the move towards commercialization. It is also of interest that the leading companies differ significantly between the carbon capture and cleaner coal spaces. As
0
US
A
Ger
man
y
Den
mar
k
Japa
nU
K
Rep
of K
orea
Spa
in
Can
ada
Sw
eden
Fran
ce
Chi
na
BRICsTop 10 OECD
Rus
sia
Bra
zil
Indi
a
1000
2000
3000
4000
6000
5000
7000
8000
Pat
ent a
ssig
nmen
t orig
ins > 5 years ago
Last 5 years
Figure 3.17: Carbon capture – top patent
assignee origins
Box 3.7: CCS in brief
Carbon capture at source: Carbon capture
technology at scale is likely to be applied beyond
the power generation sector to cement, steel and
chemical production and transportation and the
built environment.a However the bulk of current
R&D and deployment efforts is focused on inte-
gration of carbon capture at coal power plants
(soon to be followed by natural gas combined
cycle plants). Carbon capture was the only area of
CCS covered by the current study.
CO2 transportation: Innovation in this area is
most likely to result from adaptation of existing
pipelines to CO2 transport (e.g. mature pipeline
technologies used in the oil and gas industry),
addressing problems such as the prevention and
detection of corrosion and leakage, or the trans-
portation of CO2 by marine tankers.
Carbon storage: Most current discussion is
focused around the storage of CO2 in deep geolog-
ical sites (most likely saline aquifers), depleted oil
and gas reservoirs (providing additional invest-
ment incentives through enhanced oil and gas
recovery) and possibly unusable coal mines. Other
storage proposals include oceanic sequestration,
and solid CO2 capture techniques. (A preliminary
search identified in excess of 20,000 patents in
this space – a very large number that is probably
accounted for by the overlap with enhanced oil
recovery and other oil and gas industry technolo-
gies.)
Direct capture/geoengineering solutions:
There is also research into more radical technolo-
gies that aim at ‘direct capture’ of CO2 from the
atmosphere and its storage or disposal.
a Committee on Climate Change (2008), Building a Low-Carbon
Economy – The UK’s Contribution to Tackling Climate Change. UK
Stationery Office. www.theccc.org.uk/pdf/TSO-ClimateChange.pdf.
Patent Landscapes of Individual Energy Sectors

www.chathamhouse.org.uk
Who Owns Our Low Carbon Future?
42
Absorbents and adsorbent-based technologies are seen as the most likely
first applications of carbon capture. Absorbents based on amines use chemical
reactions to absorb CO2. The technology was initially used for SO2 capture,
and many of the patents identified originate from desulphurization experi-
ences. Absorbents based on sodium-containing materials can be introduced
in the fluidized bed, allowing direct capture of CO2. Adsorbents are amorphous
solid carbon materials that can capture CO2 on their surface, and release it by
reducing the pressure.a Absorbent technologies are seen as the most advanced,
with adsorbent technologies still in R&D stage. More advanced solid-sorbent
based technologies include simple porous crystals (zeolites, hydrotalcites, and
activated carbon), functionalized solid sorbents (nitrogen enhanced or amine
enhanced) and dry regenerable (based on carbination/calcination of natural
limestone, calcium-based, alkali carbonate based). Absorbent technology can
also be used in air stream purification for oxyfuel applications.b
Solvent-based technologies are used to capture CO2 from flue gas
from coal fired power plants. Current carbon capture technology is based
on a general purpose solvent, monoethanolamine (MEA), which chemically
absorbs CO2 – one that has been used in other industries. However it has a
number of disadvantages: it is non-selective, corrosive, requires large-scale
equipment, and only effective under low to moderate partial pressures of
CO2. The scalability, energy efficiency and pressure requirements of CCS are
stimulating research into improved solvent efficiency and behaviour, e.g. ionic
liquids, potassium carbonate (K2CO3) and chilled ammonia (NH3).c
Membranes-based technologiesd are relatively immature, with applications
suitable for pre-combustion capture processes, where membranes are used
for air purification. Other efforts focus on increasing the membrane effective-
ness in separating CO2 gas from the remainder of the gas stream (flue gas).
Bringing it to market may require additional systems such as vacuum pumps.
Enzymes-based approaches exploit the natural power of a biocatalyst – carbonic anhydrase – an enzyme that enables humans and other
mammals to manage CO2 during respiration. Some companies are applying the biomimetic approach to CO2 capture, working to adapt enzymes
to function within an industrial environment. While only a small number of patents are identified in this area, this technology is likely to play an
increasingly important role in the CCS industry.
Table 3.18: Top 5 patent owners in cartbon
capture sub-spaces
Top Assignees No. of patents
CARBON CAPTURE: ADSORBENT
Total 504
1 Air Products and Chemicals Inc 27
2 Praxair Technology Inc 21
2 Questair Technologies Inc 21
4 UOP Inc 14
5 BOC Group Inc 11
5 ExxonMobil 11
5 General Electric Co 10
CARBON CAPTURE: ABSORBENTS
Total 1,395
1 ExxonMobil* 78
2 ConocoPhillips 54
3 UOP Inc (Honeywell Subsidiary) 30
4 Air Products and Chemicals Inc 28
5 Praxair Technology Inc 22
CARBON CAPTURE: SOLVENTS
Total 568
1 ExxonMobil 32
2 BP 17
3 UOP Inc (Honeywell Subsidiary) 16
4 Marathon Oil Company 15
5 Shell 14
CARBON CAPTURE : MEMBRANES
Total 623
1 Air Products and Chemicals Inc 28
2 ExxonMobil 25
3 General Electric Co 16
4 Praxair Technology Inc 15
4 Shell Oil Company 15
Box 3.8: Carbon capture subsectors in detail
a Carbon Capture Journal (2009), CO2CRC H3 capture project launched, 9 July, http://www.carboncapturejournal.com/displaynews.php?NewsID=416;
Gough, C. and Shackley, S. (2006), Carbon Capture and its Storage, Ashgate Publishing Group, Farnham, UK.
b Praxair (2008), Gasification: Upgrading fuel values, http://www.praxair.com/praxair.nsf/AllContent/BD2C39F89858F865852572A000574BC4?OpenD
ocument&URLMenuBranch=284146C36EAFABD6852572A50074F169.
c Kothandaraman, A., Nord, L., Bolland, O., Herzog, H., and McRae, G. (2008), Comparison of Solvents for Post-Combustion Capture of CO2 by Chemical
Absorption, presented at the 9th International Conference on Greenhouse Gas Control Technologies, Washington, DC, November. http://sequestration.mit.
edu/research/solvents.html; Energy Efficiency News (2008), Screening method could lead to more efficient carbon capture, 24 July, http://www.ener-
gyefficiencynews.com/power-generation/i/2290/.
d See the following example of a membrane technology: Bellona (2009), Novel Technologies, 16 February, http://www.bellona.org/ccs/Artikler/novel_tech-
nologies/#2.

www.chathamhouse.org.uk
43
carbon capture technologies evolve, power generation equipment manufacturers may seek to acquire, license or develop in-house some of the technologies identified, especially in the integration of carbon capture in power plant designs.
Many of the patents are held by large companies in both the oil and gas and heavy equipment sector. Emerging IP issues may be related to vertical integra-tion, and the embedding of technology in the design of equipment. Many oil and gas companies may be in the position of holding large patent portfolios (and underlying technology capabilities) across the full chain of CCS.
Notes1 Global Wind Energy Council (2008), Global Wind Energy Outlook.
2 For instance, the building of onshore wind farms in more densely
populated areas has revealed the need for innovation around noise
reduction and reduced radar impact of wind farms on air traffic control.
3 Enercon GmbH v. USITC, 97-1554 (08/12/1998), www.ll.georgetown.
edu/Federal/judicial/fed/opinions/97opinions/97-1554.html.
4 European Wind Energy Association (2009), Wind Energy – The Facts.
www.ewea.org/fileadmin/ewea_documents/documents/publications/
WETF/1565_ExSum_ENG.pdf.
5 The Guardian (2009), ‘Winds of change come to country plagued by power
blackouts’, 30 December.
6 IC Insights (2009), Solar Energy: Growth Opportunities for the
Semiconductor Industry. See www.icinsights.com/news/bulletins/
bulletins2009/bulletin20090720.html.
7 See IC Insights, Research Bulletin, 20 July 2009, http://www.icinsights.
com/news/bulletins/bulletins2009/bulletin20090720.html.
8 In the settlement, Nanoco agreed to terminate its current US business for
its core-shell quantum dots. Those quantum dots were sold in the US by
its US distributor, Sigma-Aldrich, under the name Lumidots. In the settle-
ment, Nanoco did not admit that the asserted patents are either infringed
or valid. Additional terms of the settlement were not disclosed. Jason
Hartlove, chief executive officer of Nanosys, said: ‘By enforcing ownership
of our intellectually property, the manufacturers remain the real winners in
having access to proven, trusted advanced material architecture, including
quantum dot applications.’ [See Reuters (2009), ‘Nanosys Reaches
Settlement of Patent Infringement Lawsuit Against Nanoco Technologies
for Quantum Dot Technology’, 23 July 2009, http://www.reuters.com/
article/pressRelease/idUS165155+23-Jul-2009+BW20090723.
9 GE has a history of acquisitions in the energy/environmental space,
enabling it to rapidly gain capabilities in new areas of interest. In 2001 it
acquired Energy and Environmental Research Corporation (EERC) for its
NOx control technologies. It had also acquired Praxis Engineers, providers
of software solutions for improvement in coal-power steam plants. In 2001
it acquired Enron’s wind energy portfolio, including the assets of Zond
Energy (see section 3.1).
10 The Financial Times (2009), ‘Solar power plants planned for Sahara’, 12 July.
11 Waston, J., MacKerron, G., Ockwell, D. and Wang, T. (2007), Technology
and carbon mitigation: are cleaner coal technologies a viable option?,
Human Development Report Office Occasional Report, Human
Development Report 2007/2008, May. http://hdr.undp.org/en/reports/
global/hdr2007-2008/papers/Watson_MacKerron_Ockwell_Wang.pdf.
12 BP plc (2007), BP Statistical Review of World Energy, June 2007.
13 As there are significant systems/engineering overlaps between PCC and
PCFBC, we combined our analysis of the two spaces.
14 IPCC (2005), IPCC Special Report on Carbon Dioxide Capture and Storage,
prepared by Working Group III of the Intergovernmental Panel on Climate
Change. Metz, B., Davidson, O., de Coninck, H.C., Loos, M. and Meyer, L.A.
(eds), Cambridge University Press. Available in full at www.ipcc.ch. See also
McKinsey (2008), Carbon Capture and Storage – Assessing the Economics.
http://www.mckinsey.com/clientservice/ccsi/pdf/ccs_assessing_the_
economics.pdf.
15 Scottish Centre for Carbon Capture and Storage (2007), Pre-Combustion
Capture, http://www.geos.ed.ac.uk/sccs/capture/precombustion.html.
Patent Landscapes of Individual Energy Sectors

www.chathamhouse.org.uk
44
4. Understanding Technology Diffusion
There are two major innovation-related dimensions to a successful and timely transition to a low-carbon economy. On the one side is the rapid development of new and applied ideas through research and development. On the other is rapid demonstration, commercialization and deployment of these – and existing – technologies. While patents provide incentives for research and development investments, they may not provide the same incentives for speedy diffusion.
This chapter shows how the examination of patent data can shed light on the operation and effectiveness of different technology diffusion channels. It is important to note that there are tremendous methodological challenges associated with using patent-generated data in under-standing technological diffusion. This is due to problems with data availability from different geographical regions, and to the absence of reporting requirements.
4.1 Technology systems interaction/migration
Technological innovation does not follow a linear logic, nor are innovation processes restricted to boundaries of individual economic sectors. In most industries a wider range of technological solutions can be used to meet a specific need. General purpose technologies such as nanotechnology or advanced alloys have multiple applica-tions across many industries. This means that in applied
technology systems it is rare to find pure technologies, as the majority of industrially applicable innovations draw on multiple areas of science, technologies and business practices. Most of the breakthrough innovations occur when different fields interact. These convergences can lead to the dilution of industry barriers and norms.
As described in Chapter 3, gear and transmission systems technology in the wind sector are linked to both transport and other industrial applications. Blade technology owes its advance in part to aerodynamics, the use of advanced composites in aerospace and use of wind tunnels originally designed for aircraft testing.1 Offshore and marine applica-tions closely intersect with experience in oil and gas explo-ration and the operation of offshore platforms in extreme environments. CCS technologies originate from a range of petrochemical and enhanced oil recovery applications.
Innovation in solar technologies has benefited from developments in consumer and industrial electronics. Early development of PV cells was driven by advances in science in satellite and industrial laser technologies. Advances in concentrated solar power owe much to aerospace and satellite technologies. This is reflected in the strong patent portfolio owned by Boeing, an aircraft manufacturer. Seven out of the top 20 owners of cleaner coal technology patents are from the steel sector.
There are also examples in developing economies. The development of pre-paid metering technology in South Africa saw the combination of technological capabilities from the energy sector, and electronics technology and encryption algorithms first developed by South Africa’s military industry.2
To drive global decarbonization, many different kinds of economic and physical linkages are needed among industrial sectors. Recent developments exemplify the disintegration of traditional industry barriers. In July 2009 ExxonMobil announced a collaborative initiative with Synthetic Genomics Inc. on the commercialization of fuels produced from genetically engineered algae. BP invested $90m into a cellulose biofuels joint venture with Verenium, and a separate one with DuPont.3 This indicates a convergence between players from the oil and gas, biotech, biomass and chemicals industries into what may become a consolidated bioenergy sector.
Understanding Technology Diffusion

www.chathamhouse.org.uk
45
Energy technology areas Source industry
WinD
Offshore Wind Oil and gas offshore platform operations: rigging, maintenance, underwater transmission
nanotech: structural resistance/strength of wind turbine blades for offshore applications
Wings Aerospace: aerodynamics, wind tunnels, advanced materials
Gearbox Machinery and automotive: gears, bearings, transmission systems
Energy storage Electronics: batteries
Monitoring Electronics: sensing systems
SoftwareMeteorology: computer modelling and prediction of micro conditions; optimization of wind farms
operations
SOlAr PV
Concentrator technologies High-grade concentrators developed in space technology: applied in third/fourth generation PV
Silicon production Benefit from large volume silicon chip production – and recycling used silicon
Organic PV Organic light-emitting diodes (OlEDs) in other industries
Solar tracker Satellite guidance technology and concentrated solar power
CdTe-based PV Satellite and laser industry advances in uses and generation of iii-iV alloys
CSP
Concentrator technologies High-grade concentrators developed in space technology
Steam-cycle engines From engine manufacturers for industrial applications
Organic rankine Cycle engines Biomass co-generation and other alternative energy applications with lower temperature cycles
Solar tracker Satellite guidance technology
Heat transfer fluids From industrial chemicals field
BiOMASS
Combustion/gasificationAdaptation of basic technology from coal combustion: especially re: fluidized bed, and steam-based
cycles (rankine Cycle)
Waste combustion Convergence of municipal waste incineration with energy conversion capture (as early as 1960s)
CHP Central heating solutions: using experience/infrastructure of municipal/industrial central heating
nOx/SO2 emissionsOperators in the Powergen industry, such as Air liquide, are adapting their processes/technologies
for use in biomass
CArBOn CAPTUrE
CO2 separation
Biotech: use of enzymes for carbon separation
Separation of CO2 from during the production of hydrogen, e.g. for ammonia production
lnG terminals: separation of CO2 from natural gas prior to entry in national gas networks
Oxyfuel Entry by nASA-linked companies, using rocket engine technologies for more efficient oxyfuel burn
iGCC
PCFBC
PCC
Oil and gas industry: experience in coal transformation in to fuel
Advanced alloys from steel industry, developed in other industrial applications
Biomass co-firing
Table 4.1: Examples of crossover technologies
Understanding Technology Diffusion

www.chathamhouse.org.uk
Who Owns Our low Carbon Future?
46
Where such convergence takes place, companies from different industries can bring frequently divergent IP practices. For instance, biotech companies may be influ-enced by the IP strategies of their pharmaceutical clients, for whom cross-licensing has not been the norm. Oil and gas companies come from a highly vertically inte-grated business environment, with large corporate patent portfolios. Electronics companies entering the space (for instance in software and control applications through all the energy spaces examined) may have relatively more experience with open-source software development and the software industry licensing regimes. As these energy systems mature, it will be important to observe how IP strategies evolve, and whether the emerging leaders rely on litigation and blockage, cross-licensing, or any one of the many corporate IP strategy variations identified in Chapter 1.
Table 4.1 provides examples of how key components of low-carbon energy technologies and capabilities have been adapted from technologies from other industries.
Natural endowments play an important role in deter-mining the innovation pathways. Norway’s strength in hydro, offshore technology and carbon capture can be clearly attributed to its abundance of water, oil and gas resources, and associated industries. The same factor underpins Spain’s leadership in solar, or Denmark’s and the United Kingdom’s positions in offshore wind. However, natural endowments alone are not sufficient to drive domestic innovation efforts. Portugal, for example, has excellent wind resources, yet fewer than 10 patents originate from that country, whereas over 300 come from the United Kingdom, despite a similar amount of installed capacity in the two countries.
As shown in Chapter 3, the technological knowledge assets of carbon-intensive industries could prove to be the key in enabling the global transition to low carbon energy system. The fossil fuel and petrochemicals industries, for example, have major advantages in distribution networks and logistics capacity. These sectors are also among the most potent industrial assets of emerging economies such as China and India. These carbon-intensive sectors have considerable strength in areas such as capital and invest-ment portfolios, access to finance, innovation capacity,
skilled labour, logistics and supply chain management, integration with key local sectors, and political influence. The key question is how to identify the knowledge assets in high carbon industries and how can they be harnessed for low carbon development.
In this ever more complex technological and competi-tive environment, companies and investors need to be kept abreast of developments not only in their own field, but in other related areas – whether competing or substitutive. Without a clear understanding of the range of techno-logical options available across different sectors, and how different technological systems interact with each other, policy-makers will struggle when making critical choices about national or local industrial development strategies and investments.
Companies and countries do not develop all parts of the energy system at the same pace simultaneously. Countries also differ in terms of natural endowments and inherited industrial capabilities. Proactive innovation and climate policy-makers therefore face a complex challenge in moni-toring technological and commercial developments across a wide range of technological fields.
4.2 Diffusion channels
Collaborative and licensing activities are often a non-transparent part of the companies’ economic activities. This is due in part to the absence of uniform reporting requirements, but also to the confidential and strategic nature of many such collaborations and arrangements. As a result, very few licensing data are available in the public domain. Data on actual licensing deals are also incon-sistent, and rarely reported in media outlets or company websites or reports. Data on existing patent pools, cross-licensing agreements and other patent transactions are also very scarce. Some actors go out of their way to hide or disguise information, to maintain a competitive advantage.
There are many possible friction points and transaction costs that may contribute to a slow rate of licensing. These include information gaps and the lack of market bench-marks, but also the relatively high legal and other nego-tiation costs. In principle these can be alleviated through
Understanding Technology Diffusion

www.chathamhouse.org.uk
47
improved access to information and benchmarks for transaction values and types. Private-sector participants are likely to find full disclosure requirements difficult to implement in practice owing to confidentiality and strategic considerations.
4.2.1 Collaborative activities: are there enough?
To investigate collaboration in more detail, a dataset has been developed for this study based on co-assignment of patents (i.e. cases where more than one organization is listed as an owner of a patent). Co-assignment is an imperfect proxy for collaborations and licensing. For example, these data may exclude university–corporate R&D collaborations, where corporate partners often retain all ownership of the generated IP as part of academic research sponsorship.4
Figures 4.1 and 4.2 give snapshots of collaboration in innovation activities. Most collaboration takes place among OECD entities, mainly among entities within the same country; the sharing of patents on a transnational basis is much less common even within the OECD. This demonstrates the ‘localized’ nature of relationships between companies and universities and between leading corporations and key suppliers. This pattern is particularly noticeable among Japanese corporations. Some of the collaborations identified are among major companies that
may not be competitors but have a supplier–client relation-ship. In solar PV, for example, glass manufacturers such as Asahi have collaborated with suppliers and clients alike in developing technologies around thin-film PV. The bulk of collaborations identified involved large national and multinational corporations.
Even though there are currently few data on collabora-tions and licensing, the expectation is that both will accel-erate as investment in R&D and deployment in the energy sector increase. This calls for the establishment of some market benchmarks and more transparency.
4.2.2 Measuring diffusion rate: timeline and geography
In any industry a relatively small number of highly influential patents receive the bulk of citations by future patents. By analysing the forward citations of a sub-set of influential and highly cited patents, this section explores patterns of diffusion including the estimated timeline for diffusing technology, the geographic composition, and the correlation between the maturity of the technological sphere and diffusion trends of a sector.
US patent citation data have been used to analyse the relative diffusion rate of the low-carbon energy technolo-gies. Until recently the United States was regarded as the largest market for energy technologies. Many developing-world corporations file their patents in the United States
3%
8%
87%
2%
Patents shared within one OECD countryPatents shared between different OECD countriesPatents shared within one non-OECD countryPatents shared between an OECD country and a non-OECD country
13%
6% 45%
27%
7%2%
MultinationalNational CorporationPublicSMEUniversityOther
Figure 4.1: Domestic versus international collaboration
Figure 4.2: Collaborations by organization type
Understanding Technology Diffusion

www.chathamhouse.org.uk
Who Owns Our low Carbon Future?
48
for strategic and legal reasons. So while imperfect, US patent citation data can act as a proxy for global diffusion of low carbon technologies.
Analysis of the top 30 most frequently cited US patents in each of the six fields shows that the majority (some of which can be understood as ‘foundational’) are owned either by companies or individuals (Table 4.2). Individuals are quite likely to have either formed a company on the back of the underlying IP or licensed it to corporate players. Only a small number of patents are obvious results of public sector research. One possibility is that private-sector players tend to acknowledge explicitly patents held in the private sector as foundational: university IP may be less visible to patent writers/examiners.
The average age of the top 30 cited patents ranges between 19 and 30 years across the six energy technologies. As patent protection lasts no more than 20 years, it would appear that protection on a significant part of what could have been considered as foundational IP has already expired. The analysis also illustrates that in energy technologies infor-mation diffusion is a slow process, and that it took a long time for these important patents to be used in a subsequent invention. This is a worrying conclusion given the urgent need for transformation of the global energy system.
Most of the technology underlying these patents would have become known in the industry within a few years of their filing. Yet they only became leaders in terms of citations towards the end of their economic life. This may be due to the fact that, until a few years ago, advanced energy technologies did not seem to be commercially attractive areas for investment.
Consistent with the findings in Chapter 3, most of the highly cited patents in the carbon capture space are owned by oil and gas companies. For wind energy technologies, owners of the top 30 most-cited patents are more diverse, and on average younger.
Many patents have been filed citing invention from the top 30 most cited patents. Looking at their patent-filing year provides insights into diffusion timelines, i.e. the spread of patent-related knowledge within a sector. The citation timeline for both wind and PV accelerated significantly in the 1990s, in contrast to cleaner coal (Figure 4.3). This is in part a function of the rising levels of patenting in these two fields. Even for these fast-moving sectors, significant tech-nology diffusion seems to take more than 20 years.
The geographic spread of patent assignees that had used the top 30 most-cited patents shows the United States as the leading country, in contrast to cleaner coal. This is not surprising given the focus here on patents filed in the United States. Figure 4.4 shows the analysis of those held by non-US assignees, providing a better understanding of the geograph-ical dimensions. Japan clearly stands out in comparison with other countries. There are far higher numbers of US patent citations by Japanese companies on solar PV and wind than by those from other countries. This is quite likely related to the presence of several influential US patents owned by Japanese organizations, which are in turn cited by the US-registered patents of other Japanese organizations. It is evident that US patents by other OECD countries including Germany, France, Canada, the Republic of Korea, Sweden and the United Kingdom have also been actively cited or used for techno-logical improvements.
FieldTotal no. of forward
citationsAverage age of top 30 patents
Public/private sector
Public Private individual
Wind 1,515 19 5 19 6
PV 3,031 22 4 21 5
Biomass 1,342 25 3 26 1
CSP 1,370 30 4 13 13
Cleaner coal 1,825 27 0 27 3
Carbon capture 4,056 22 1 27 2
Table 4.2: Top 30 most frequently cited patents: six energy technologies
Understanding Technology Diffusion

www.chathamhouse.org.uk
49
1976
19751977
1978
1979
19801981
19821983
19841985
19861987
19881989
19901991
19921993
19941995
19961997
19981999
20002001
20022003
20042005
20062007
Num
ber o
f ref
eren
cing
pat
ents
50
100
150
200
250
300Cleaner coalWindPV
0
Figures 4.5, 4.6 and 4.7 describe the rate of citation for these top 30 most cited patents in wind, solar PV and cleaner coal. Five-year time slices show the periods in which these citations took place. The finding here is that the rate differs significantly between countries – and sectors. In cleaner coal, for example, the majority of German patents citing the top 30 were from the 1983–87 period, while for Japan they were filed between 1998 and
2007. The diffusion patterns in both PV and wind sectors are dominated by Japanese owners of US patents, the bulk of which were registered from 2000.
The reality on the ground is that inventors become aware of new technologies on the back of a combination of information sources: working experience, academic research, existing networks, invent-around or reverse engineering efforts and so on. Such experience provides
Figure 4.3: Diffusion timeline for most frequently cited patents
0
70
50
40
60
30
20
10
80
100
90
Austra
lia
Austria
BelguimBraz
il
Canad
aChin
aDDR
Denmark
Finlan
d
Fran
ce
German
yInd
ia
Irelan
dIsr
ael
Italy
Japa
n*
Mexico
Nether
lands
New Z
ealan
d
Norway
Repub
lic of
Kor
ea
Russia
n Fed
erati
on
Saudi
Arabia
Singap
ore
South
Africa
Spain
Sweden
Switzer
land
Taiw
an
United
King
dom
Vene
zuela
Num
ber o
f ref
eren
cing
pat
ents
Cleaner coalWindPV
Figure 4.4: Referencing patents by assignee origins (excluding the United States)
note: The Y-axis was truncated at 100 patents.
*For Japan, the number of referencing patents is 101 for wind and 824 for PV.
Understanding Technology Diffusion

www.chathamhouse.org.uk
Who Owns Our low Carbon Future?
50
the information and background with which inventions, entities and technology descriptions are developed. That in turn informs both the formulation of research and development programmes, the decision (and strategy) of patent-searching, and finally patenting strategies. So while the patent citation data are an important proxy, they probably lag several years behind the actual timeline of exposure to fundamental patents (and the embodi-ment of patent information in products, brochures, and so on). Expansion of this type of analysis to a larger subset of patent authorities may provide further under-standing of the patterns of diffusion internationally.
Figure 4.5: Cleaner coal diffusion – geography and
timeline
Figure 4.6: PV diffusion – geography and timeline
Figure 4.7: Wind diffusion – geography and timeline
4.2.3 inventor networks
The networking and movement of inventors within the innovation system are important factors in the diffusion of technological know-how. As employees they may be requested to sign confidentiality and IP ownership agree-ments, but when scientists and engineers move between jobs or set up their own enterprises they carry knowledge of technologies and their professional networks. These can be used by competitors and in non-competing industries to adopt technologies from elsewhere, or invent-around patent barriers. Professional networks of former employers can accelerate the formation of collaborations, research projects or even new ventures. Research on the role of ‘brain circulation’ in accelerating technological develop-ment, inward technology transfer and access to export markets in emerging economies is available, an example being studies on Chinese entrepreneurs and the linkages between Silicon Valley and Chinese industry.5
Mapping these inventor networks at global, national or industry level could assist companies, industry associations and policy-makers in understanding the availability of domestic inventor networks on energy and related tech-nologies, as well as their international linkages. If used strategically, this understanding can form the basis of global collaborations through identifying individuals and networks with the most relevant know-how in these sectors.
For this report, network analysis on specific companies and organizations was conducted to demonstrate the value
2003-20071998-20021993-19971988-19921983-19871978-1982
Num
ber o
f ref
eren
cing
pat
ents
0
10
20
30
40
60
50
70
Austra
lia
Canad
a
Denmark
Finlan
d
Fran
ce
German
y
Japa
n
Nether
lands
Sweden
Switzer
land
United
King
dom
Num
ber o
f ref
eren
cing
pat
ents
0
100
200
300
400
500
600
700
800
Belguim
Canad
a
Fran
ce
German
yIta
ly
Japa
n
Nether
lands
Repub
lic of
Kor
ea
Sweden
Switzer
land
Taiw
an
United
King
dom
2003-20071998-20021993-19971988-19921983-19871978-1982
2003-20071998-20021993-19971988-19921983-19871978-1982
Num
ber o
f ref
eren
cing
pat
ents
0 10203040
80706050
10090
Canad
a
Denmark
Finlan
d
Fran
ce
German
y
Japa
n
Nether
lands
Sweden
Switzer
land
United
King
dom
Understanding Technology Diffusion

www.chathamhouse.org.uk
51
of understanding these inventor networks as a proxy for technological diffusion. The maps produced illustrate linkages between inventors and assignees on the basis of co-inventorship or co-ownership of patents. The blue circles in Figures 4.8 to 4.10 denote inventors, while the red circles denote patent owner, with the lines denoting co-presence on a patent. The maps captures information for ‘all time’, and can therefore show the history of linkages of some inventors.
The diagrams show patenting portfolios are asso-ciated with a large number of inventors (in some cases numbering in the hundreds). At least in the corporate environment, the lonely genius inventor is a myth. Each of these inventors may have been a direct employee or a consultant of one company or another at the time of invention. In the cleaner coal space, a number of ExxonMobil’s employees have also been inventors on patents owned by Esso, Tosco Corp, the
US Department of Energy and the US Environmental Protection Agency. In the carbon capture space, PraxAir employees have linkages with Air Products and Chemicals Ltd, while in the CSP space Boeing employees have linkages with Pratt & Whitney, UTS and McDonnell Douglas (subsequently acquired by Boeing). Analysis of the network of inventors of the Chinese Academy of Sciences in the biomass field reveals linkages with the Shengli Power company. Finally on solar PV, Japan’s Kyocera is shown to have network linkages with at least three companies.
This analysis of the inventor networks shows a very high level of private-sector cross-fertilization among companies and institutions in the development of new technologies. To speed up technology diffusion, these inventor networks need to be broadened to encourage rapid cross-fertilization between inventions from different sectors in different countries.
Figure 4.8: Linkages of Boeing in concentrated solar power
Understanding Technology Diffusion

www.chathamhouse.org.uk
Who Owns Our low Carbon Future?
52
Figure 4.9: Linkages of Praxair in carbon capture
Figure 4.10: Linkages of ExxonMobil in cleaner coal
Understanding Technology Diffusion

www.chathamhouse.org.uk
53
Figure 4.11: Linkages of Chinese Academy of Sciences in biomass-to-electricity
Figure 4.12: Linkages of Kyocera in solar PV
Understanding Technology Diffusion

www.chathamhouse.org.uk
Who Owns Our low Carbon Future?
54
Understanding Technology Diffusion
Box 4.1: Litigation
The cost of patent litigation is very high, frequently running into tens of millions of dollars. The likelihood of
patent litigation increases with the maturity of an industry or a company – when litigation becomes affordable
and commercially sensible. Patent litigation can occur in many contexts, including:
• Licensing: a patent owner approaches an alleged infringer of a patent, seeking to enforce a licence
for royalties. in most situations such alleged infringement cases are settled out of court
• Strategic/blockage: a patent owner approaches an alleged infringer seeking to block their use of a
technology in a market. This type of litigation tends to occur between competitors in an industry.
Though this study did not set out to map litigation activity across the six low-carbon energy sectors, it became
clear through the research on patent analysis that there had been a number of high-profile patent litigations in
the wind and solar PV sectors, driven by aggressive corporate iP strategies. For instance, Germany’s Enercon
was involved in several lawsuits as well as a broader cross-licensing agreement with industry-leader GE. in
1997 Zond Energy Systems won a lawsuit against Enercon through the US international Trade Commission
after having alleged patent infringement relating to its gear transmission system. The iTC ruled in Zond’s favour,
and ruled Enercon could not sell its products into the US market until the expiry of the patent in question in
2010. Subsequently Zond Energy was bought by Enron. After the collapse of Enron in 2001, GE bought its
wind-generation assets. in the mid-2000s GE and Enercon entered a cross-licensing agreement that provided
Enercon with enhanced access to the US market.
Meanwhile, Enercon began to assert its iP position vigorously on an international basis: in 2005 it brought
a lawsuit in Germany against Vestas, alleging infringement of its lightning protection for blades (which was
ejected by the Federal Constitutional Court in 2007). it brought another case against Vestas in 2006, this time
in the United Kingdom, alleging infringement of a patent related to grid transmission systems (which Vestas
won in 2007). Other cases had been filed in the netherlands, ireland and Canada. The dispute was finally
settled out of court in november 2008 under undisclosed conditions.a
Another case involves GE, which in June 2009 called on the iTC to block Mitsubishi turbine imports. The iTC
rule in favour of GE in August 2009 (and the case is currently subject to review).b
As the solar PV sector matures, the amount of patent-related litigation has also increased. For instance,
the United States’ nanosys is a producer of nanotech quantum dots, which are used in lighting, solar
power and electronic display systems. in July 2009 it settled a patent infringement lawsuit against nanoco
Technologies ltd of the United Kingdom. The lawsuit claimed that the nanoco’s quantum dot technology
infringed upon five seminal quantum dot patents held by nanosys. in the settlement, nanoco agreed to
terminate its current US business for its core-shell quantum dots. Those quantum dots were distributed in
the US by Sigma-Aldrich under the name lumidots. in the settlement, nanoco did not admit that the asserted
patents were either infringed or valid, and the additional terms of the settlement were not disclosed. Jason
Hartlove, chief executive officer of nanosys, said: ‘By enforcing ownership of our intellectually property, the
manufacturers remain the real winners in having access to proven, trusted advanced material architecture.’c
As well as direct involvement in projects, some Californian CSP manufacturers have recently engaged in
licensing deals including agreements within the US and overseas.d The enforcement of licensing business
models frequently depends on a credible capability to enforce a patent portfolio. There is therefore a possibility

www.chathamhouse.org.uk
55
4.3 Capitalizing on the global market
As the analysis in this chapter shows, it has taken several decades before some of the energy technologies under scrutiny became diffused and adopted worldwide. To have a realistic chance of meeting climate mitigation ambitions, the time for clean technologies to diffuse globally must be halved by 2025.
In a global market the cost of technological deploy-ment can come down fast through economies of scale. To harness the potential of the global market, cross-border trade and investment in low carbon and energy-efficient goods, services and technologies need to be encouraged and scaled up. Stimulating low carbon trade will create virtuous cycles, providing further investment opportu-nities and expanding the market for key technologies. There is also a need for targeted policies to encourage technological uptake at the fastest possible rates. This would involve strengthening linkages and cooperation between institutions and companies from developing and developed economies.
Since the 1970s, the costs of energy production from all technologies have fallen systematically through inno-
vation and economies of scale in manufacture and use (apart from nuclear power). Technologies such as solar energy and offshore wind all show much scope for further innovation and cost-reduction.6 The same is true for energy efficiency. For example, adoption of ‘ultra-supercritical’ technology and building many identical power plants means now it costs a third less to build an ultra-supercritical power plant in China than a less efficient coal-fired station in the United States.7
The scale of China’s domestic market and its speciali-zation as a supplier of consumer and industrial goods to international markets puts it in a unique position to bring new, clean energy technologies to maturity. This is also consistent with its strategic aspirations for an inno-vation-based economy. Patent analysis demonstrates that as energy technologies mature, advances in design, site selection and operation increasingly depend on innovation in information and communication systems.
Many of them are also dependent on innovation in advanced materials like alloys. Countries like India and South Africa are therefore in strong positions to capi-talize on the growth opportunities as these technology systems evolve.
of increased litigation rates in the CSP space as the different technology systems enter into commercial
exploitation.
Currently patent infringement litigation in the energy sector is predominantly a US and EU affair. Yet through
increased deployment in emerging markets, export strategies and maturing iP systems make it likely that patent
litigation will affect emerging-market companies. in a way it is a sign of success for which there are precedents
in the semiconductor industry. When Samsung first entered the US market it was successfully sued for patent
infringement by Texas instruments, forcing it to enter a cross-licensing agreement. Yet Samsung is now one of
the top three leaders in the semiconductor industry.
nevertheless, the higher level of public policy interest and participation in the energy industry may make
patent litigation in this space more controversial, especially if it results in delays in the deployment of key
energy technologies.
Understanding Technology Diffusion
a Forbes (2007), Vestas wins Enercon patent infringement case, 25 May, http://www.forbes.com/feeds/afx/2007/05/25/afx3758873.html; Vestas
(2007), Status on lightning protection patent dispute with Enercon GmbH, Aloys Wobben, 25 May, http://www.vestas.com/files/Filer/En/investor/
Company_announcements/2007/070525MFKUK23.pdf.
b Bloomberg (2009), ‘GE wins ruling in bid to Mitsubishi turbines’, 7 August, http://www.bloomberg.com/apps/news?pid=20601103&sid=aGu_
ronQwMKU.
c reuters (2009), ‘nanosys reaches Settlement of Patent infringement lawsuit Against nanoco Technologies for Quantum Dot Technology’, 23 July
2009, http://www.reuters.com/article/pressrelease/idUS165155+23-Jul-2009+BW20090723.
d For a recent example see laMonica, Martin (2009), ‘eSolar Plugs Solar Plant into California Grid’, Green Tech, 4 August, http://news.cnet.
com/8301-11128_3-10302824-54.html?tag=mncol;title.

www.chathamhouse.org.uk
56
Adopting advanced technologies – and developing inno-vation capabilities – would present developing economies with an opportunity to leapfrog the process of resource-intensive, highly polluting growth experienced by Western countries. There is global benefit in ensuring that climate and technology policies would support such a shift.
notes1 See http://www.energyefficiencynews.com/power-
generation/i/2290/, or for instance the wind tunnel being developed by the University of Texas under a Department of Energy grant for blades up to 100m.
2 iliev, i. (2005), Pre-Paid Metering Technology – Systemic
Innovation in the South African Energy Sector, Resource-based Technology Innovation in South Africa, HSrC, October, http://www.hsrc.ac.za/research/output/outputDocuments/4251_iliev_Prepaidmeteringtechnology.pdf.
3 DuPont (2007), Biofuels Processing, http://www2.dupont.com/renewably_Sourced_Materials/en_US/proc-biofuels.html.
4 The data coverage could be enhanced by combining patent data with journal article information (where academics co-author a journal article with their corporate collaborators), and using commercial licensing databases.
5 Saxenian, Annalee (2002), Local and Global Networks of Immigrant Professionals in Silicon Valley, Public Policy institute of California.
6 Anderson, Dennis (2006), Costs and Finance of Abating Carbon Emissions in the Energy Sector, paper commissioned by the Stern review.
7 New York Times (2009), ‘China Outpaces U.S. in Cleaner Coal-Fired Plants’, 10 May.

www.chathamhouse.org.uk
57
5. Policy implications
As pressure for the low carbon transition mounts, invest-ment in low carbon goods and services will continue to accelerate. Economies that are run with high levels of efficiency (and which are less exposed to the volatility of the fossil fuel markets) are at a competitive advantage, and consequently companies and governments that are moving fastest on low carbon transition will reap the rewards. This is a twofold strategy, one which relies on implementing best available technologies and practices while simultaneously developing the next generation of technologies.
It is fair that developed countries should take the lead in cutting carbon emissions, as they account for over three-quarters of historical emissions, and far more on a current per capita basis. But emissions are now so distributed that any single subset of countries is not going to solve the global problem by itself, even including the richest economies that currently enjoy technological leadership in the energy sectors. The bulk of future emissions growth will come from rapidly industrializing countries such as China and India. The European Commission stated in a Communication in January 2009 that to keep to a 2°C global rise, developing countries as a group would need to reduce emissions by 15 to 30 per cent below business-as-usual projections by 2020.1 It is critical that the best available technologies are deployed across the globe at the fastest rate possible.
5.1 Business-as-usual is not an option
This report has described patent ownership trends in six areas of energy technology where step changes in the pace
and scale of innovation are needed to meet ambitious climate goals. It has also analysed the rate of market adoption of key technologies, exploring the linkages between the micro-dimensions of technological develop-ment (individual inventors, technologies and organiza-tions) and the macro picture of relative national strengths in specific energy sectors and subsectors.
With climate change posing new security threats to all, finding technological solutions is a shared dilemma. The findings of this report confirm that the diffusion of energy technologies takes too long under business-as-usual practices. Chapters 2 and 3 showed that many key inventions in the energy sectors took two to three decades to reach the market. Looking within the six sectors, the top 30 patents most cited by follow-up inventors are, on average, more than 24 years old.
More encouraging is evidence that policy interven-tions to spur demonstration and deployment – learning-by-doing – can be a major accelerator of the innovation process. Patenting rates and deployment in wind, solar PV and CSP (a robust proxy for innovative activities) took off from the late 1990s, driven by policy interventions to create market demand in key countries such as Germany, Japan and the United States.
Much has been made of the fast growth in innova-tion capacities in emerging economies such as Brazil, China and India. Companies or organizations from these economies do not currently feature in the top 10 positions in any sectoral and subsectoral analysis, though some do appear in the top 20, indicating their growing capacities. This means that OECD countries can determine the pace of diffusion of advanced technologies for some time to come.
Concentration of patent ownership is not synonymous with blockage or monopolistic behaviour, but IP can be an important factor in determining the speed of technological demonstration and diffusion. A patent portfolio is a currency – for attracting venture capital, entry into strategic alliances, protection against litigation, as well as opening opportunities for mergers and acquisitions. Company strategies will vary owing to differences in industry composition, level of competition, stages of development, and market structure of specific energy systems.

www.chathamhouse.org.uk
Who Owns Our low Carbon Future?
58
Policy implications
Many of the energy patents owners listed in this report are established industrial giants. Their perceptions of market conditions and level of IP protection in developing economies will be decisive in the roll-out of the next generation of low carbon technologies – whether through investment, licensing, joint ventures or other forms of knowledge-sharing. One worrying trend is the increase in patent-related litigations in fast-maturing technologies. A litigation culture is unlikely to be consistent with rapid diffusion of technologies.
A serious shortage of data in the public domain on collaborative and licensing activities, including patent pools and cross-licensing, inhibits our understanding of technological development. This scarcity of information is due in part to the absence of uniform reporting require-ments, but also to the confidential and strategic nature of many such collaborations. These activities are often an opaque part of the companies’ economic activities.
Jointly assigned patents provide proxy measures to analyse collaboration in innovation. These suggest that most collaboration resulting in joint patents is conducted by institutions or companies within the same national jurisdiction. There is some collaboration among OECD countries, but very little between developed- and devel-oping-economy companies and institutions.
Transformative change cannot be achieved through domestic action alone. To drive global decarbonization, many different kinds of economic, physical and innova-tion linkages need to be strengthened among all industrial sectors, especially those between developed and devel-oping economies. Coordinated action is not just optimal but critical. Without a clear understanding of the range of technological options available across different sectors, and how different technological systems interface with each other, policy-makers will struggle when making crucial choices about national or local industrial develop-ment strategies and investments.
The findings of this study suggest that implementing technology neutrality in the energy system is difficult given the overlap of technology systems and the different stages of technological development in the six energy spaces. The types of investments or technologies that are most likely to take off in the coming decade are already predetermined,
to some extent, by existing industrial structures, research capabilities and other supporting infrastructure. Proactive policy-makers working at the interface of innovation and climate change mitigation therefore face a complex challenge in monitoring technological and commercial developments across a wide range of technological fields.
In designing global solutions it will be necessary to strike a careful balance between private interests and the delivery of global public goods, and to take into account the social and economic needs of developing countries. New incentive systems and collaborative mechanisms at bilateral, regional and international levels are going to be essential to encourage technological innovation, demon-stration and diffusion.
5.2 Building a global low carbon industrial future
Sticking to what we know, and already do, will not bring these technologies to markets fast enough. It is therefore critical for all actors to move beyond business-as-usual assumptions and practices. There is a mismatch between the urgency of climate challenges, as set out by the Intergovernmental Panel on Climate Change (IPCC), and the time taken for a technology system to evolve under normal circumstances. This does not mean that global action should focus only on diffusing existing, ready-to-market technologies. We also need to invest in new tech-nological options as well as in the market and public insti-tutions to deliver them. Of course, not all potential tech-nological solutions will succeed. To ensure the delivery of climate outcomes, providing the space to deal with failures is part of a sensible risk management approach.
5.2.1 Monitoring technological diffusion
As this study shows, our low carbon future is determined not only by energy-sector R&D investments but also by learning and adaptation from the other major industrial sectors of today. It is inconceivable that any one govern-ment, or a small group of companies, can deliver all the solutions to their national climate challenge alone. So there is a need to adopt a genuinely collaborative approach to

www.chathamhouse.org.uk
59
technological development – one that does not only favour incumbents but also encourages new entrants. The Electric Power Research Institute (EPRI), which pools the research capacities of US utility firms, illustrates the value of coop-eration in an industry where no one actor has sufficient capacity of its own. As suggested in Chapter 4, there are many examples from Japan where competing companies are engaged in joint research and development.
Given the increasing interest in clean energy technologies and generally expanding research budgets across the globe, there are significant opportunities to accelerate bilateral and multilateral collaboration on R&D and technology develop-ment. The analysis suggests the following priorities:
Invest in information sharing and transparency. While there is no global appetite for setting up new international organizations, governments can establish channels for sharing information and knowledge among companies, universities and other relevant organizations. As discussed in Chapter 4, very few data on licensing deals and cross-licensing initiatives are available in the public domain. This not only impedes research on technological diffusion in a global marketplace but also imposes huge market-information barriers for new entrants – whether companies seeking to purchase the best available tech-nologies or universities looking for the next generation of applied R&D research. Efforts are under way at the European level to adapt patent classification to give greater visibility to climate-friendly technologies. This could form of the basis of a change in global patent classification that would improve transparency.
Set up a global database on licensing data and best practices. The development of a reliable patent licensing database could support the establishment of benchmarks and determination of best practice in patent licensing nego-tiations between private-sector players or in public-private partnerships. Given that many of these data are confidential, there may be a role for an escrow service from a trusted third party in which private-sector data are pooled and shared on an anonymous basis with the marketplace.
Better still would be for an institution, such as the World Intellectual Property Organization (WIPO), to set up global databases on licensing and cross-licensing regimes as well as patent pools on climate-friendly technologies.
WIPO and/or other patenting authorities should request patent owners to register their licensing deals within a specified time period such as 24 months to protect their latest commercial interests (on a voluntary basis). Only with more available information can best practices – whether in the energy sector or beyond – in innovation and diffusion of climate-friendly technologies be shared in a way that encourages innovation and respects the rights of patent holders. Companies and organizations could also make use of this facility to showcase their latest inventions available for licensing.
Invest in sectoral mapping. Existing efforts by WIPO, such as geographic patent mapping, should also be extended to cover sectoral mapping of the sort conducted in this research, which would help inform governments, companies and other key stakeholder groups. This report only covers six sectors. The analysis could be expanded to cover many more low carbon and climate-friendly sectors.
5.2.2 Supporting technological innovation and diffusion
in developing economies
The building of national champions should not take precedence over reducing the global carbon footprint. Greater incentives are needed to help ensure that collabo-ration across national boundaries is accelerated without requiring national priorities to take second place, which is not politically sustainable. National innovation and technology investments are often used as an extension of national industrial policy. The desire to cultivate national champions is commonplace for rich and poor countries alike. Industrial policy reflects this through directing subsidies and tax credits towards a few leading firms. This is at odds with the reality of the global market.
Ultimately, the bulk of decarbonization needed in devel-oping economies will be delivered by their own businesses and institutions. Adopting advanced technologies – and devel-oping indigenous innovation capabilities – would present developing economies with an opportunity to leapfrog the process of resource-intensive, highly polluting growth expe-rienced by Western countries. The scale of China’s domestic market and its position as a supplier of consumer and industrial goods to international markets puts it in a unique position to bring new, clean energy technologies to maturity.
Policy implications

www.chathamhouse.org.uk
Who Owns Our low Carbon Future?
60
Patent analysis demonstrates that as energy technologies mature, advances in design, site selection and operation increasingly depend on innovation in information and communication systems. This puts India in a strong position to capitalize on the growth opportunities as these technology systems evolve. Developing economies can greatly benefit from shifts in global investment patterns towards low carbon energy and production methods in developing countries. There is mutual global benefit in ensuring that climate policies would support such a shift.
The patent analysis also helps in identifying the location of specific and scarce technological capabilities in devel-oping economies. Such information and analysis can be used to inform the development of industrial policies that aim to expand absorptive and indigenous innova-tion capacities in developing countries. Extending this approach to other industrial sectors will enable the devel-opment of country-specific low carbon technological transition paths that best serve national and collective interest as well as delivering long-term economic growth. This may be of particular importance in the post-Copen-hagen world, if some of the support/mitigation funds and technology transfer programmes being discussed come into being.
To harness the potential of the global market, cross-border trade and investment in low-carbon and energy-efficient goods, services and technologies need to be encouraged and scaled up. Stimulating low carbon trade will create virtuous cycles, creating further investment opportunities and expanding the market for key technolo-gies. There is also a need for targeted policies to encourage technological uptake at the fastest possible rates. This would involve strengthening linkages and cooperation between institutions and companies from developing and developed economies.
5.2.3 Collaboration, collaboration, collaboration
Public funding for climate-friendly research and devel-opment, financial support for incubation facilities and demonstration projects can be made conditional on some form of knowledge-sharing agreement that will be designed on the basis of sectoral needs. These could take the form of the following:
Cooperative R&D. Government support for clean energy innovation is more likely to be effective at the early stages of the development of technology systems, before particular standards or industry value-chains become embedded in national economies and the global indus-trial system. Research partnerships are also more likely to succeed if the technology is at an early, ‘pre-competitive’ stage. As shown in this study, cross-border R&D coop-eration between OECD and non-OECD countries in the energy sector is very small. Given the importance of emerging economies in meeting global climate goals, governments should support the development of ‘model’ technology cooperation agreements that take into account different levels of development and different jurisdictional requirements that would limit the potential of patent-related conflicts and encourage joint development. This approach has been used in the pre-competitive research in the semiconductor field. National laboratories could be twinned, or new ones could be set up that are multilaterally managed and funded in pursuit of agreed key, long-term technology objectives, ideally with industry participation.
Publicly backed patent pools and cross-licensing. Through tax, other fiscal or investment incentives, the public sector should support the design and creation of patent pools and cross-licensing schemes to encourage innovation and mass diffusion for relevant technologies. These patent pools can be used to support SMEs and emerging markets innovation in exchange for a royalty fee (similar to the way technology standards manage-ment bodies such as ETSI work). There are also likely to be SMEs and individual inventors owning IP that is underused; they will benefit from pooling patents in a fast technological growth area.
Setting up knowledge-sharing platforms. Collaborative initiatives such as the European Commission’s European Technology Platform for Zero Emissions Fossil Fuel Power Plants (ZEP) demonstrate the potential of stakeholder advice platforms, and can provide support for knowledge-sharing structures at the regional level (in this case the EU). These kinds of initiatives could be emulated in other regions or used as a starting point for multilateral efforts.
Supporting open innovation mechanisms. More climate technology prizes can be established at the global level to
Policy implications

www.chathamhouse.org.uk
61
promote innovation in all areas that support climate mitigation and adaptation. This fund could function as a patent pool and/or a repository for the cross-licensing of technologies. Other forms of open innovation platforms should be developed to strengthen incentive structures for innovation and knowledge-sharing.
5.2.4 Transforming the global low-carbon marketplace
For the innovation and diffusion infrastructure to improve, it is critical for governments to adopt core energy policy that is supportive of low carbon solutions. Good climate-friendly energy policies and smart innovation policies are necessary ingredients for success, but neither is sufficient alone. In addition, to create markets for climate solutions, governments should invest in:
Expanding markets for near-to-market technologies. At the global level, the Copenhagen Summit must send unmistakable signals to global markets that change is imminent and inevitable. At the national – or more micro – level, the development of joint venture companies, cross-training programmes, cross-licensing arrangements, trade tariff exemptions on selected technologies and joint manu-facturing programmes are all tried and tested methods that could be stepped up.
Global demonstration programmes are required for large-scale, high-risk technologies such as CCS and CSP. The size and complexity of demonstrating these tech-nologies, which often includes complex planning and infrastructural support , make it difficult for the private sector to independently finance demonstration. Public funding in the form of grants, loans and risk guarantees
is therefore necessary to ensure these technologies can become fully commercial. One international pilot project, the International Thermonuclear Experimental Reactor (ITER), provides an example of such a global collaborative programme. This joint research project was first proposed in 1985 but an agreement on the establishment of the research facility, to be based in France, was only reached in 2005. The ITER consortium now comprises seven parties – Russia, the United States, EU, Japan, China, Korea and India. Key plant components will be provided to the ITER organization through in-kind contributions from the seven members. Each member has set up a domestic agency, employing staff to manage procurements for its in-kind contributions. Members of the ITER consortium have agreed to share every aspect of the project – science, procurements, finance and staffing – with the aim that in the long run each member will have the know-how to produce its own fusion energy
Maximizing the potential of technology standards bodies. Technology standards can play an important role in accelerating innovation in an industry by removing bottle-necks around an industry and encouraging economies of scale. This report demonstrates the value of maintaining ongoing maps of potential technology standard hotspots, including the patents that underpin them. There is scope for formation of industry-level technology standards bodies to set increasingly high standards, bring in the laggards and accelerate diffusion.
notes1 EC Communication, ‘Towards a Comprehensive Climate Change
Agreement in Copenhagen’, January 2009, SEC 2009 (101).
Policy implications

www.chathamhouse.org.uk
62
Appendix: Methodology for Patent landscaping
Below is a description of the key steps undertaken in the patent landscaping for each of the six technology spaces:
1 Defining research questions: Chatham House, in consultation with Climate Strategies, the International Institute for Sustainable Development and CambridgeIP, defined the terms of reference and research questions for the project.
2 Interviews with academic and industry experts and desktop research: On the basis of interviews, desktop research, and reading of selected patents, CambridgeIP identified different technology subsys-tems, or subsectors, for each industry field. The combined information was used to develop a patent search strategy for each of the six selected energy technology spaces.
3 Search algorithm and patent dataset creation: A combination of Boolean search algorithms,1 targeted IPC-based searches2 and assignee-focused searches was used to compile the patent dataset from publicly available sources. Search algorithms were developed by CambridgeIP for each technology subsystem, as well as a broader search algorithm (to include other emerging inventions not identified by the experts). Searches were performed for Title, Abstract and Claims across all available patent databases. This methodology did not solely rely on International Patent Classification (IPC) codes. Even in a highly specific IPC it is difficult to distinguish between different technology systems
and components. Using a semi-automated method, patent subsets focused on technology subsystems were developed. The boundaries of the resulting patent datasets reflect actual industry boundaries.
4 Patent database sources: The patent searches were conducted in the first quarter of 2009. A combination of ThomsonReuters and publicly available patent database services was used. The country and time coverage of the underlying patent databases is listed in the table below.
5 Technology subsystem definition: For each tech-nology subsystem sets of technology descriptors most likely to be used by patents within the subsectors were developed. These were fed through CambridgeIP’s patent ranking to generate a patent dataset repre-sentative of the subsector.
6 Filtering and quality control steps: A number of quality control steps were conducted including removal of false positives from the dataset, and benchmarking of the dataset results against initial datapoints. Data cleaning for names of assignees was undertaken, improving the accuracy of findings regarding the number of patents associated with companies, universities and other organizations.
7 Value added database: Using the patent datasets created, Chatham House and CambridgeIP extracted
Appendix
Patent datasets used
inPADOC* 1968–present
US (Granted) 1971–present
US (Applications) March 2001–present
European (Granted) 1980–present
European (Applications) 1979–present
WiPO PCT Publications 1978–present
Abstracts of Japan October 1976–present
German (Granted) 1968–present
German (Applications) 1968–present
* Patent family documents from 71 patent offices worldwide and
legal status information from 42 patent offices worldwide.

www.chathamhouse.org.uk
63
lists of organizations active in each space. A follow-on analysis across all organizations with more than four patents was conducted. Searches were performed across publicly available website sources across various areas including company location, company ownership type, recent M&A or investment activity, strategic alliances, licensing activities, public-sector grant support and other factors.
8 Analysis: Analysis of the patent data was conducted by researchers at Chatham House and CambridgeIP. Some of the data analysis was performed through CambridgeIP’s RedEye proprietary software for patent analytics.
Project limitations
To our knowledge, this is as yet the most extensive and thorough patent mapping effort for the six technologies in the public domain. But a number of challenges raised by this approach are not examined fully in the report owing to resource constraints or other factors. These include:
Lag in patent publications: There is a lag of up to eighteen months in the publication of patent data by various patent offices. In a fast-moving field there may be rapid changes.
Language: The searches were performed in English. This should capture the vast majority of commercially relevant patents and patent families, at least from their entry into the PCT system. However, owing to language differences a number of patents in the national phase are likely to have been missed.
M&A and company identity: Despite our best efforts in ensuring the harmonization of assignee names, the energy industry is undergoing continuous M&A activities. Following an acquisition, the patent names are frequently not reassigned.
Technology space definitions: The process of tech-nology space definition was thorough and combined multiple approaches. Yet in selected fields some relevant technologies may have been missed. In addition, the boundaries of the technology spaces shift over time, so some radical areas of innovation may be missing from this study.
Technology subsystems: The list of systems and compo-nents is not exhaustive, but it demonstrates differences and commonalities between the most important system components. However, there are likely to be important areas that we have not identified.
Licensing data: Analysis on licensing used publicly available sources, including press releases and news items, as well as patent co-assignments. This methodology had limited success in identifying specific licensing deals.
Relevance of patents: We have approached the field in a top-down fashion, and have been able to identify key players on the basis of total numbers of patents. However, in many industries the most critical barriers for IP ownership are focused around only a small number of patent families. Consequently, in practice companies with smaller patent portfolios may on occasion play a more significant role than suggested by our patent rankings.
Patents issued in India: Only a limited amount of infor-mation is available electronically. We expect that this may have resulted in an underestimation of Indian innovation in some of the focus areas.
notes1 Boolean search algorithms are the most widely used patent search
method. To demonstrate, a very simple search for wind turbine patents
would be something like: (wind energy) or (wind turbine) or (wind and
electricity). The patent searches we employed frequently use hundreds of
technology descriptors.
2 iPC-based searches use patent examiner assigned international Patent
Classification (iPC) codes as a way of limiting the space. We see
iPC-based searches as insufficient on their own, but as a valuable
complement to Boolean searches.
Appendix

Chatham House, 10 St James’s Square, London SW1Y 4LET: +44 (0)20 7957 5700 E: [email protected]: +44 (0)20 7957 5710 www.chathamhouse.org.uk
Charity Registration Number: 208223
Who Owns OurLow Carbon Future?Intellectual Propertyand Energy Technologies
A Chatham House Report
Bernice Lee, Ilian Iliev and Felix Preston
www.chathamhouse.org.uk
Who
Ow
nsO
urLow
Carbon
Future?B
erniceLee
etal.
0322247818629
ISBN 9781862032224