Embed Size (px)
Citation preview
Booz & Company October 25, 2011
Why Culture is Key The 2011 Global Innovation 1000

2011 Innovation 1000 - Slides for press.pptx Booz & Company
2010 Innovation 1000 Demographics Analysis
Innovation Culture Summary
1

2011 Innovation 1000 - Slides for press.pptx Booz & Company
In 2010, total Global R&D was ~ $1.15 Trillion - the Innovation 1000 represent $550 Billion nearly 50% of it
2
Share of Global R&D Spend (2010)
Total ~ $1,150Bn Our study captures ~48% of total Global R&D
1) Innovation 2000 spend for Innovation 2010 companies ranked 1001–2000. Innovation 2000 spend increased slightly from 2009 global spend (2010 Innovation study)
2) Incremental corporate spend calculated using 2.1% growth rate. Growth calculated using companies ranked 1001–2000 for 2010 Innovation 1000 and 2010 Innovation 1000
3) Government/Other R&D spend calculated using Government spend in 2008 and 2009 Innovation 1000 studies; Global 2011 R&D Estimate, R&D Magazine December 2010.
Source: Booz & Company analysis
40.6%
8.2%
Government/
Other R&D Spend 3)
Incremental
Corporate Spend 2) Innovation
2000 1)
3.3%
Innovation
1000 47.8%
The Innovation
1000 companies
spent $550Bn in
R&D in 2010
2011 Innovation 1000 - Slides for press.pptx Booz & Company
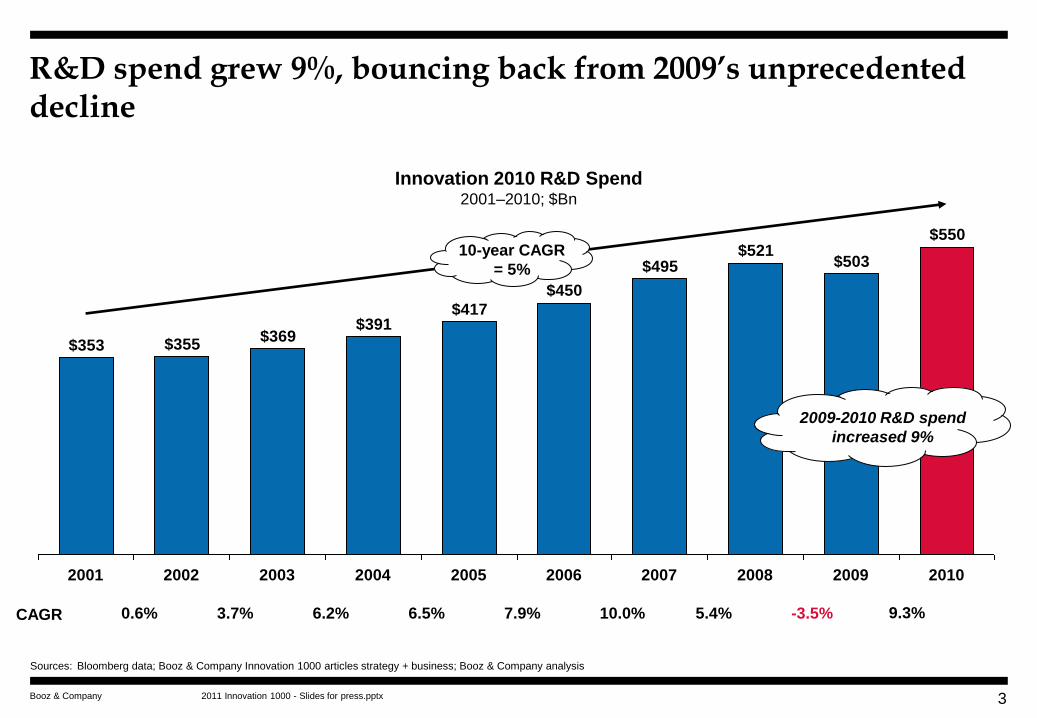
R&D spend grew 9%, bouncing back from 2009’s unprecedented decline
Sources: Bloomberg data; Booz & Company Innovation 1000 articles strategy + business; Booz & Company analysis
Innovation 2010 R&D Spend
2001–2010; $Bn
$550
$503$521
$495
$450
$417$391
$369$355$353
2010 2009 2008 2007 2006 2005 2004 2003 2002 2001
5%
CAGR 0.6% 6.5% 7.9% 10.0%
10-year CAGR
= 5%
2009-2010 R&D spend
increased 9%
3.7% 6.2% 5.4% -3.5% 9.3%
3
2011 Innovation 1000 - Slides for press.pptx Booz & Company
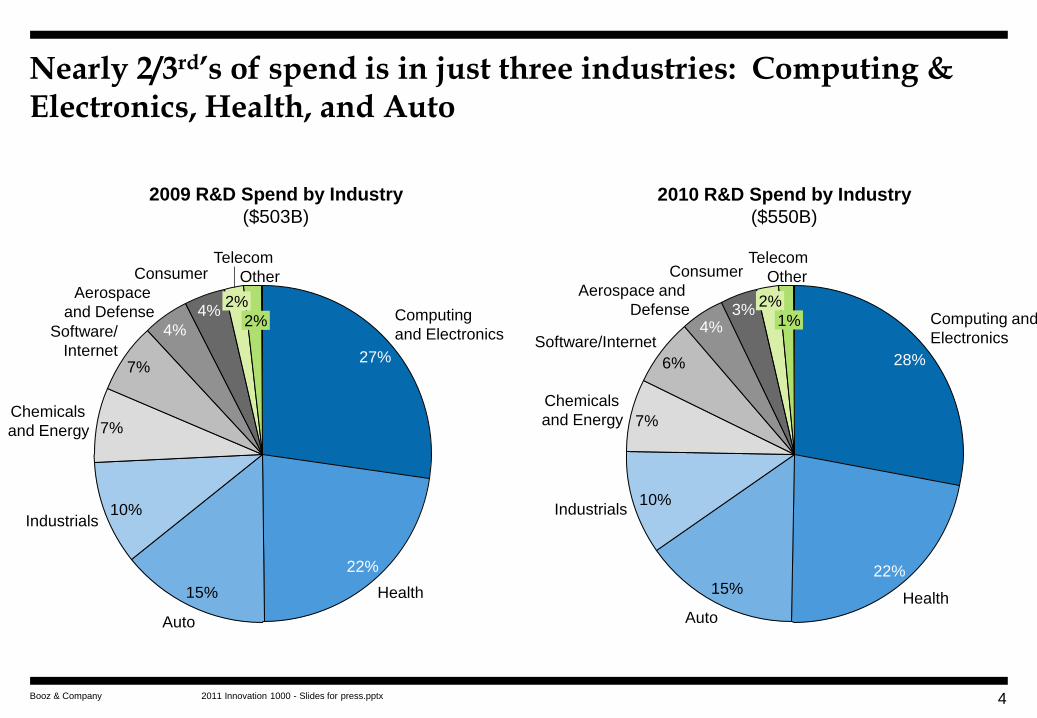
Nearly 2/3rd’s of spend is in just three industries: Computing & Electronics, Health, and Auto
4
7%
7%
10%
15%
22%
Computing
and Electronics
27%
4% Software/
Internet
Chemicals
and Energy
Other
2%
Industrials
Auto
Health
Telecom
2%
Consumer
4% Aerospace
and Defense
2010 R&D Spend by Industry
($550B)
6%
7%
10%
15%
Industrials
Auto
Health
Other
1%
Telecom
2%
Consumer
3%
Aerospace and
Defense
22%
Computing and
Electronics
28%
4% Software/Internet
Chemicals
and Energy
2009 R&D Spend by Industry
($503B)
2011 Innovation 1000 - Slides for press.pptx Booz & Company
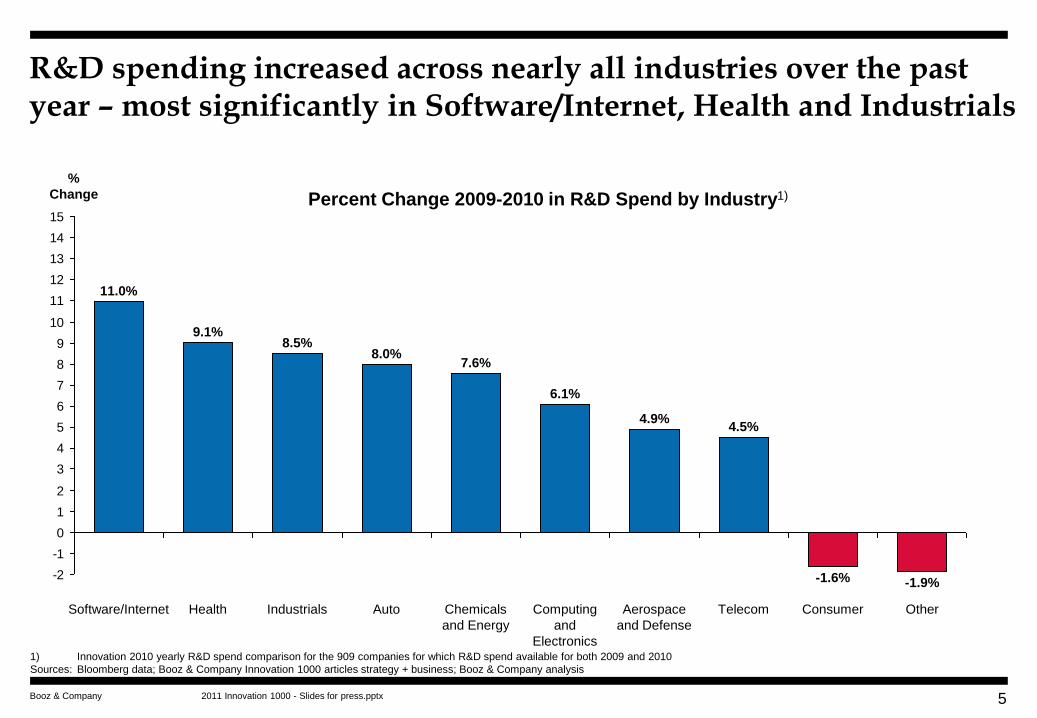
R&D spending increased across nearly all industries over the past year – most significantly in Software/Internet, Health and Industrials
-2
-1
0
1
2
3
4
5
6
7
8
9
10
11
12
13
14
15
%
Change
Other
-1.9%
Telecom
4.5%
Aerospace
and Defense
4.9%
-1.6%
Computing
and
Electronics
6.1%
Chemicals
and Energy
7.6%
Auto
8.0%
Industrials
8.5%
Health
9.1%
Software/Internet
11.0%
Consumer
Percent Change 2009-2010 in R&D Spend by Industry1)
5
1) Innovation 2010 yearly R&D spend comparison for the 909 companies for which R&D spend available for both 2009 and 2010
Sources: Bloomberg data; Booz & Company Innovation 1000 articles strategy + business; Booz & Company analysis
2011 Innovation 1000 - Slides for press.pptx Booz & Company
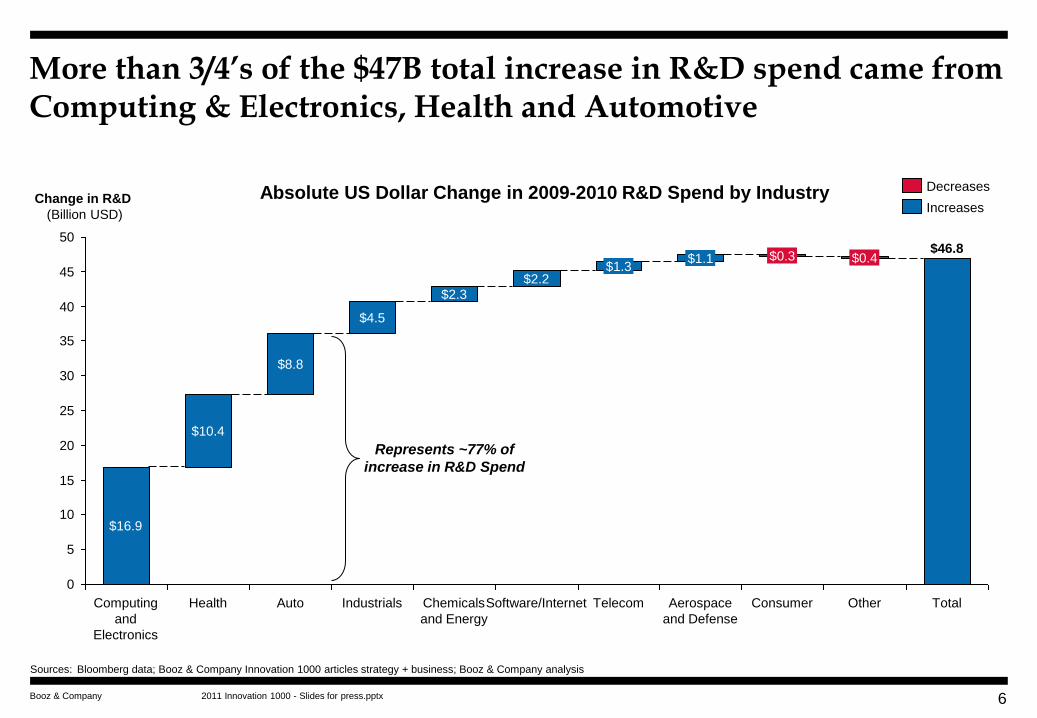
More than 3/4’s of the $47B total increase in R&D spend came from Computing & Electronics, Health and Automotive
35
30
25
20
15
10
5
0
Total
$46.8
Other
$0.4
Consumer
$0.3
Aerospace
and Defense
$1.1
Telecom
$1.3
Software/Internet
$2.2
Chemicals
and Energy
$2.3
Industrials
Change in R&D
(Billion USD)
50
45
40 $4.5
Auto
$8.8
Health
$10.4
Computing
and
Electronics
$16.9
Increases
Decreases Absolute US Dollar Change in 2009-2010 R&D Spend by Industry
Represents ~77% of
increase in R&D Spend
6
Sources: Bloomberg data; Booz & Company Innovation 1000 articles strategy + business; Booz & Company analysis

2011 Innovation 1000 - Slides for press.pptx Booz & Company
R&D expenditures increased at the majority of Innovation 1000 companies – a significant reversal from last year
2008-2009 Change in R&D Spend
52%
41% Increase
7%
Flat
Decrease
25%
68%
Increase
7%
Flat
Decrease
2009-2010 Change in R&D Spend1)
1) Innovation 2011 yearly R&D spend comparison for the 909 companies for which R&D spend available for both 2009 and 2010
Sources: Bloomberg data; Booz & Company Innovation 1000 articles strategy + business; Booz & Company analysis
7
2011 Innovation 1000 - Slides for press.pptx Booz & Company 8
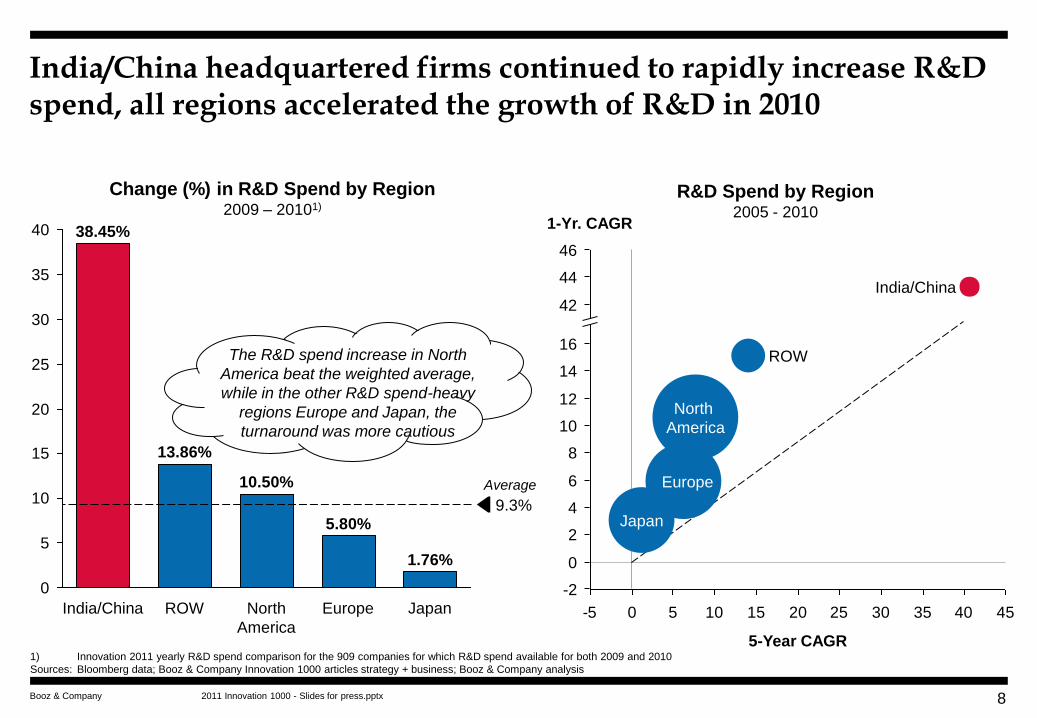
India/China headquartered firms continued to rapidly increase R&D spend, all regions accelerated the growth of R&D in 2010
-5 0 5 10 15 20 25 30 35 40 45
1-Yr. CAGR
46
16
14
12
10
8
6
4
2
0
-2
5-Year CAGR
ROW
North
America
Japan
India/China
Europe
44
42
0
5
10
15
20
25
30
35
40
9.3%
Japan
1.76%
Europe
5.80%
North
America
10.50%
ROW
13.86%
India/China
38.45%
Change (%) in R&D Spend by Region 2009 – 20101)
R&D Spend by Region 2005 - 2010
1) Innovation 2011 yearly R&D spend comparison for the 909 companies for which R&D spend available for both 2009 and 2010
Sources: Bloomberg data; Booz & Company Innovation 1000 articles strategy + business; Booz & Company analysis
Average
The R&D spend increase in North
America beat the weighted average,
while in the other R&D spend-heavy
regions Europe and Japan, the
turnaround was more cautious
2011 Innovation 1000 - Slides for press.pptx Booz & Company
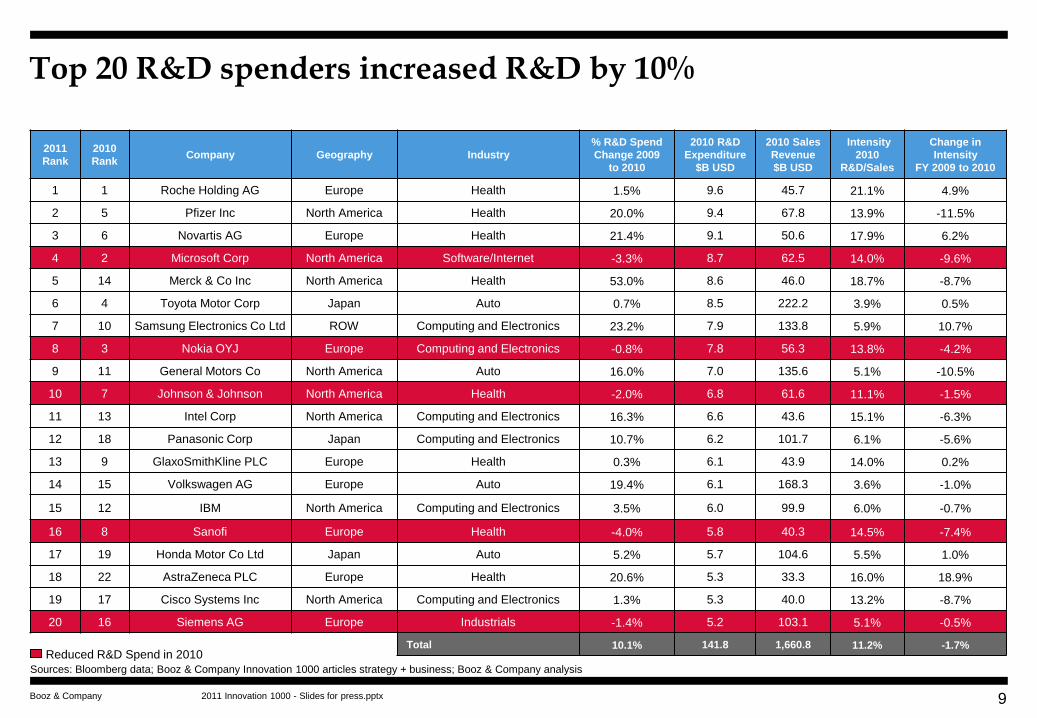
Top 20 R&D spenders increased R&D by 10%
2011
Rank
2010
Rank Company Geography Industry
% R&D Spend
Change 2009
to 2010
2010 R&D
Expenditure
$B USD
2010 Sales
Revenue
$B USD
Intensity
2010
R&D/Sales
Change in
Intensity
FY 2009 to 2010
1 1 Roche Holding AG Europe Health 1.5% 9.6 45.7 21.1% 4.9%
2 5 Pfizer Inc North America Health 20.0% 9.4 67.8 13.9% -11.5%
3 6 Novartis AG Europe Health 21.4% 9.1 50.6 17.9% 6.2%
4 2 Microsoft Corp North America Software/Internet -3.3% 8.7 62.5 14.0% -9.6%
5 14 Merck & Co Inc North America Health 53.0% 8.6 46.0 18.7% -8.7%
6 4 Toyota Motor Corp Japan Auto 0.7% 8.5 222.2 3.9% 0.5%
7 10 Samsung Electronics Co Ltd ROW Computing and Electronics 23.2% 7.9 133.8 5.9% 10.7%
8 3 Nokia OYJ Europe Computing and Electronics -0.8% 7.8 56.3 13.8% -4.2%
9 11 General Motors Co North America Auto 16.0% 7.0 135.6 5.1% -10.5%
10 7 Johnson & Johnson North America Health -2.0% 6.8 61.6 11.1% -1.5%
11 13 Intel Corp North America Computing and Electronics 16.3% 6.6 43.6 15.1% -6.3%
12 18 Panasonic Corp Japan Computing and Electronics 10.7% 6.2 101.7 6.1% -5.6%
13 9 GlaxoSmithKline PLC Europe Health 0.3% 6.1 43.9 14.0% 0.2%
14 15 Volkswagen AG Europe Auto 19.4% 6.1 168.3 3.6% -1.0%
15 12 IBM North America Computing and Electronics 3.5% 6.0 99.9 6.0% -0.7%
16 8 Sanofi Europe Health -4.0% 5.8 40.3 14.5% -7.4%
17 19 Honda Motor Co Ltd Japan Auto 5.2% 5.7 104.6 5.5% 1.0%
18 22 AstraZeneca PLC Europe Health 20.6% 5.3 33.3 16.0% 18.9%
19 17 Cisco Systems Inc North America Computing and Electronics 1.3% 5.3 40.0 13.2% -8.7%
20 16 Siemens AG Europe Industrials -1.4% 5.2 103.1 5.1% -0.5%
Total 10.1% 141.8 1,660.8 11.2% -1.7% Reduced R&D Spend in 2010
Sources: Bloomberg data; Booz & Company Innovation 1000 articles strategy + business; Booz & Company analysis
9
2011 Innovation 1000 - Slides for press.pptx Booz & Company
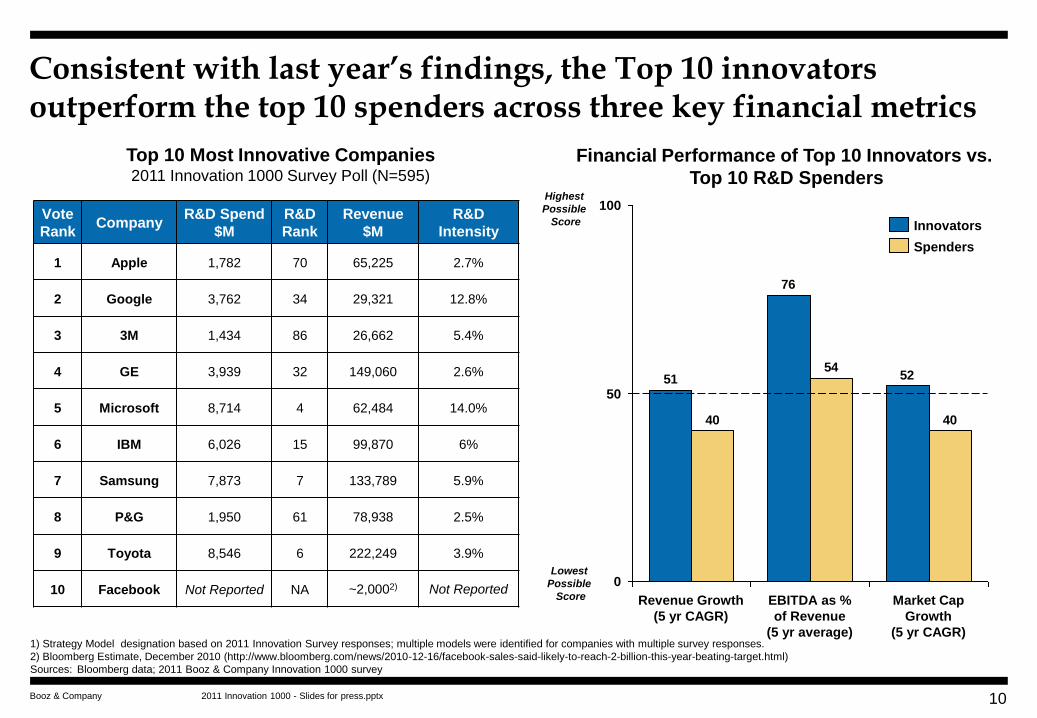
Consistent with last year’s findings, the Top 10 innovators outperform the top 10 spenders across three key financial metrics
10
Top 10 Most Innovative Companies 2011 Innovation 1000 Survey Poll (N=595)
Vote
Rank Company
R&D Spend
$M
R&D
Rank
Revenue
$M
R&D
Intensity
1 Apple 1,782 70 65,225 2.7%
2 Google 3,762 34 29,321 12.8%
3 3M 1,434 86 26,662 5.4%
4 GE 3,939 32 149,060 2.6%
5 Microsoft 8,714 4 62,484 14.0%
6 IBM 6,026 15 99,870 6%
7 Samsung 7,873 7 133,789 5.9%
8 P&G 1,950 61 78,938 2.5%
9 Toyota 8,546 6 222,249 3.9%
10 Facebook Not Reported NA ~2,0002) Not Reported
1) Strategy Model designation based on 2011 Innovation Survey responses; multiple models were identified for companies with multiple survey responses.
2) Bloomberg Estimate, December 2010 (http://www.bloomberg.com/news/2010-12-16/facebook-sales-said-likely-to-reach-2-billion-this-year-beating-target.html)
Sources: Bloomberg data; 2011 Booz & Company Innovation 1000 survey
52
76
51
40
54
40
EBITDA as %
of Revenue
(5 yr average)
100
Revenue Growth
(5 yr CAGR)
50
0
Market Cap
Growth
(5 yr CAGR)
Spenders
Innovators
Financial Performance of Top 10 Innovators vs.
Top 10 R&D Spenders Highest
Possible
Score
Lowest
Possible
Score

2011 Innovation 1000 - Slides for press.pptx Booz & Company
The 10 most innovative firms are more likely to be Need Seekers
11
Company Revenue
$M
R&D
Spend $M
R&D
Intensity
Roche
Holding 45,672 9,646 21.1%
Pfizer 67,809 9,413 13.9%
Novartis 50,624 9,070 17.9%
Microsoft 62,484 8,714 14.0%
Merck & Co 45,987 8,591 18.7%
Toyota 222,249 8,546 3.9%
Samsung 133,789 7,873 5.9%
Nokia 56,309 7,778 13.8%
General
Motors 135,592 6,962 5.1%
Johnson &
Johnson 61,587 6,844 11.1%
Top 10 Spenders on R&D 2011 Innovation 1000 (2010 Financial Data)
Top 10 Most Innovative Companies 2011 Innovation 1000 Survey Poll (N=595)
Company Revenue
$M
R&D
Spend $M
R&D
Intensity
Apple 65,225 1,782 2.7%
Google 29,321 3,762 12.8%
3M 26,662 1,434 5.4%
General
Electric 149,060 3,939 2.6%
Microsoft 62,484 8,714 14.0%
IBM 99,870 6,026 6%
Samsung 133,789 7,873 5.9%
Proctor &
Gamble 78,938 1,950 2.5%
Toyota 222,249 8,546 3.9%
Facebook ~2,0002) Not Reported Not
Reported
Companies appearing on both lists
1) Strategy Model designation based on 2011 Innovation Survey responses; multiple models were identified for companies with multiple survey responses.
2) Bloomberg Estimate, December 2010 (http://www.bloomberg.com/news/2010-12-16/facebook-sales-said-likely-to-reach-2-billion-this-year-beating-target.html)
Sources: Bloomberg data; 2011 Booz & Company Innovation 1000 survey
20%
Need Seeker
80% Other
Top 10 Spenders on R&D
Proportion of Strategy Models
60%
Need Seeker
40% Other
Top 10 Innovators
2011 Innovation 1000 - Slides for press.pptx Booz & Company
Key Takeaways – Innovation 1000 Spend
In 2010, R&D spend grew 9%, bouncing back from 2009’s unprecedented decline
68% of all companies raised R&D spending in 2010, and 3 industries accounted for more than
¾’s of the total $47 billion increase: Computing & Electronics, Health and Automotive
All regions increased innovation spending in 2010, a significant turnaround compared to 2009
The turnaround was cautious in Europe and Japan, regions that saw 5.8% and 1.8% increases
in R&D spending respectively…
…while India and China-based firms increased R&D outlays at a higher proportionate rate than
those in the three largest regions, albeit from a small base
The Top 20 R&D spenders averaged 10% R&D growth, compared with a 9% increase overall
The Top 10 R&D spenders underperformed the Top 10 innovators across key financial metrics
-- revenue growth, EBITDA as a percentage of revenue and market cap growth
12

2011 Innovation 1000 - Slides for press.pptx Booz & Company
2010 Innovation 1000 Demographics Analysis
Innovation Culture Summary
13

2011 Innovation 1000 - Slides for press.pptx Booz & Company
Innovation Strategy and Cultural Alignment Matrix(C)
Alignment of Business Strategy to Innovation Strategy(A)
Cu
ltu
ral
Su
pp
ort
fo
r In
no
va
tio
n S
tra
teg
y(B
) H
L
Note:
(A) Q.5. For your company, how closely aligned are the 4 dimensions above with your overall business strategy?
(B) Q.8 How well does your company culture support your innovation strategy?
(C) Concordance categories were created by combining Q.5 and Q.8. “Low alignment = respondents having responses below 4 in both the questions Q.5 and Q.8”, “Innovation alignment only = respondents having responses above 3
for Q.5 but below 4 for Q.8”, “Cultural alignment only = respondents having responses below 4 for Q.5 but above 3 for Q.8” and “High alignment = respondents having responses above 3 for both Q.5 and Q.8”
Over half of companies report inadequate strategic alignment and poor cultural support for their innovation strategies
9%
20% 27%
44%
L H
36% of respondents
reported that their
company’s culture does
not support their
innovation strategy
14
2011 Innovation 1000 - Slides for press.pptx Booz & Company
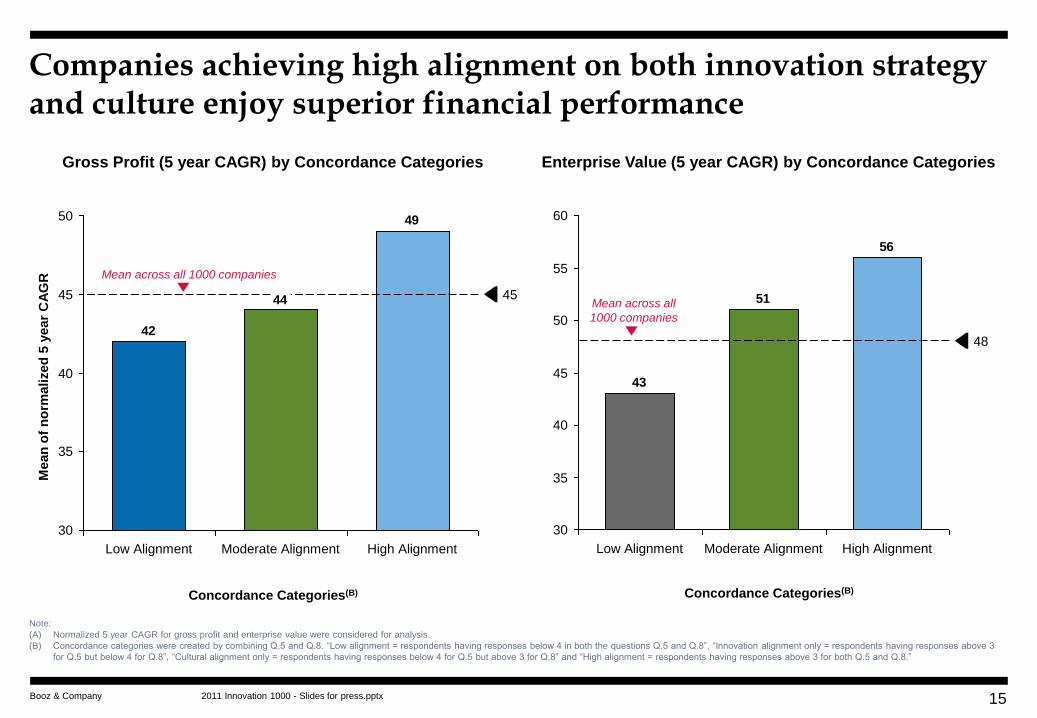
Companies achieving high alignment on both innovation strategy and culture enjoy superior financial performance
15
Note:
(A) Normalized 5 year CAGR for gross profit and enterprise value were considered for analysis.
(B) Concordance categories were created by combining Q.5 and Q.8. “Low alignment = respondents having responses below 4 in both the questions Q.5 and Q.8”, “Innovation alignment only = respondents having responses above 3
for Q.5 but below 4 for Q.8”, “Cultural alignment only = respondents having responses below 4 for Q.5 but above 3 for Q.8” and “High alignment = respondents having responses above 3 for both Q.5 and Q.8.”
Gross Profit (5 year CAGR) by Concordance Categories Enterprise Value (5 year CAGR) by Concordance Categories
49
44
42
50
45
40
35
30
45
High Alignment Moderate Alignment Low Alignment
56
51
43
55
60
50
45
40
35
30
48
High Alignment Moderate Alignment Low Alignment
Mean
of
no
rmalized
5 y
ear
CA
GR
Concordance Categories(B) Concordance Categories(B)
Mean across all 1000 companies
Mean across all
1000 companies
2011 Innovation 1000 - Slides for press.pptx Booz & Company 16
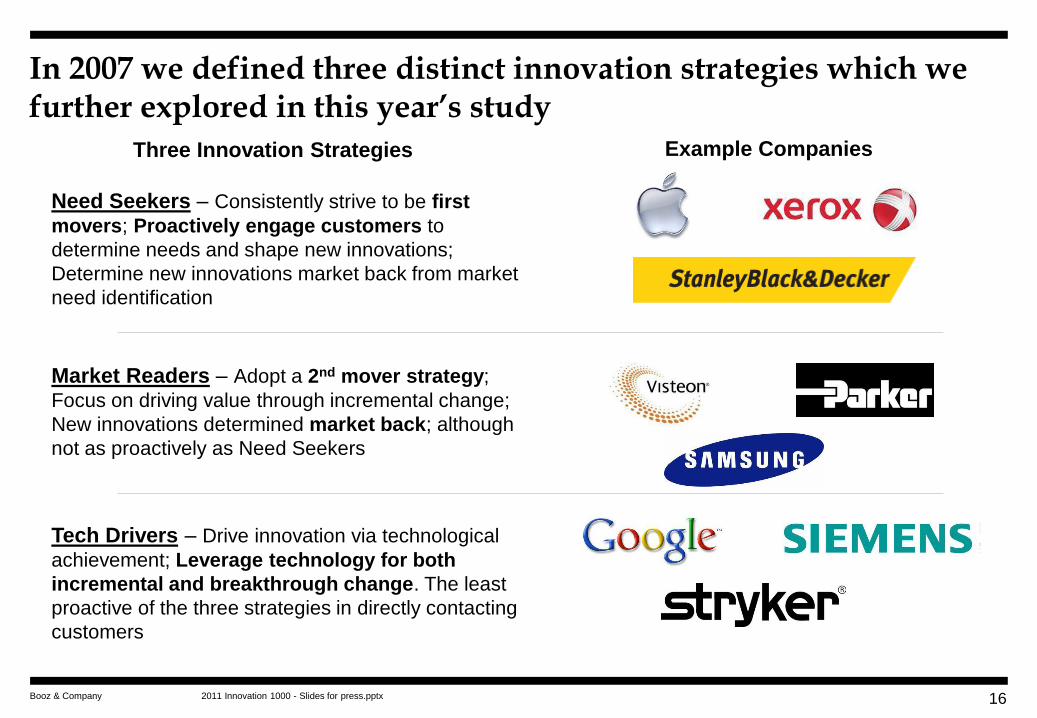
Need Seekers – Consistently strive to be first
movers; Proactively engage customers to
determine needs and shape new innovations;
Determine new innovations market back from market
need identification
Market Readers – Adopt a 2nd mover strategy;
Focus on driving value through incremental change;
New innovations determined market back; although
not as proactively as Need Seekers
Tech Drivers – Drive innovation via technological
achievement; Leverage technology for both
incremental and breakthrough change. The least
proactive of the three strategies in directly contacting
customers
Three Innovation Strategies Example Companies
In 2007 we defined three distinct innovation strategies which we further explored in this year’s study

2011 Innovation 1000 - Slides for press.pptx Booz & Company 17
Similar to our 2010 finding on capabilities, each Innovation Model has a distinct set of innovation goals and cultural attributes
Need Seekers Distinct Innovation Goal
Advantaged products and
services
Distinct Culture Attribute
Openness to ideas from
external sources
All Three Top Ranked Innovation Goals
Superior product performance
Superior product quality
Top Ranked Culture Attributes
Strong identification with the customer
Passion for and pride in the products and services offered
Market Readers
Tech Drivers
Sources: Bloomberg data; 2010 Booz & Company Innovation 1000 survey; 2011 Booz & Company Innovation 1000 survey
Distinct Innovation Goal
Products customized to markets
Distinct Culture Attribute
Culture of collaboration across
geography/functions
Distinct Innovation Goal
Developing low cost products
Distinct Culture Attribute
Respect for technical talent
and knowledge

2011 Innovation 1000 - Slides for press.pptx Booz & Company
Interestingly, the lowest-ranked cultural attribute across all models was “tolerance for failure in the innovation process”
18
Note:
(A) “Please force-rank the following cultural attributes in order of the relative level of importance to your company and the degree of prevalence. Rank the most
important 1st , the next most important 2nd and so on.” -– Responses above reflect the recoded means, that is, responses of 1 or 2 = 1, all others = 0
Reco
ded
Mean
of
Ran
k Im
po
rtan
ce
Rank of Importance(A) of Cultural Attributes
Ranked
Most Important
Ranked Least
Important
Cultural Attribute Categories
2011 Innovation 1000 - Slides for press.pptx Booz & Company
Note:
(A) Q.5. For your company, how closely aligned are the 4 dimensions above with your overall business strategy?
(B) Q.8 How well does your company culture support your innovation strategy?
(C) Concordance categories were created by combining Q.5 and Q.8. “Low alignment = respondents having responses below 4 in both the questions Q.5 and Q.8”, “Innovation alignment only = respondents having responses above 3
for Q.5 but below 4 for Q.8”, “Cultural alignment only = respondents having responses below 4 for Q.5 but above 3 for Q.8” and “High alignment = respondents having responses above 3 for both Q.5 and Q.8”
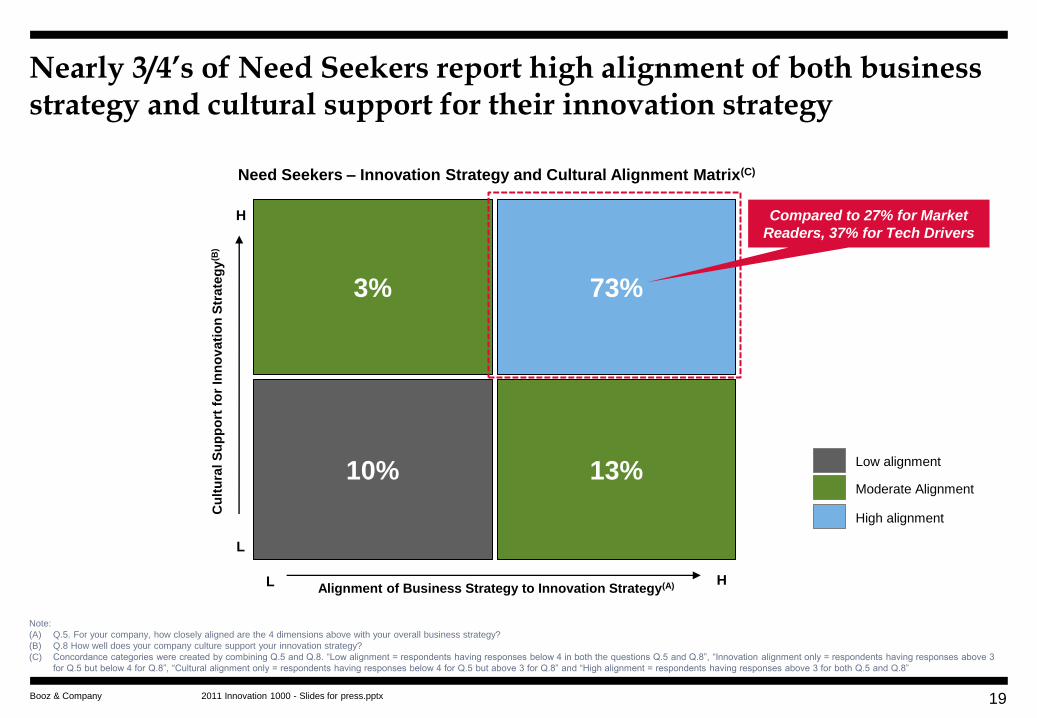
Nearly 3/4’s of Need Seekers report high alignment of both business strategy and cultural support for their innovation strategy
Need Seekers – Innovation Strategy and Cultural Alignment Matrix(C)
Alignment of Business Strategy to Innovation Strategy(A)
Cu
ltu
ral S
up
po
rt f
or
Inn
ov
ati
on
Str
ate
gy
(B)
H
L
3%
13% 10%
73%
L H
Low alignment
Moderate Alignment
High alignment
Compared to 27% for Market
Readers, 37% for Tech Drivers
19
2011 Innovation 1000 - Slides for press.pptx Booz & Company
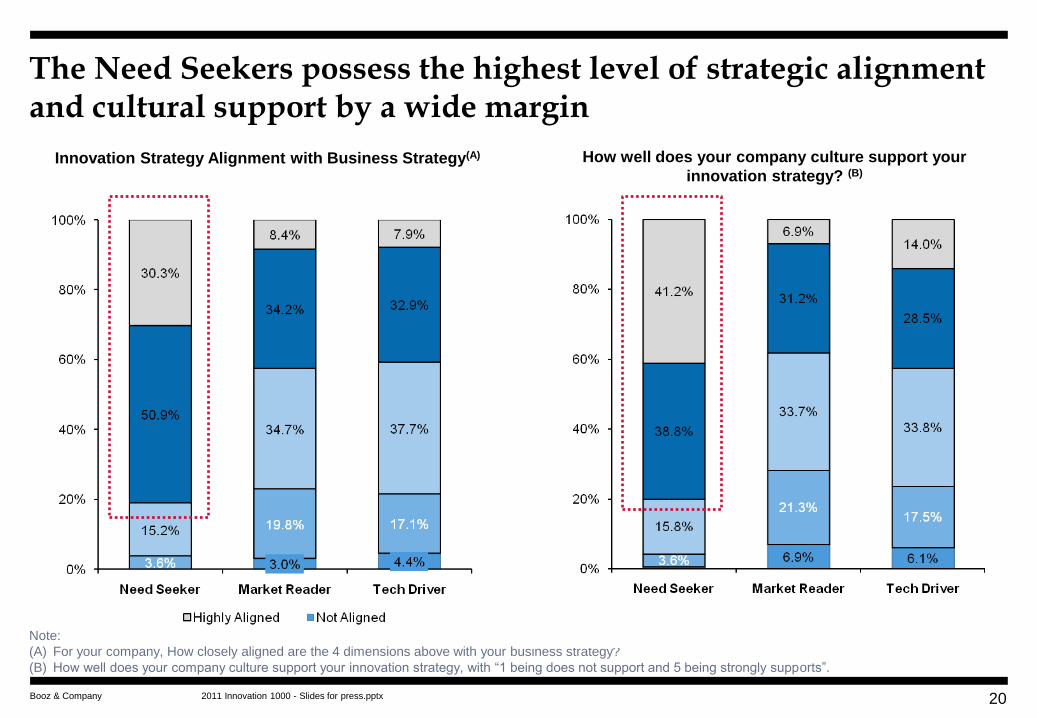
The Need Seekers possess the highest level of strategic alignment and cultural support by a wide margin
20
Note:
(A) For your company, How closely aligned are the 4 dimensions above with your business strategy?
(B) How well does your company culture support your innovation strategy, with “1 being does not support and 5 being strongly supports”.
Innovation Strategy Alignment with Business Strategy(A) How well does your company culture support your
innovation strategy? (B)

2011 Innovation 1000 - Slides for press.pptx Booz & Company
This was also true of the Silicon Valley-based company survey participants when compared to all respondents
4.9% 7.1%
15.0% 7.1%
28.7%
10.7%
32.3%
28.6%
19.2%
46.4%
0%
20%
40%
60%
80%
100%
Overall Bay Area Companies
21
Does not Support
Strongly Supports
3%
14.3% 14.3%
30.4%
10.7%
38.3%
21.4%
14.3%
53.6%
0%
20%
40%
60%
80%
100%
Overall Bay Area Companies
Note:
(A) For your company, how closely aligned are the 4 dimensions above with your business strategy, with 1 being “Not Aligned” and 5 being “Highly Aligned”.
(B) How well does your company culture support your innovation strategy, with “1 being does not support and 5 being strongly supports”
Not Aligned
Highly Aligned
Innovation Strategy Alignment with Business Strategy(A) How well does your company culture support your
innovation strategy? (B)
2011 Innovation 1000 - Slides for press.pptx Booz & Company
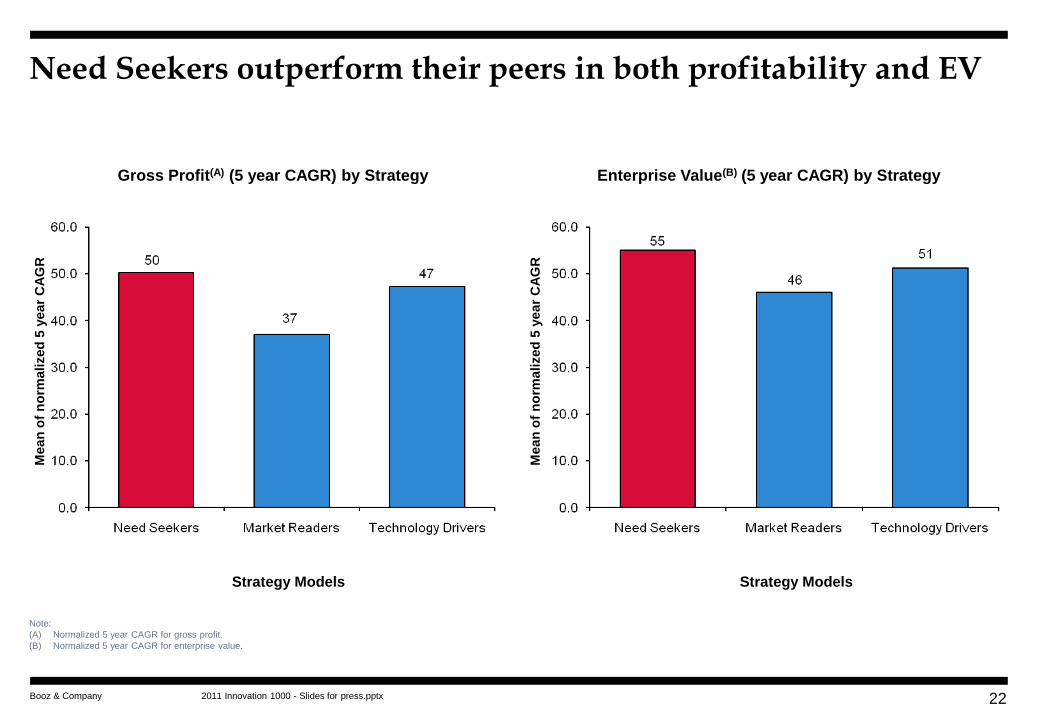
Need Seekers outperform their peers in both profitability and EV
22
Note:
(A) Normalized 5 year CAGR for gross profit.
(B) Normalized 5 year CAGR for enterprise value.
Gross Profit(A) (5 year CAGR) by Strategy Enterprise Value(B) (5 year CAGR) by Strategy
Strategy Models Strategy Models
Mean
of
no
rmali
zed
5 y
ear
CA
GR
Mean
of
no
rmali
zed
5 y
ear
CA
GR
2011 Innovation 1000 - Slides for press.pptx Booz & Company
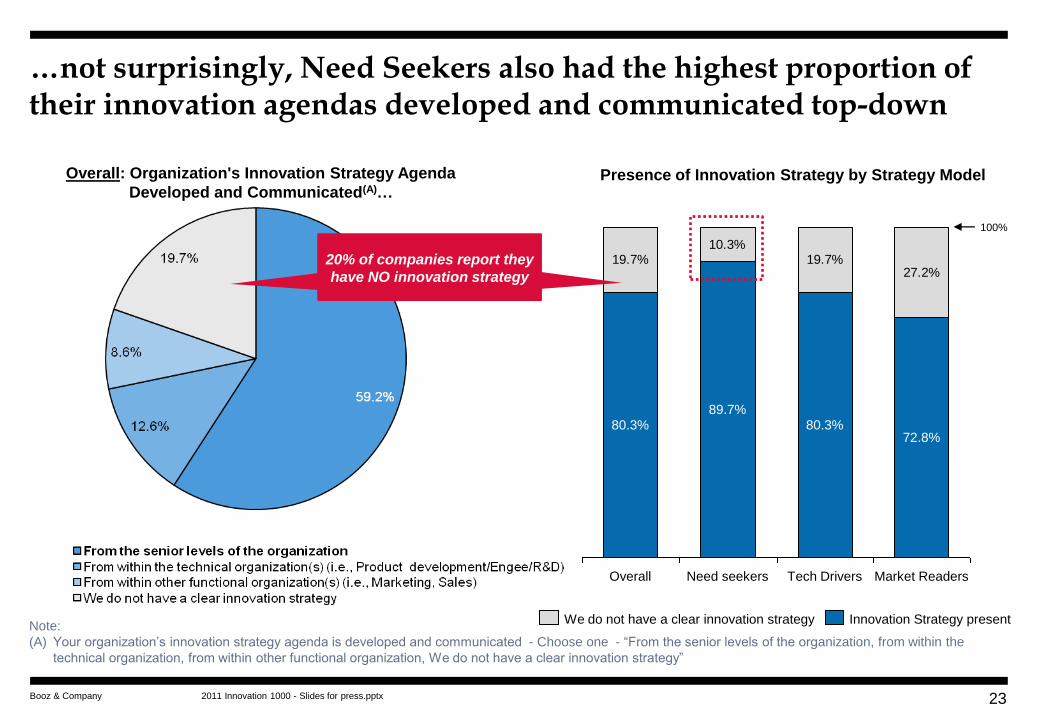
…not surprisingly, Need Seekers also had the highest proportion of their innovation agendas developed and communicated top-down
23
Note:
(A) Your organization’s innovation strategy agenda is developed and communicated - Choose one - “From the senior levels of the organization, from within the
technical organization, from within other functional organization, We do not have a clear innovation strategy”
Overall: Organization's Innovation Strategy Agenda
Developed and Communicated(A)…
19.7%10.3%
19.7%27.2%
100%
Market Readers
72.8%
Tech Drivers
80.3%
Need seekers
89.7%
Overall
80.3%
Presence of Innovation Strategy by Strategy Model
Innovation Strategy present We do not have a clear innovation strategy
20% of companies report they
have NO innovation strategy 20% of companies report they
have NO innovation strategy

2011 Innovation 1000 - Slides for press.pptx Booz & Company
Key Take Aways - Innovation Culture:
+50% of companies reported that their innovation strategy was mis-aligned with their
business strategy and that their culture poorly supported it…
…while the 44% of companies reporting high alignment of both innovation strategy and
culture had superior profitability and enterprise value growth
20% of companies indicated that they have no innovation strategy – but only 10% of Need
Seekers reported this deficiency, half the rate of companies in general
Need Seekers are disproportionally represented in the 10 Most Innovative Companies and in
Silicon Valley firms
Need Seekers reported the highest level of alignment with both business strategy and cultural
support for innovation strategy and rated themselves higher on:
– Performance on innovation goals/outcomes
– Prevalence of cultural attributes related to innovation
– Perceived financial performance in relation to peers – and actual performance
– Development and communication of innovation strategy
24

![why culture matters - Premier Executive Search Firm | …/media/Files/Attachments/Senn Dela… · · 2015-07-20Why culture matters: Senn Delaney client impact stories [1] why culture](https://img.pdfslide.net/doc/110x75/5af445307f8b9a5b1e8c4790/why-culture-matters-premier-executive-search-firm-mediafilesattachmentssenn.jpg)