Embed Size (px)
DESCRIPTION
Why Data Matters! Building and Sustaining a Business Case. Kansas City NEUAC June 18, 2014. Presentation Outline. Performance Metrics Example Findings from Evaluation Targets for Performance Measurement Follow-Up Assessment through Evaluation Using Evaluation to Quantify Benefits - PowerPoint PPT Presentation
Citation preview
Why Data Matters!Building and Sustaining a Business Case
Kansas City NEUAC
June 18, 2014
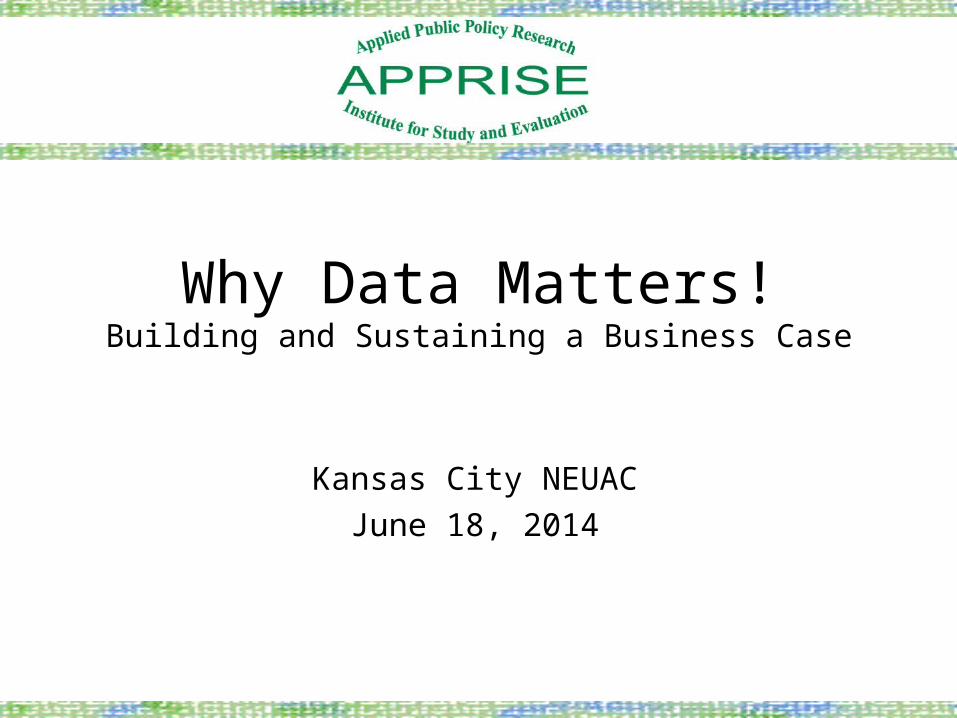
Presentation Outline
• Performance Metrics Example– Findings from Evaluation– Targets for Performance Measurement– Follow-Up Assessment through Evaluation
• Using Evaluation to Quantify Benefits– Elderly Health Benefits from Air Conditioning– Client Affordability Benefits from WX– Societal Environmental Benefits from WX
• Using Evaluation to Dispel Myths– Speak with Confidence about “Take-Back”
2
Performance Metrics Example
3
Performance Measurement is Cool (60s), Radical (80s),
Awesome (90s), Sick! (current)
…and a lot of different types of people/organizations are doing it
4

NBA EXAMPLE
Rose is the type of player who is defined by more than his statistics. His impact on the offense goes beyond what he contributes to box scores.
Before his injury issues started escalating in 2012, the Bulls were the third most efficient offense in the NBA, per NBA.com/STATS.
Modern analytics have helped to shape what offenses do. By tracking shot locations, it’s become apparent that some areas of the court are more
critical than others….
By Kelly Scaletta, Featured Columnist Aug 15, 2013
http://bleacherreport.com/articles/1739774-what-is-the-derrick-rose-effect
5
Why would an NBA Player hire a personal Data Analyst?
To get better!
To sit beside him/her during contract negotiations!
6
Why would the LIHEAP Program or the Weatherization Program get involved
with Performance Measurement?
To get better!
To use during contract negotiations …. budget discussions!
7

Performance Metrics FrameworkProgram Evaluation vs. Performance
Measurement
8
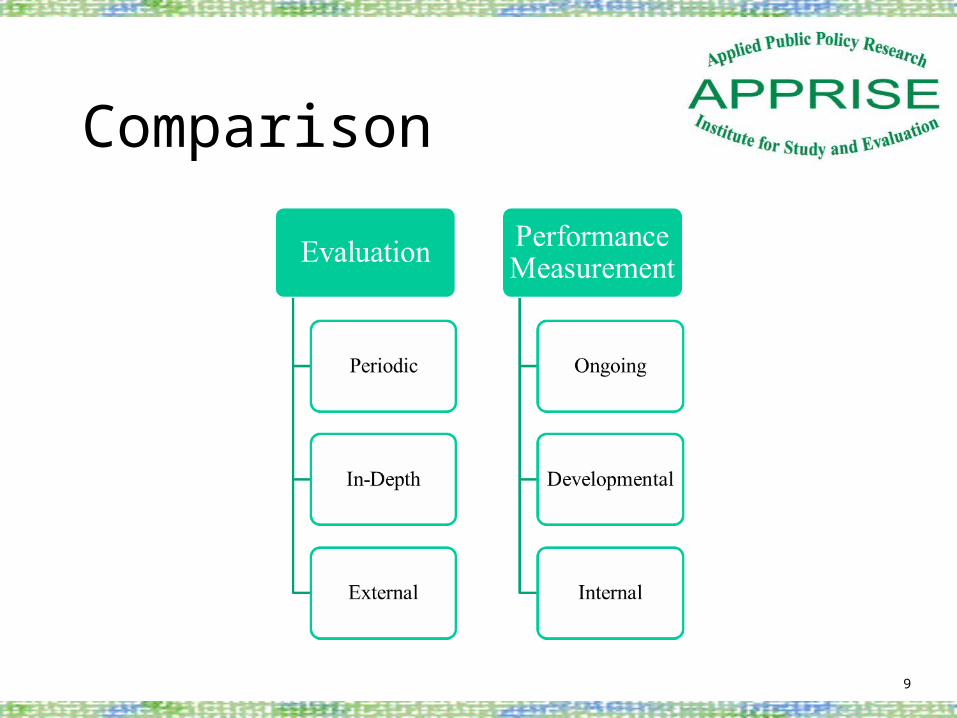
Comparison
9
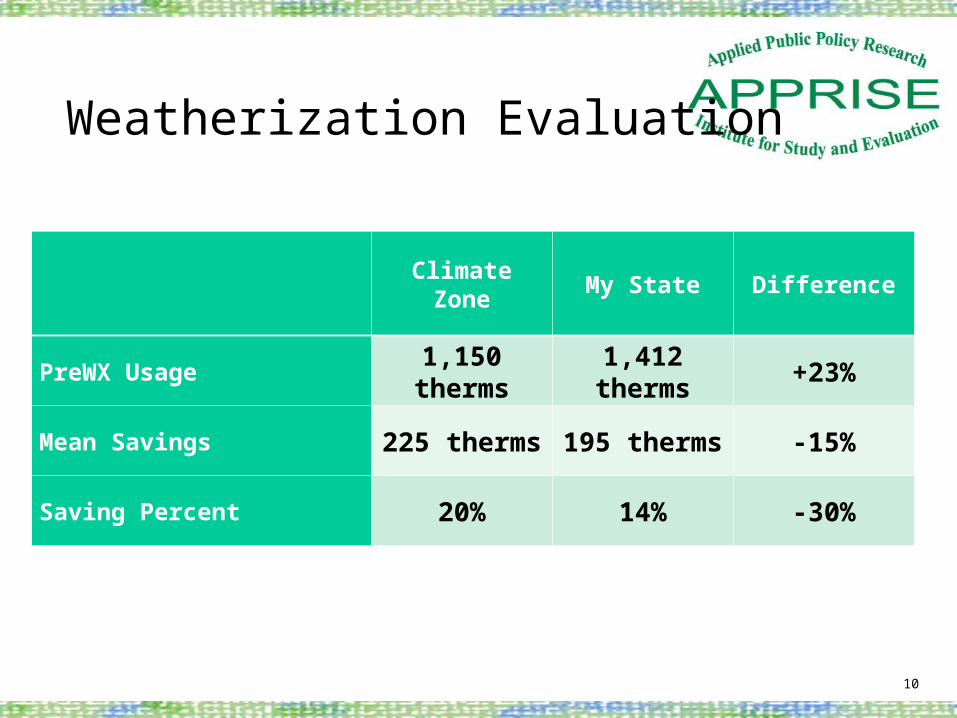
Weatherization Evaluation
10
Climate Zone My State Difference
PreWX Usage 1,150 therms 1,412 therms +23%
Mean Savings 225 therms 195 therms -15%
Saving Percent 20% 14% -30%
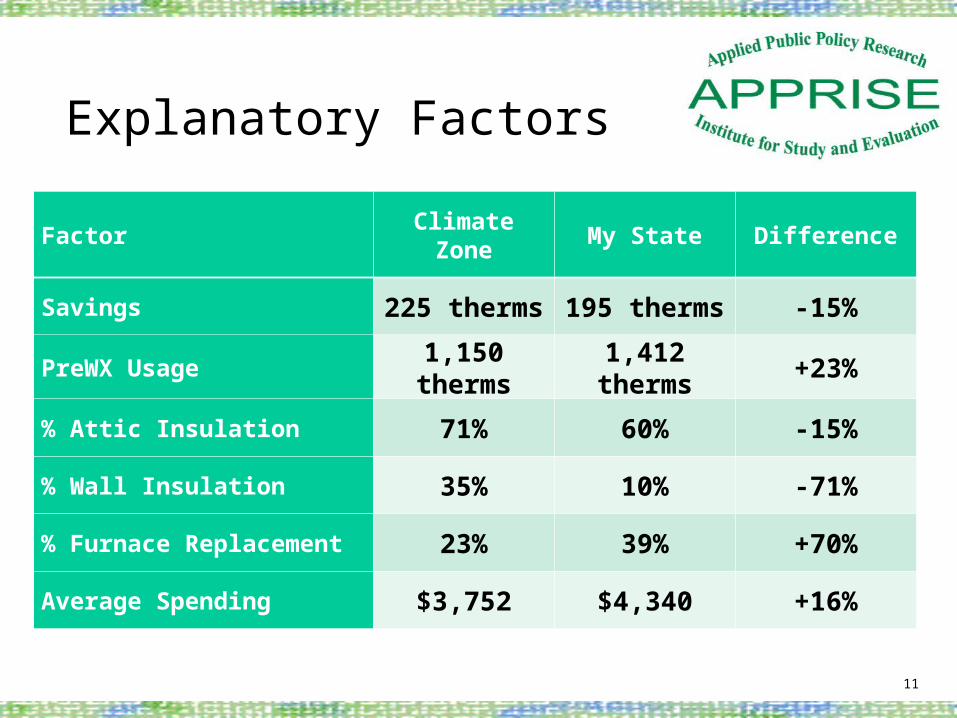
Explanatory Factors
11
Factor Climate Zone My State Difference
Savings 225 therms 195 therms -15%
PreWX Usage 1,150 therms 1,412 therms +23%
% Attic Insulation 71% 60% -15%
% Wall Insulation 35% 10% -71%
% Furnace Replacement 23% 39% +70%
Average Spending $3,752 $4,340 +16%
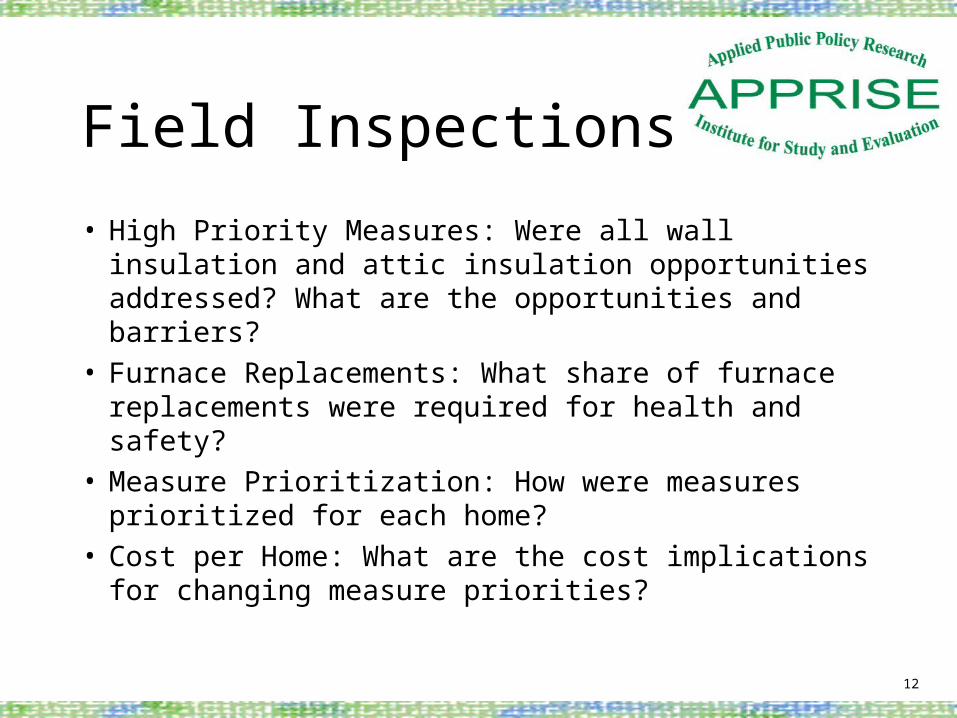
Field Inspections
12
• High Priority Measures: Were all wall insulation and attic insulation opportunities addressed? What are the opportunities and barriers?
• Furnace Replacements: What share of furnace replacements were required for health and safety?
• Measure Prioritization: How were measures prioritized for each home?
• Cost per Home: What are the cost implications for changing measure priorities?
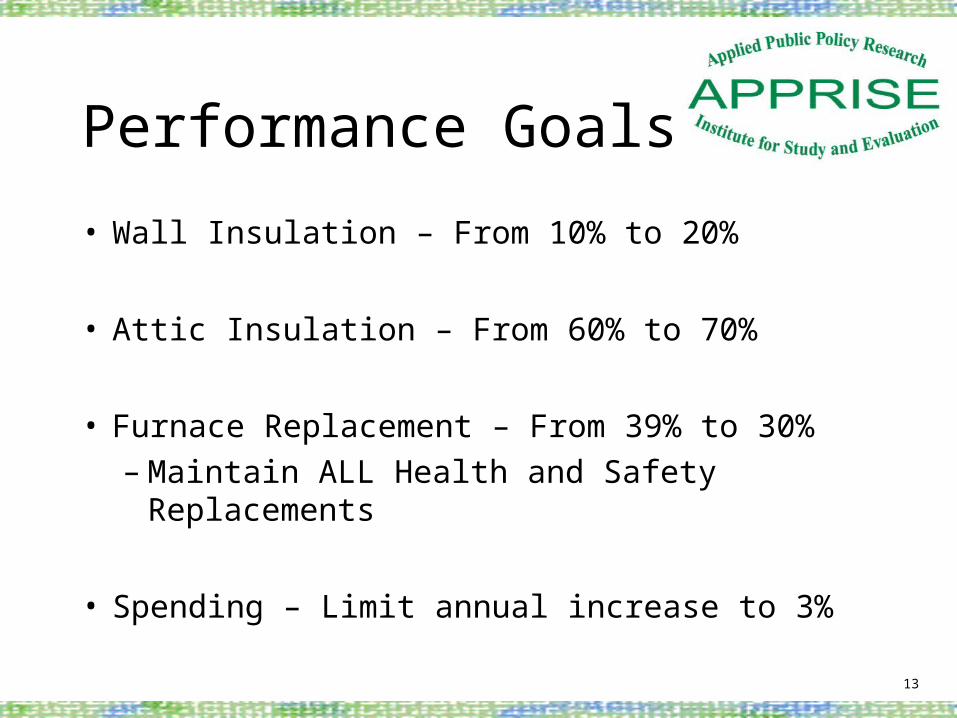
Performance Goals
13
• Wall Insulation – From 10% to 20%
• Attic Insulation – From 60% to 70%
• Furnace Replacement – From 39% to 30%– Maintain ALL Health and Safety Replacements
• Spending – Limit annual increase to 3%
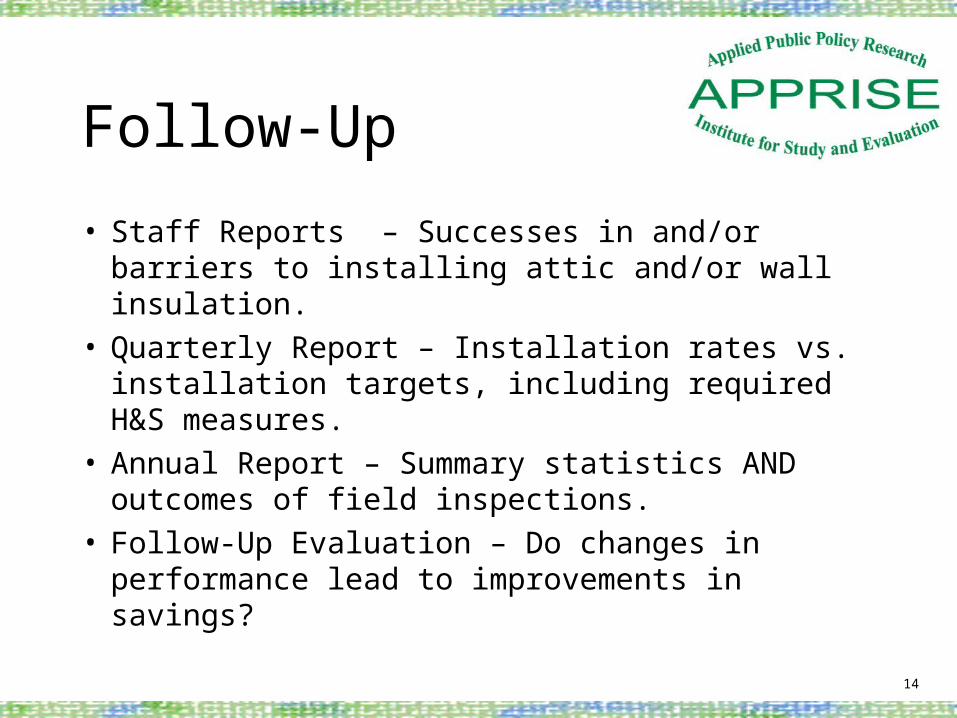
Follow-Up
14
• Staff Reports – Successes in and/or barriers to installing attic and/or wall insulation.
• Quarterly Report – Installation rates vs. installation targets, including required H&S measures.
• Annual Report – Summary statistics AND outcomes of field inspections.
• Follow-Up Evaluation – Do changes in performance lead to improvements in savings?

Documenting Program Benefits
15
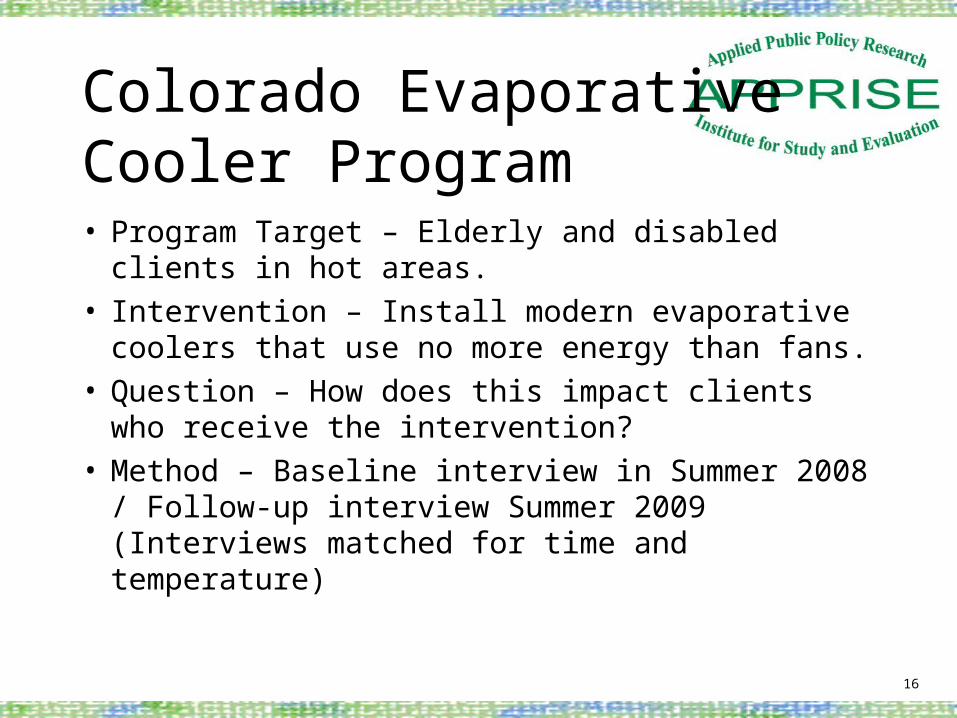
Colorado EvaporativeCooler Program
16
• Program Target – Elderly and disabled clients in hot areas.
• Intervention – Install modern evaporative coolers that use no more energy than fans.
• Question – How does this impact clients who receive the intervention?
• Method – Baseline interview in Summer 2008 / Follow-up interview Summer 2009 (Interviews matched for time and temperature)
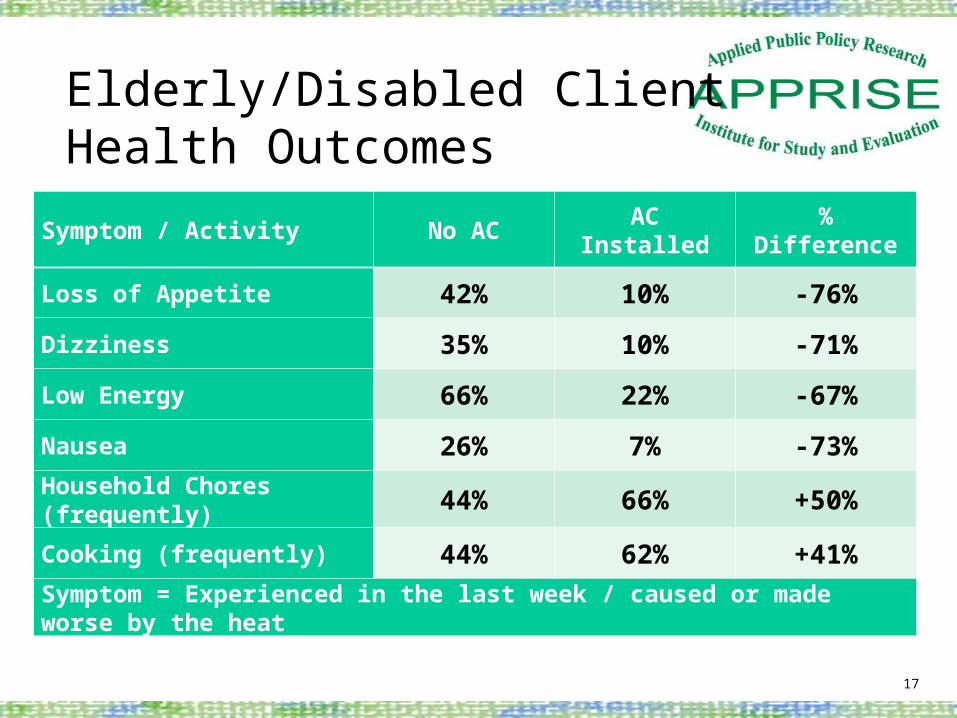
Elderly/Disabled Client Health Outcomes
17
Symptom / Activity No AC AC Installed % Difference
Loss of Appetite 42% 10% -76%
Dizziness 35% 10% -71%
Low Energy 66% 22% -67%
Nausea 26% 7% -73%
Household Chores (frequently) 44% 66% +50%
Cooking (frequently) 44% 62% +41%
Symptom = Experienced in the last week / caused or made worse by the heat
Conclusions
• Having air conditioning and using it, reduces the incidence of heat related illness symptoms.
• Having air conditioning and using it increases the independence of elderly and disabled individuals.
18
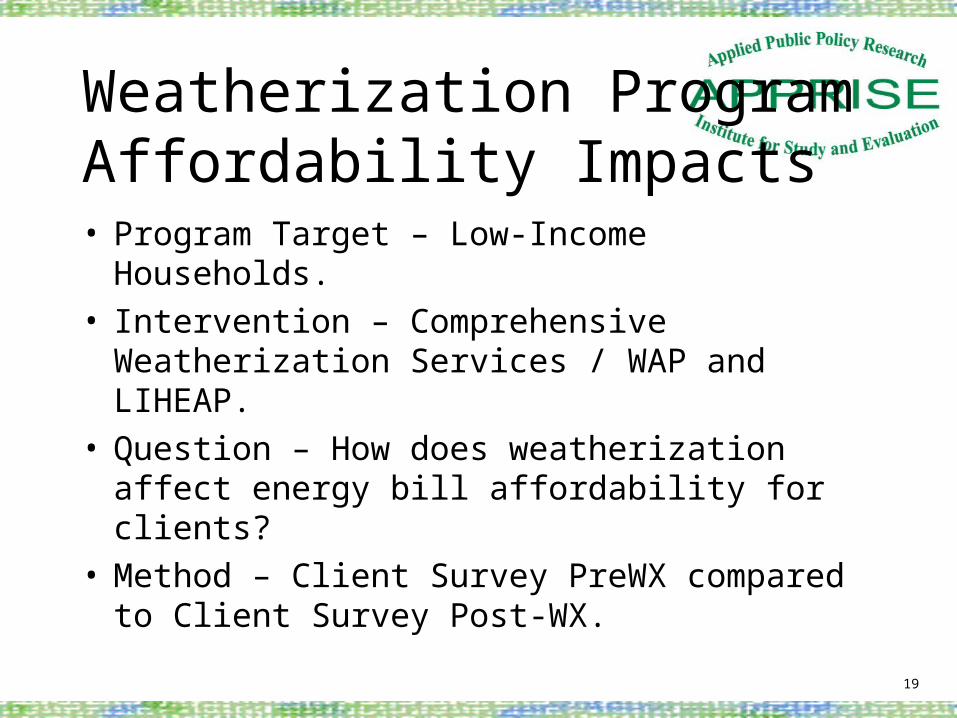
Weatherization ProgramAffordability Impacts
19
• Program Target – Low-Income Households.• Intervention – Comprehensive Weatherization
Services / WAP and LIHEAP.• Question – How does weatherization affect energy
bill affordability for clients?• Method – Client Survey PreWX compared to
Client Survey Post-WX.
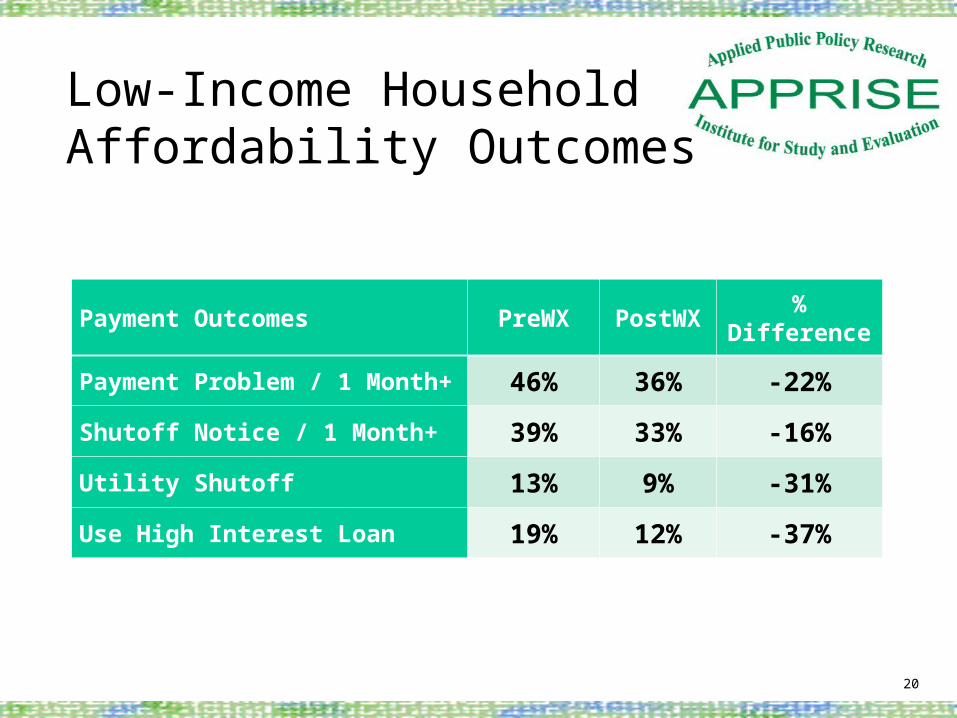
Low-Income HouseholdAffordability Outcomes
20
Payment Outcomes PreWX PostWX % Difference
Payment Problem / 1 Month+ 46% 36% -22%
Shutoff Notice / 1 Month+ 39% 33% -16%
Utility Shutoff 13% 9% -31%
Use High Interest Loan 19% 12% -37%
Conclusions
• Getting comprehensive weatherization helps clients to pay their utility bills.
• Getting comprehensive weatherization helps clients to avoid short-term high interest loans that lead to more trouble in the long run.
21
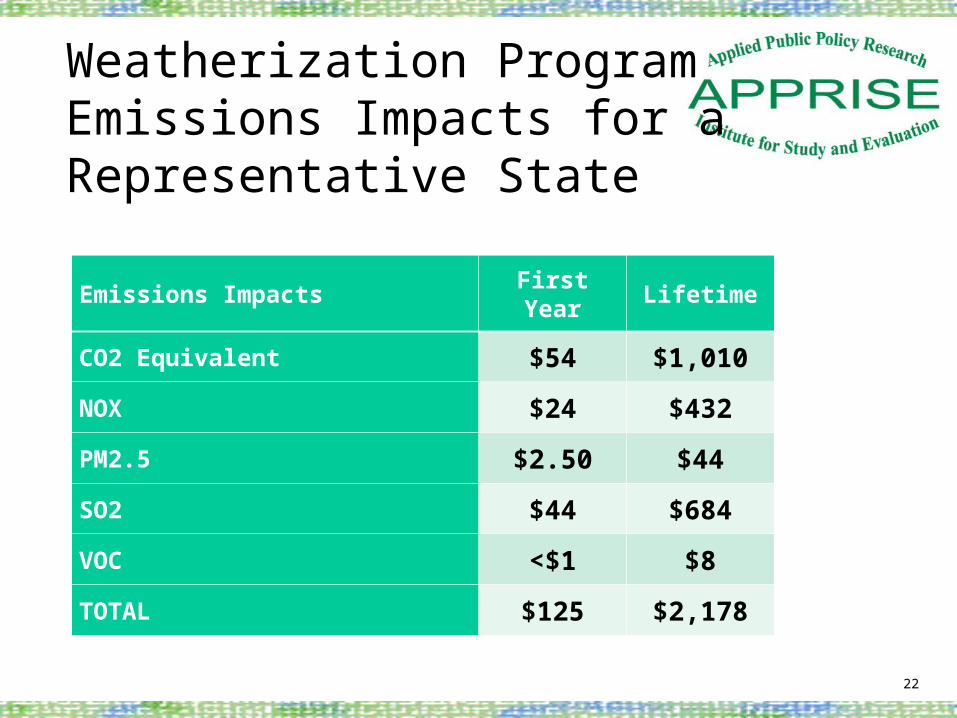
Weatherization Program Emissions Impacts for a Representative State
22
Emissions Impacts First Year Lifetime
CO2 Equivalent $54 $1,010
NOX $24 $432
PM2.5 $2.50 $44
SO2 $44 $684
VOC <$1 $8
TOTAL $125 $2,178
Weatherization “Take Back”
23

“Take Back” Issue
“Weatherizing the homes of low-income households doesn’t save energy. After weatherization clients just turn up the
thermostat and don’t have any reduction in energy use”
24
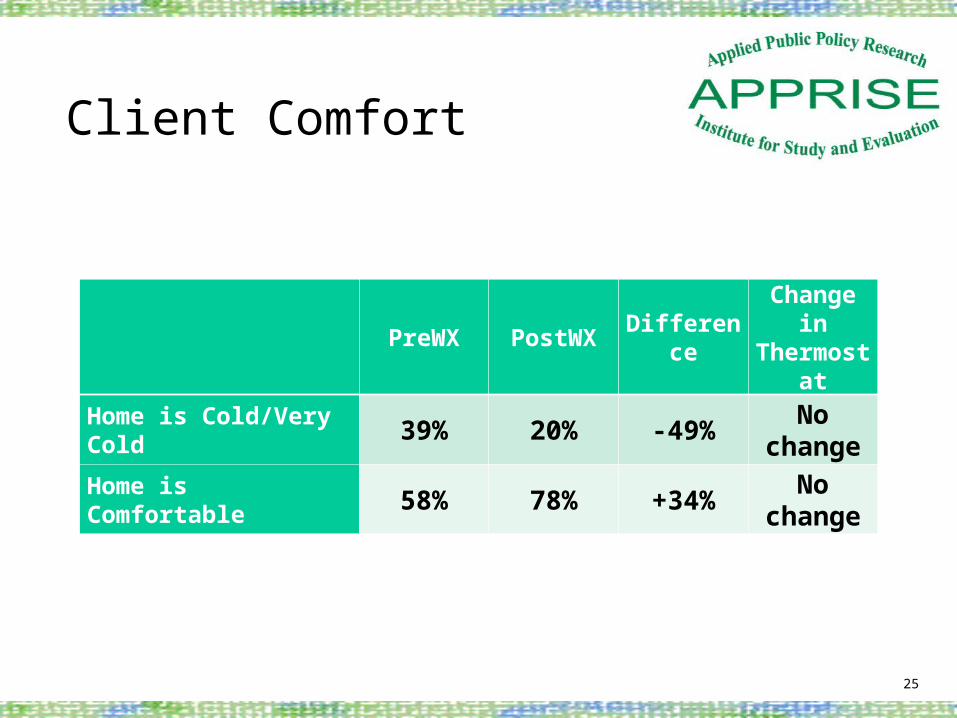
Client Comfort
25
PreWX PostWX DifferenceChange in
Thermostat
Home is Cold/Very Cold 39% 20% -49% No change
Home is Comfortable 58% 78% +34% No change

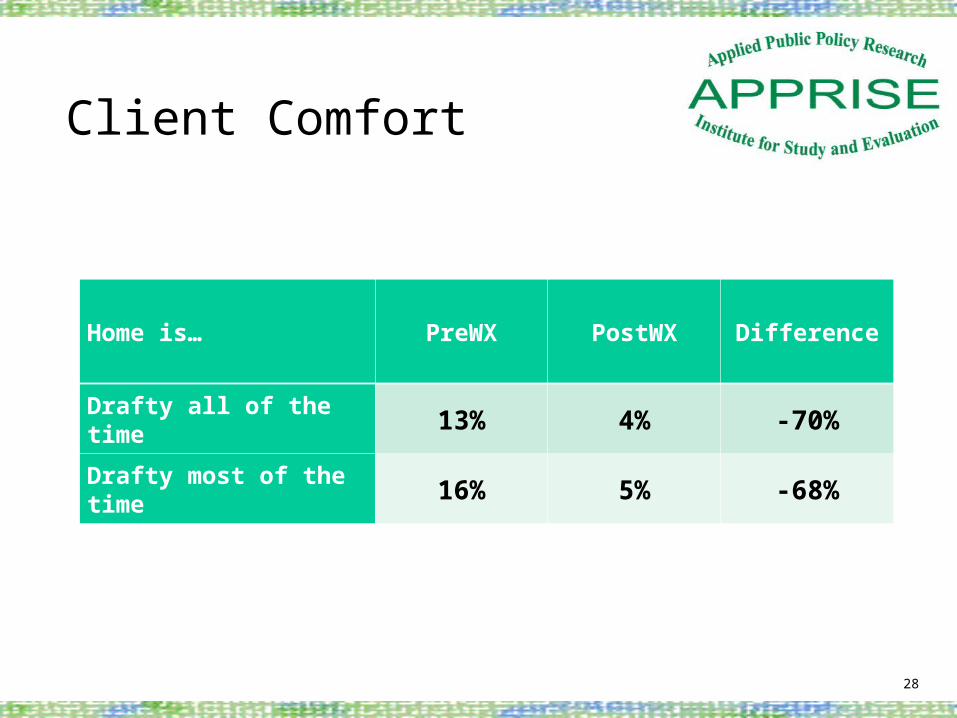
Client Comfort
26
Home is… PreWX PostWX Difference
Drafty all of the time 13% 4% -70%
Drafty most of the time 16% 5% -68%
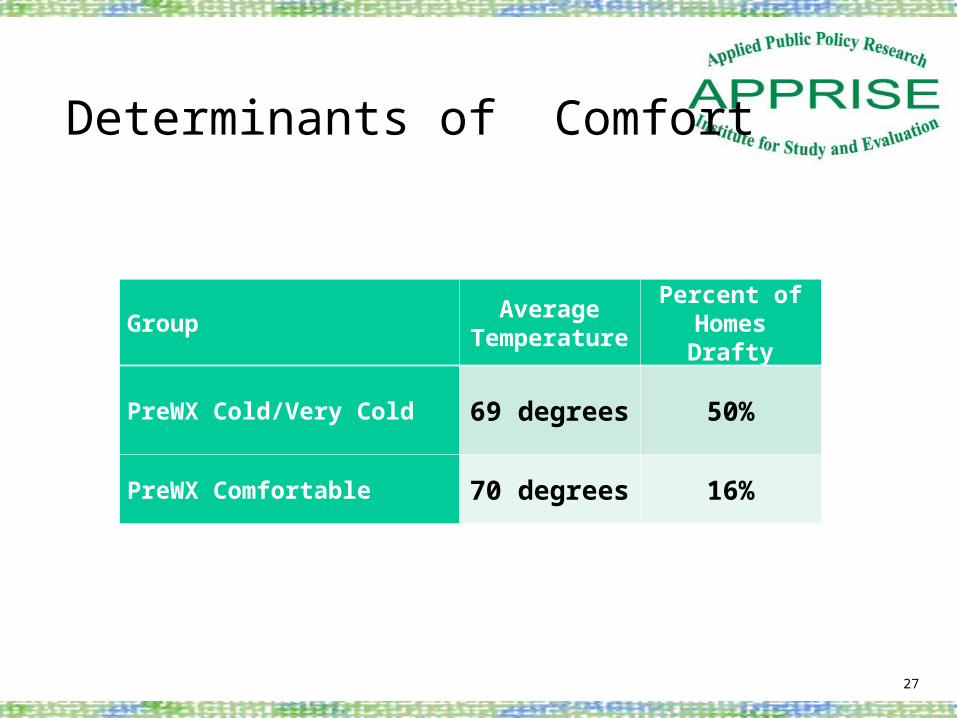
Determinants of Comfort
27
GroupAverage
TemperaturePercent of Homes
Drafty
PreWX Cold/Very Cold 69 degrees 50%
PreWX Comfortable 70 degrees 16%
Client Comfort
28
Home is… PreWX PostWX Difference
Drafty all of the time 13% 4% -70%
Drafty most of the time 16% 5% -68%
WAP Occupant SurveyShows…• Client perceptions of cold vs. comfortable
mainly related to draftiness, not to thermostat settings.
• PostWX comfort levels high without higher thermostat settings.
• But … these are just survey data ….
29
(line of agreement) (line of agreement)
50
55
60
65
70
75
80
85
50 55 60 65 70 75 80 85 50 55 60 65 70 75 80 85
Control Treatment
P
ost
-we
ath
eriz
atio
n in
doo
r te
mpe
ratu
re, F
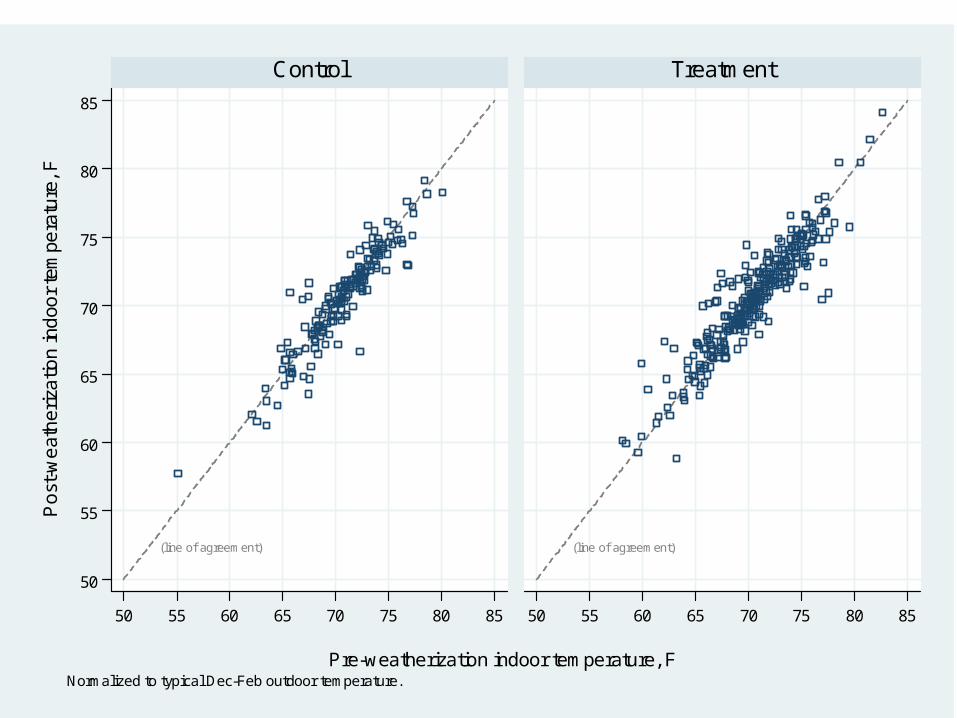
Pre-weatherization indoor temperature, F
Normalized to typical Dec-Feb outdoor temperature.
WAP Field StudyShows…• Temperatures go up in some homes.
• Temperatures go down in other homes.
• Measured indoor temperatures preWX vs. PostWX do not change.
31
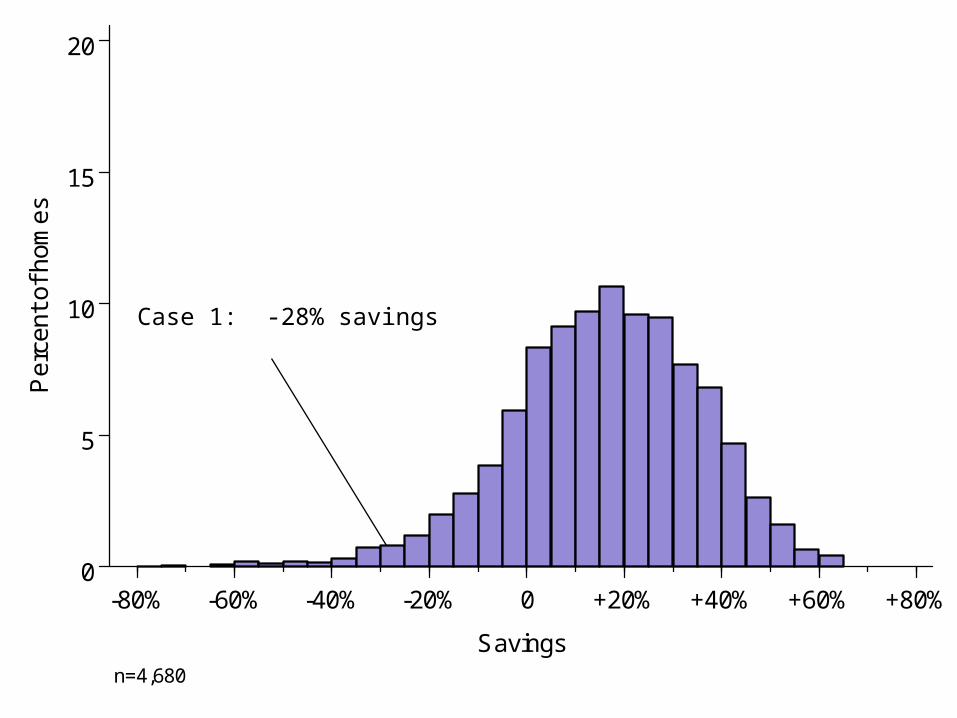
0
5
10
15
20P
erc
ent o
f hom
es
-80% -60% -40% -20% 0 +20% +40% +60% +80%
Savingsn=4,680
Case 1: -28% savings
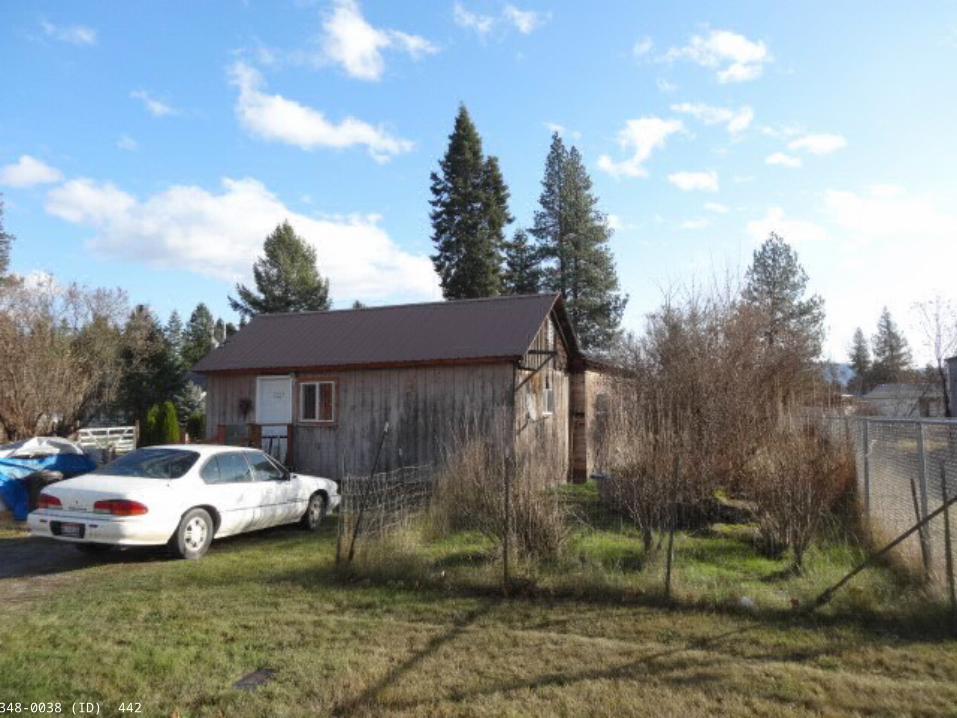
2348-0038 (ID) 442
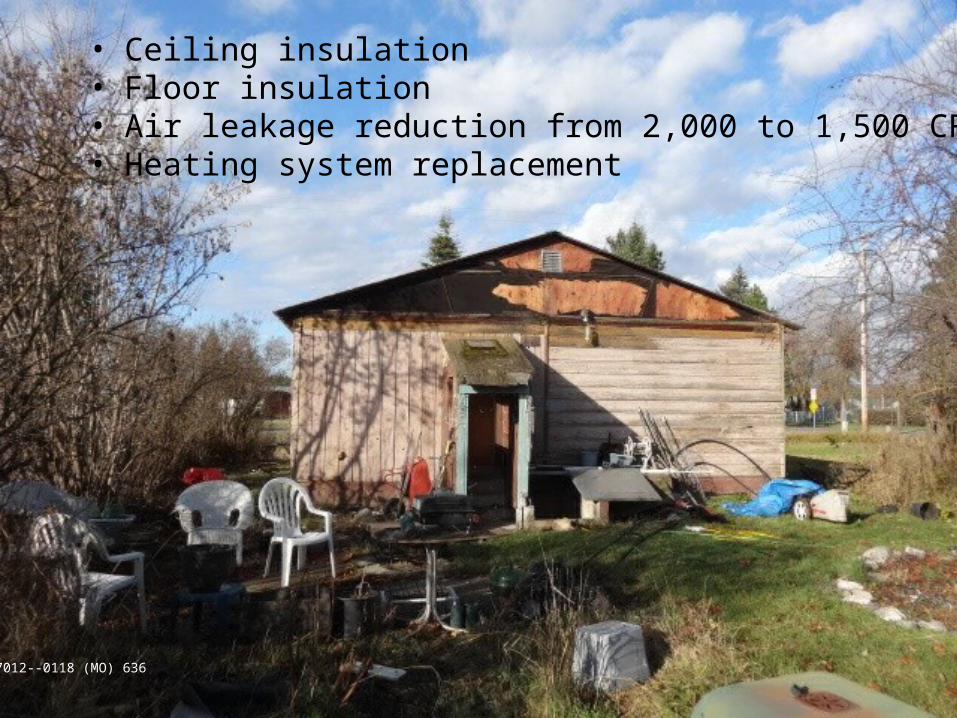
• Ceiling insulation• Floor insulation• Air leakage reduction from 2,000 to 1,500 CFM50• Heating system replacement
7012--0118 (MO) 636

• Ceiling insulation (4 bags)• Floor insulation (2 bags)• Air leakage reduction from 2,000 to 1,500 CFM50
(measured 2,100 at time of visit)• Heating system replacement
(gas heater broke year before Wx)
…and client reported keeping thermostat set higher afterWx (for health reasons)
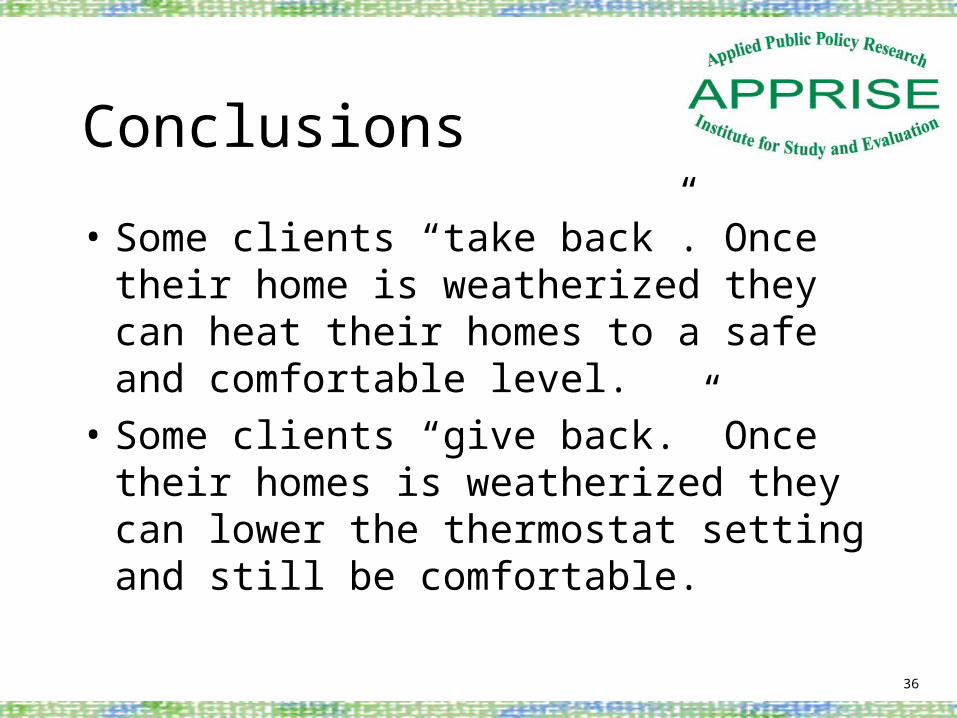
Conclusions
• Some clients “take back”. Once their home is weatherized they can heat their homes to a safe and comfortable level.
• Some clients “give back.” Once their homes is weatherized they can lower the thermostat setting and still be comfortable.
36
Summary
37
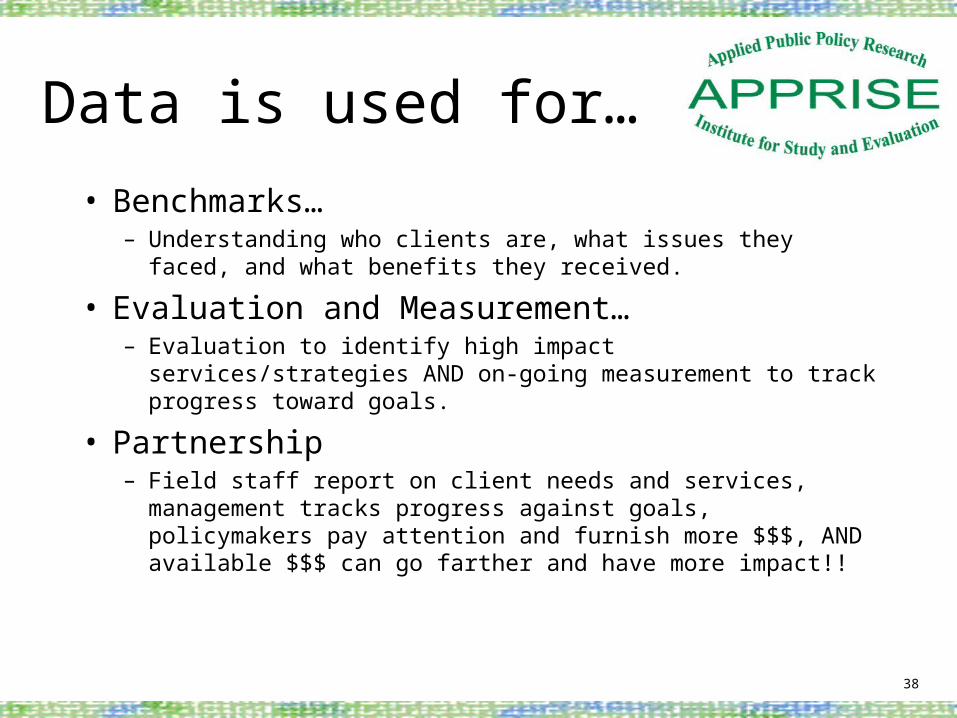
Data is used for…
• Benchmarks…– Understanding who clients are, what issues they faced, and what
benefits they received.
• Evaluation and Measurement…– Evaluation to identify high impact services/strategies AND on-
going measurement to track progress toward goals.
• Partnership– Field staff report on client needs and services, management tracks
progress against goals, policymakers pay attention and furnish more $$$, AND available $$$ can go farther and have more impact!!
38