Embed Size (px)
Citation preview
WHY RESOURCE-RICH INDIA IS ANECONOMIC LAGGARD
G S SAHOTA
NO. 9 JULY. 1991
WHY RESOURCE RICH INDIA IS AN BOONCHIC LAGGARD*
1. India's Development Model Needs Urgent Revision
TnHia BRnrm»s
a La/gard
India innovated many useful policies and institutions in the
early postwar years. Her postwar development model, international
diplomacy (such as non-alignment) the planning and other
institutions, and politico-economic leadership in general were
enthusiastically adopted by most developing countries. India's
development model started with a bang and made a great impact on
other countries in the 1950s. A few developing countries,
specially the East Asian countries, broke away from India's
economic development approach and experimented with an alternative
model. India's neighbors, almost all South-Asian countries, have,
however, followed by and large the same economic policies. Since
they also have corcmon culture, the terms India's Development Model
and the South Asian Developm ent Model w ill be used
interchangeably.
But today India is a laggard in both growth and poverty
alleviation, as may be seen from Tables 1 through 5. Table 1
gives long-run rates of growth of dynamic East Asian countries
against laggard South Asian countries. From being as poor as India
only two generations ago, East Asian countries have leaped forward
by as ranch as 3 to 12 times. Table 2 presents similar statistics
by subperiods, showing how growth brings about desirable changes
in population too. An eye-opening information is summarized in
Table 3, which reports annual rates of reduction in poverty and
infant mortality. For the main defense of India's sluggish growth
is that it pays special attention to alleviating poverty and other
^ This article' uas published in tha Financial Express.Sunday, June 9, 1991, pp. 3-5.
1

desirable social changes. Both indices have come down at much
steeper rates in East Asian countries than in South Asian
countries, and are much lower in the former group. Table 4
presents a snapshot of where we were in 1950 and where we are
today in relation to East Asian tigers. Finally, Table 5 presents
a scenario which deserves to be pondered over, keeping our future
generations in perspective.
Lagging behind other countries in the growth rates of per
capita incoroe today is bad for the present generation and worse
for future generations. Even a single simple aspect of laggardness
would underscore the disastrous consequences on the country. So
far India has been suffering from a brain drain to North America
and the OECD countries. It will soon start draining its brain to
the East Asian countries too, if early action is not taken to
correct the past 4 generations course drastically. Since Asian
countries are closer and their borders are porous, the problem
will become much more serious than it has been in relation to
North America and Europe.
What is not generally realized, although it is an extremely
simple arithmetic, is that lagging behind other countries even by
one percentage of growth rate opens up a significant gap in due
course. India, along with the rest of South Asia, has lagged
behind East-Asian countries by large percentages of annual rates
of growth. The scenario presented in Table 5 underscores the
point. Even when India's growth rate was at its highest during
the last 5 years, Korea's rate of growth of per capita income was
10.3% against India's 3 .0 % . Note how much gap East Asian
countries, starting practically at the same per capita income
levels as in India, have opened up against India within the span
of about 3 decades and how much more gap is in the offing. Looked
at from a different angle, even if India departs from what Late
Raj Krishna has called its Hindu Rate of growth and sustains its
2

significantly higher rate of growth of per capita income of the
last 5 years, it will take her 84 years to attain today's levels
of income of Korea. Put still differently, if Korea continues
growing at her recent (1985-88) rate of growth of per capita
income of 10.3% p.a. and India at hers of 3%, in one generation
(say 20 years), the average Korean will be over 50 times more
prosperous than an average Indian.1- As a final tickler, if India
wants to catch up with Korea in 2 generations (40 years) while
Korea continues growing at her present pace, India's per capita
real income will have to grow at 16.5% p .a .* That is a very tall
order. India just cannot catch up with Korea and several other
Asian countries ever. That opportunity is lost.8
What India can and ought to do is not to let the gap widen.
This means aiming at a two-digit rate of growth of per capita real
income, say by the middle of the decade of the 1990s, or at least
by the turn of the century.
The modifications to India's model made in the mid-1980s
were marginal. Even so, the earlier rate of growth of per capita
income doubled. The decline in poverty was never as steep as
during the second half of the 1980s (see Table 3). The literacy
rate rose from 41.42% in 1981 to 52.11% in 1991, which rate is
higher than any previous decade. The infant mortality rate
declined at more than the trend rate. Exports increased at an
annual rate of 11%, never attained in India's history before.
Unemployment declined during the 1980s (Minhas and Visaria, April
1991). The Indian capital market witnessed an unprecedented
expansion. Yet the liberalization process stopped soon after 1986.
So entrenched are stagnating sociopolitical forces in India!
The old development model is costing India so dearly that
any delay in the indicated change is going to make it more and
more difficult to catch up with even those countries which as of
3
now are only a few rungs of the ladder up above us, e .g .,
Thailand, Indonesia, perhaps potentially Pakistan.
In Section 2, we discuss the genesis and the content of
India's development model. Section 3 identifies the missing
critical factor of development in this model. Subsequent four
sections are devoted to some of the serious problems caused,
damaging vested interests nursed, and reactionary attitudes
generated in the process of the working of this model, and
possible remedies thereto. The theme of the higher desirable and
urgently needed modification of the model runs throughout the
essay.
2. India's Development Model
In the political arena. India was the first among half a
century or so of colonies to overthrow the yoke of colonialism.
That opened the gate for other colonies to win freedom.
Imperialist dominoes fell one after another. Within two decades,
almost all colonies became independent. India's nonalignraent
policy was adopted, by and large, by all the countries of Africa,
Asia, and South Central America.
In the economic field. India was a pioneer in ushering in
an era of development planning and consonant policies, which
started in the wake of the newly constructed first-generation
theory of economic development. With the objective of availing
themselves of what, in their informed judgment, was the best
offered by the East and the best offered by the West, India's
Founding Fathers embraced twin institutions of dflmocracz from the
West and centralized development planning from the Eastern Bloc.
Many countries tried to emulate India's democracy, not all
succeeded. Practically all developing countries adopted her
economic development model. The five-year plan became a symbol of
4

development effort and an instrument of economic policy across
three continents. Such was India's pioneering leadership!
In their desire to catch up with rich countries' levels of
living as speedily as possible, India's founding fathers, and the
postwar Indian economists in conformity to the first-generation
development theory, believed that the Soviet model of centralized
planning, tempered with the newly developed British model of
nationalization, was a short-cut to industrialization and economic
development. Democracy in the political field and central
planning, anchored on the state ownership of the "commanding
heights" of the econotoy in the economic arena (what they defined
as a "mixed econorcy" and the politico-economic structure as a
"socialistic pattern of society") were the twin guiding principles
enshrined in India's constitution.
Besides the Soviet experiment, theoretical underpinnings for
that development model were provided by leading development
economists of the day. Young and middle-aged economists of India
of those days were mostly graduates of the Cambridge School, at a
time when Keynesianism was reigning supreme. Both Kenyesianism and
the post-Kenynesian Harrod-Domar models emphasized the demand
side, in which the decisive role of prices in determining the
supply and allocation of resources was absent. (As every economic
student of today knows, that line of thought has suffered almost a
reversal.) In Latin America, Raul Prebisch's theory of permanently
worsening terms of trade against primary-producing countries led
to the implication of a strategy of forced industrialization and
import substitution. In Europe and North America, Nobel Laureate
Arthur Lewis's theory of the dual economy and Ragnar Nurkse's
theory of "balanced growth" implicated the policy of state
intervention for industrialization and resource mobilization. Tte
economic theories of self- sufficiency, if not autarky, of Bengali
intellectuals, who dominated the South Asian economic scene among
5

the first generation development economists (and still do in the
third generation) went even further. These included Mahalanobis's
consumption-restraining 4-sector model of heavy industry being the
anchor for exponential growth, Amartya Sen's theory of the choice
of technique to make machines that make machines, and, on the
heels of that, Sukhamoy Chakravarty' s growth paths aimed at
maximizing terminal capital, and similar models by others. With
very few exceptions, almost every celebrated development economist
of those days advocated the same approach: centralized planning,
public ownership, state monopoly, import substitution,
restrictions on multinationals, self-sufficiency, inward-looking
trade policy, heavy industry, neglect of productivity,
administered prices, various other constrains on the market, and
so forth.
A gigantic episode of the 20th century has been the collapse
of the Soviet politico-economic model, for which extreme
sacrifices were made and in which high hopes of the poor were
pinned. The modified economic development model of India, which to
a large extent was inspired by the Soviet economic experiment, has
also not performed well, at least not anywhere close to the
cornpeting models, for instance the East Asian economic model. Nor
have the Soviet-type models fared creditably in other countries.
In this respect, it may be noted that for empirical tests,
economists work with market-generated data mainly because they
cannot perform controlled experiments. Interestingly, in the area
of economic development, half a dozen almost controlled
experiments have taken place for a sufficiently long period of
approximately 4 decades, from the early postwar years through 1989
and beyond. In these experiments, almost homogeneous people of the
same background, culture, and genetic inheritance and their one
economy were subdivided into two separate entities and subjected
to two different development models, one free enterprise, the
other conmand economy. The results, from the application of the
6
methodology of the survivor technique, namely the success of the
former and the ultim ate bust of the la t t e r , need no
substantiation. Compare the one-time homogeneous parts of:
South Korea against North Korea,
West Germany against East Germany
Taiwan China against Mainland China
and less homogeneous but in many respects similar:
East Asia against South Asia
West Europe against East Europe
Kenya against Tanzania (See Tables 1 through 5).
East Asian countries started with their outward-looking
development model a decade or more behind the inward-looking model
of South Asian countries. They have already gained, or are on tbs
road to gain, the status of what the World Bank has categorized as
middle income developing countries. As compared to than some South
Asian countries, remain mired in the poor dump of the Third World
countries, while others have slipped down to the basket status of
the Fourth World poor countries. Besides, in East Asian countries,
on the whole the poverty incidence is lower than in South Asian
countries. They are, or are getting, tough in international
competitiveness. Several of them enjoy large trade and
balance-of-payments surpluses. The gap between their productivity
growth and ours is widening. Command economies by definition give
less economic freedom to the constituent units of a federation
than market economies. Over and above that their economic
performance is inferior. While command and poor economic
performance may not be the primary cause of fratricidal conflicts,
there seems to be a strong negative correlation between them,
inasmuch as conmmal and regional conflicts have all but died down
in Malaysia and Singapore, whereas they have perhaps never been
7
worse in South Asia's history, and are seriously threatening to
create chaos in India.
India policy-makers, whether or not they belong to that
group of "politicians who," a la Keynes, "believe themselves to be
quite exenapt from any intellectual influence (but) are usually the
slaves of some defunct economist", must be baffled. Indian
society seems helpless and resigned to the bad things around.
Indian econom ists have messed up the whole economic
superstructure. Will they rise to correct the course of the
economy?
As stated earlier, almost all South Asian countries have
followed the inward-looking model of India. Almost all East Asian
countries, with the exception of China, Vietnam, Cambodia, Laos
and, to some extent, the Philippines, have followed an
outward-looking approach. Comparisons of the relevant results of
these two experiments which have gone on for periods of 1 to 4
decades, are summarized in Tables 1 through 4. It may be seen
that growth is accompanied with the alleviation of poverty. On the
other hand, over-preoccupation with poverty by compromizing
growth actually amounts to sustaining poverty and missing both
growth and poverty.
Having observed these clear-cut contrasts, even those who
invariably used to take shelter behind the efficiency-equity
trade-off to support the command model must be wary of it,
inasmuch as East Germans, and with other East Europeans countries
for that matter, have evidently put much lower value on
socio-economic justice (assuming conmand economies had provided
higher levels of it) relative to growth than has been implied
heretofore.3
8
In hindsight, a possible explanation for India's right
choice of democracy was that tlie West's democracy model had been
successfully tested before. But the Soviet centralized economic
planning and the first generation theory of economic development,
on which India's economic model was based, were untested for
sufficiently long periods.
Thft mining rrHt.inqj factor
In TnHla's Tteralntmfflt Mcxfel
It must be stated to the credit of the early postwar leaders
of the India, that they were groping for a shortcut to growth with
economic justice. Their goals were lofty. Intentions were
honest. Efforts were genuine. Impatience with poverty and the
intense desire to catch up with industrial countries was
admirable. The first-generation theorists and practitioners
perceived that the market was not going to bring about economic
development automatically. The need for social and economic
infrastructure had a high priority, which only the state could
meet. Private saving in developing countries was so low that
public institutions to mobilize resources were considered critical
at that time. The expectation was that public enterprises would
generate surpluses for investment. Consistent with that day's
theory, priority sectors were investment-good-producing
industries, whereas profit maximizing private entrepreneurs were
considered to prefer investment in low-priori ty consumer-good-
producing industries and trade. The suspicion of the foreign firm
was genuine, as the bitter historical experience of the East India
Company was fresh in the minds of South Asian theorists and
planner. Future generations will find it hard to believe that a
single multinational, called East India Corcpany, with 1700 British
shareholders, first acquired trading rights and then conquered and
ruled Greater India for over hundred years before the British
Crown took it over after the unsuccessful Mutiny of 1857! India
started with an anti-poverty, anti-trade, anti-colonial, anti-
9
foreign investment, anti-big local firm, anti-consumer, and anti
rich sentiment and policy 4 decades ago, which approach persists
even today in all its facets.
In those times, capital formation per se was believed to be
a panacea for development. As a result, a sizable industrial base
has been built up, through its cost (in terms of what would have
been achieved though alternative development models) is not known,
but roast be very high as will become apparent in this note. The
country has thrown up large cadrer of competent entrepreneurs and
managers. While local entrepreneurs may have grown complacent or
even slothful under the shelter of high protection from foreign
competition, their mettle is sufficiently evident from the fact
that those who could get away from the over-regulation in India
have done exceptionally well in free enterprise economics. For
instance, the Patels have captured well over a quarter of
America's motel business within the span of one generation. A
remarkably high rate of saving of over a fifth of GDP has been
attained, despite the failure of public enterprises and budgets to
generate respectable surpluses. A well diversified training and
R&D capacity has been built up, though its quality and output per
unit of input are despairing. In short theorists clarified
important factors of growth, the practitioners modeled them into
operational framework, and policy-makers enacted and implemented
the implicated policies with great earnestness. What was modeled
seemed justified, at least for the early stages of developing
countries. But what was missing from it was critical, namely
pmrhvrH vl t.v and international competitiveness.
Hew Development. Kmmmina
When the first- generation development theory was
constructed, baby productivity was not bom yet. The birth of the
modem theory of productivity took place in 1957, when Robert M.
10

Solow [1957] startled the profession by a finding of his research
that (co-jointly with his related writings of the 1950s) was to
win him the Nobel Prize three decades later. The finding was that
primary factors of production— land, labor, and capital—could
explain no more than l/8th to l/3rd of growth in output in America
and other industrial countries. The rest was due to what he
called the "residual factor of productivity". Solow's "residual
turned out to be one of the most productive seeds ever sown in
economics. It gave rise to a bandwagon of research on productivity
growth and its sources, and consequently a new theory of economic
development.
Three years after Solow's discovery came the announcement by
another Laureate, T.W.Schultz [1960], of another hallowed
economics baby as the major source of productivity growth, that
was to turn around the entire economic discipline, causing
Paupperian intellectual revolution in economics, namely the modem
human capital theory. Laureate Schultz reported a very high rate
of return to investment in schooling over a long period, which in
part explained Solow's "residual".
When this writer published his book, Fertilizer in Economic
Dftvftlnprrant. (New York, 1968) a reviewer (and a few Indian friends
verbally) remarked that while the book contained an excellent
analysis, the contents did not justify the title that it was
anything but development. For I had concentrated on productivity
growth and the sources of technological change as the key sources
of development, rather than the accumulation of physical capital
per se. The new theory of development was in the making.
The interest in productivity and its sources soared during
the Development Decade of the 1960s. The theory of economic
development gradually underwent revision. In the new theory of
development economics, technology was recognized as the critical
11

factor of development, as is highlighted, among others, by the
late 1960s work by Hay ami and Ruttan (1977) and the more recent
study by Chenery and Srinivasan (1988).
3 . Thft Nfiglant. o f thft (TH t.i r»al Vanttvr
in In d ia 's Parol nmfifvh Mnrtel
By far the major determinant of growth, as Solow showed 33
years ago and other have dene since, is productivity. The main
source of productivity growth is technological change, where
technology is now defined as a combination of four components
namely technoware (hardware and software), humanware, infoware,
and orgaware. The major input for technological innovations, both
from domestic sources and from the adaptation of technology
imported from abroad, is R&D by high-calibre scientists and
technologists. The state of India's concern about industrial
technology and productivity may be. adjudged from three aspects:
the input side, the results side, and the policy side.
The incut side
From the input side, India has not done badly, as may be
seen from Table 6, where comparisons are made with Thailand (with
a lot of multinational presence) and Korea. The effort is,
however, dwarfed by that in Korea. Surprisingly, a good 18 per
cent of total R&D of India goes to industry. Yet results are very
disappointing. Only about l/5th of total patents in force in
India protect domestic patent holders. "Not even 10 percent of
Indian patents (or about 2 percent of total) have any significant
technological value" (CMIE, 1990, Table 11.7). Perhaps the fact
that 95% of R&D is used by the public sector ICS&T has to do with
it, inasmuch as the productivity of public sector institutions is
generally low.
12
India's inpressive progress in high tech is well-documented.
Its fruits in lowering costs and increasing productivity should
start appearing as the technology is d iffu s e d . But
productivity-increasing technologies and processes, which are
reflected in international competitiveness, are not yet in
evidence.
A more revealing picture emerges from the input in the
promotion of productivity per se, as distinguished from the
promotion of technology as the major source of productivity. Here
India has done very very poorly. It may be seen from Table 7 that
the rectification of the relative neglect of productivity in
India's development model has at best been cosmetic. Following
Solow's revelation of the critical role of productivity in growth
in 1957, India was quick and perhaps the first developing country
to establish a productivity council in 1958. The cosmetic nature
of India's productivity effort may be adjudged by comparing its
33-year-old productivity council against Singapore's productivity
board, which started 10 years behind India. With only 0.3 of one
per cent of India's population, Singapore has 255 experts on its
professional staff against India's paltry 200. The results are
not difficult to see. Go as tourist to Singapore, a country that
has little to show as tourist attractions: you come back pleased
with the quality of service and hospitality at low cost. Go as
tourist to India, full of sparkling, breath-taking tourist
attractions: yet you get inconvenienced and waste time unduly at
every phase from the airport to the hotel, to the tourist bus, to
the bank, teleconnunications, to the storekeeper, and you go back
frustrated with the quality of services and the productivity of
workers. The reputation spreads by the word of the traveller's
mouth to far comers of the world. Publicity for tourism is free.
13
Little is being done to increasing productivity. Our mental
horizon seems not to get away from our first-generation model of
development. How many product!vity-awareness sessions have, for
instance, been organized in India compared to the productivity
awareness weeks in Korea? Koreans have not been content with
their technology miracle in industry. They have organized
productivity weeks to create productivity consciousness by
appropriate training, demonstration, and inducement through fairs,
media, and seminars to not only factory, office, and shop workers,
but also the housewife, the artesan, the farmer, the student, and
all.
The results side
The change in total factor productivity (TFP) in India's
manufacturing sector—where TFP is defined as the change in the
ratio of output to all inpits appropriately weighted— is estimated
to be negative t ill the mid-1980s (Ahluwalia, 1985 and
Brahmananda, 1983, Salim, 1991). It was negative during the
1970's and 1980's in Bangladesh. TFP was positive 2 percent to 5
percent in several East Asian countries (WB, 1989). That means
the unit costs of production in the latter developing countries
fell at rates exceeding 2 percent to 5 percent per annum relative
to those in India, deteriorating India's export competitiveness
and import substitution. India tried to compensate for that by
increasing fiscal and financial assistance to its industry. That
caused increased snuggling and similar substitutes, besides huge
costs to the overall economy, which exacerbated industrial
sickness and lowered the potential rate of growth of the econony.
Indian manufacturers are not eager to stamp "Made in India" can
their exports, because they are downgraded in overseas markets due
to inferior quality. India's manufacturing exports declined from
0.6% to 0.4% of world exports from 1976 to 1983 at a time when
14

developing countries exports of manufactures rose from 15.9% to
17.5% of world exports.
Another index of the neglect of productivity in India is
evident from the fact that machines and equipment once installed
have almost invariably been subject only to physical depreciation,
but rarely obsolescence (rendered redundant and unproductive
through the arrival of superior new machines). Take the example of
India's steel plants.
India installed 3 best-practice steel plants by the early
1960s. They were due for renovation towards the close of the
1960s, but nothing was done. World technological change did not
wait, and by the early 1970s, Korean steel was selling in world
markets at half the production cost of Indian steel. The same is
true of several large paper mills and industries in general. The
incremental capital-output ratio in Indian industry has more than
doubled since the 1950s, thereby offsetting the gain of more than
doubling of the rate of saving. Sick industrial units increased
by 3123 percent and their outstanding bank credit by 521 percent
during the decade 1977-87. In the first half of 1990-91, the
reported losses of sick units amounted to Rs. 1526 crores.
India's high-cost economy and technology-gap have been topics of
debate for a decade. Even some Keynesians brought up in the
tradition of the Harrod-Domar models, have recognized the futility
of undue overemphasis on the quantity, as distinguished from the
quality, of capital formation. "The policy we have followed for
capital formation.., from the point of view of maximizing
productivity and the impact on growth, has been erroneous"
(V.K.R.V.Rao, 1983). When will India's policy-makers realize?
15

The policy process
The legacy of the 1950s development model of India is so
deeply rooted in the Indian economy, and the thought of accepting
followership by the traditional leader of the developing world in
economic development strategy is perhaps so demeaning that even a
quarter century after the revision of the first-generation
development theory and the well-documented experience of a much
more rapid development under the productivity-oriented East Asian
Development Model, the neglect of efficiency and productivity
continues unabated.
A few typical cases of this behavior may be cited to
underscore this state of affairs.
1. Perennial d e fic its , low productivity, and outmoded
technology continue in many public enterprises. When the
denationalization of 20 percent equity of public enterprises was
announced in March, 1991 (a good step forward), loss-making
low-productivity industries were not in the lis t , only
profit-making units were marked out for divestment. Competition, a
condition for efficiency, requires free entry and free exit. The
prevention of the exit and the sustenance of depressed units is
cancerous to the economy.
2. Scores of prices are administered, causing widespread
distortions and, hence, inefficiencies which reduce productivity.
A number of price- administering agencies (CACP, BICP, Public
enterprises, and so forth) fix prices. India's bureaucracy has
been entrusted with a vast network of micro economic management.
The practice that supports inefficiency in India, apart from
supplanting the resource allocation role of the market, is that
administered prices have little relationship to relative
scarcities or opportunity costs, such as the true resource cost of
16
production of power, shadow wage rate, and market rate of
interest. Nor are administered product prices related at all to
border prices. Agricultural support prices are fixed on cost-plus
basis, where costs have no benchmark of opportunity costs. How is
one to know whether the crop being subsidized has relative
comparative advantages? View the case of rice in rain-scarce
Punjab, for which an average of 22 irrigations are needed and
whose cost is based on subsidized electricity at approximately
1/11th the cost price of power; subsidized prices of irrigation,
water, which do not cover even the recurrent costs of irrigation
works, not to speak of capital costs; subsidized seeds; subsidized
fertilizer; as well as rice's share of interest subsidy and
default subsidy [Gulati, 1991]. With these subsidies rice is
crowding out wheat which needs only 3 irrigations.
The price of fertilizer, in turn, is determined on the basis
of administered prices of natural gas and other inputs, and is a
sort of an average of the "retension prices" of different plants,
thus supporting inefficiency in the fertilizer industry.
Fertilizer industry uses feedstocks and machinery from distorted
markets. The machine-making industry consumes steel and other
materials at similarly distorted p rices . It is a web of
administered prices which are subject to high standard errors,
even if these were relevant.
The calculated prices with cumulated standard errors are
supposed ultimately to allow the farmer to earn 5 per cent to 10
percent rates of return. What an undertaking for fine-tuning!
3. Practically the only valid economic reason for protection to
an industry is the infant industry argument, namely that a new
industry (having potential comparative-cost advantage) ought to be
protected from foreign competition, in principle for 10 to 15
years, to enable it to lower its cost per unit of output through
17

reaping economies of scale and other benefits of specialization
and gaining a foothold in markets. The industries of India have
enjoyed protection for extended periods of 3 to 4 decades by now.
Still they remain noncompetitive and survive on protection and
subsidies. The remedy has, indeed, become a cause of the malady:
protection has obviated the need and removed the pressure to
become efficient, raise productivity, and renovate and adjust, on
the one hand, and has increased sickness by making snuggling and
clandestine inports highly profitable on the other hand. Yet the
indicated protection and import substitution policy is continuing.
The recent trend from reliance on quantity restrictions to tariffs
is to the right direction, but India has one of the highest tariff
walls in the world today (see Table 1).
4. Subsidies cause excess demand, price distortions, and
inefficiencies. The social costs of subsidizes industries are
usually very high. India has burdened itself with one of the
heaviest subsidy programs in the world. Her major subsidies, as of
1988-89, include the following:
Subsidy, to agrtoaltAiiral sector(Source: Gulati and Sharma, 1991) Rs Crores
1. Fertilizer subsidy 3,354
2. Irrigation subsidy (maintenance and operation costs plus the annualized capital cost of irrigation works netnet of revenues) over 10,000
3. Electricity subsidy (an underestimate, defined as the difference between average cost of electricity generation and distribution per 'unit sold minus average revenue per unit to agriculture) to agricultural sector, which consumed 26 per cent ofnational electricity in 1989-90 3,475
4a. Interest subsidy as % of loans: 4.5% NA
18
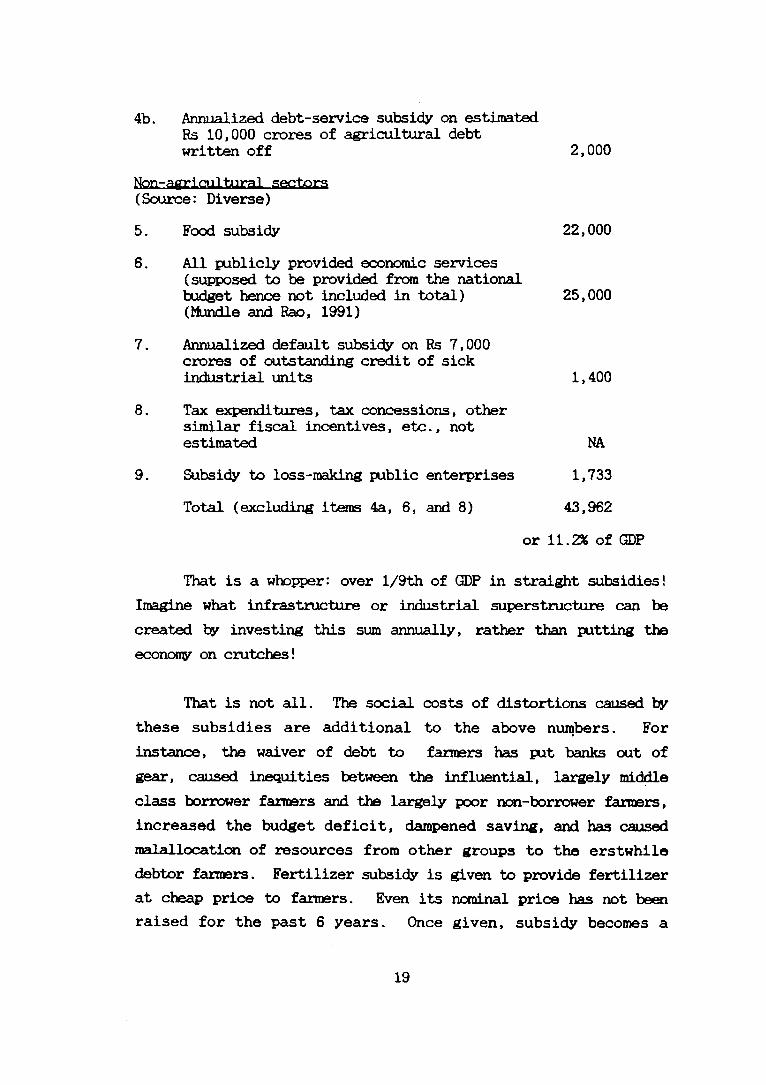
4b. Annualized debt-service subsidy on estimatedRs 10,000 crores of agricultural debt written off 2,000
Non-agri miltural sectors (Source: Diverse)
5. Food subsidy 22,000
6. All publicly provided economic services (supposed to be provided from the nationalbudget hence not included in total) 25,000(Mundle and Rao, 1991)
7. Annualized default subsidy on Rs 7,000 crores of outstanding credit of sickindustrial units 1,400
8. Tax expenditures, tax concessions, other similar fiscal incentives, etc., notestimated NA
9. Subsidy to loss-making public enterprises 1,733
Total (excluding items 4a, 6, and 8) 43,962
or 11.2% of GDP
That is a whopper: over l/9th of GDP in straight subsidies!
Imagine what infrastructure or industrial superstructure can be
created by investing this sum annually, rather than putting the
economy on crutches!
That is not all. The social costs of distortions caused by
these subsidies are additional to the above numbers. For
instance, the waiver of debt to farmers has put banks out of
gear, caused inequities between the influential, largely middle
class borrower farmers and the largely poor non-borrower farmers,
increased the budget deficit, dampened saving, and has caused
malallocatlon of resources from other groups to the erstwhile
debtor farmers. Fertilizer subsidy is given to provide fertilizer
at cheap price to farmers. Even its nominal price has not been
raised for the past 6 years. Once given, subsidy becomes a
19

politically sacred cow. Recently India's next-door neighbor,
Bangladesh, has privatized fertilizer distribution (among scores
of traders) and has eliminated subsidy. The result? The real
price of fertilizer has come down despite elimination of subsidy.
So rruch was the waste and inefficiency of the centralized public
distribution system. Can India take a lesson?
Many more types of policies can be cited, but the point has
been made. The long and short of the discussion is that
practically none of the policies under the Indian development
model are productivity-promoting. Protection, controls, subsidies,
too much regulation, too many licenses, administered prices,
nationalization--all nurse inefficiencies and cause low
productivity. To reform these policies, the fundamental
development model needs to be revised.
Next we turn to some of the special areas where present
policies are causing grievous harm to the economy and where reform
is urgently needed.
4. Corruption— Inherent or Policy Caused?
Correct remedies of economic ills call for correct
diagnosis. A fundamental trait in which the economist differs
from other social scientists/scholars is his way of thinking to
identifying cause-and-effect relationships. The economist's
comparative advantage over other social scientists/scholars lies
in discovering hidden costs and hidden benefits, and hidden causes
and hidden consequences of occurrences, something not directly
visible here and now, but which depends upon the changes in
people's behavior when they react to policies and imposed
solutions to problems. In this section I will discuss a serious
malaise of the Indian economy which critically impacts efficiency
20

and productivity but whose root cause and, therefore, effective
remedy allude us for lack of correct diagnosis.
The reference is to corruption. particularly illegal
corruption in sm uggling, b r ib e ry , tax evasion , and
black-marketing, and legal corruption in the form of rent-seeking.
Almost every Indian friend I have talked to on corruption
asserts that we are the most corrupt people in the world.
Interestingly, I have heard similar statements from the people of
a number of other countries, about their respective country having
the highest corruption in the world: Nigeria, Panama, Brazil,
Bangladesh, Nepal, Indonesia. This kind of impression is held
particularly by those individuals who have not been outside their
own country, to be able to rank their personal experiences and
observations. Space does not permit description of corruption in
different countries. An instance of a single case should put the
level of corruption in India in perspective.
The present writer was in a foreign country in 1981, at a
time when the country's civilian government was a few months old,
after the military had gone back to barracks. Newspapers carried
a story daily about a missing sum of 2.3 billion US dollars out of
a total petroleum export value of US Dollars 10 billion of the
previous year. There was little clue to where it had evaporated.
After severed months inquiry, it was discovered that the money was
found in the Swiss account of a senior general. Within about 2
months the final verdict came: the money (to repeat 2.3 billion
dollars) was alleged to have been deposited in that account
through a "clerical error". The money was recovered and the case
was closed. Nothing happened to that general, who continued
serving without any demerit. Compare it with the Bofors case in
India in which mere suspicion of half a billion dollars in illegal
commission dislodged an entrenched popular party from power and
destabilized the country.
21
Novelists are unique in perceiving the life, culture, and
things of a people correctly, inclusively, and expeditiously.
Khushwant Singh is a great novelist and political interpreter of
India today. He has also travelled abroad. Therefore, what he
writes may be taken to represent the general view of Indian life
and behavior. But he is not an economist. As discussed earlier,
an economist is one who has analytical training to discover hidden
consequences and hidden causes. At the risk of appearing inmodest,
rqy own experience and the application of economic propositions to
corruption prompt me to agree with Khushwant Singh on the level
but disagree with him on the causes of corruption as given in his
Me Indians (4th reprint 1990). According to him, "the scarlet
thread of bribery and corruption runs through the fabric of our
society," and "the roost important single cause for corruption is
economic insecurity, and that the most potent cause of corruption
in the administration is the meager wages drawn by government
servants. . . ," though he is right when he qualifies the latter
statement by "[relative) to the power they w ield ." It is
undeniable, however, that "we have established a black record of
corruption", (pp. 85-96)
Theories of corruption
Corruption is an unproductive activity and reduces
productivity and growth. To understand its root causes is
extremely important. Let me suitrnarize the economic theories of
the root causes of the major forms of corruption. Corruption will
in general be higher ths higher the anticipated return and the
lower ths cost and the risk of getting caught, or the higher the
chance of bribing out the law-enforcement agent if caught. In
India, the profit from those activities which are generated by
licenses, controls, and similar restrictions are high while the
risk of getting caught and not- being able to grease the palm of
the law-enforcement personnel is very low. The important point to
22
be noted is that the indicated high profits and low costs of
corruption are not inherent in the Indian society but are created
by government policies, which are inmiserising even on standard
economic grounds. The root cause of smuggling and the related
forms of corruption is high protection of domestic products from
foreign imports, such as high tariffs, import quotas, foreign
exchange controls, and bans and quantity restrictions of various
sorts. High profits of smugglers enable them to carry on their
activities by bribing the customsman, the policeman, the
bureaucrat, the politician, and even the judicial man. The root
cause of black marketing is price and quantity controls, high
marginal tax rates, and the like. The root cause of rent-seeking
(The UDP of Bhagwati and Srinivasan, 1982 ). is licenses,
sanctions, franchises, permits, and sinilar instrumentalities of
controls. Since most of these instrumentalities and regulations
are administered by bureaucrats, they are aware of the high gains
and naturally get tempted to share in the easy and abnormal
returns from these activ ities . Nepotism mushrooms when
accountability is low. Naturally, nepotism tends to be high in
public enterprises. Politicians chip in. For after all they
think they are the bosses of bureaucrats.
To conclude, (1) yes, Khushwant Singh, corruption is rampant
in India. But no, Khushwant Singh, in all probability corruption
is not inherent among Indians any more than it is in other
societies of comparable economic status and similar policies. (2)
Corruption is largely caused by India's policies. India has those
policies galore which cause corruption: high protection that
causes smuggling; maze of price (including urban rent), quantity,
and other controls and regulations, which cause black marketing;
high marginal tax rates on income and wealth, which send money
underground; plethora of licenses, which promote rent-seeking; a
very large number of massive public enterprises, with fax
accountability, which facilitates nepotism and cause inefficiency;
23
and so forth. Despite the alleged widespread political corruption
from the political worker through the MP and the Minister in
India's democratic system, I would venture to adjudge that it is
nowhere as bad as in non-deraocratic systems. In India, at least
you can get questions asked in the Parliament and take your case
to the court and expect justice. In non-democracies, you
generally cannot even do that. You raise a finger at a
rent-seeker, either the taxman or the policeman or someone else
may be knocking at your door the next morning. Of course
vigilance is the price of freedom, one must not stop one's
criticism simply because other countries have worse corruption.
Corruption rannnt. hft nrit.igat^ri
without cutting its nx>ta
The theory of corruption outlines in the preceding 2
paragraphs creates serious doubts about the efficacy of the kind
of solutions usually suggested, such as that by Khushwant Sings,
namely that to eliminate snuggling, "both the snuggler and his
client mist be severely punished," as long as the root cause (high
protection and exchange control) is not eliminated. Has not the
mightiest of the mighty superpowers, the US, tried its hardest by
severe punishments to stop snuggling of drugs into America? It
has put a huge coast guard out which combs the oceans around the
US coasts and flies its planes all around its borders. It has
sent its military to Colombia, Venezuela, and its intelligence to
other countries, and has helped local governments with technology
and money to stem other snuggling at source. It has subjugated
Panama and arrested that country's military dictator and alleged
snuggling lord. Has it stopped drug snuggling? May be a little,
but one can buy as much of drugs in the streets of New York and
other US cities, as one wants, even when drugs are considered bad
for health and social behavior. Smugglers still bribe the
American coast guard. Profits are high, so is corruption in this
area. Why is Singapore relatively less prone to snuggling and
24

black-marketing? It has none of those controls and tariffs we have
talked about.
The notion that Indians are inherently corrupt serves
actually as a red herring that distracts attention from
discovering its true causes. It tends to develop self-pity,
helplessness and a complacent attitude that nothing can be done,
except punishment of offenders. In one breath, for instance,
industrialists will castigate the administration for not doing
enough to stop smuggling. In the same breath they will ask for
more protection and stricter quantity controls on imports of the
products they produce.
Oily if it is understood that corruption is caused primarily
by certain policies and is not inborn nay social pressures build
up to reform those policies. The following measures, which cannot
be substantiated here but are evident enough, given the preceding
discussion, and may be provocative to some, will drastically
reduce smuggling, black-marketing, and other corruption, reduce
inefficiencies in the economy, and lead to higher productivity and
growth:
1. Legalize snuggling. That is, let there be free trade (including that in foreign exchange and gold). Impose a uniform tariff of, say, 15% on all imports, to collect revenue.
2. Legalize black marketing. That is, let people buy andsell all commodities openly and freely. Marketequilibrium price (where supply equals demand) will prevail. Controls on all prices, including rent control and foreign exchange control, will have to go. In the long run, losers due to decontrol and derationing will also gain.
3. Eliminate most licenses and sanctions. Auction(rather than assign) those licenses that must be retained. Rent-seeking will evaporate. People will spend less time on unproductive activities and negative-sum games, and more on productive activities and positive-sum games.
25

4. Divest/denationalize those public enterprises, which produce private (as distinguished from public) goods. Bust all public and private monopolies (except where international competition makes them innocuous and internationally more competitive). Let competition prevail. Nepotism and corruption of the bureaucrat and the politician will dwindle to insignificance. Productivity will go up.
5. Reduce marginal income tax rates to no more than 40%. Abolish wealth tax or lower its rate drastically. Much of black income and black wealth will become white. Revenue is unlikely to suffer.
6. Eliminate subsidies. Government's house will be put in order. Inefficient firms/industries will shut down. Health will come to the economy.
7. Let loss ventures go bankrupt and let sick firms die. Cheating and taking undue advantage of concessions and reliefs will go. Some corruption will still remain, but a lot less.
5. Will Privatization Per Se Remedy the Situation?
Productivity and efficiency are notoriously low in the
public sectors of any country (with the possible exception of
Singapore where public enterprises are fully exposed to
competition from abroad). A large number of public enterprises of
India is depressed. At the same time, a lot of industrial
sickness prevails in India's private sector, too. Almost
three-quarters of India's small sector (private and supposedly
competitive) are estimated to be sick. Prima facie, therefore,
privatization is not a panacea for industrialization. But that
judgment is probably premature, because India's private firms have
not been allowed to function in a free-market environment. There
are well-recognized pre-conditions that must be established for
the private sector to function.
26

Twin theorems of efficiency
Markets for private goods work best in competitive
ptnvi ronment. The touchstone is economic efficiency. Defining
efficiency in production as an organization in which no change in
technology or technique of production or recombination of
resources can produce more output value, the two well-known
theorems of efficiency may be stated as:
1) Any competitive market equilibrium is efficient
2) Every efficient allocation is a market equilibrium
Corresponding to these efficiency theorems there are two
welfare theorems:
a) Every efficient allocation is a welfare maxirrura
b) Every welfare maximum is an efficient allocation
Finally, recall the " Zero-profit theorem", according to
which, in the absence of a stream of technological changes or new
superior resources, competition reduces economic profits to zero.
Each factor of production tends to receive its marginal product.
That is efficiency and, according to a theory of justice, also
equity.
Why most of India's private firms are not internationally or
even nationally competitive is because, among other reasons, they
have been removed from the competitive domain. The prices of a
large number of private enterprises are administered by
government. They cannot invest freely. They are restricted from
expanding capacity to what they may adjudge optimal levels; from
broadbanding products; from exiting from one product and entering
another; from locating where they prefer; and from importing
machinery and their inputs at world prices. They are prohibited
from producing any of the 863 products reserved for the small
27
sector and several more reserved for the public sector. The small
firms, in turn, enjoy various tax concessions and other assistance
if they stay small, and lose them if they grow. That is not a
competitive free-enterprise environment in which alone private
sector can flourish. Private firms operate in a byzantine maize of
regulations. Until a lot of deregulation and freedom of enterprise
takes place, India's private sector cannot become a benchmark of
efficiency. Therefore, no significant improvement in either
productivity or growth may be expected.
An experiment in privatization in South Asia
The success cases of (partial or full) privatization of
cement in India and fertilizer distribution in Bangladesh have
already been discussed. There are unsuccessful cases also. A
substantive experiment with private and public firms in the same
industry has taken place in a country that has followed the South
Asian Development Model. In Bangladesh, about half of the 70 to
80 plants of each of the jute textile and cotton textile
industries were denationalized during 1982-83, the first year of
the reign of former President Irshad. Till 1990, private plants
were found to have done no better than public enterprises (Sahota,
1991). Many lessons sire to be learnt from that experiment. Apart
from the restrictions discussed in the preceding paragraph, in
Bangladesh's denationalization process, two critical preconditions
were ignored.
1. The change was brought about without adequate analysis.
The deficits of public enterprises of the early 1980s appear to
have goaded the government on to get rid of some public
enterprises at any cost. Several experts believe that the
problems that are plaguing the denationalized firms could perhaps
have been avoided had its first phase— namely analysis, policy
design, and information— been duly carried out. The problems
28
being faced in 1990, six years after the denationalization,
include:
The continuing dispute between the new private owners of
denationalized industries and the public sector about the
assumption of liabilities incurred by these industries since
nationalization in 1972; default on installment payments by the
buyers of public enterprises; difficulties that banks face due to
low rates of recovery from new owners and having to waive some of
their accurrulated interest; and problems that private owners face
concerning foreign loans due to exchange rate changes. The 1915
contract laws according to which these transactions were made need
to be modernized. Similar problems relate to the 1960s law
concerning the banking business, and similar legal and procedural
matters. Some experts believe that the second-generation private
entrepreneurs were not yet experienced enough to manage large
enterprises. They themselves had not cultivated the industrial
culture of dealing with DFI credit, labor, public officials, and
the like. Their debt default probably did a great damage to
industrialization. Even during 1985-86 and 1986-87, when proper
penalties and legal process was established for dealing with
defaulters and when donors had set conditions for further loans,
the recovery rate did not improve: it was 8% for BSB and 13% for
BSRS (Rehman Sobhan and Binayak Sen (1989). The overwhelming
evidence of the inefficiency of Bangladesh's public enterprises
and the swelling international environment favoring the change
could not obviate the need for the requisite analysis and the data
needed for such major policy shifts.
This is not an isolated case. The neglect of analysis seems
rather general in South Asian countrt.es. Sometimes it appears as
if policy makers and bureaucrats either doubt the practical role
of analysis or tend to downgrade research in general. One wonders
how much economic analysis can have preceded the decisions taken
29
in India regarding the waiver of agricultural loans in presence of
staggering budget deficit; the quota fixation for Scheduled
Tribes, without regard to the already low efficiency levels of
government services; the raising of already high tariffs in tte
late 1980s at disparate rates; guaranteed employment to every one
who seeks it, as if that is possible and as if self-help,
self-employment is a taboo; the proposal by the Chairman of the
Standing Advisory Council to establish parity between tbs incomes
of jawans and kisans; and various promises made by politicians
during elections!
2. As discussed before, private markets operate most
efficiently under competitive conditions. Little attention was
paid to competition when denationalization was carried out,
whether within private firms, within public firms, or between two
sectors. In the latter area, private entrepreneurs feel that
whatever competition there is is unfair, inasmuch as public
enterprises enjoy certain facilities not available to private
enterprises and the former also set wages for the latter, though
indirectly. There is no trust-busting in Bangladesh. It is
well-known that while there is an economic role for a public
monopoly, there is hardly an economic case for a private monopoly,
much less for a highly protected private monopoly.
The result of both of these drawbacks has been low
efficiency and poor performance of the private sector.
Denationalization is really not in question today. It is
how you do it, analyze it, phase it, sequence it, monitor it, and
what accompanying changes are in order.
30

r.arfc o f (Vnpftt.1t.1on i s th ft r a i nhit, nat thft miff raason for the
of n ih U n Pnterorisfia
There are 3 main reasons for the inefficiency of
private-good-producing public enterprises relative to private
firms:
(1) nf competition.—The key factor is competition.
Public enterprises have been insulated from competition not only
in being largely monopolies but also through no requirement of
accountability and profitability. Many economists think that
exposing public enterprises to competitive environment, by
allowing them independence and discretion, by imposing
accountability, and by withdrawing all support (except to defray
the estimated costs of the imposed social service part, if any)
will enable them to function efficiently and to compete with
private firms. While exposure to competition, especially when
entry and exit are also free, will go a long way to enhance
efficiency , policy-makers and economic advisors may be
disappointed, if public enterprises are not privatized, due to the
following two additional reasons:
(2) Rirftanrratlc red-tapism and sloth.—Anv public entity
has, in one form or another, to function under bureaucratic rules.
Even divested public enterprises will remain under bureaucratic
influence in India if ths governments retains 51 present shares.
Bureaucracy is inconsistent with entrepreneurship. Bureaucracy
works best when it functions by the rules. Discretion and
arbitrariness in government matters opens up windows for
corruption. Bed tapism, slow movement of files, risk aversion,
and sloth in general are typical bureaucratic characteristics.
Quite the contrary are the traits of entrepreneurs:
discretion, gut feeling, animal spirit, risk-taking, and speed.
The twin shall never meet.
31
(3) Political Interference. —Politicians have no masters.
They are the bosses of bureaucrats. Public enterprises provide
them a means to distribute rewards to their supporters through
nepotism, and interference in fixing prices and influencing
marketing transactions. For instance, in a South Asian Country*
while an ex-general was its President, several ministers were
retired generals, many chairmen of corporations were retired
brigadiers, and numerous license holders were colonels. In many
public enterprises of that country employment increased by almost
50% while their output remained unchanged since they were
nationalized in 1972. As another example, if the Indian
Government were small in size and public enterprises were divested
(currently the government accounts for 71% of the organized-sector
jobs), the caste-based job quotas will lose their significance and
may become a non-issue.
In short, to gain maximum efficiency and productivity, which
is essential for international co m p etitiv en ess , while
accountability and autonomy in public enterprises will certainly
do some good, there does not really seem any half way house
between nationalization and privatization. The country has to go
the whole hog to privatization. The process must be accompanied
by both trade and domestic liberalization.
6. Let Nan-Viable Sick Firms Shut Down
As stated above, industrial sickness and the deterioration
of productivity are not the monopoly of state enterprises alone.
Private firms also get depressed. More dynamic firms grow. Less
efficient ones become sick and die. The process, indeed,
r e p r e s e n t s t h e h e a l t h o f an economy and is
productivity-increasing, unless depressed units are sustained by
government. In India, sick units have increased from 20,000 in
32
1980, to 158,000 in 1987, to 217,000 in 1988, causing problems for
banks and playing havoc with national productivity.
The loss from sustaining high-cost industries cumulates to
much higher values in a few years than the one-shot cost of
scrapping them. After all, machines get old and obsolescent.
Sick firms should be let to die to keep the economy healthy.
There are costs of scrapping firms. Bankruptcy is costly
and has major ramifications in terms of labor and financial
markets, especially when a depressed unit is very large. Who
should bear the ultimate burden of adjustment: workers?
shareholders/owners? creditors? customers? taxpayers? How have
other countries had their depressed industries eliminated? How
have they tackled their problem of sick industries? Four patterns
can be identified:
The Western solution for depressed industries.— In America,
depressed firms are usually bailed out by guaranteed and
concessional credit and similar relief. The cost is generally
borne by the taxpayer. Depressed giant firms are saved from going
bankrupt, provided they can renovate. American automobile and
steel industries of the past two decades are instances. But
recovery is not always successful.
Protection and quotas are also selectively used. For
instance, the high-cost ready-to-wear garment industry of the
United States is sustained by, more or less, successfully imposed
quotas. Under this policy, the American consumer meets the cost.
Such measures rarely enable the industry to become healthy and
compete against imports.
33

The Indian remedy for depressed industries — TnHi* follows,
more or less, the American procedure by giving various financial
and other concessions and reliefs, mostly by banks, but also by
government, labor, and promoters. Pursuant to the Sick Industrial
Companies Act, 1985, the BIFR started functioning in 1987 as
advisory body to suggest measures for the rehabilitation of sick
units. The BIFR rehabilitates sick units by essentially freeing
them of their bad debts,entailing loss to banks, FIS, and center
and state governments. In America, financial concessions are given
to a big firm, e .g ., Christler. or whole industry, such as steel,
specifically to enable it to renovate and modernize. Yet ths
American solution has really not succeeded. In India firms can
get relief even without any action to modernize. As a matter of
fact, Indian relief and concessions are believed to encourage
loss-making units to call themselves sick. Indians are thus less
likely to succeed than Americans. In contrast, the Japanese have
done extremely well in getting rid of their depressed industries
within short time periods.
The Japanese solution for depressed industries.— Japan
follows a somewhat different approach. Instead of sustaining
depressed firms, she assists them to close down or become
competitive technologically and otherwise. Faced with large scale
excess capacity in several of its major industries in the late
1970s, Japan enacted the 1978 Law: 'Temporary Measures for
Stabilization of Specific Depressed Industries'. It was a
temporary measure for 5 years. Due to the 1979 second energy
crisis, however, it was extended to 10 years. With rather small
cost to the taxpayer, Japanese government coordinated the phased
closure of firms. Supply was reduced, prices went up. A good
part of the cost was, thus, passed on to the consumer through
temporarily permitted "recession cartels." Government subsidy was
paid to firms for the retraining, retirement, and relocation of
workers and honoring bank loauis. The Japanese' success in
34

scrapping excess capacity may be seen from Table 8: approximately
90 percent of targeted excess capacity was eliminated in 5 years.
India is currently expanding its shipping capacity. It
needs take note of the fact that technological superiority of
shipbuilding in certain countries, e .g ., Korea, that depressed the
Japanese entrenched shipping industry can also depress India's
unless it instals the best practice technology and pays serious
attention to productivity and quality.
For small industries, Japan passed the Smaller Enterprise
Switchover Act, 1976, in which seme incentives were provided sick
units to switch over to other, technologically more modern
activities than the one which was depressed, rather than
assistance to close down. Recovery from sickness requires
continual technological upgradation.
Naturally, market forces would have eliminated the excess
capacity more thoroughly and expeditiously. The burden would then
have fallen on owners, workers, and financiers, and none on
taxpayers. That would jolt up three groups to be continuously
vigilant and to take action to improve the productivity of their
units. As Milton Friedman stated once, the market eliminates over
95 percent of failure cases efficiently and most expeditiously,
while the state shelters an equally large percentage sustaining
inefficiency . Stagnation becomes deeper, the longer the
inefficient firms are prevented from shutting down. The wider
ramifications which we have just mentioned, however, call for
phased action, coordinated by government, as in Japan.
Who is likely to bear the burden of technological
upgradation under the indicated solutions and what the chances of
potential revival of the industry concerned are expected to be are
roughly given in Table 9.
35

The point to be noted is that Japan got rid of its depressed
industries by closing them down. As a result, she remains highly
competitive internationally. America tried to get its depressed
industries (steel, automobile, garment, etc . ) revived and
renovated through financial and fiscal concessions. While she has
recorded significant improvement, she has really not succeeded in
becoming internationally competitive.
Socialization of nationalised firms.—For the placement of
displaced workers, two methods, among others, are candidates: (1)
The Japanese method of retraining, relocating, and retiring
workers, even if it involves a golden handshake. (2) A method
suggested by this author in his book on Poverty 1990,
particularly for nationalized sick industries. The employees of
public enterprises are usually privileged workers who are
subsidized via their enterprises, deficits being underwritten by
the nation through the public exchequer.
The procedure is to socialize the nationalized industry. By
this I mean to auction it, i .e ., to sell it at the market bid
price, to the firm's workers with upto 100 per cent loans, if they
resist its sale to private owners. Strict loan recovery is
required. A part of assets will have to be written off. The
nation may suffer a one-shot loss. But it will not be required to
write off its annual losses after that. If workers are unwilling
to buy (even at 100 percent loan), they will lose moral basis for
opposing someone else buying the plant for scrap value or
rationalization. The message of this proposal is to find some way
to get rid of the sick units of depressed industries.
Because of the long technological lag and her high-cost
industry, the most appropriate solution for India seems to be the
Japanese method. Workers' control is a possible way out to meet
resistance by workers. How to overcome political opposition and
36
bureaucratic resistance having created their vested interests over
the past 4 decades is beyond the specialization of this writer.
An intensification of national debate on the issue among
economists should, in the long run, bear results.
7. Poverty Alleviation: Creating Earning Capacity Versus Job Quotas for
Pbverty Groups
Long-run poverty can be alleviated only by growth and
productivity and by enhancing the earning capacity of the poor.
The most effective and well tested method of increasing the
earning capacity of the poor is their education and skill
formation. The demand for labor, in the ultimate analysis, is a
function of economic expansion and the employability of workers.
Transfer of jobs from the more qualified to the less qualified
workers under job quotas is a negative-sum game. It will hurt the
poor in the long run, even if it is the poor (as distinguished
from the middle-class lads of the backward tribes) who can land
the quota jobs.
Education has been used in other countries as a
multi-purpose strategy: to alleviate poverty, break racial
discrimination, prepare trained labor, develop social cohesion,
increase growth and productivity, and enhance the earning capacity
or productivity of workers across all income levels. As a program
to break the cycle of permanent poverty and promote long-term
growth, preschool education shows high premise in general for any
country. Citing from the findings of a study of poverty in
Panama, poverty, underemployment, low-productivity occupations,
h igh f e r t i l i t y and ch ild m o rtality , h igh ch ild and
spouse-dependency rates, and one-income families are strongly
associated with low schooling levels. Over 31 percent of children
in Panama are in critical poverty compared with 20 percent of
persons in critical poverty. The percentage of children not
attending school is much higher in poor families than in nonpoor
37

families. It is found that the high dropout rate, relatively low
grades, high rate of repetition of school grades, and low
motivation for school among the children of poor families are
largely due to poor preparedness for school, especially for
primary school. Over half among the over 400,000 homeless people
of England are children. One of the most effective measures for
school preparedness for poor children is preschool education.
These results are consistent with the findings of
experiments on preschool education with control and noncontrol
groups of children in other countries. For instance, in the
United States, the Head Start (preschool) Program for the children
of poor families was started as a part of the Democratic
Administration's War on Poverty in the late 1960s. With a view to
ensuring a high quality of preschool education and evaluating the
effectiveness of the War on Poverty, eleven models were developed
at various universities in America to carry out separate
controlled experiments and generate panel data for analysis. In
1975 the developers of these eleven models formed a Consortium for
Longitudinal Studies. The results of their experiments and
analysis started coming out in the mid-1980s. They provide strong
evidence that preschool education of children from poor families
significantly reduces the high-school dropout rate and increases
the probability of completing high school with significantly
improved grades and scores. Preschool education has been found to
lessen teenage pregnancy (another cause of school dropout), to
diminish crime, and to increase the will and capacity of these
persons to seek and hold nonpoor jobs. The groups that attended
preschool were more independent and used less public assistance
and welfare.
The results above are now considered more or less conclusive
and are well documented. What is not yet widely known is the
finding of research that school quality benefits the less able and
38

poor children more than the more able pupils and that preschool
education has considerably higher productivity for poor and less
gifted children than for more able and nonpoor children. Students
who need the most help in preparing for school are the ones who
gain the most from high quality intervention at the preschool
level.
Elementary and high school education will also require some
additional assistance to children from poor families whether from
backward classes or high castes. Job quotas lower efficiency
levels and reduce long-run growth. Preschool education for poor
children enhances their earning capacity and raises the sum total
of national efficiency. Job quotas are not likely to make any
impact on poverty. Preschool education of poor children is a
poverty-alleviating program par excellence and will serve backward
tribes far better than reservation of jobs. It will increase the
efficiency of the economy and the productivity of labor and other
resources.
The conclusion of this paper is that India's development
model has become outmoded and needs to be modified urgently. The
longer we delay to change it, the wider will grow the gap between
us and those developing countries which have adopted the
internationally competitive, "zero-defect," productivity-oriented
model— from Korea, Hong Kong, Taiwan, to Thailand, Malaysia,
Singapore, through Indonesia. The adoption of the new model
requires, among other changes, trade and domestic liberalization;
higher resource allocation to R & D, including the import and
adaptation of best-practice technology; denationalization of
private-good producing public enterprises; abolition of most
subsidies; and decontrol, delicensing, and deregulation of the
private economy. Productivity of everyone needs to be improved.
In the open economy of today, a 2 percent per annum rate of growth
of TFP is just enough to keep pace with others. A golden rule in
39

internationally competitive dynamic firms, which Indian firms
ought also to emulate if they want to compete internationally is:
"Make your firm's technology obsolescent at a rate of at least 2
percent per annum, otherwise someone else will".
40
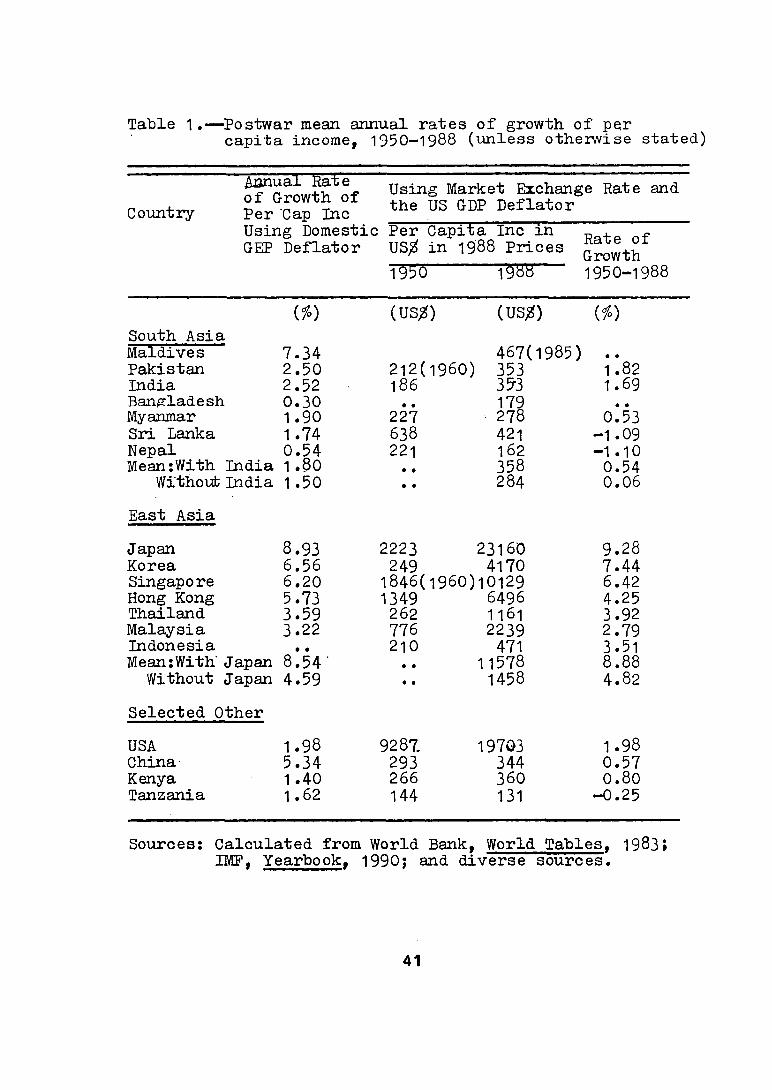
Table 1 .— Postwar mean annual rates of growth of percapita income, 1950—1988 (unless otherwise stated)
^ n« al Using Market Exchange Rate and
Country Per Cap the as GDP Deflator_______________
Using Domestic Per Capita Inc in p , -GEP Deflator US# in 1988 Prices -®1
Growth1^50 T O T 1950-1988
South Asia
w (us*) (US*) (* )
Maldives 7 .3 4 467(1985) • •
Pakistan 2 .5 0 212(1960) 353 1.82India 2 .52 186 353 1.69Bangladesh 0 .3 0 • • 179 • •
Myanmar 1 .90 227 278 0.53Sri Lanka 1.74 638 421 -1.09Nepal 0 .5 4 221 162 -1.10Mean:With India 1 .30 • • 358 0 .54
Without India 1 .50 • • 284 0 .06
East Asia
Japan 8.93 2223 23160 9 .28Korea 6 .56 249 4170 7 .44Singapore 6 .20 1846(1960)10129 6.42Hong Kong 5.73 1349 6496 4.25Thailand 3 .59 262 1161 3.92Malaysia 3.22 776 2239 2 .79Indonesia • • 210 471 3.51Mean:With' Japan 8 .5 4 ' • • 11578 8.88
Without Japan 4 .59 • • 1458 4.82
Selected Other
USA 1.98 9287. 19703 1.98China 5 .34 293 344 0 .57Kenya 1 .40 266 360 0 .80Tanzania 1.62 144 131 -0.25
Sources: Calculated from World Bank, World Tables, 1983; IMF, Yearbook, 1990; and diverse sources.
41

Table 2 .— Nominal ta r iff , rates of growth of population and GDP by epochs selected countries of South Asia and East Asia *
Variable
1 . Mean nominal ta r iff :Capital goods Consumer goods
2 . Population rate of growth:
Period India
_____________ H I .
Indonesia
( 2 )Bangladesh
_ Q 1 _
3 . Per capita income rate of growth.
Malaysia
-14.).
19851985
107.3140.9
5-408 0 .0 0
1 1 6 . 0 0 0-55
50-60 1 .9 2.1 • • 2 .760-70 2 .3 2.1
• • • • 2 .9
70-81 2.1 2 .3 2 .4 5 2 .581-85 2.1 2.1 2 .1 7 2 .585-88 2 .7 2 .7 1 .90 2 .588-89 • * • * 1 .90 • *
50-60 1 .0 1 .9 • • 0 .960-70 1 .3 1 .8 • • 3 .670-81 1.5 5 .5 • • 5 .381-85 3 .4 3 .5 0 .8 8 2 .185-88 2 .9 3 .0 1 .88 2 .588-89 • •
Singapore
- 111 ..
Thailand
l £ L _
Korea
- ( -7)
Pakistan
- 1
0-524 .8
48.55-30
73 .8
127.3
4 .8 2 .7 2.1 2 .32 .4 3 .0 2 .6 2 .81 .5 2 .5 1 .7 3 .01 .2 2 .4 1 .3 3 .01 .2 2 .4 1 .0 3 .01.1 1 .7 3.7-
• • 3 .0 3 .0 0 .36 .4 5 .4 6 .0 4 .47.1 4 .7 7 .3 2 .05 .6 6 .5 7 .2 2 .85 .0 5 .3 10.3 3 .27 .8 9 .3 0.2
Sources: See the footnote to Table 1.
t Indonesia» Malaysia, Singapore, and Korea, only ranges of nominal tariffscould\be worked out.
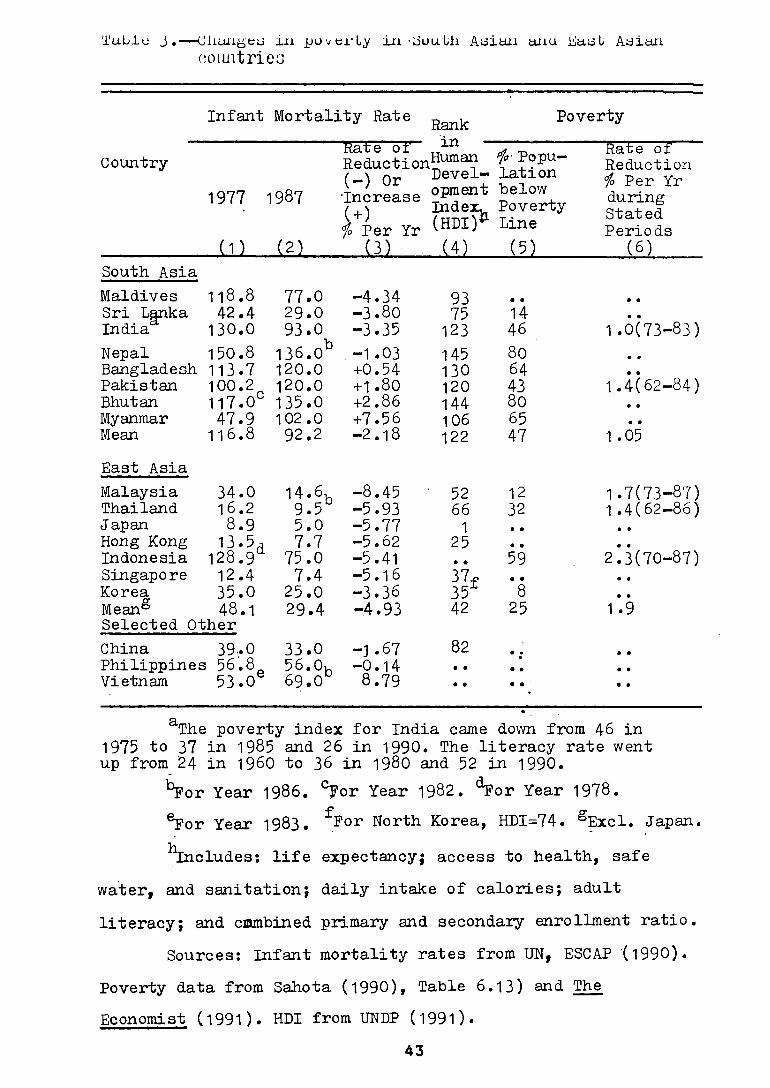
Table J . ——Ciiuuyea in poverty in -SouUh Asian and East Asian
countries
Infant Mortality Rate
Country
1977 1987
I D ____ { * 1
'Rate' of TT Reduction!?'111133? (_) or Bevel. Increase °PI en’*;
i + ><?o Per Yr lHDIJ
(3 ) (4)
Rankin -------
Popu- Devel— lation
below Poverty Line
Poverty
1 1 1
Rate of Reduction io Per Yr during Stated Periods
(6 )South Asia
Maldives 1 1 8 . 8 7 7 .0 -4.34 93 • • • •
Sri Lanka 42 .4 2 9 .0 -3. 80 75 14 • •
India 130.0 93 .0 -3.35 123 46 1 .0(73-83)
Nepal 150.8 1 3 6 .0° -1.03 145 80 • •Bangladesh 113.7 120 .0 +0.54 130 64 • •Pakistan 100.2 120.0 +1.80 120 43 1 .4(62-84)Bhutan 1 1 7 .0C 135 .0 +2.86 144 80 • •Myanmar 47 .9 102.0 +7 .56 106 65 • •Mean 1 1 6 . 8 92 .2 -2 . 1 8 122 47 1 .05
East Asia
Malaysia 34 .0 1 4 .6b -8.45 52 12 1.7(73-87)Thailand 1 6 . 2 9 .5 -5.93 66 32 1.4(62- 86)Japan 8 .9 5 .0 -5.77 1 • • • •Hong Kong 13 • 5 j 7 .7 -5.62 25 • • • •
Indonesia 1 2 8 .9d 7 5 .0 -5.41 • • 59 2.3(70- 87)Singapore 12.4 7 .4 -5.16 37f • • • •
Korea 35 .0 2 5 .0 -3.36 35 8 • •
Mean° 48.1 Selected Other
29 .4 -4.93 42 25 1.9
China 39 .0 33 .0 -1 .67 82 • • • •
Philippines 56 .8 5 6 .°b -0.14 • • • • • •
Vietnam 53 .0 69 .0 8 .7 9 • • • • ' • •
The poverty index for India came down from 46 in
1975 to 37 in 1985 and 26 in 1990. The literacy rate went up from 24 in i960 to 36 in 1980 and 52 in 1990.
^For Year 1986. ^ o r Year 1982. ^Por Year 1978.
^ o r Year 1983. fFor North Korea, HDI=74. gExcl. Japan.
^Includes: l ife expectancy; access to health, safe
water, and sanitation; daily intake of calories; adult
literacy; and cmmbined primary and secondary enrollment ratio.
Sources: Infant mortality rates from UN, ESCAP (1990 )•
Poverty data from Sahota (1 99 0 ), Table 6 .1 3 ) and The
Economist C1991 ). HDI from UNDP C1991)•
43
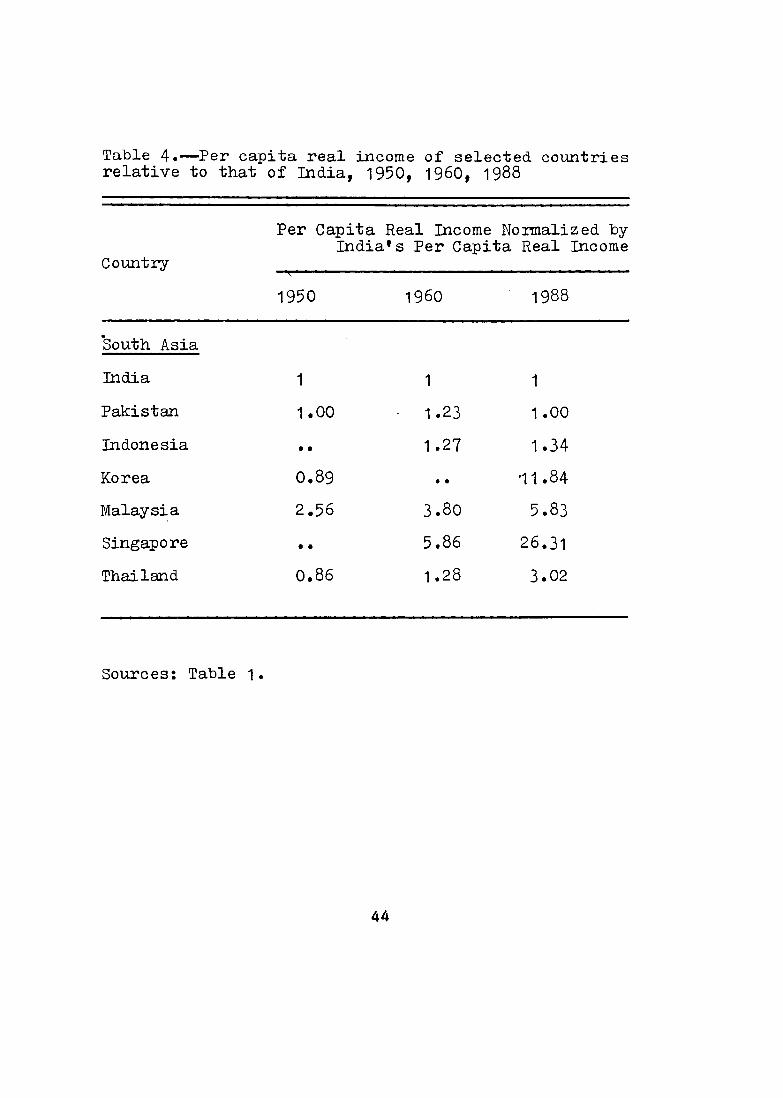
Table 4 .— Per capita real income of selected countries relative to that of India , 1950, 1960, 1988
Country
Per Capita Real Income Noimalized by In d ia ’ s Per Capita Real Income
1950 1960 1988
South Asia
India 1 1 1
Pakistan 1 .00 1.23 1 .00
Indonesia • • 1 .27 1 .34
Korea 0 .89 • • •11.84
Malaysia 2 .5 6 3 .8 0 5 .83
Singapore • • 5 .86 26.31
Thailand 0 .86 1 .28 3 .02
Sources: Table 1.
44
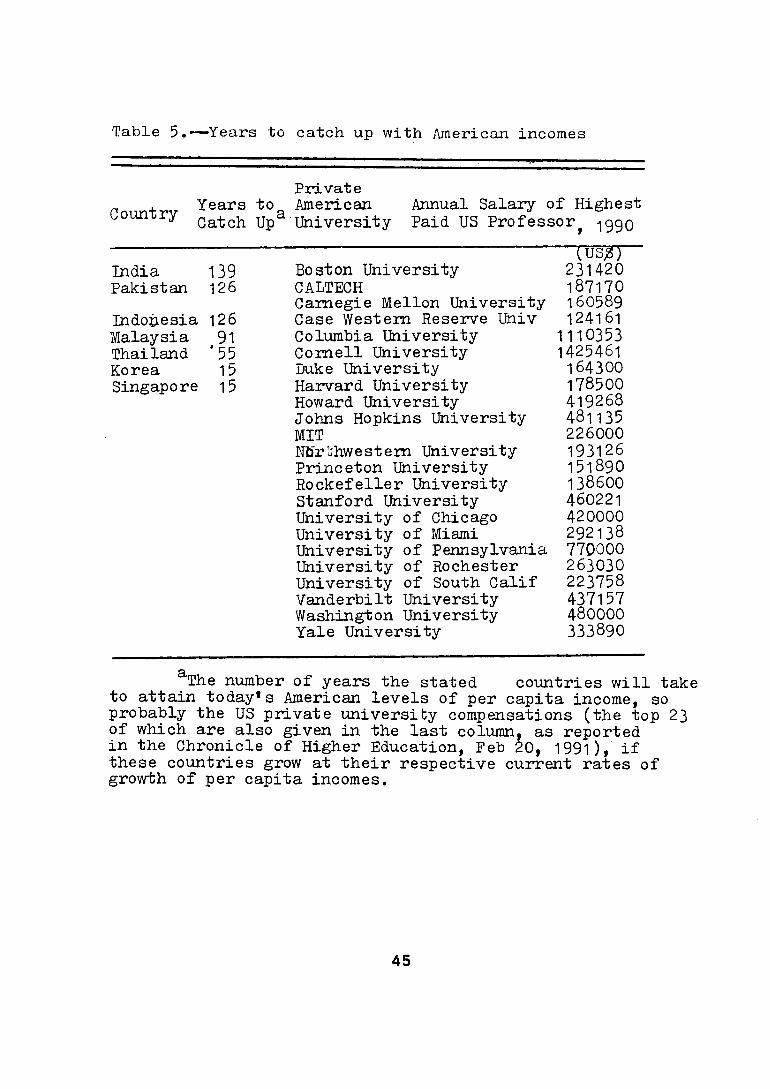
Table 5.— Years to catch up with American incomes
CountryYears to.
Catch Upc
PrivateAmericanUniversity-
Annual Salary of Highest
Paid US Professor 1990
(USjg)
India 139 Boston University 231420
Pakistan 126 CALTECH 187170Carnegie Mellon University 160589
Indonesia 126 Case Western Reserve Univ 124161
Malaysia 91 Columbia University 1110353Thailand ' 55 Cornell University 1425461
Korea 15 Duke University 164300
Singapore 15 Harvard University 178500Howard University 419268Johns Hopkins University 481135MIT 226000Nfo'r uhwestern University 193126Princeton University 151890Rockefeller University 138600Stanford University 460221
University of Chicago 420000University of Miami 292138University of Pennsylvania 770000University of Rochester 263030University of South Calif 223758
Vanderbilt University 437157Washington University 480000Yale University 333890
The number of years the stated countries w ill take to attain today*s American levels of per capita income, so probably the US private university compensations (the top 23 of which are also given in the last column, as reported in the Chronicle of Higher Education, Feb 20, 1991), i f these countries grow at their respective current rates of growth of per capita incomes.
45

Table 6Seme hasin statistics about the national capacity and environment of technology in
India and neighboring countries
Variable India Thailand Korea
Relevant macro variables
•1. Population (Millions) 732 50 402. GDP (USS billion) 180 35 803. % GDP from agric. 31 17 134. Gross savings as % of GDP 22.8 20.75. % labor force in agric. 70 71 36
ffl). S&T variables
7. R&D in US$ millions 1424 119 14338. R&D as % of GDP 0.79 0.29 1.539. S&T personnel per 1000 pop. 2.36 9.50 57.010. S&T personnel with doctorates or post
graduate degrees/diploma 22.9 4811. Indust. R&D as % of total 17.8 8.312. Personnel in R&D (000's) 2329 479 234513. Per capita R&D (US$) 1.94 2.3 35.214. R&D per R&D personnel (USS) 611 249 61815. Objective factor index of national
tech. climate 0.44 0.46 0.54
16. Subjective factor index of nationaltech. climate 0.17 0.19 0.78
Source: Un, ESCAP, [1989]. The statistics pertain to 1985 or period close to that year.
Lines 15 and 16 computed by factor analysis.
46

Singapore India Bangladesh
Year Productivity Council/
Boarc/Orgam zaticninstituted 1967 1958 1966
Professional Staff 255 200 32
Budget of Council/Board/0-gar.ization (US$ M illions) 6 2 . 5 . P 5
Population (Millions) 2 .6 798 150
Per capita income (0S$) 7940 260 150
Scurce: First three lines of the f irst two columns
_rcn M. Henricues, ILO, Bangkok. Paper presented at the
fcrun c" Productivity in 3anclacesh , October 24, 1969. The
• .pertain to 1587 or a period close to the: year.
47
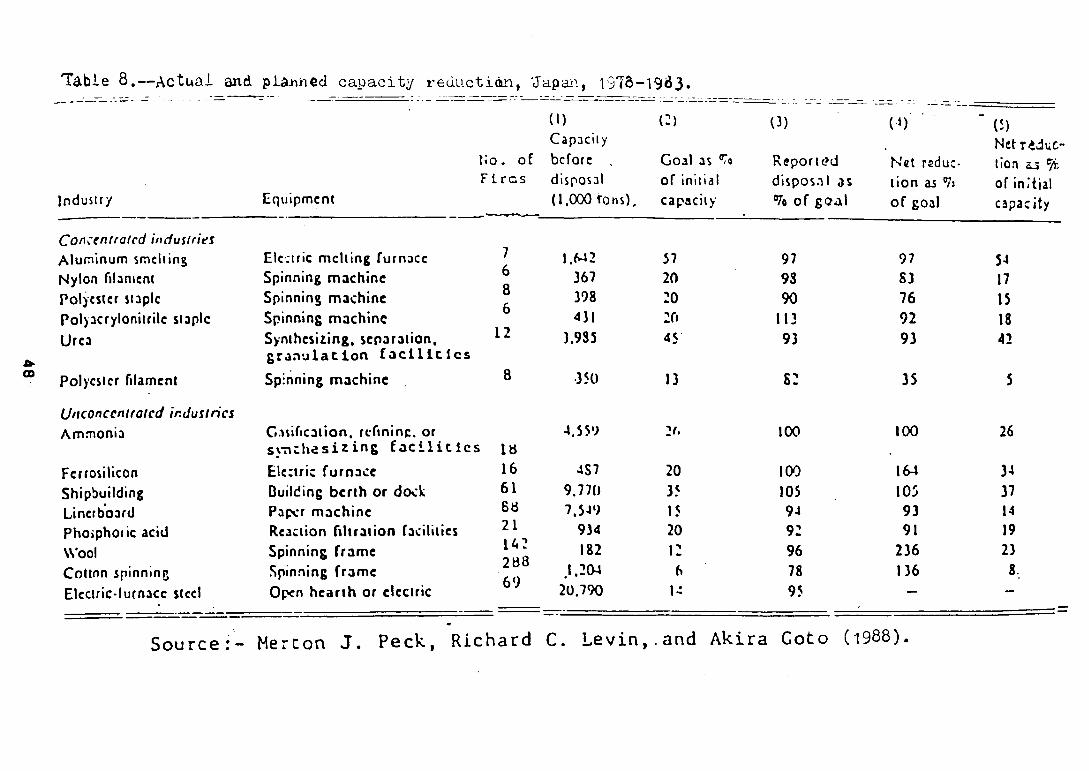
48
Table 8 .— A c t u a l and p l d - h n e d c a p a c i t y r e d u c t i o n , ' J a p a n , 1 9 7 6 - - 1 9 6 3 .
Industry Equipment
N o . of
F i r e s
(1)
Capacity
before
disposal
(1 ,000 tons ) .
(2)
Goal as °Ta
of initial
capacity
O )
R?port<?d
disp os . i l os
°7o o f g o a l
(-*)
Net reduc
t ion as °7j
o f goal
" (5)
N«tT4duC
tion a j *(t.
of initial
capacity
Concentrated industries
Alu minu m smelting Electric melting furnace / 1 .M2 57 97 97 54
Nylon filament Spinning m ach in c 6
8A
367 20 93 S3 17
Polyester staple Spinning ma chine 398 20 90 76 15
Polyacrylonitrile staple Spinning m ach in c 4)1 20 113 9 2 18
Urea Synthesizing, separat ion, g r a n u l a t i o n f a c i l i t i e s
3.935 45 93 93 42
Polyester filament Spinning m a chin e 8 •350 13 82 35 5
U nconccnlratcd industries
Am m o ni a Gasification, rcfininc. or s v n c h e s i z i n g f a c i l i t i e s
4.55V 2(> 100 100 26
Ferrosilicon Electric fu rn ace 16 4S7 20 100 164 34
Shipbuilding Duilding b e r th or dock 61 9 .7 7 0 35 105 105 37
Linerboard Paper m a c h in e 6 8 7.549 15 94 93 14
Pho»phoiic acid Reaction f il t rat ion facilities 21 934 20 92 91 19
Wool Spinning f ra m e1 4 2
2 8 8
6 9
182 12 96 236 23
Cotton spinning Spinning f r a m e ,1.204 6 78 136 8,
Electric-lutnace steel Open h e a r t h or electric 20 .790 U 95 — —
Source : - Me re on J . Peck , Richard C. Levin , .and Akira Goto (1988).

Table 9 .— Effects of differeht remedies for depressedinduatri ea
Group Likely to Bear the Remedial Cost o f :
GroupInvolved
Concessional and . Guaranteed Credit,
Subsidies
( US*A, India)
Protec- Phased tion, Close
Quotas, Down Bans (Retrain,
Relocate Workers)
(USA,India) (Japan)
Socialization(WorkersControl)
( Yugoslavia)
MarketSolution
(USA)
Cost Borne by
Workers Yes Yes
Owners Yes Yes Yes
Creditors Yes Yes
Consumers Yes Yes
Taxpayers Yes Yes
Nation as a whole Yes Yes
Potential Revival
Doubtful No Yes Yes
49

FOOTNOTES
1 Using the relative per capita income levels of 1989 and the growth rates of 1985-88, namely, the Korea/India per capita income relative of 11.84:1, the India growth factor le°-03n and the Korean growth factor 11.84e0*i03n, we get the following forecast: For n = 20, i .e ., within one generation, India's index of per capita income will rise to 1.82 and that of korea to 92.9, widening the per capita income gap by 51:1. The latter relative gives about the same gap as the United States had over India when the major postwar brain drain from India to America took place in the 1960s.
2 The following equation has to be solved for a, given that n = 40:
India Korea
lean = H.84e-103n
an = ln(11.84) + .103n
a = .0618 + .103 or= 16.48%
3. High rates of development and exports iriply high productivity growth and high rates of decline in unit costs of production—the main source of the competitive edge. Thus, in 1975, out of 27 industrial product groups, Korea had the lowest international price in 19 of them, Japan 7 of than, and the UK in one (Gupta, 1989). The Korean corqpetitive advantage lies in the prices of such products as garments, footwear, household textiles, machinery, radios, sports goods, jewellery, watches, cigarettes, and household durables. Japan had the comparative advantage in transport equipment, intermediate goods for transport, and TV sets; the UK in agricultural machinery; while India in none.
4 It must be recognized that no system of the world has succeeded in eradicating poverty altogether. Over 13 per cent of the US population is still below the officially defined poverty line. Similarly defined, there are 100 million poor in the western world and an equal number in the Soviet Union and the erstwhile Eastern Bloc [UNDP, 1991]. There were over 400,000 recorded homeless in England in 1989 [UNDP, 1991]. But in general, poverty has been reduced at a significantly faster rate in fast-growing economies relative to stagnant and slow-growth economies.
50

I«a a
Ahluwalia, Isher, 1985, Tnrhi^t.rial Growth in India: Stagnation Since the Mid-Sixties. Oxford: Oxford University Press.
------------ 1991, Total Factor Productivity in IndianManufactureng Tndnst.Hes. Oxford: Oxford University Press (forthcoming).
Bhagwati, J .N. and Srinivasan, T . N . , 1982, The WelfareConsequences of Directly Unproductive, Profit-Seeking (DUP) Activities: Price Versus Quantity Distortions, Jour. Intern. Econs. 13, August: 33-34.
Brahmananda, P.R. , 1983, Productivity in the Indian Economy: Rising Inputs for the Falling Outputs. Bombay: Himalayan Publishing House.
Chenery, Hollis and Srinivasan, T . N . , 1988, Handbook of Development Economics. Amsterdam: North-Holland.
Chronicle of Higher Education. 1991, 1988-89 Compensation of Chief Executives and Top Earners at 25 Private Universities, February 20.
CMIE (Centre for Monitoring Indian Economy), 1990, Basic Statistics. I: All India, Bombay: Economic Intelligence Service.
Economist. THE. 1991, India: Caged: A Survey- London: 54, 1-18.
Gulati, Ashok and Sharma, Pradeep K. , 1991, Government Intervention and Incentives in Indian Agriculture During 1980s, New Delhi: NCAER, January, Mimeo.
Gupta, Shama P ., 1989, Planning and Develorment in India. Oxford University Press.
Hayami, Yujiro and Rut tan, Vernon, 1971, Agricultural Develorment:
An International Perspective, Baltimore: Johns Hopkins University Press.
Henriques, M ., 1989, Productivity in Asia, Paper presented at ths forum on Productivity in Bangladesh- October, Bangkok: ILO.
IMF (International Monetary Fund), 1990, Yearbook.
Minhas, B.S. and Visaria, 1991, Employment during the 1980s, New Delhi: ISI, Mimeo.
51
Mundle, Sudipto and Rao, M. Govinda, 1991, The Volume and Composition of Government Subsidies in India: 1987-88, New Delhi, NIPFP, Mimeo.
Peck, Merton, J . , Levin, Richard C. and Goto, Akira, 1988, Picking Losers: Public Policy Towards Declining Industries in Japan, in Shoven, John B. (ed.), Government Policy Towards Industry in the United States and Japan. Cambridge: Cambridge University Press, 195-240.
Sahota, Gian, 1968, Fertilizer in Economic Development: An Econometric Analysis. New York, Praeger.
-------- , 1990, Poverty Theory and Policy: A Study of Panama.Baltimore, The Johns Hopkins University Press.
-------- , 1991, An Assessment of the Impact of IndustrialPolicies in Bangladesh, Bangladesh Development Studies. March-June (forthcoming).
Saleem, Hasheem, 1991, Structure of Nominal Tariff Rates in India: Total Factor Productivity Computer Printout, New Delhi, NIPFP.
Schlultz, Theodore W ., 1961, Investment in Human Capital, American Economic Review, LI (1), 1-17.
Sobhan, Rehman and Sen, Binyayak, 1989, Trend in the Payment Performance in the DFIs: Implications for the Development of Enterpreneurship in Bangladesh, Bangladesh Development studies, XVII(3), 21-26.
Solow, Robert M. , 1957, Technical Change and the Aggregate Production Function, Rev. Econ. & Stats.. August, 39, 12-20.
UN, ESCAP, 1989, Technology Climate Assessment, Technology Atlas Project, Bangkok, ESCAP, III.
---------- , 1989, Statistical Yearbook for Asia and thePacific. 1988. Bangkok,ESCAP.
UNDP, 1991, Human Development Report. New York, UN, May 15.
World Bank, 1983, World Tables. Washington, World Bank.
---------- 1985, India's Financial System: An Overview of ItsMalor Structural Features. Washington: World Bank Staff Working Paper.
52

NIPFP CURRENT POLICY SERIES
S.No. Title Author's Name
1/88 Tax on Dividend - The Issues and Non-Issues
Amaresh Bagchi (October, 1988)
1/89 Personal Taxation and Private Financial Savings in India
Ar indam Das-Gupta (March, 1989)
2/89 Towards a Fringe Benefits Tax Pulin B. Nayak & Sayed Afzal Peerzade (July, 1989)
3/90 Award of the Ninth Finance Commission: Lessons for Karnataka
M. Govinda Rao (October, 1990)
4/91 State of Municipal Finances in India and the Issue of Devolution: A Noted
Amaresh Bagchi ((January, 1991)
5/91 Involving Article 292 to contain Centre's Deficits: The Pitfalls
Amaresh Bagchi (January, 1991)
6/91 The Dilemma of Dividend Taxation in a Developing Economy: The Indian Experience
J V M Sarma (February, 1991)
7/91 The Hunan Element in India's Economic Development
Sudipto Mundle (May, 1991)
8/91 Budget'91: A Receipe for Expenditure Switching
Amaresh Bagchi Raja J Chelliah & Sudipto Mundle (May, 1991)
NATIONAL HBTITOIK CK FGELIC FINANCE AN) POLICYhen m m
LIST <Y PUBLICATIONS
1. Incidence of Indirect; Taxation in India 1973-74 R.J. Chelliah & R.N. Lai (1978) Rs 10.
2. Incidence of Indirect Taxation in India 1973-74 R.J. Chelliah & R.N. Lai (Hindi Version) (1981) Rs 20.
3. Trends and Tagging in Tn<Han Federal Finance R.J. Chelliah & Associates (Allied Rihlishers) (1981) Rs 60.
4. Sales Tax Eastern in Bihar* R.J. Chelliah & M.C. Rirohit (Soroaiya Publications) (1981) Rs 80.
5. Measurement of Tax Effort of State Governments 1973-76* R.J. Chelliah & N.Sinha (Soroaiya Riblications) (1982) Rs 60.
6. Intact of the ferwn ml Income T^x Anuparo Guptii & Pawan K. Aggarwal (1982) Rs35.
7. Etesouroe Mobilisation in the Private Corporate Sector Vinay D. Lall, SrinivasMadhur & K.K. Atri (1982) Rs 50.
8. Fiscal Incentives and Corporate Tax Saving Vinay D. Lall (1983) Rs 40.
9. T^x Treatment of Private Trusts K Srinivasan (1983) Rs 140.
10. Central Government Expenditure: Growth, Structure and Impact (1950-51 to1978-79) K.N. Reddy. J.V.M. Sana & «. Sinha (1984) Rs 80.
11. Entry Tax As An Alternative to Octroi M.G. Rao (1984) Rs 40 Paperback, Rs 80Hardcover.
12. Information System and Evasion of Sales Tax in Tamil Nadu R.J. Chelliah & M.C. Rirohit (1984) Rs 50.
13. Evasion of Excise Duties in India: Studies of Copper, Plastics and Gotten Textile Fabrics (1986) A. Bafichi et. al (1986) Rs 180.
14. Aspects of tfce Black Bccncey in India (also known as "Black Money Report")Shankar N. Acharya & Associates, with contributions by R.J. Chelliah (1986)Reprint Edition Rs 270.
15. Inflation Accounting and Corporate Taxation Tapas Kumar Sen (1987) Rs 90.
16. Sales Tax System in West Bengal A. Bafichi & S.K. Dass (1987) Rs 90.

L7. Ekiral Dervelopnant Allowance (Sectica 350C of the Incooe-Tax Act, 196L)-s^ABerrien H.K. Sondhi A J.V.M. Sana (1988) Rs 40 Paperback. f S V '
12010;18. Sales Tax ^ratea in DalM R.J. Challlah & K.N. Reddy (1988) Rs 240. V l !x
19. Investment U Iohdob (Section 32A of the Tnrrae Tax Act, 1981): A Study J.V.M. Sarraa & H.K. Sondhi (1989) Rs 75 Paperback, Rs 100 hardcover.
20. Stimulative Effects of Tax Incentive for Charitahle Contributions: A Study of Indian Corporate Sector Pawan K. Aggarwal (1989) Rs 100.
21. Pricing of Rstal Services in India Raghbervdra Jha, M.N. Murty & Satya Paul (1990) Rs 100.
22. Domestic Savings in India - Trends and Issues Uraa Datta Roy Chaudhury & Amaresh Bagchi (Ed.) (1990) Rs 240.
23. Sales Tax Systems in India: A Profile Rs 75.
24. Sales taxation in Madhya Pradesh M. Govinda Rao, K.N. Balasubramanian and V.B. Tulasidhar (Vikas Riblishing House) (1991) Rs 125.
25. Tbs Operation of MODVAT A.V.L. Narayana, Amaresh Bagchi and R.C. Qjpta, (Vikas Rxblishing HbOSer (1991) Rs 250.
26. Fiscal Incentives and Ralanoed Regional Development : An Evaluation of Section 80 HH Pawan K. Aggarwal and H.K. Sondhi (Vikas Publishing House) (1991) Rs 195.
27. Direct Taxes in Selected Countries : A Profile (Vol.I & II) Rs 100.
Available with respective publishers. Riblications sent against draft/pay order. Postage Rs 15 per copy. 10% discount is available on all Rjblications.
NATIONAL D6TITUIB OK PDELIC FINANCE AM) POLICY 18/2, Sntjwng Vihar lhrg
S p r M Institutional Area Meiv Delhi - 110067.