Embed Size (px)
Citation preview

Why the Economy?
Raymond DuchUniversity of HoustonRandy StevensonRice University

Cross-national Studies of Economic Voting
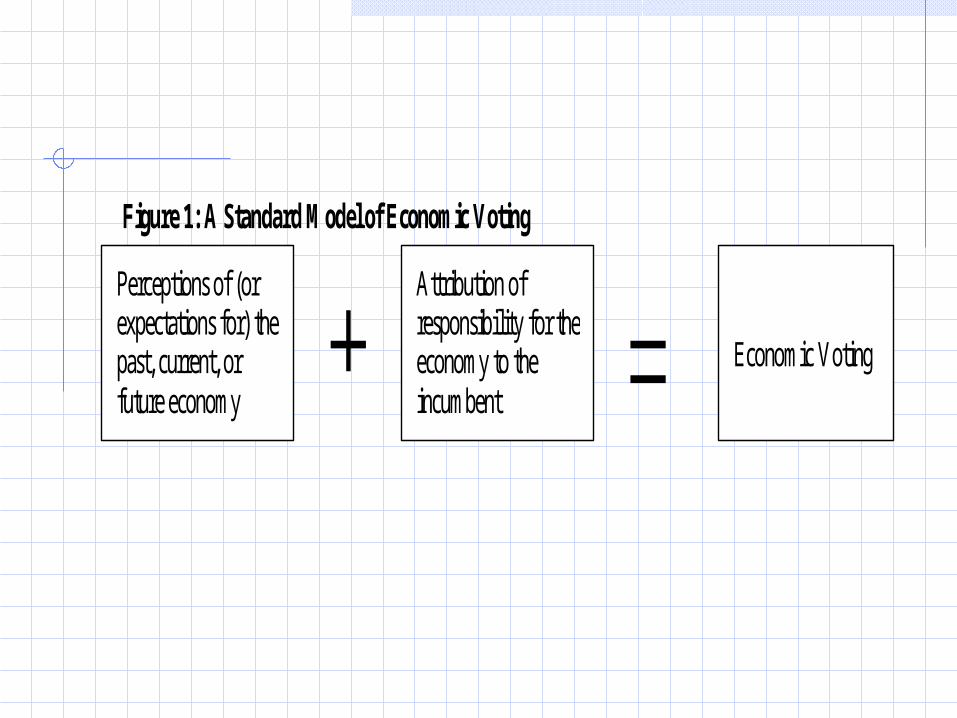
Figure 1: A Standard Model of Economic Voting
Perceptions of (or expectations for) the past, current, or future economy
Attribution of responsibility for the economy to the incumbent
Economic Voting
At the individual level, limited efforts to understand cross-national variation. Lewis-Beck 1988 Paldam 1991
Nonetheless some interesting differences in model results cross-nationally
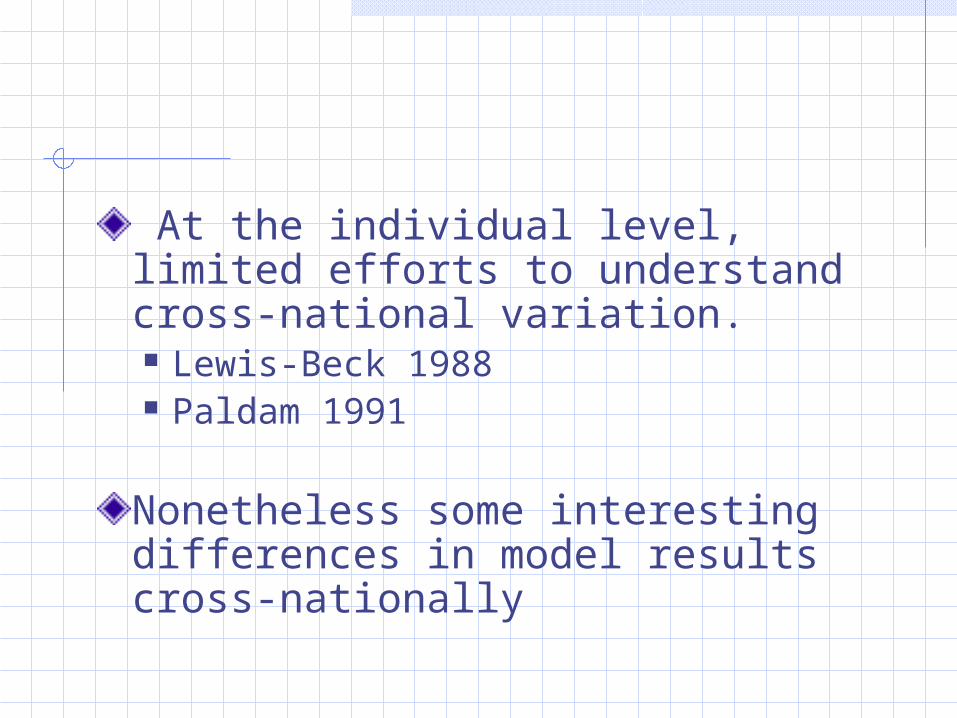
At the aggregate level, considerable cross-national variation in economic voting results.
“Clarity of responsibility” is one effort to help understand – but limited.

Research Puzzle
We suspect individual-level economic voting models vary significantly cross-nationally.
But current published modeling efforts are not rich enough to draw meaningful conclusions.

Our Insights
Economic evaluations are attitudes – information processing, cueing and cognitive psychology literature.
Measure extent to which economic information is “mediated”.
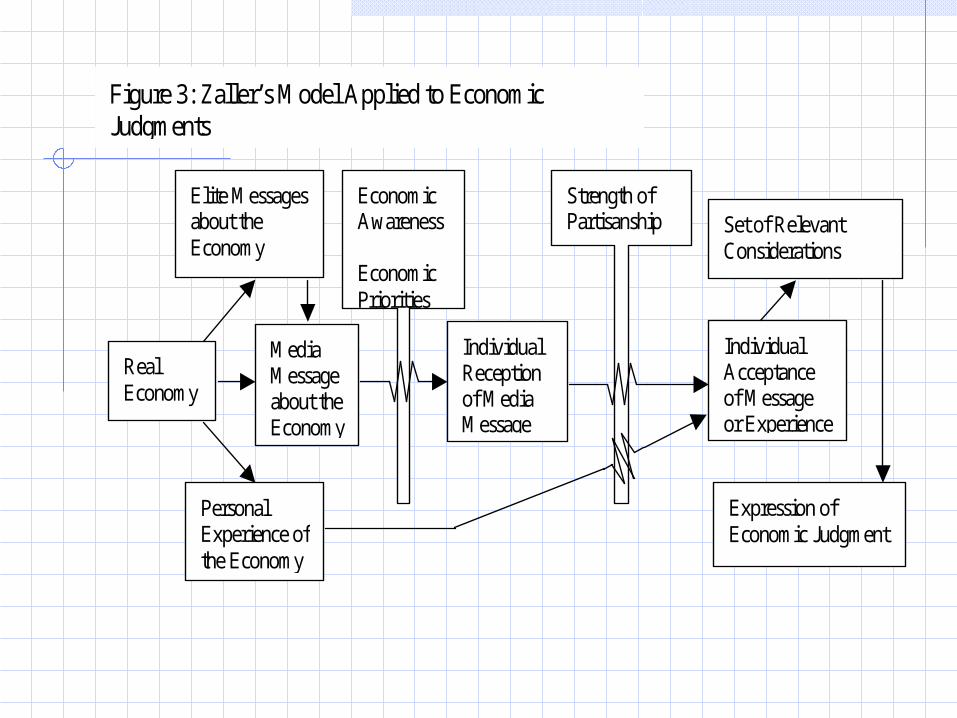
Media Message about the Economy
Real Economy
Personal Experience of the Economy
Elite Messages about the Economy
Individual Reception of Media Message
Individual Acceptance of Message or Experience
Expression of Economic Judgment
Set of Relevant Considerations
Economic Awareness Economic Priorities
Strength of Partisanship
Figure 3: Zaller’s Model Applied to Economic Judgments

The Research Project
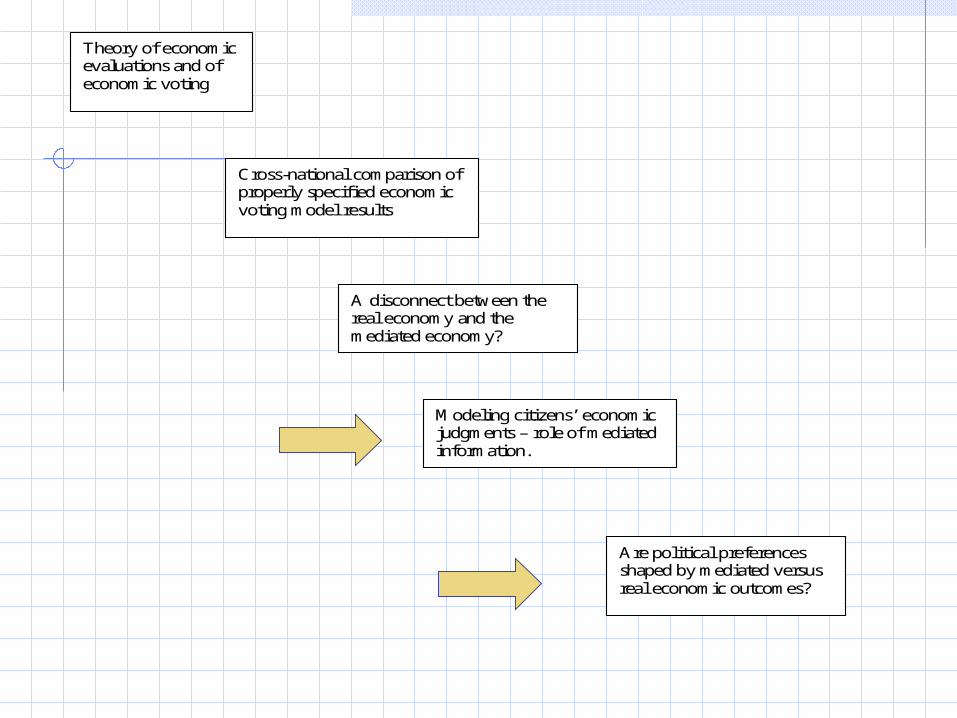
Theory of economic evaluations and of economic voting
Cross-national comparison of properly specified economic voting model results
A disconnect between the real economy and the mediated economy?
Modeling citizens’ economic judgments – role of mediated information.
Are political preferences shaped by mediated versus real economic outcomes?

Mediated Economic Cues
Citizens employ cues/information short-cuts in forming economic assessments
Luppia & McCubbins argument
Nevertheless information gathering costs matter

Political actors, elites, media attempt to shape these cues or “packaging” of messages
Zaller on the strategic manipulation of media by political actors
Iyengar on framing
Distorted messages regarding economy?
Some evidence from analyses of different media
Negativity bias Human interest bias

Distortions depend on:
Information gathering costs
Cross-national diversity of media
Institutional contexts
Implications for EV Models?
Economic evaluations are based on distorted information
Seriously questions the “democratic accountability” theory of EV
Null hypothesis
Economic perceptions and actual economic outcomes track each other in a regular fashion
The series are co-integrated and can be modeled as an ECM
Mediated cues argument
There is distortion in mass assessments of economic outcomes.
This distortion is a function of mediated messages regarding the economy (media, politicians, etc.)
Hypothesis
Distortion evidenced by poor ECM fit.
Mediation implies degree of distortion correlated with cost of information High for unemployment Low for inflation
Mediation implies asymmetric effects

Mediation also implies considerable cross-national variation in degrees of distortion
Mediation implies distortions in both mass and elite economic assessments

Data
Mass public’s economic assessments: Monthly consumer confidence surveys
conducted by the European Commission in all member countries 1986-2000
Elite’s economic assessments Monthly business confidence surveys
from European Commission 1967-2000
Economic indicators Quarterly GDP growth from OECD
(Palmer and Whitten) CPI and unemployment figures from The Economist
All variables are transformed into standardized z scores

Modeling Economic Attitudes
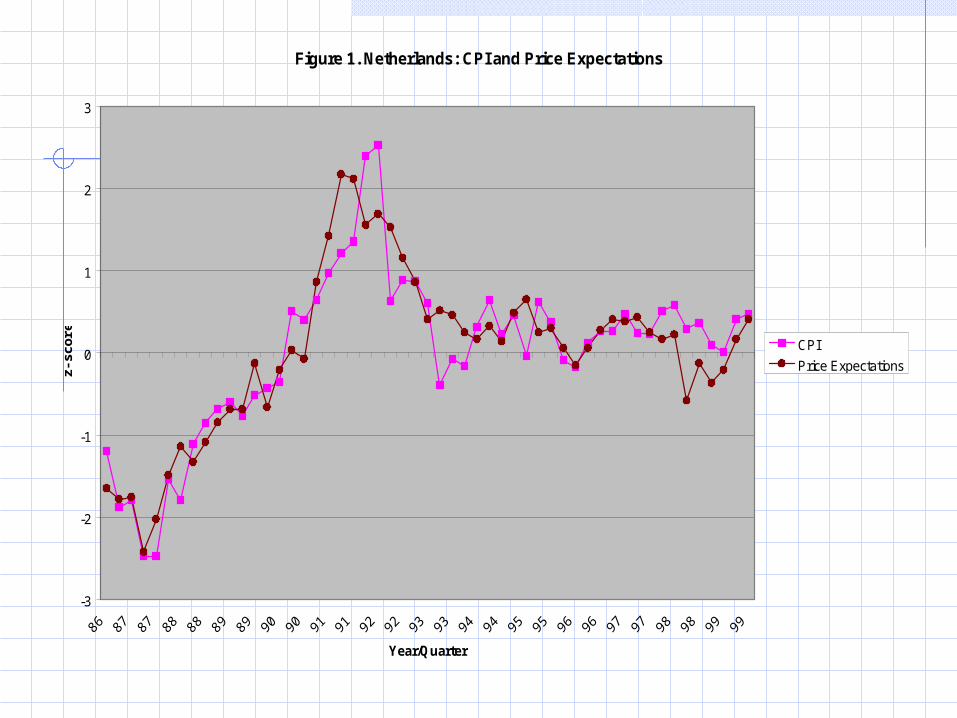
Figure 1. Netherlands: CPI and Price Expectations
-3
-2
-1
0
1
2
3
Year/Quarter
z-sc
ore
CPI
Price Expectations
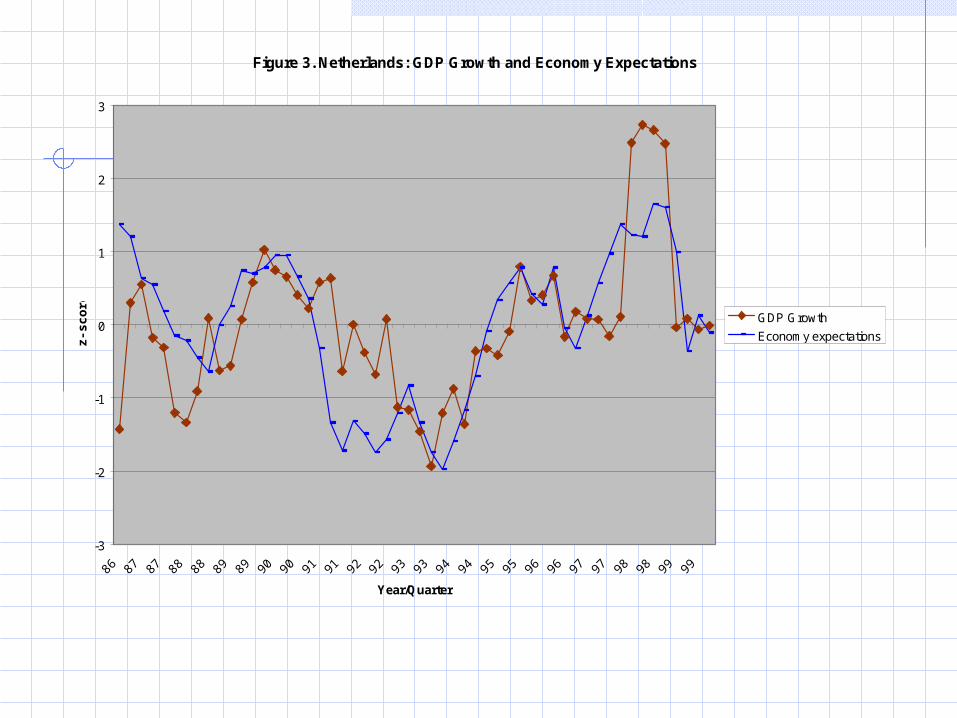
Figure 3. Netherlands: GDP Growth and Economy Expectations
-3
-2
-1
0
1
2
3
Year/Quarter
z-sc
ore GDP Growth
Economy expectations
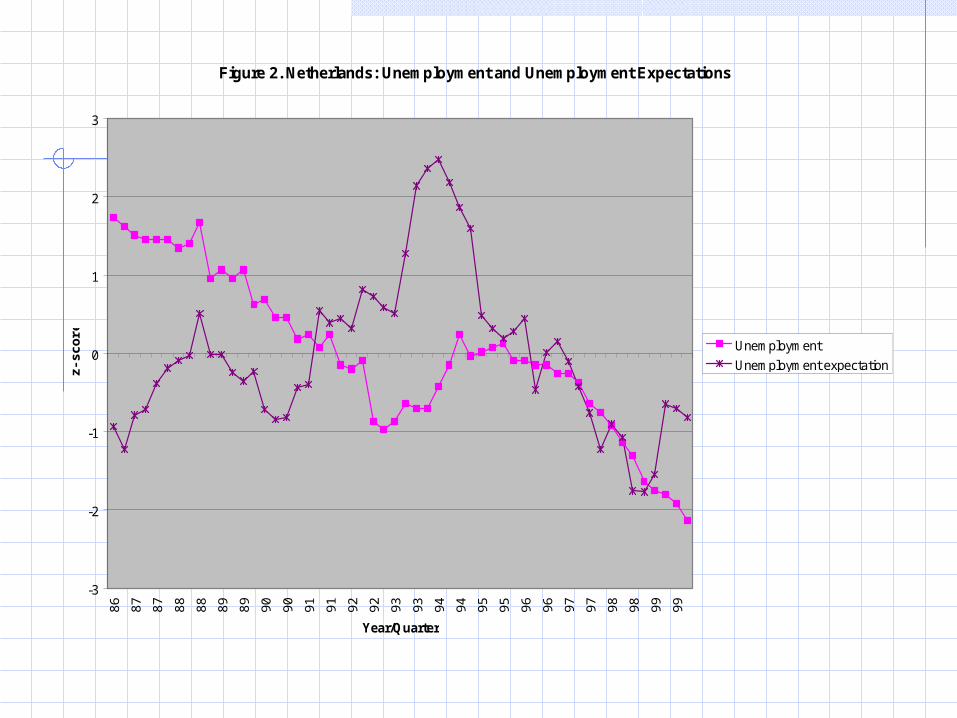
Figure 2. Netherlands: Unemployment and Unemployment Expectations
-3
-2
-1
0
1
2
386 87 87 88 88 89 89 90 90 91 91 92 92 93 93 94 94 95 95 96 96 97 97 98 98 99 99
Year/Quarter
z-sc
ore Unemployment
Unemployment expectation
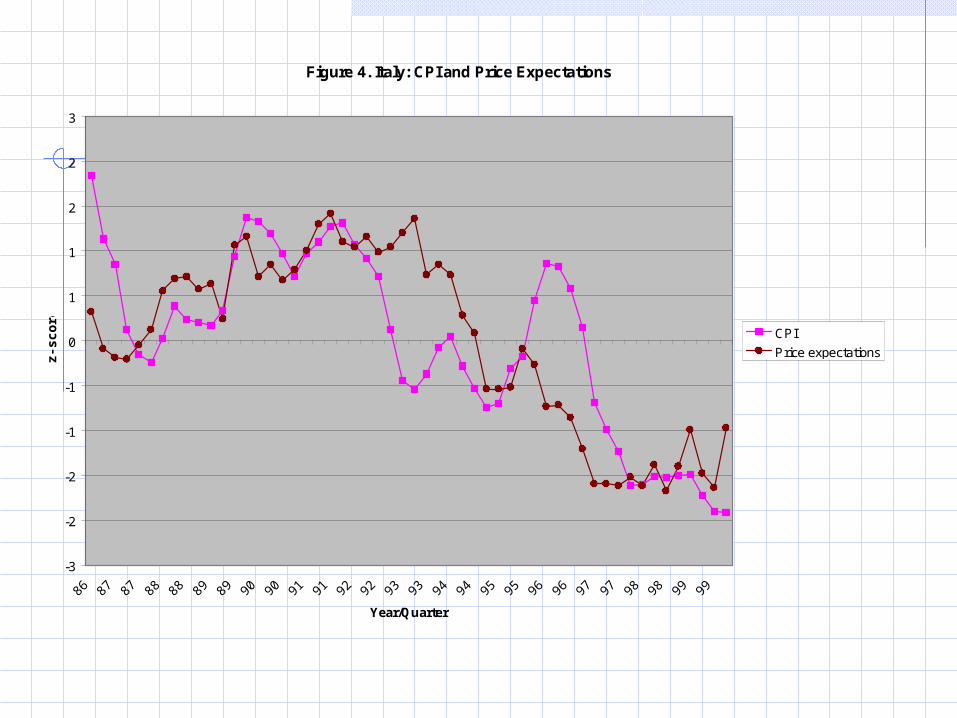
Figure 4. Italy: CPI and Price Expectations
-3
-2
-2
-1
-1
0
1
1
2
2
3
Year/Quarter
z-sc
ore CPI
Price expectations
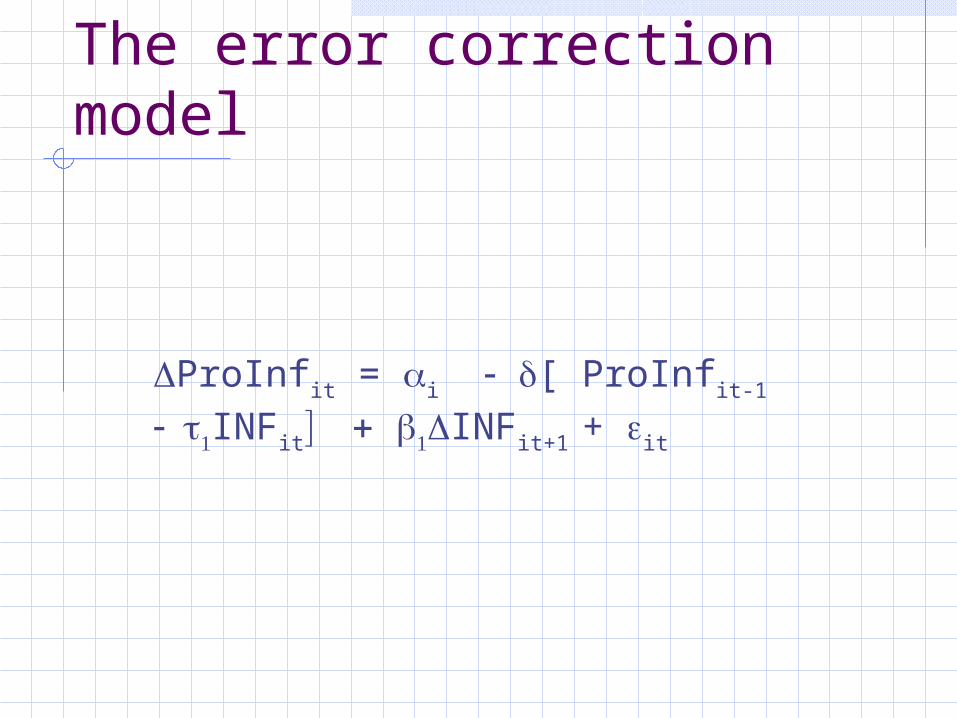
The error correction model
ProInfit = i [ ProInfit-1 INFit INFit+1 + it
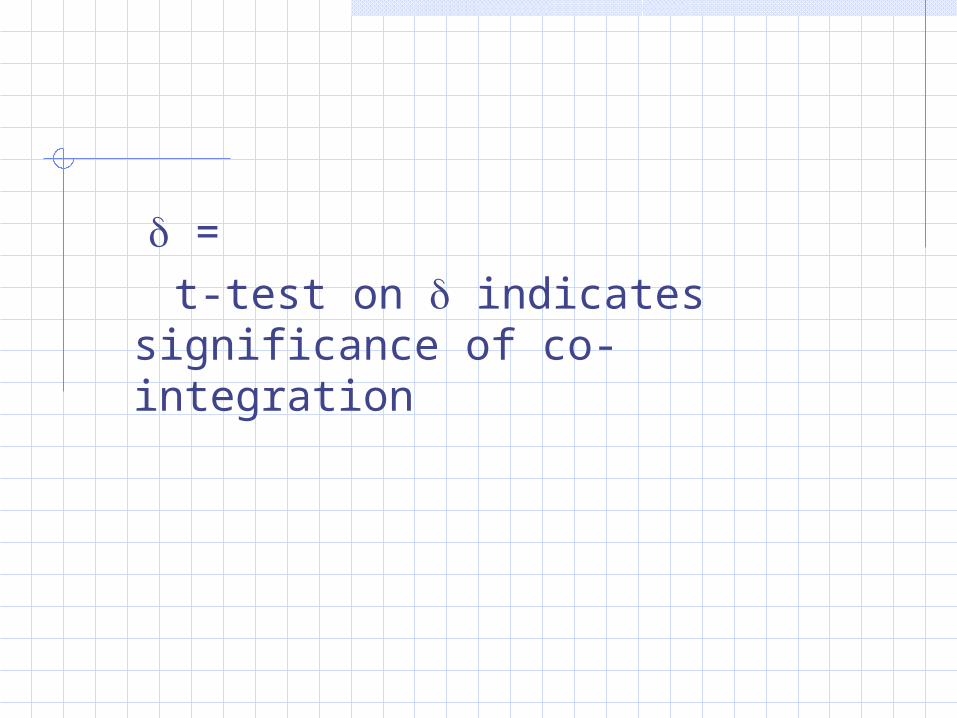
= t-test on indicates significance of
co-integration
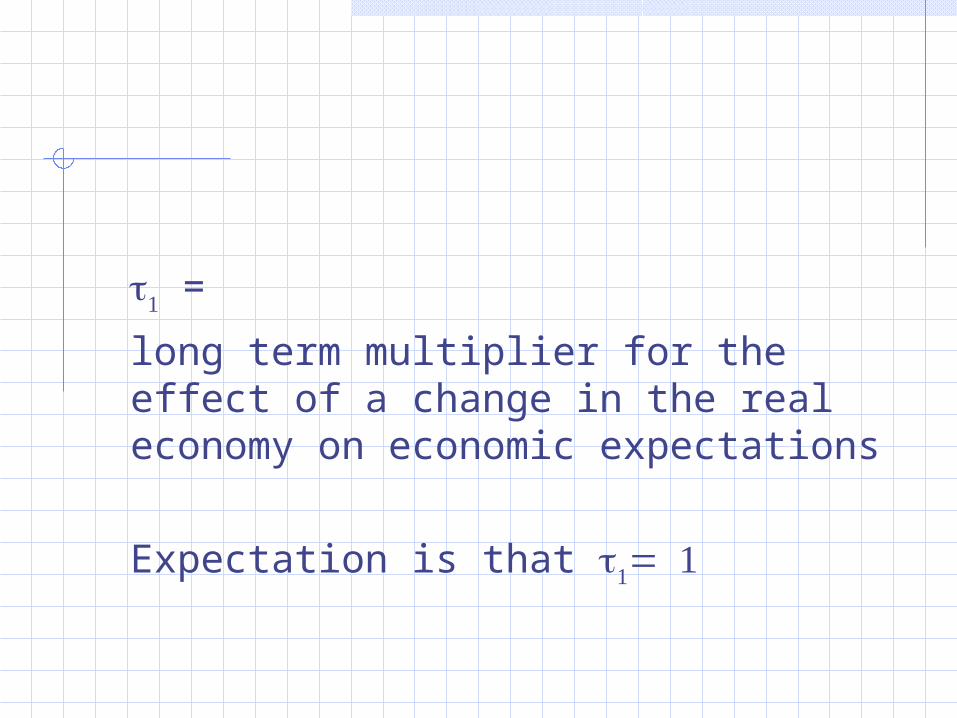
=
long term multiplier for the effect of a change in the real economy on economic expectations
Expectation is that

Results
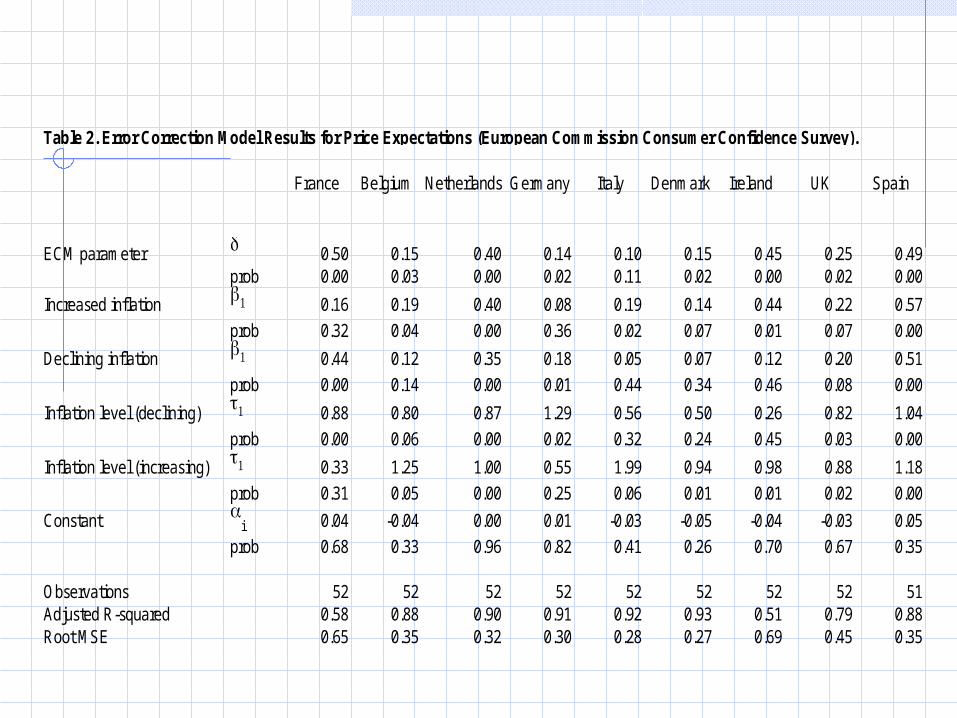
Table 2. Error Correction Model Results for Price Expectations (European Commission Consumer Confidence Survey).
France Belgium Netherlands Germany Italy Denmark Ireland UK Spain
ECM parameter 0.50 0.15 0.40 0.14 0.10 0.15 0.45 0.25 0.49prob 0.00 0.03 0.00 0.02 0.11 0.02 0.00 0.02 0.00
Increased inflation 0.16 0.19 0.40 0.08 0.19 0.14 0.44 0.22 0.57
prob 0.32 0.04 0.00 0.36 0.02 0.07 0.01 0.07 0.00
Declining inflation 0.44 0.12 0.35 0.18 0.05 0.07 0.12 0.20 0.51
prob 0.00 0.14 0.00 0.01 0.44 0.34 0.46 0.08 0.00
Inflation level (declining) 0.88 0.80 0.87 1.29 0.56 0.50 0.26 0.82 1.04
prob 0.00 0.06 0.00 0.02 0.32 0.24 0.45 0.03 0.00
Inflation level (increasing) 0.33 1.25 1.00 0.55 1.99 0.94 0.98 0.88 1.18
prob 0.31 0.05 0.00 0.25 0.06 0.01 0.01 0.02 0.00
Constant i 0.04 -0.04 0.00 0.01 -0.03 -0.05 -0.04 -0.03 0.05
prob 0.68 0.33 0.96 0.82 0.41 0.26 0.70 0.67 0.35
Observations 52 52 52 52 52 52 52 52 51Adjusted R-squared 0.58 0.88 0.90 0.91 0.92 0.93 0.51 0.79 0.88Root MSE 0.65 0.35 0.32 0.30 0.28 0.27 0.69 0.45 0.35
CPI and Price Expectations
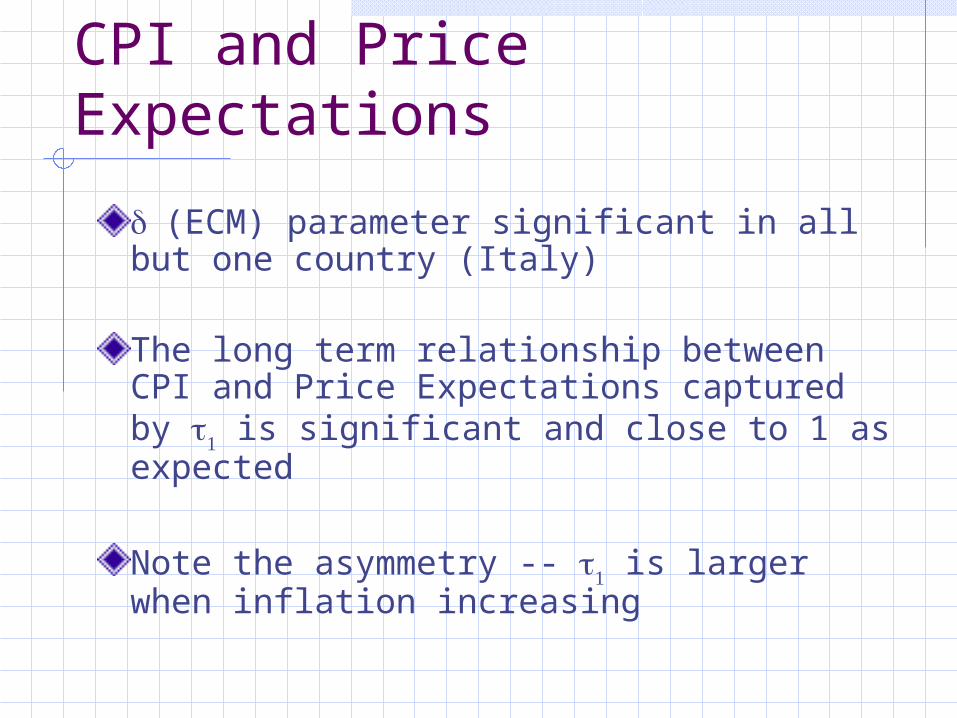
(ECM) parameter significant in all but one country (Italy)
The long term relationship between CPI and Price Expectations captured by is significant and close to 1 as expected
Note the asymmetry -- is larger when inflation increasing
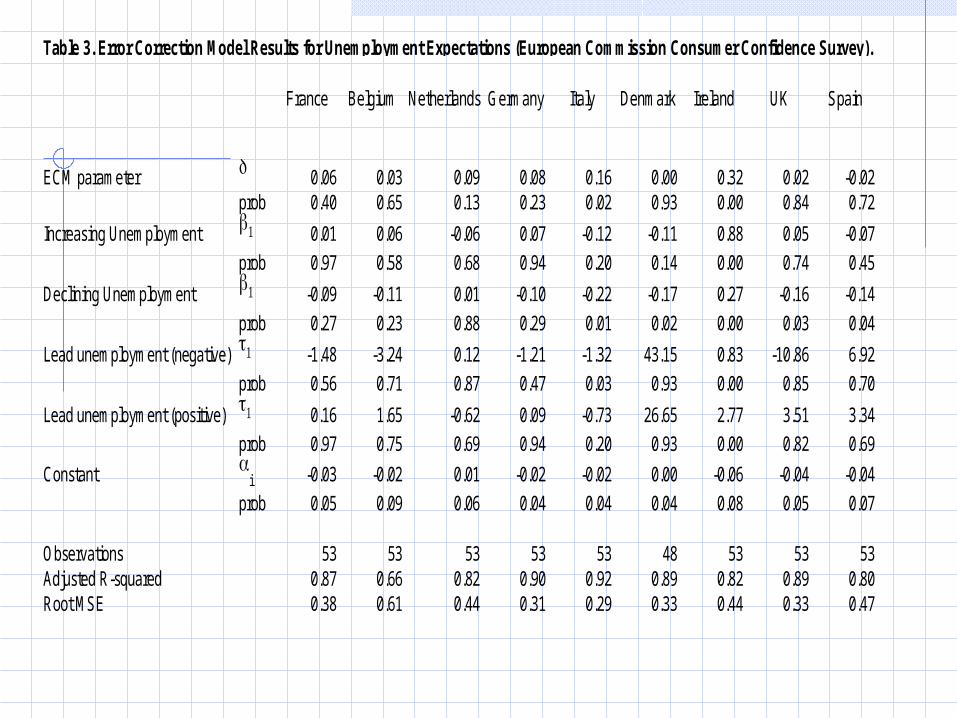
Table 3. Error Correction Model Results for Unemployment Expectations (European Commission Consumer Confidence Survey).
France Belgium Netherlands Germany Italy Denmark Ireland UK Spain
ECM parameter 0.06 0.03 0.09 0.08 0.16 0.00 0.32 0.02 -0.02prob 0.40 0.65 0.13 0.23 0.02 0.93 0.00 0.84 0.72
Increasing Unemployment 0.01 0.06 -0.06 0.07 -0.12 -0.11 0.88 0.05 -0.07
prob 0.97 0.58 0.68 0.94 0.20 0.14 0.00 0.74 0.45
Declining Unemployment -0.09 -0.11 0.01 -0.10 -0.22 -0.17 0.27 -0.16 -0.14
prob 0.27 0.23 0.88 0.29 0.01 0.02 0.00 0.03 0.04
Lead unemployment (negative) -1.48 -3.24 0.12 -1.21 -1.32 43.15 0.83 -10.86 6.92
prob 0.56 0.71 0.87 0.47 0.03 0.93 0.00 0.85 0.70
Lead unemployment (positive) 0.16 1.65 -0.62 0.09 -0.73 26.65 2.77 3.51 3.34
prob 0.97 0.75 0.69 0.94 0.20 0.93 0.00 0.82 0.69
Constant i -0.03 -0.02 0.01 -0.02 -0.02 0.00 -0.06 -0.04 -0.04
prob 0.05 0.09 0.06 0.04 0.04 0.04 0.08 0.05 0.07
Observations 53 53 53 53 53 48 53 53 53Adjusted R-squared 0.87 0.66 0.82 0.90 0.92 0.89 0.82 0.89 0.80Root MSE 0.38 0.61 0.44 0.31 0.29 0.33 0.44 0.33 0.47

Unemployment and Unemployment Expectations
(ECM) parameter significant is not significant
Suggesting the two series are not co-integrated.
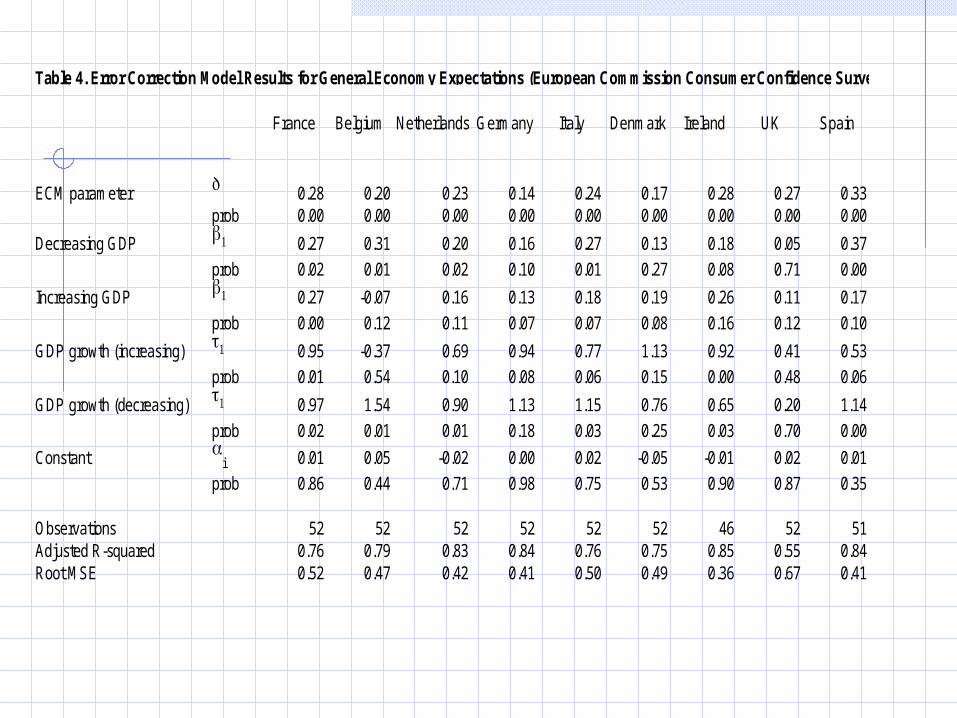
Table 4. Error Correction Model Results for General Economy Expectations (European Commission Consumer Confidence Survey).
France Belgium Netherlands Germany Italy Denmark Ireland UK Spain
ECM parameter 0.28 0.20 0.23 0.14 0.24 0.17 0.28 0.27 0.33prob 0.00 0.00 0.00 0.00 0.00 0.00 0.00 0.00 0.00
Decreasing GDP 0.27 0.31 0.20 0.16 0.27 0.13 0.18 0.05 0.37
prob 0.02 0.01 0.02 0.10 0.01 0.27 0.08 0.71 0.00
Increasing GDP 0.27 -0.07 0.16 0.13 0.18 0.19 0.26 0.11 0.17
prob 0.00 0.12 0.11 0.07 0.07 0.08 0.16 0.12 0.10
GDP growth (increasing) 0.95 -0.37 0.69 0.94 0.77 1.13 0.92 0.41 0.53
prob 0.01 0.54 0.10 0.08 0.06 0.15 0.00 0.48 0.06
GDP growth (decreasing) 0.97 1.54 0.90 1.13 1.15 0.76 0.65 0.20 1.14
prob 0.02 0.01 0.01 0.18 0.03 0.25 0.03 0.70 0.00
Constant i 0.01 0.05 -0.02 0.00 0.02 -0.05 -0.01 0.02 0.01
prob 0.86 0.44 0.71 0.98 0.75 0.53 0.90 0.87 0.35
Observations 52 52 52 52 52 52 46 52 51Adjusted R-squared 0.76 0.79 0.83 0.84 0.76 0.75 0.85 0.55 0.84Root MSE 0.52 0.47 0.42 0.41 0.50 0.49 0.36 0.67 0.41
General Economy & GDP
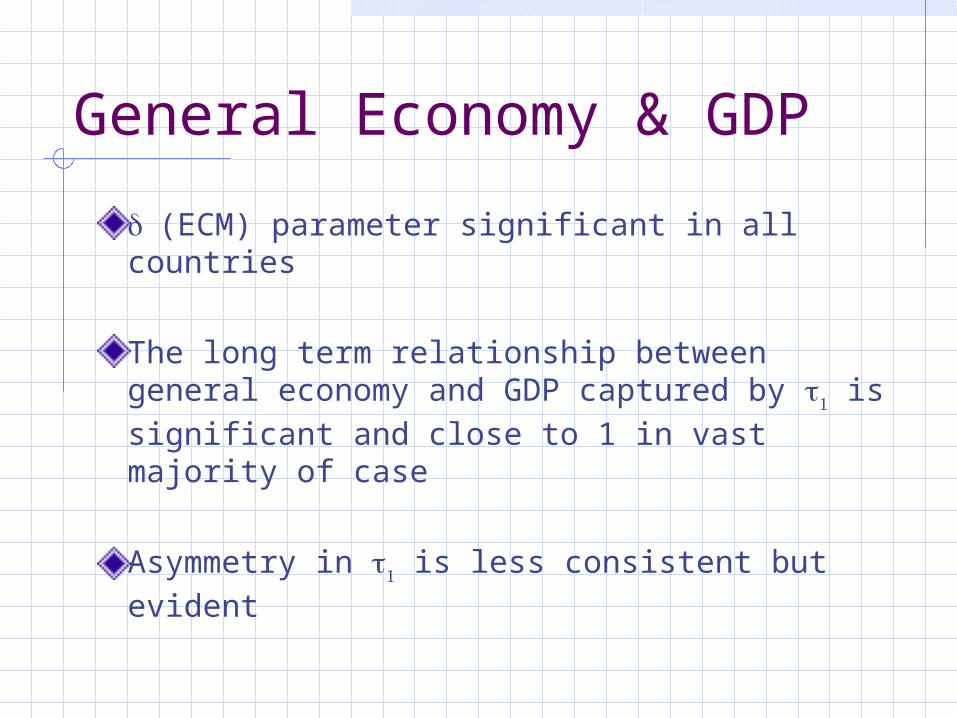
(ECM) parameter significant in all countries
The long term relationship between general economy and GDP captured by is significant and close to 1 in vast majority of case
Asymmetry in is less consistent but evident
Cross national variation
Note there is cross-national variation in
The magnitude of t1
The incidence of asymmetry
Conclusions
Perceptions of the economy and the real economy are in many cases co-integrated and seem to fit an error correction process
There is evidence of distortion
There is also evidence that distortion results from mediated cues
Economic outcomes that are costly to monitor (unemployment) are perceived less well by the mass public than easily monitored outcomes (CPI)
Asymmetry in reactions to positive and negative economic news

Cross-national variation
Long-term equilibrium relationship between series
Asymmetry varies by nation
Suggests role of mediated economic information

The economy, economic attitudes and political preferences

What Drives Popularity Series?
Subjective assessments of the economy – which we think are shaped from mediated representations of the economy?
Or, the real economy?
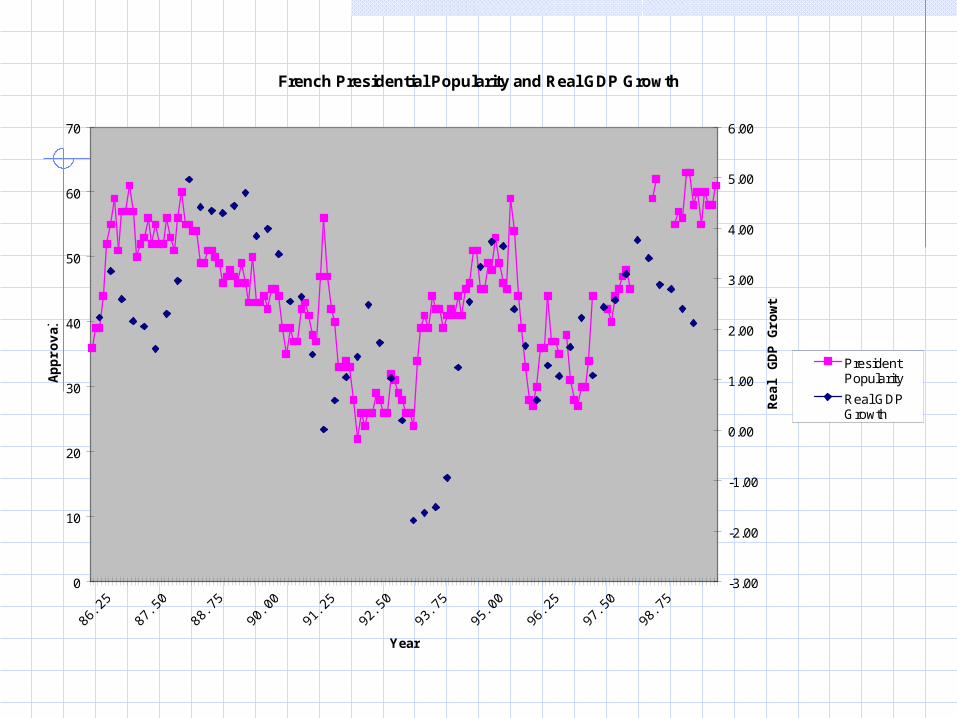
French Presidential Popularity and Real GDP Growth
0
10
20
30
40
50
60
70
86.2
587
.50
88.7
590
.00
91.2
592
.50
93.7
595
.00
96.2
597
.50
98.7
5
Year
Ap
pro
val
-3.00
-2.00
-1.00
0.00
1.00
2.00
3.00
4.00
5.00
6.00
Rea
l GD
P G
row
th
PresidentPopularity
Real GDPGrowth
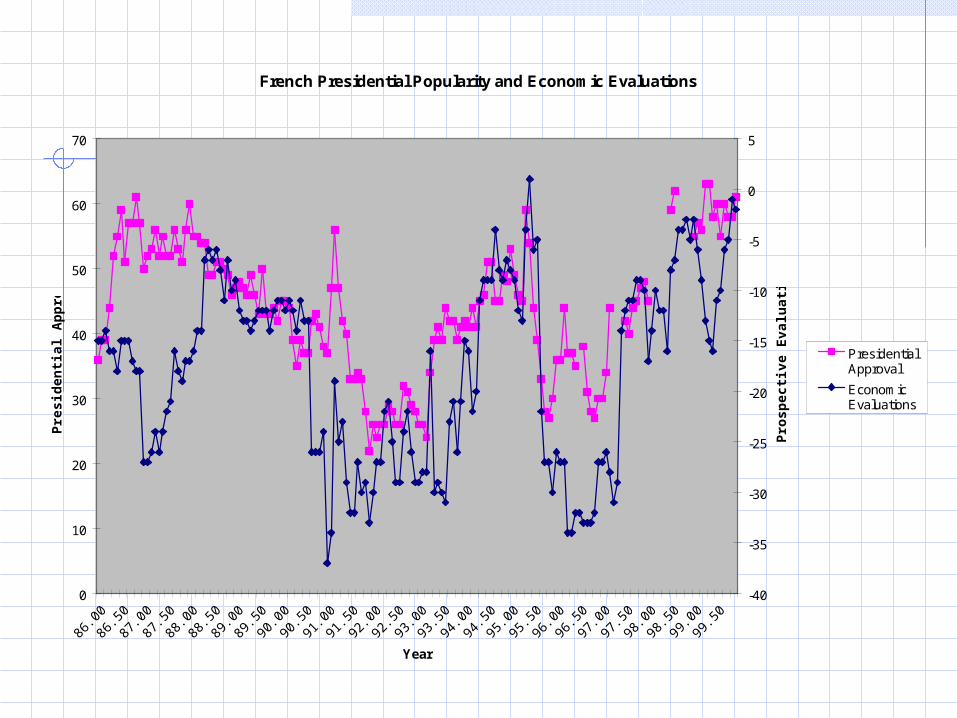
French Presidential Popularity and Economic Evaluations
0
10
20
30
40
50
60
70
86.0
086
.5087
.0087
.5088
.0088
.5089
.0089
.5090
.0090
.5091
.0091
.5092
.0092
.5093
.0093
.5094
.0094
.5095
.0095
.5096
.0096
.5097
.0097
.5098
.0098
.5099
.0099
.50
Year
Pre
sid
enti
al A
pp
rova
l
-40
-35
-30
-25
-20
-15
-10
-5
0
5
Pro
spec
tive
Eva
luat
ion
s
PresidentialApproval
EconomicEvaluations
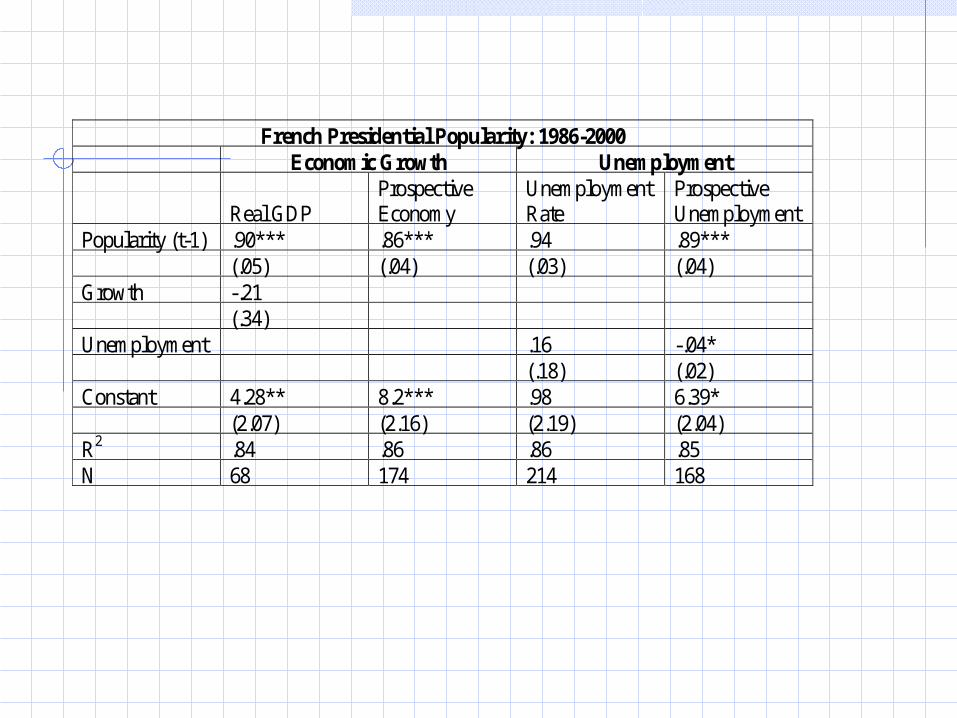
French Presidential Popularity: 1986-2000 Economic Growth Unemployment
Real GDP Prospective Economy
Unemployment Rate
Prospective Unemployment
Popularity (t-1) .90*** .86*** .94 .89*** (.05) (.04) (.03) (.04) Growth -.21 (.34) Unemployment .16 -.04* (.18) (.02) Constant 4.28** 8.2*** .98 6.39* (2.07) (2.16) (2.19) (2.04) R2 .84 .86 .86 .85 N 68 174 214 168