Embed Size (px)
Citation preview
WIDER Working Paper 2018/40
The impact of remittances on household food security
A micro perspective from Tigray, Ethiopia
Nigussie Abadi,1 Ataklti Techane,1 Girmay Tesfay,1 Daniel Maxwell,2 and Bapu Vaitla2
March 2018
1 Department of Natural Resource Economics and Management, College of Dryland Agriculture and Natural Resources, Mekelle University, Ethiopia, corresponding author: [email protected]; 2 Feinstein International Center, Tufts University, Somerville MA, USA.
This research study is released in connection with the WIDER Development Conference on ‘Migration and mobility – new frontiers for research and policy’, jointly organized with the African Research Universities Alliance (ARUA), on 5-6 October 2017 in Accra, Ghana.
Copyright © UNU-WIDER 2018
Information and requests: [email protected]
ISSN 1798-7237 ISBN 978-92-9256-482-7 https://doi.org/10.35188/UNU-WIDER/2018/482-7
Typescript prepared by Ans Vehmaanperä.
The United Nations University World Institute for Development Economics Research provides economic analysis and policy advice with the aim of promoting sustainable and equitable development. The Institute began operations in 1985 in Helsinki, Finland, as the first research and training centre of the United Nations University. Today it is a unique blend of think tank, research institute, and UN agency—providing a range of services from policy advice to governments as well as freely available original research.
The Institute is funded through income from an endowment fund with additional contributions to its work programme from Finland, Sweden, and the United Kingdom as well as earmarked contributions for specific projects from a variety of donors.
Katajanokanlaituri 6 B, 00160 Helsinki, Finland
The views expressed in this paper are those of the author(s), and do not necessarily reflect the views of the Institute or the United Nations University, nor the programme/project donors.
Abstract: While the volume of remittances to developing countries has been growing significantly over the years, the impact of remittances on food security has not received much attention. To bridge the gap this paper has examined the impact of remittances on farm household’s food security status, using a sample of 301 farm households from two livelihood zones of the Tigray Regional State of Ethiopia. The average treatment effect (ATT) results show that households with access to remittance have significantly lower Coping Strategy index (CSI), Reduced Coping Strategy index (rCSI) and Household Food Insecurity Access Scale (HFIAS) on average as compared to households without remittance income. However, there is no significant difference in the ATT effect of remittances on Food Consumption Score (FCS) between treated and control households. These findings suggest that remittances lower the frequency and the severity of coping strategies, and households with remittances have i) lower anxiety about not being able to procure sufficient food; ii) higher ability to secure adequate quality food; and iii) lower experience of insufficient quantity of food intake than those without remittance. Thus, it is imperative to include migration and remittances as important components of food security programs and food security policies in Ethiopia and should go beyond just food production measures, and include measures that help in generating adequate levels of effective demand via income growth or transfers policies.
Keywords: remittance, coping strategy, food insecurity access scale, PSM, Ethiopia
Acknowledgements: The authors gratefully acknowledge the financial support of the Swedish International Development Agency (SIDA). This support has spanned the period from 2010 to 2013 and has supported both the field data collection and the analysis presented in this paper.
We are grateful for the field teams that collected data during the survey that included Ataklti Techane, Bereket Gebre Medhin, Fisseha Gebre Tensae, Selam Yirga, Martha Tekle, Michael Gebre Hiwot, Kidane Hintsa, Lemelem Fitsum, Gebresselassie Hailu, Samson Hadgu, Haile Tewelde, Dawit G/ Her, and Ataklti Haile.
Many colleagues have provided helpful feedback on drafts or early conceptual and analytical puzzles, and we gratefully acknowledge the insights of participants at the African Economic Development conference 2014, Oxford University and WIDER Development Conference on ‘Migration and mobility – new frontiers for research and Policy’ in Accra, Ghana.
1
1 Introduction
The inflow of remittances in developing countries (DCs) has increased dramatically since the 1990s, increasing from US$ 325 billion in 2010, and has emerged as a most important source of private capital flows for dozens of these countries (World Bank, 2011). Ethiopia has experienced a similar trend. For example the World Bank ranks Ethiopia to be the 8th largest remittance receiver in sub-Saharan Africa in 2010, with an inflow of remittances reaching US$ 387 million , to be compared with net Foreign Direct Investment inflows of US$ 100 million and net Overseas Development Assistance (ODI) at US$ 3.3 billion (World Bank, 2011). Not surprisingly, the potential impact of those flows on economic development has also generated considerable interest, both among academics and policy makers.
At the academic level, a number of recent works have explored the impact of remittances on poverty utilizing household consumption and expenditure surveys (HCES) for tracking the impact of remittances on poverty in developing countries (Adams and Page, 2005; Page and Plaza, 2006; Gupta et al., 2009), but this kind of measure is not typically used for rapid assessments in a dynamic contexts as the data are only updated every few years (Maxwell et al., 2013). For example, if remittances help to temporarily smooth consumption and incomes, their poverty impacts may be better captured through an explicit focus on this temporarily as part of poverty or food security measure, instead of restricting to annualized income or consumption (in which case temporary contributions do not always feature as significant). This suggests that there is still a need to increase our understanding about the specific roles of remittances for different strategies in different contexts. Interestingly, with the exception of Babatunde and Martinetti, (2010); Jimenez, (2009); INSTRAW, (2008); Quartey and Blankson, (2004); and Durand et al., (1996) there is no study to our knowledge that subjects to critical empirical scrutiny. Moreover, with the exception of Babatunde and Martinetti (2010), all of them are confined to issues of household food expenditure or calorie availability. This relative importance of rapid, accurate and cross-contextual indicators of food security and the relative dearth of attention given to it by researchers and policy makers alike raise the possibility of significant untapped potential for an improved role of remittances in developing countries, and a significant impact for high quality research that tackles the topic. Many critical questions remain: for example, what connection, if any, is there between remittances and food security indicators? Do remittances improve household food security? What are the characteristics of households receiving remittances? Answering these and other questions can enable us to develop recommendations that maximize the potential role of remittances in countries where there is pervasive poverty and food insecurity.
In fact, Babatunde and Martinetti (2010) in their study of Nigeria used an instrumental variables (IV) approach to investigate the impact of remittances on food security. Their results show that remittance income has a positive and significant effect on calorie supply, but has no effect on dietary quality, micro nutrient and child nutritional status. However, a major limitation of the IV approach is the difficulty in defining instruments in the estimation. In addition, the IV procedure tends to impose a linear functional form assumption, implying that the coefficients on the control variables are similar for treated (remittance households) and control (non-remittance) groups. However, this assumption may not hold, since the coefficients could differ (Jalan and Ravallion, 2003)
Thus by explicitly focusing on food security indicators, this study contributes to the existing literature by empirically examining whether remittances are really contributing to different measures of food security such as (1) Coping Strategy Index (CSI); (2) Reduced Coping Strategies index (rCSI); (3) Household Food insecurity and Access Scale (HFIAS); and (4) Food
2
Consumption Score(FCS) in two livelihood zones of Tigray regional state of Ethiopia based on household survey data collected by the authors as part of a SIDA funded project ‘Livelihood changes overtime during 2011-2013’.
We employ the propensity score matching (PSM) method to control for self–selection that normally arises when remittance-recipient households are not randomly assigned. By explicitly considering the causal relationship between remittances and cross-contextual indicators of food security, this paper seeks to address counterfactual questions that may be significant in predicting the impacts of policy changes and framing our understanding of the potential for remittances to offer potential pathways out of food insecurity.
The remainder of the paper is organized as follows: Section 2 provides a review of related literature on remittances, poverty and food security. Section 3 discusses an overview of remittances in Ethiopia. Section 4 presents the data used in the empirical analysis. Section 5 outlines the empirical procedure. Section 6 discusses the empirical results, while the final section provides concluding remarks
2 Review of literature on remittances, poverty, and food security
The impact of remittances on poverty and income distribution I, developing countries has been extensively investigated (see Adams, 1991; Stark et al., 1988) with mixed findings. While it is agreed that migration and remittances reduce poverty, the magnitude of poverty reduction varies on whether remittance is treated as ‘potential substitute’ or ‘exogenous transfer’. Considering remittance as ‘potential substitute’, Brown and Jimenez (2008) for Tonga and Fiji argued that remittances had large impact in reducing poverty. However, the impact was smaller when they considered remittance as an ‘exogenous transfer’. In the same way Zhu and Luo (2010) for Hubei province of China and Barham and Boucher (1998) for Nicaragua use remittance as a potential substitute to assess the impact on poverty and income distribution.
With regard to the impact of remittance on food security, a few empirical studies have looked into related linkages, but all of them are confined to issues of household food expenditure or calorie availability (Jimenez, 2009; INSTRAW, 2008; Quartey and Blankson, 2004; and Durand et al, 1996) and dietary quality, micronutrient consumption, and nutritional outcomes (Babatunde and Martinetti, 2010).
INSTRAW (2008), in a study on gender, remittances and development in the Philippines found that remittances contribute to the improvement in the food security of receiving households in addition to a significant change in food consumption patterns. Jimenez (2009) conducted a comparative analysis between remittance-receiving households and non-receiving households in the Tlapanala village of Mexico. Results of his analysis show that the consumption patterns do not differ significantly, but food consumption expenditures were higher in remittance-receiving households. In the same way Quartey and Blankson (2004) in their study of Ghana found evidence of increased food consumption among remittance-receiving households.
3 Overview of migration and remittances in Ethiopia
A noticeable degree of out-migration in Ethiopia started in the 1970s following the revolution and political unrests afterwards. During the early days, migration was limited to the urban elite, especially the young and educated, who for political reasons sought refuge in Western countries.
3
Gradually, however, migration has become an aspiration of most urban people, mainly for economic reasons. After the mid-1980s, even rural peasants began flocking to the Middle East and the Gulf region in search of jobs and better pay. Currently, over two million Ethiopians are believed to reside abroad (Aredo, 2005). According to the World Bank’s Migration and Remittances Fact book (2011), the top emigration destination countries for Ethiopians are Sudan, USA, Israel, Djibouti, Kenya, Saudi Arabia, Canada, Germany, Italy, and Sweden (World Bank, 2011).
Despite its large migrant population, Ethiopia has not fully tapped its potential and data on remittance flows is highly problematic (Geda et al., 2011). However, the World Bank ranks Ethiopia to be the 8th largest remittance receiver in sub-Saharan Africa in 2010, with an inflow of remittances reaching US$ 387 million, to be compared with net Foreign Direct Investment inflows of US$ 100 million (World Bank, 2011).
In addition to international migration, Ethiopia also experiences one of the highest levels of internal migration and population distribution in Africa (RESAL, 1999) which is also a big source of remittance. Ethiopia’s internal migration is largely an individual or family response to an adverse socio-economic, physical and political environment as well as direct government policy. In this context, the character, direction and volume of migration in Ethiopia in the last three decades have been shaped by political instability, decline or stagnation in the growth of the agricultural sector and government resettlement programs of the 1980s to tackle famine and attain food security (Mberu, 2006). An important aspect of Ethiopian internal migration is its association with urbanization and shortage of land especially for newly married young people as there was no land re-distribution since 1991.
Despite the large and increasing flow remittances, internal and international, very little is known about the impact that these remittances might have on the households and the country’s economy as a whole (Andersson, 2011). In fact, few case studies such as Anderson (2011) and Aredo (2005) examined the impact of remittances on poverty, but to our knowledge there is no study that tries to investigate the impact of remittances on food security.
4 Data description
The data for this paper come from the Livelihoods Change Over Time (LCOT) four-round panel survey conducted in two districts (woredas) of northern Ethiopia between August 2011 and February 2013 in collaboration with World Vision, a research partnership (funded by the Swedish International Development Agency (SIDA) between the Feinstein International Center and researchers at the College of Dryland Agriculture and Natural Resources, Mekelle University in Tigray). The overall objective of the LCOT panel survey is to assess household resilience in the face of an annually recurring shock: the ‘hunger season’ (for the details see Maxwell et al., 2013; and Vaitla et al., 2012).
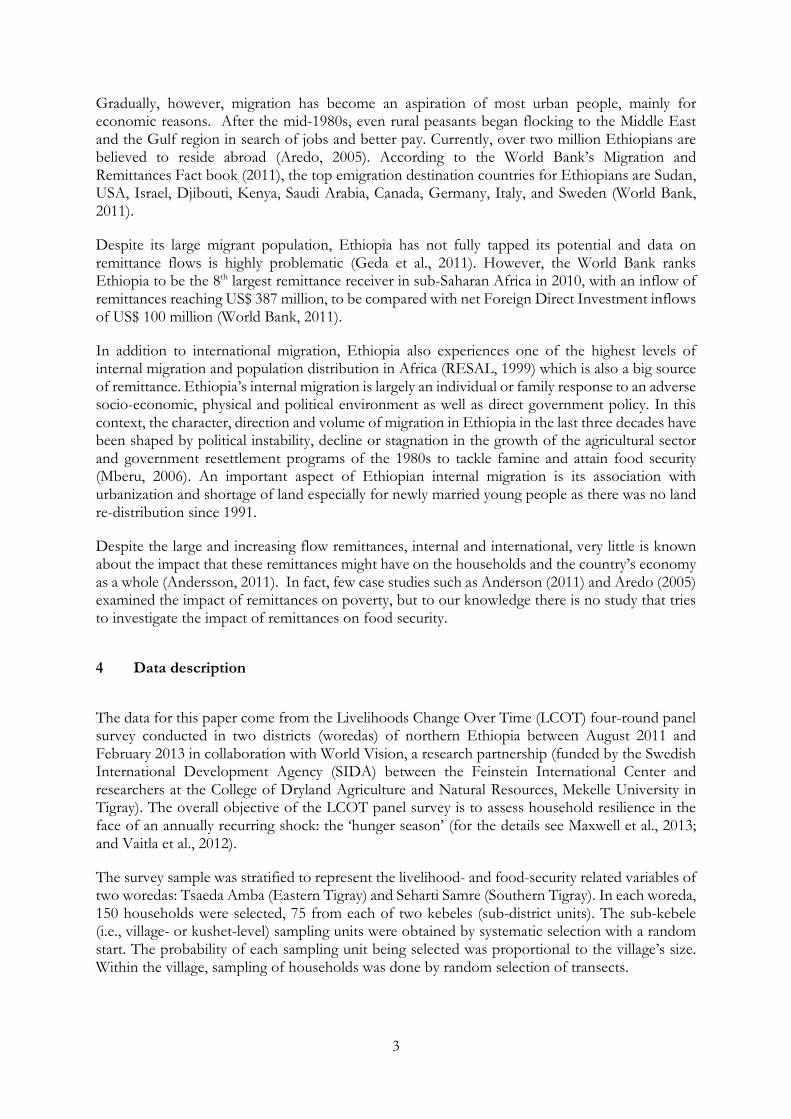
The survey sample was stratified to represent the livelihood- and food-security related variables of two woredas: Tsaeda Amba (Eastern Tigray) and Seharti Samre (Southern Tigray). In each woreda, 150 households were selected, 75 from each of two kebeles (sub-district units). The sub-kebele (i.e., village- or kushet-level) sampling units were obtained by systematic selection with a random start. The probability of each sampling unit being selected was proportional to the village’s size. Within the village, sampling of households was done by random selection of transects.
4
Figure 1: Map of the study area
Source: Authors.
Each survey round not only gathers information on the situation prevailing at the time, but also asks retrospective questions about household decisions and experiences over the six-month period before the survey (i.e., since the last survey round) and, in the case of the food security measures, over the one month preceding the survey.
5
5 Empirical procedure
One of the main challenges when estimating the causal effects of remittances on household food security measures is self-selection. There might be unobservable characteristics that affect both the probability that the household receives remittances (and migrates) and the outcome of interest. If selection into sending remittances is not a random decision, analysis of the effect of remittances on household food security will give biased estimates unless the problem of self-selection is addressed.
Previous studies have used a number of approaches to address selectivity into migration and remittance sending, including assuming selection on observables (e.g. Adams, 1989), parametric selection correction models (e.g. Barham and Butcher, 1998), instrumental variables (e.g. Mansuri, 2006; McKenzie and Rapport, 2010), and propensity score matching (Esquivel and Huuerta, 2007; Cox-Edwards et al., 2009). In this paper the last method is applied.
Propensity score matching is often used in a program evaluation setting, where the objective is to compare participant outcome with and without treatment. The method was first proposed as a way to reduce bias in estimation of treatment effects with observational data in the seminal work by Rosenbaum and Rubin (1983), and has become a popular method to measure the impact of economic policy interventions (Becker and Ichino, 2002). The idea is to first create an index that summarizes observable characteristics of the household into a propensity score index. The households are then divided into two groups, those who receive remittances and those who don’t, and ranked according to their propensity score. Finally the households are matched with similar households from the other group. In this way households in the treatment group can be matched and compared with households from the control group who have similar characteristics in every aspect except that they don’t receive remittances.
In equation form, our goal is to estimate the causal treatment effect following Andersson (2012).
𝜏𝜏𝑖𝑖 = 𝑌𝑌𝑖𝑖1 - 𝑌𝑌𝑖𝑖0 (1)
Where 𝑌𝑌𝑖𝑖1 and 𝑌𝑌𝑖𝑖0 is the outcome with and without treatment respectively for household 𝑖𝑖.
Consider 𝐷𝐷= {0,1} to be a binary indicator where 1 equals being assigned into treatment and 0 means not being assigned treatment. The Average Treatment Effects (ATE) can be estimated through:
𝜏𝜏𝐴𝐴𝐴𝐴𝐴𝐴 = 𝐸𝐸[𝑌𝑌𝑖𝑖|𝐷𝐷𝑖𝑖 = 1] − 𝐸𝐸[𝑌𝑌𝑖𝑖|𝐷𝐷𝑖𝑖 = 0] (2)
ATE is hence the average difference between the treated households (in our context treated households are households who receives remittances) and the non-treated households. However, such comparison might not capture the true impact of the treatment if we have selection into treatment and there are other factors that are correlated with both treatment and some omitted variable that is affecting the outcome variable. A fundamental problem is that we can observe the outcome variable under either treatment or control for each household, but never both at the same time.
In this context, a preferred parameter to use instead of ATE is the Average Treatment Effect on the Treated (ATT), defined by:
𝐴𝐴𝐴𝐴𝐴𝐴 = 𝐸𝐸[𝑌𝑌1|𝐷𝐷 = 1] − 𝐸𝐸[𝑌𝑌0|𝐷𝐷 = 1] (3)
6
Where 𝐸𝐸[𝑌𝑌1|𝐷𝐷 = 1] is never observed. Replacing 𝐸𝐸[𝑌𝑌0|𝐷𝐷 = 1] by the expected value of [𝑌𝑌0|𝐷𝐷 = 0], which is observable in ATE, would not give an accurate estimate as long as 𝑌𝑌0 for the treated and comparison group systematically differs. The true parameter is only identified if:
𝐸𝐸[𝑌𝑌0|𝐷𝐷 = 1] − 𝐸𝐸[𝑌𝑌0|𝐷𝐷 = 0] = 0 (4)
As discussed above, this is not very likely to hold in non-experimental studies. Instead we rely on a matching approach in order to derive a counterfactual that enables us to match treated households with non-treated households with as similar characteristics as possible in order to reduce the bias from self-selection. The matching is made based on an index, the propensity score, summarizing the pre-treatment characteristics of each household. The propensity score is the probability of assignment into treatment,𝑝𝑝(𝑥𝑥), conditional on a set of pre-treatment characteristics, 𝑋𝑋, so that
𝑝𝑝(𝑥𝑥) = Pr[𝐷𝐷 = 1|𝑋𝑋] = 𝐸𝐸[𝐷𝐷|𝑋𝑋] (5)
There are a few restrictions that should be fulfilled when implementing the propensity score procedure. The conditional independence assumption (CIA) requires that the outcome variable is independent of treatment conditional on the propensity score. The balancing property theorem tells us that two households with the same predicted probability of being treated (i.e. receive remittances in this case) and belonging to two different groups (treated and non-treated) differ when it comes to the error term in the propensity score equation. The error term is furthermore approximately independent of the observed covariates. In other words, for balancing property to be satisfied, households with the same propensity score must have the same distribution of observable and unobservable characterstics irrespective of treatment status. The balancing property can be tested using a covariate imbalance test. Common support implies that analysis is only carried out when there are sufficient data. Hence, there is no extrapolation outside the range of the observed data points. It is therefore advisable to impose a common support restriction when estimating the propensity score in order to improve the quality of matches.
The propensity score can be estimated using any discrete choice model using observable characteristics to reduce the bias that is attributable to unobservable factors. The extent to which the bias is reduced depends on the quality of the conditioning variables (Becker and Ichino, 2002). In addition previous studies have shown that matching methods provide reliable estimates of impact provided that (1) the same data source is used for participants and non-participants (in this case households that receive remittances and that did not); (2) treated and controls have access to the same markets; and (3) the data include meaningful variables capable of identifying program participation and outcomes (Heckman et al., 1997).We believe that each of these criteria is satisfied in this study. All data come from the 2011 household survey, with the samples of treated and controls drawn from the same tabia to assure comparability of markets and local context. In addition, the diversity of variables we have chosen accomplishes this objective. Our observable characteristics include a rich set of household, community and village-level characteristics. Household characteristics control for differences in endowments such as productive assets and serve as a proxy for household wealth, which is likely to influence household’s receipt of remittance. We also include community-level variables to take account of differences in economic opportunities available to households living in different communities. We add village-level dummies to control for natural, political, and economic differences across villages. This specification is consistent with previous empirical literature on the determinants of remittance (see for example Aredo, 2005; Andersson, 2012; Bohra-Mishra, 2011).
7
Our interest is to disentangle the causal effect of migrant remittance on some outcome (food security indicators). Accordingly we calculate propensity scores using a standard probit (similar to the one described above) where the binary dependent variable represents the two alternatives that we want to compare, i.e. households receiving remittance and those that do not. Next we match treated and control groups with the same or similar propensity score (see Becker and Ichino (2002) for more details on the assumption behind estimation).
A number of matching algorithms have been suggested in the literature to match treated and control groups of similar propensity scores. The most widely employed algorithms include the nearest neighbors matching, calliper matching, and the kernel matching methods. In the first, the nearest matching estimators with replacement, we compare a treated (households with remittance) and controls group (non-remittance households) whose propensity scores are sufficiently close, by recognizing that it is impossible to obtain exact propensity scores for all pairings of treated and control households, and that a control household can be a best match for more than one treated household. In the second, we try Kernel matching. Rather than one treated with one control, we can use several controls, to act as the matches for a treated group. The idea is to calculate the average propensity score from a neighbourhood of propensity of several comparison members (non-remittance households), match this average propensity score to the propensity score of a treated (remittance households) and then proceed to obtain the average treatment effect in equation (3). We use kernel to test the robustness of the results. Finally, we take the difference in food security indicators between the matched treated and control groups and sum over all the differences between them.
5.1 Outcome variables
Given the multidimensional nature of food security, practitioners and policy makers have long recognized the need for a variety of means for measurement (Kennedy, 2003). Although there are different indicators of food security (food insecurity) which are well correlated, they tend to capture different elements of food insecurity. For example the coping strategy index (CSI) and the reduced coping strategy index (rCSI) tend to capture the element of quantity or sufficiency, the household food security access scale (HFIAS) captures a mix of sufficiency and physiological factors, while the food consumption score (FCS) capture quality, diversity and quantity as well (Vatilla et al., 2013). Accordingly we used these different indicators as outcome variables to investigate the impact of remittances defined by the authors as follows.
Coping Strategies Index (CSI). The Coping Strategies Index, developed by Maxwell (1996), looks at the behaviours exercised by households in order to cope with a food deficit. Questions about eleven types of behaviours—ranging from changes in dietary patterns to alternative strategies for obtaining food—and their frequency are asked of households, and the resulting score ranges from 0 to 108. The index combines the frequency and severity of coping strategies, so the higher the index score, the more food insecure the household is.
Reduced Coping Strategies Index (rCSI). Like the CSI, the reduced coping strategy (rCSI) index also combines the frequency and severity of coping strategies, so the higher the index score, the more food insecure the household is.
Household Food Insecurity and Access Scale (HFIAS). The HFIAS, developed by Coates et al. (2007), focuses on three dimensions of food access: anxiety about not being able to procure sufficient food, the inability to secure adequate quality of food, and the experience of insufficient quantity of food intake. Nine questions about these topics are used to calculate a score ranging from 0 to 27, with higher scores indicating greater food insecurity.
8
Food Consumption Score (FCS). The Food Consumption Score is a measure of dietary diversity developed by the World Food Programme (Wiesmann et al. 2009, WFP 2008). It asks about frequency of consumption over the past month for cereals and tubers, pulses, vegetables, fruit, meat and fish, milk, sugar, and oil. The scale ranges from 0 to 64, with 0–12 considered poor food consumption, 12.5–20 considered borderline food consumption, and scores above 20 considered adequate food consumption. (Note that, unlike HFIAS and CSI, higher FCS indicates improved food security.)
5.2 Independent variables
The first step in the analysis is to estimate the probability of receiving remittances, a function of individual and household characteristics. Table 2 presents the probit regression to determine which variables predict the probability of receiving remittances. The household-level variables include literacy, dependency ratio, family size, support network score, social participation score, aggregate impact of shocks, number of migrant household members, and value of productive asset owned, TLU and total planted land. Individual-level variables include age and gender of the household head.
The probability of receiving remittances is expected to be positively correlated with the number of migrant households, since the ability to send a remittance increases if there are more household members migrating to other areas. Receiving remittance is also expected to increase with household size, since it means more members to support. Dependency ratio is expected to influence the probability of access to remittances in one or the other way. Households with a relatively large number of dependents are often poor and resort to transfers. In this paper dependency ratio is arrived by taking the ratio of all household members under the age of 15 and above the age of 64 (considered dependents) to all household members between ages 15 and 64.
Household headship can influence the flows of remittance. Given the feminization of poverty which has been taking place over years in Ethiopia, the probability of getting access to remittances is expected to be higher with female-headed households as compared to conjugal households. The effect of age on access to remittance is accommodated by incorporating the age of the household head. Although it is difficult to predict the effects of age on remittance transfers on apriori grounds, it may be possible to expect that remittances are more accessible to the elderly than the young.
6 Results and discussion
6.1. Descriptive statistics results
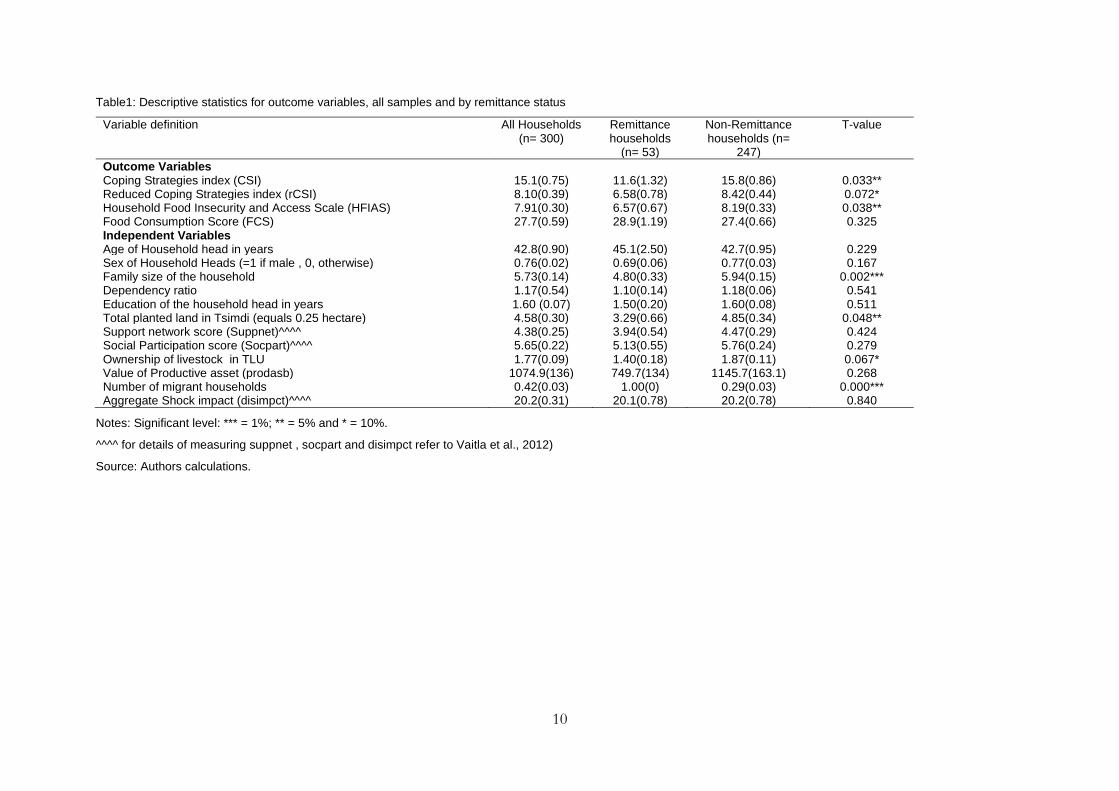
Table 1 presents the definitions and sample statistics of the variables used in the analysis. Also presented in the tables are differences in means of the variables used in the matching analyses along with their significance levels. The significance levels suggest that there are some differences between treated and control households with respect to household and outcome variables. With regard to the outcome variables, there appear to be statistically significant differences in household coping strategy index (CSI), reduced coping strategy index (rCSI), and household food insecurity access scale (HFIAS).
There are also significant differences in family size, total planted land, and TLU between treated and control households.
9
The findings from this section that simply compare mean differences in the outcome variables and other household variables between treated (household that receive remittance) and control groups (non-receivers of remittance) suggest that treated households are generally better off than control groups. Given that the comparisons of mean differences do not account for the effect of other characteristics of farm households, they may confound the impact of migrant remittances on food security status with the influence of other household characteristics. Multivariate approaches that account for selection bias arising from the fact that treated and control groups may be systematically different are essential in providing sound estimates of the impact of migrant remittance on food security indicators. The independent variables used in the probit regression models to predict the propensity scores were based on past research on determinants remittance transfers (Aredo, 2005; Andersson, 2012; Bohra-Mishra, 2011)
10
Table1: Descriptive statistics for outcome variables, all samples and by remittance status
Variable definition All Households (n= 300)
Remittance households
(n= 53)
Non-Remittance households (n=
247)
T-value
Outcome Variables Coping Strategies index (CSI) 15.1(0.75) 11.6(1.32) 15.8(0.86) 0.033** Reduced Coping Strategies index (rCSI) 8.10(0.39) 6.58(0.78) 8.42(0.44) 0.072* Household Food Insecurity and Access Scale (HFIAS) 7.91(0.30) 6.57(0.67) 8.19(0.33) 0.038** Food Consumption Score (FCS) 27.7(0.59) 28.9(1.19) 27.4(0.66) 0.325 Independent Variables Age of Household head in years 42.8(0.90) 45.1(2.50) 42.7(0.95) 0.229 Sex of Household Heads (=1 if male , 0, otherwise) 0.76(0.02) 0.69(0.06) 0.77(0.03) 0.167 Family size of the household 5.73(0.14) 4.80(0.33) 5.94(0.15) 0.002*** Dependency ratio 1.17(0.54) 1.10(0.14) 1.18(0.06) 0.541 Education of the household head in years 1.60 (0.07) 1.50(0.20) 1.60(0.08) 0.511 Total planted land in Tsimdi (equals 0.25 hectare) 4.58(0.30) 3.29(0.66) 4.85(0.34) 0.048** Support network score (Suppnet)^^^^ 4.38(0.25) 3.94(0.54) 4.47(0.29) 0.424 Social Participation score (Socpart)^^^^ 5.65(0.22) 5.13(0.55) 5.76(0.24) 0.279 Ownership of livestock in TLU 1.77(0.09) 1.40(0.18) 1.87(0.11) 0.067* Value of Productive asset (prodasb) 1074.9(136) 749.7(134) 1145.7(163.1) 0.268 Number of migrant households 0.42(0.03) 1.00(0) 0.29(0.03) 0.000*** Aggregate Shock impact (disimpct)^^^^ 20.2(0.31) 20.1(0.78) 20.2(0.78) 0.840
Notes: Significant level: *** = 1%; ** = 5% and * = 10%.
^^^^ for details of measuring suppnet , socpart and disimpct refer to Vaitla et al., 2012)
Source: Authors calculations.
11
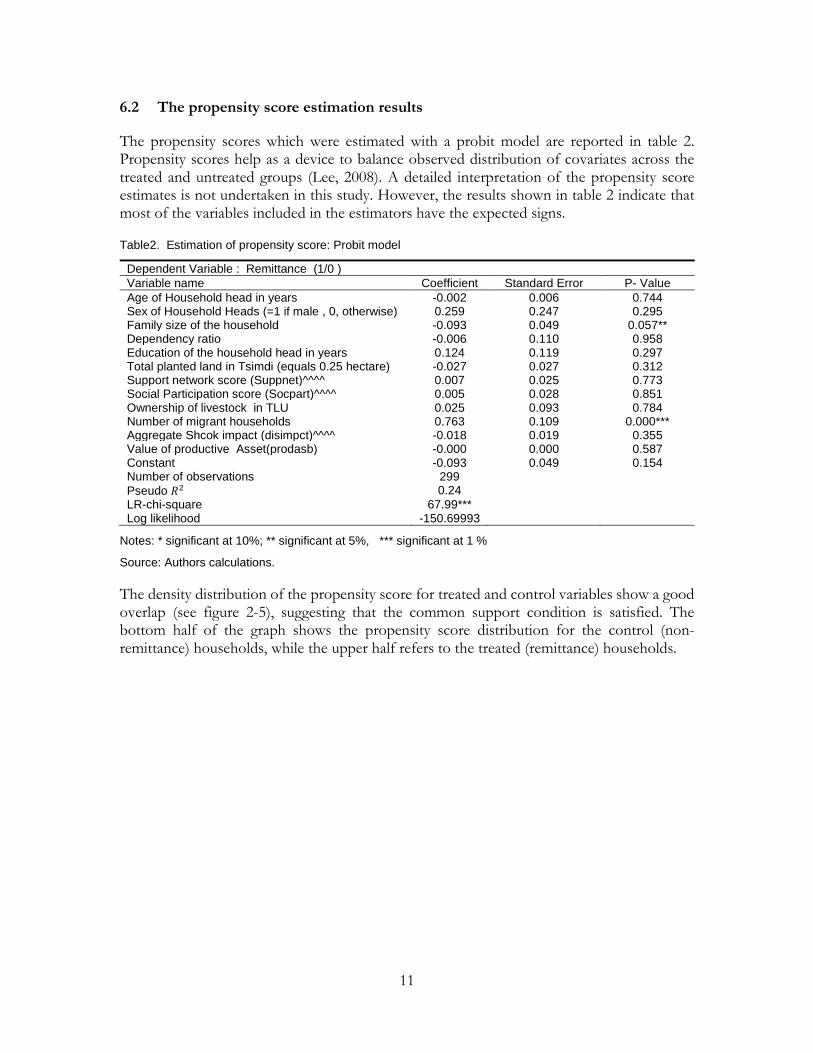
6.2 The propensity score estimation results
The propensity scores which were estimated with a probit model are reported in table 2. Propensity scores help as a device to balance observed distribution of covariates across the treated and untreated groups (Lee, 2008). A detailed interpretation of the propensity score estimates is not undertaken in this study. However, the results shown in table 2 indicate that most of the variables included in the estimators have the expected signs.
Table2. Estimation of propensity score: Probit model
Notes: * significant at 10%; ** significant at 5%, *** significant at 1 %
Source: Authors calculations.
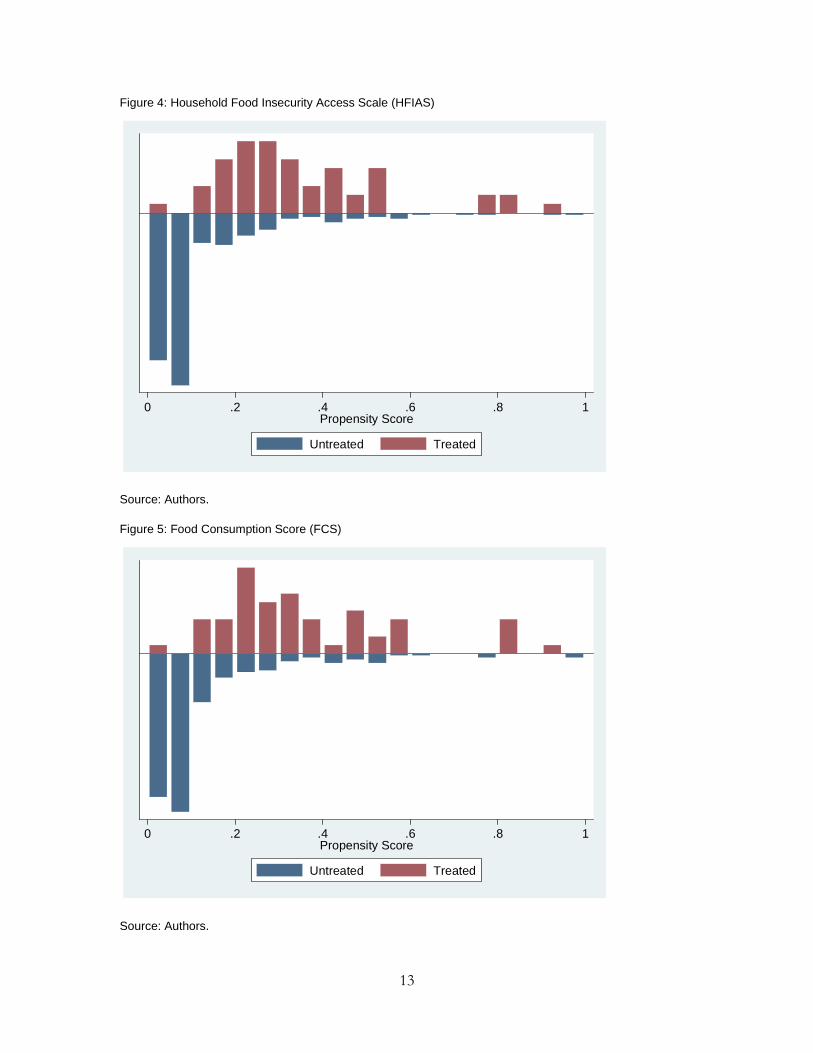
The density distribution of the propensity score for treated and control variables show a good overlap (see figure 2-5), suggesting that the common support condition is satisfied. The bottom half of the graph shows the propensity score distribution for the control (non- remittance) households, while the upper half refers to the treated (remittance) households.
Dependent Variable : Remittance (1/0 ) Variable name Coefficient Standard Error P- Value Age of Household head in years -0.002 0.006 0.744 Sex of Household Heads (=1 if male , 0, otherwise) 0.259 0.247 0.295 Family size of the household -0.093 0.049 0.057** Dependency ratio -0.006 0.110 0.958 Education of the household head in years 0.124 0.119 0.297 Total planted land in Tsimdi (equals 0.25 hectare) -0.027 0.027 0.312 Support network score (Suppnet)^^^^ 0.007 0.025 0.773 Social Participation score (Socpart)^^^^ 0.005 0.028 0.851 Ownership of livestock in TLU 0.025 0.093 0.784 Number of migrant households 0.763 0.109 0.000*** Aggregate Shcok impact (disimpct)^^^^ -0.018 0.019 0.355 Value of productive Asset(prodasb) -0.000 0.000 0.587 Constant -0.093 0.049 0.154 Number of observations 299 Pseudo 𝑅𝑅2 0.24 LR-chi-square 67.99*** Log likelihood -150.69993

12
Figure 2: Coping Strategy index (CSI)
Source: Authors:
Figure 3: Reduced Coping Strategy Index (rCSI)
Source: Authors.
0 .2 .4 .6 .8 1Propensity Score
Untreated Treated
0 .2 .4 .6 .8 1Propensity Score
Untreated Treated
13
Figure 4: Household Food Insecurity Access Scale (HFIAS)
Source: Authors.
Figure 5: Food Consumption Score (FCS)
Source: Authors.
0 .2 .4 .6 .8 1Propensity Score
Untreated Treated
0 .2 .4 .6 .8 1Propensity Score
Untreated Treated
14
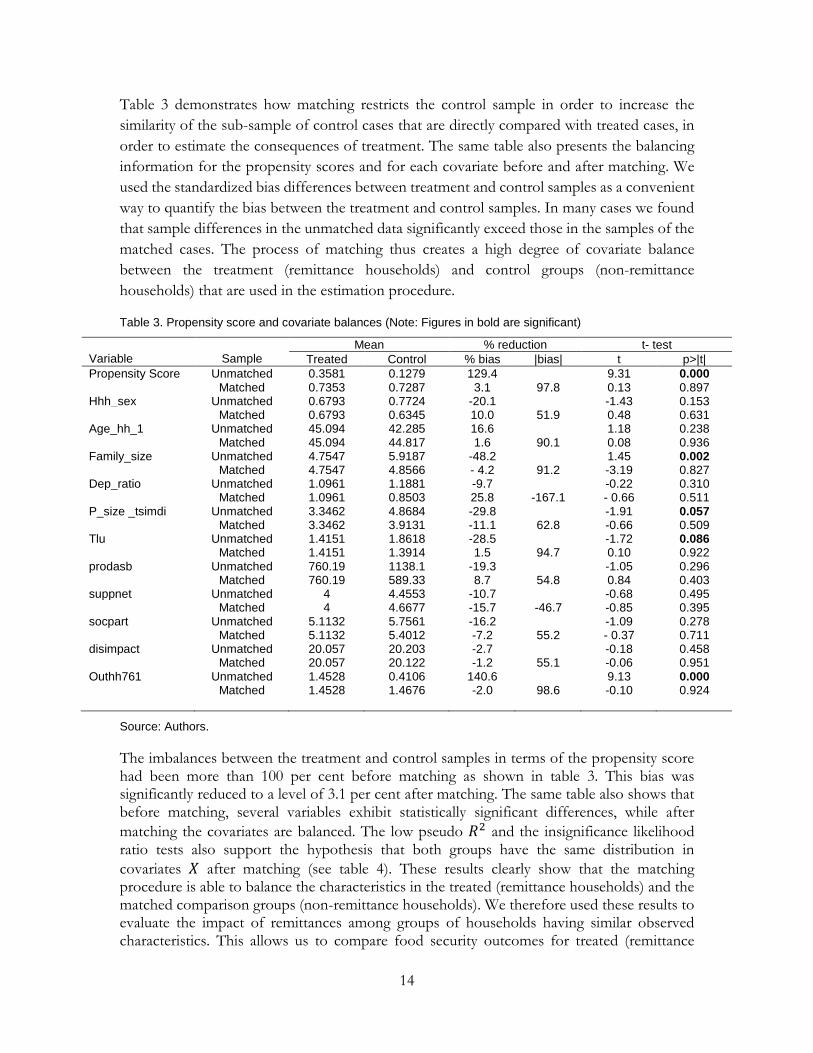
Table 3 demonstrates how matching restricts the control sample in order to increase the similarity of the sub-sample of control cases that are directly compared with treated cases, in order to estimate the consequences of treatment. The same table also presents the balancing information for the propensity scores and for each covariate before and after matching. We used the standardized bias differences between treatment and control samples as a convenient way to quantify the bias between the treatment and control samples. In many cases we found that sample differences in the unmatched data significantly exceed those in the samples of the matched cases. The process of matching thus creates a high degree of covariate balance between the treatment (remittance households) and control groups (non-remittance households) that are used in the estimation procedure.
Table 3. Propensity score and covariate balances (Note: Figures in bold are significant)
Variable
Sample
Mean % reduction t- test Treated Control % bias |bias| t p>|t|
Propensity Score Unmatched 0.3581 0.1279 129.4 9.31 0.000 Matched 0.7353 0.7287 3.1 97.8 0.13 0.897 Hhh_sex Unmatched 0.6793 0.7724 -20.1 -1.43 0.153 Matched 0.6793 0.6345 10.0 51.9 0.48 0.631 Age_hh_1 Unmatched 45.094 42.285 16.6 1.18 0.238 Matched 45.094 44.817 1.6 90.1 0.08 0.936 Family_size Unmatched 4.7547 5.9187 -48.2 1.45 0.002 Matched 4.7547 4.8566 - 4.2 91.2 -3.19 0.827 Dep_ratio Unmatched 1.0961 1.1881 -9.7 -0.22 0.310 Matched 1.0961 0.8503 25.8 -167.1 - 0.66 0.511 P_size _tsimdi Unmatched 3.3462 4.8684 -29.8 -1.91 0.057 Matched 3.3462 3.9131 -11.1 62.8 -0.66 0.509 Tlu Unmatched 1.4151 1.8618 -28.5 -1.72 0.086 Matched 1.4151 1.3914 1.5 94.7 0.10 0.922 prodasb Unmatched 760.19 1138.1 -19.3 -1.05 0.296 Matched 760.19 589.33 8.7 54.8 0.84 0.403 suppnet Unmatched 4 4.4553 -10.7 -0.68 0.495 Matched 4 4.6677 -15.7 -46.7 -0.85 0.395 socpart Unmatched 5.1132 5.7561 -16.2 -1.09 0.278 Matched 5.1132 5.4012 -7.2 55.2 - 0.37 0.711 disimpact Unmatched 20.057 20.203 -2.7 -0.18 0.458 Matched 20.057 20.122 -1.2 55.1 -0.06 0.951 Outhh761 Unmatched 1.4528 0.4106 140.6 9.13 0.000 Matched 1.4528 1.4676 -2.0 98.6 -0.10 0.924
Source: Authors.
The imbalances between the treatment and control samples in terms of the propensity score had been more than 100 per cent before matching as shown in table 3. This bias was significantly reduced to a level of 3.1 per cent after matching. The same table also shows that before matching, several variables exhibit statistically significant differences, while after matching the covariates are balanced. The low pseudo 𝑅𝑅2 and the insignificance likelihood ratio tests also support the hypothesis that both groups have the same distribution in covariates 𝑋𝑋 after matching (see table 4). These results clearly show that the matching procedure is able to balance the characteristics in the treated (remittance households) and the matched comparison groups (non-remittance households). We therefore used these results to evaluate the impact of remittances among groups of households having similar observed characteristics. This allows us to compare food security outcomes for treated (remittance
15
households) with the comparison group (non-remittance households) showing a common support.
Table 4. Other covariate balance indicators before and after matching
Notes: * significant at 10%; ** significant at 5%, *** significant at 1 %
Source: Authors.
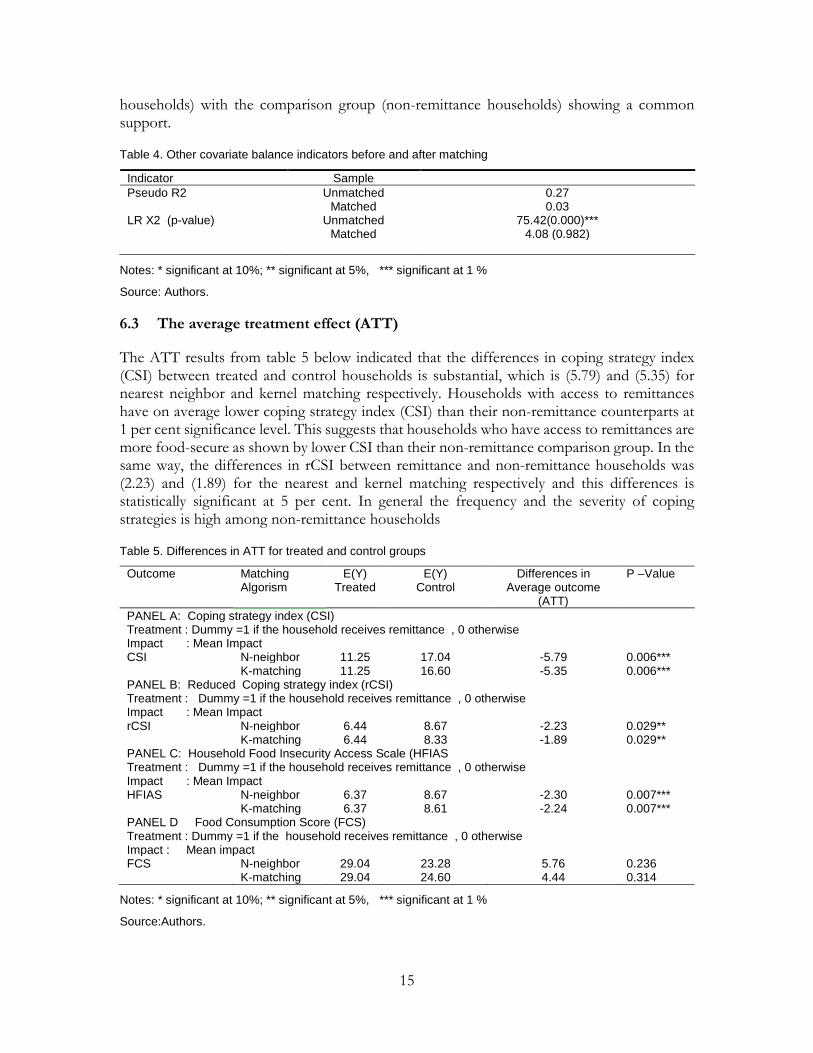
6.3 The average treatment effect (ATT)
The ATT results from table 5 below indicated that the differences in coping strategy index (CSI) between treated and control households is substantial, which is (5.79) and (5.35) for nearest neighbor and kernel matching respectively. Households with access to remittances have on average lower coping strategy index (CSI) than their non-remittance counterparts at 1 per cent significance level. This suggests that households who have access to remittances are more food-secure as shown by lower CSI than their non-remittance comparison group. In the same way, the differences in rCSI between remittance and non-remittance households was (2.23) and (1.89) for the nearest and kernel matching respectively and this differences is statistically significant at 5 per cent. In general the frequency and the severity of coping strategies is high among non-remittance households
Table 5. Differences in ATT for treated and control groups
Notes: * significant at 10%; ** significant at 5%, *** significant at 1 %
Source:Authors.
Indicator Sample Pseudo R2 Unmatched 0.27 Matched 0.03 LR X2 (p-value) Unmatched 75.42(0.000)*** Matched 4.08 (0.982)
Outcome Matching Algorism
E(Y) Treated
E(Y) Control
Differences in Average outcome
(ATT)
P –Value
PANEL A: Coping strategy index (CSI) Treatment : Dummy =1 if the household receives remittance , 0 otherwise Impact : Mean Impact CSI N-neighbor 11.25 17.04 -5.79 0.006*** K-matching 11.25 16.60 -5.35 0.006*** PANEL B: Reduced Coping strategy index (rCSI) Treatment : Dummy =1 if the household receives remittance , 0 otherwise Impact : Mean Impact rCSI N-neighbor 6.44 8.67 -2.23 0.029** K-matching 6.44 8.33 -1.89 0.029** PANEL C: Household Food Insecurity Access Scale (HFIAS Treatment : Dummy =1 if the household receives remittance , 0 otherwise Impact : Mean Impact HFIAS N-neighbor 6.37 8.67 -2.30 0.007*** K-matching 6.37 8.61 -2.24 0.007*** PANEL D Food Consumption Score (FCS) Treatment : Dummy =1 if the household receives remittance , 0 otherwise Impact : Mean impact FCS N-neighbor 29.04 23.28 5.76 0.236 K-matching 29.04 24.60 4.44 0.314
16
In the ATT result for the outcome variable household food insecurity and access scale (HFIAS), a similar trend is reflected. Treated households (households with access to remittance) in the matched sample have lower HFIAS than their comparison (non- remittance) households. The difference between the two groups is (2.30) and (2.24) for nearest neighbour and kernel matching respectively. This again suggests that households with access to remittance are better off in terms of food access than non-remittance households i.e. households with remittance have lower anxiety about not being able to procure sufficient food, higher ability to secure adequate quality food, and lower experience of insufficient quantity of food intake than those without remittance. Again this difference in HFIAS between households with remittance and non-remittance households is significant at 5 per cent for both matching algorithms.
Finally, the ATT difference in FCS revealed that households with remittance have higher FCS than the non-remittance households. The difference in FCS between remittance households and non-remittance households was 5.76 and 4.44 for nearest and kernel matching methods respectively. However, these differences in FCS between treated and control groups are not statistically significant.
7 Conclusions and policy implications
This paper has examined the impact of remittances on farm household’s food security status, using a sample of 301 farm households from two livelihood zones of the Tigray Regional State of Ethiopia. A propensity score matching model was employed to account for selection bias that normally occurs when unobservable factors influence both treatment and outcome variables such as the food security indicators.
Descriptive analysis of the sample data indicates that, compared to non-receiving households, remittance-receiving households are better off in terms of mean total CIS, rCSI as well as HFIAS. Results of the propensity score matching also show that remittances exert a positive and statistically significant effect on household food security indicators i.e. households with access to remittance have lower CSI, rCSI and HFIAS as compared to households without remittance income. These findings are generally consistent with the widely held view that remittance provides food security and poverty alleviation in rural areas of developing countries.
Our findings point to two policy recommendations. First, the positive impact of remittances on CSI, rCSI as well as HFIAS makes it imperative to include migration and remittances as important components of food security programmes in developing countries such as Ethiopia. Food security policies should go beyond just food production measures, and include measures that help in generating adequate levels of effective demand via income growth or transfers policies. In particular, in designing social security policies, governments of developing countries such as Ethiopia should take into account the role played by remittance transfers in addressing food insecurity. It is also high time for governments to seriously consider the need for providing incentives to promote the flows of transfers among families. In particular poverty reduction strategy papers such the Growth and Transformation Plan of the Ethiopian government should incorporate migration-cum-remittances into their program.
17
References
Adams, Jr., R. (1989). Worker Remittances and Inequality in Rural Egypt. Economic Development and Cultural Change, 38(1), pp. 45-71.
Adams, R.H. (1991). The effects of international remittances on poverty, inequality and development in rural Egypt. IFPRI Research Report 86. Washington, DC: International Food Policy Research Institute.
Adams, R. H., and Page, J. (2005). Do international migration and remittance reduce poverty in developing countries? World Development, 33(10), 1645–1669.
Andersson, L.(2012). Migration, Remittances and Household Welfare in Ethiopia. Work in progress: Unversity of Gothenburg.
Aredo, D. (2005). Migrant remittances, shocks and poverty in urban Ethiopia: An analysis of micro level panel data. Mimeo, Addis Ababa University.
Babatunde, R.O., Martinetti, E.C. (2011). ‘Impacts of migrant remittances on food security and nutrition of Farming Households in Kwara State, Nigeria’. Contributed paper for the International Conference: Shocks in Developing Countries. June 30 – July 1, 2011, Paris, France.
Barham, B., & Boucher, S. (1998). Migration, remittances, and inequality: Estimating the net effects of migration on income distribution. Journal of Development Economics, 55(2), 307–331.
Becker and Ichino, (2002). Estimation of average treatment effects based on propensity scores. The Stata Journal, Number 4, pp. 358-377.
Bohra-Mishra.P. (2011). ‘Migration and Remittances during the period of Civil Conflict in Nepal’. Ph.D thesis. Princeton: Woodrow Wilson School of Public and International Affairs, Princeton University.
Brown, R., & Jimenez, E. (2008). Policy arena: estimating the net effects of migration and remittances on poverty and inequality: comparison of Fiji and Tonga. Journal of International Development, 20, 547–571.
Cox-Edwards and Rodriguez-Oreggia (2009). Remittances and Labor force participation in Mexico: An Analysis Using Propensity Score Matching. World Development, Vol.37,No. 5, pp 1004-1014.
Durand, J., W. Kandel, E.A. Parrado and D.S. Massey. (1996): International migration and Development in Mexican communities. Demography, 33(2): 249–264.
Esquivel, G., and Huerta-Pineda, A. (2007). Remittances and Poverty in Mexico: A Propensity score matching Approach. Integration and Trade, No. 27, pp.45-71.
Geda,A., Tafere,K., and Amedu,M. (2011). Remittance and Remittance Service Providers in Ethiopia. IAES Working Paper No WP-A02-2011. Atlanta: International Atlantic Economic Society.
Gupta, S., Pattillo, C.A., and Wagh, S. (2009). Effect of remittances on poverty and financial development in Sub-Saharan Africa. World Development, 37(1): 104–115.
18
Heckman, J., Ichimura, H. und Todd, P. E. (1997). Matching as an econometric evaluation estimator: evidence from evaluating a job training program. Review of Economic Studies 64, H. 4, S. 605-654.
INSTRAW (2008). Gender, remittances and development: The case of Filippino migration to Italy. Santo Domingo: United Nations International Research and Training Institute for the Advancement of Women (UN-INSTRAW).
Jalan, J. and M. Ravallion (2003). Estimating the benefit incidence of an anti-poverty program by propensity-score matching. Journal of Business and Economic Statistics 21(1):19–30.
Jimenez, M.A.C. (2009). Household development in Tlapanana: A comparative study between households receiving remittances and households not receiving remittances. Journal of Poverty, 13(3): 331–349.
Kennedy, E. (2003) ’Qualitative Measures of Food Insecurity and Hunger. In FAO (2003), pp. 165-84.
Lee, W. (2008). Propensity Score Matching and Variations on the Balancing Test. 3rd Conference on Policy Evaluation, ZEW, Mannheim (Germany), 27-28 October.
Mansuri, G. (2006). Migration, school attainment and child labor: Evidence from Rural Pakistan, World Bank Policy Research Working paper No. 3945. Washington DC: World Bank.
Maxwell, Daniel, Jennifer Coates, and Bapu Vaitla (2013). How Do different Indicators of Household Food Security Compare? Empirical Evidence from Tigray. Somerville, MA: Feinstein International Center, Tufts University.
Mberu U. B (2006). Internal Migration and Household Living Conditions in Ethiopia. Journal of Demographic Research, Volume 14, article 21, pages 509-540.
McKenzie, D. (2005). Measuring inequality with asset indicators. Journal of Population Economics, Vol.18, No.2, pp 229-260.
McKenzie, D.and Rapport, H. (2010). Self-selection patterns in Mexico-U.S. Migration: The role of migration networks. The review of Economics and Statistics, 92(4):811-821.
Page, J., and Plaza,S., (2006). Migration Remittances and Development: A Review of Global Evidence. Journal of African Economies, 15(2), 245–336,
Quartey, P. and T. Blankson. (2004). Do migrant remittances minimize the impact of macro volatility on the poor in Ghana? New York: Global Development Network.
Rosenbaum, P.R., and D.B. Rubin (1983). The Central Role of the Propensity Score in Observational Studies for Causal Effects. Biometrika 70(1), 41-55.
RESAL (1999). ‘Employment and labour mobility in Ethiopia’ : Brussels: Rural Development and Food Security Division of the European Commission.
Stark, O. (1991). The Migration of Labor. Cambridge, Massachusetts: Blackwell.
Stark, O., Taylor, J.E., and Yitzhaki, S. (1986). Remittances and inequality. The Economic Journal, 96 (383), 722–740.
19
Stark, O., Taylor, J.E., and Yitzhaki, S. (1988). Migration, remittances and inequality: a sensitivity analysis using the extended Gini index. Journal of Development Economics, 28(3), 309–322.
Vaitla, B., Tesfay, G., Rounseville,M., Maxwell, D. (2012). Resilience and Livelihoods Change in Tigray, Ethiopia. Somerville, MA: Feinstein International Center, Tufts University.
Wiesmann, D., L. Bassett, T. Benson, and J. Hoddinott (2009). Validation of the World Food Programme’s Food Consumption Score and Alternative Indicators of Household Food Security. Discussion Paper 008970. Washington, DC: International Food Policy Research Institute.
World Food Programme (2008). ’Food Consumption Analysis: Calculation and use of the food consumption score in food security analysis.’ Technical Guidance Sheet. WFP Vulnerability Analysis and Mapping, February 2008. Rome: World Food Programme.
World Bank (2011). Migration and Remittances Factbook 2011, Second Edition. Washington DC: The World Bank.
Wouterse, F. (2010). Remittances, poverty, inequality and welfare: evidence from the central plateau of Burkina Faso. Journal of Development Studies, 46(4), 771–789.
Zhu, N., and Luo, X. (2010). The impact of migration on rural poverty and inequality: a case study in China. Agricultural Economics, 41: 191-204.