Embed Size (px)
Citation preview

WIDER Working Paper 2021/130
Norms that matter
Exploring the distribution of women’s work between income generation, expenditure-saving, and unpaid domestic responsibilities in India
Ashwini Deshpande1 and Naila Kabeer2
July 2021

1 Ashoka University, Sonipat, Haryana, India, corresponding author: [email protected], 2 Department of Gender Studies and Department of International Development, London School of Economics, UK.
This study has been prepared within the UNU-WIDER project Women’s work – routes to economic and social empowerment.
Copyright © UNU-WIDER 2021
UNU-WIDER employs a fair use policy for reasonable reproduction of UNU-WIDER copyrighted content—such as the reproduction of a table or a figure, and/or text not exceeding 400 words—with due acknowledgement of the original source, without requiring explicit permission from the copyright holder.
Information and requests: [email protected]
ISSN 1798-7237 ISBN 978-92-9267-070-2
https://doi.org/10.35188/UNU-WIDER/2021/070-2
Typescript prepared by Lesley Ellen.
United Nations University World Institute for Development Economics Research provides economic analysis and policy advice with the aim of promoting sustainable and equitable development. The Institute began operations in 1985 in Helsinki, Finland, as the first research and training centre of the United Nations University. Today it is a unique blend of think tank, research institute, and UN agency—providing a range of services from policy advice to governments as well as freely available original research.
The Institute is funded through income from an endowment fund with additional contributions to its work programme from Finland, Sweden, and the United Kingdom as well as earmarked contributions for specific projects from a variety of donors.
Katajanokanlaituri 6 B, 00160 Helsinki, Finland
The views expressed in this paper are those of the author(s), and do not necessarily reflect the views of the Institute or the United Nations University, nor the programme/project donors.
Abstract: Based on primary data from India, this paper analyses the reasons underlying women’s low labour force participation. In developing countries, women engaged in unpaid economic work in family enterprises are often not counted as workers. Women are involved in expenditure-saving activities, i.e. productive work within the family, over and above domestic chores and care work. We document the fuzziness of the boundary between domestic and unpaid (and therefore invisible) productive work which leads to mismeasurement of women’s work. Religion and visible markers such as veiling are not significant determinants of the probability of being in paid work, but the social norm that matters as a major constraint is that of being primarily responsible for domestic chores. We demonstrate the existence of ‘virtuous cycles’ within families: a history of working women in the family increases the probability of being in paid work by between 18 and 21 percentage points.
Key words: women, labour force participation, India, social norm, unpaid economic work
JEL classification: J16, J21, J40, B54
Tables and figures: at the end of the paper
Acknowledgements: We gratefully acknowledge funding provided by the ESRC-DFID Joint Fund for Poverty Alleviation Research (ES/N014723/1). We would like to thank Farzana Afridi, Sonalde Desai, Nancy Folbre, Arjan de Haan, Clement Imbert, Devaki Jain, Seema Jayachandran, Kanika Mahajan, Wendy Olsen, Kunal Sen, Sujata Visaria, and seminar participants at the various places where drafts of this paper were presented for useful comments. Pratichi, Kolkata conducted the quantitative field survey. We acknowledge, with gratitude, the crucial inputs of Rajashri Dasgupta and Sabir Ahmed, who conducted in-depth qualitative interviews. This entire project would not have been possible without the sterling research assistance provided by Natasha Sharma and Rudradip Das in Kolkata. Thanks are due to Nidhaanjit Jain and Priyanka Dutta for support with quantitative work in the collection of the background literature. We alone are responsible for all remaining errors and omissions.
This is a revised version of the following discussion paper: Deshpande, A., and N. Kabeer (2019). ‘(In)Visibility, Care and Cultural Barriers.’ Discussion Paper in Economics 10. Sonipat: Department of Economics, Ashoka University. Available at: https://dp.ashoka.edu.in/ash/wpaper/paper10.pdf

1
1 Background and motivation for the study
Not only does India have one of the lowest female labour force participation rates (FLFPR) in the world but it has been declining steadily since 2004. Naturally, a great deal of the recent literature has concerned itself with this decline (Afridi et al. 2017; Afridi et al. 2020; Chatterjee et al. 2015; Das et al. 2015; Dubey et al. 2017; Klasen and Pieters 2012; Neff et al. 2012; Sarkar et al. 2019; Siddiqui et al. 2017, among others). We are interested, however, in better understanding what explains women’s historically low participation rates, a phenomenon which predates the present decline and which has persisted despite the classic preconditions for women’s increased participation in the labour force: high rates of growth, rising levels of female education, and lower rates of fertility. For reasons which we explain below, we believe that we still do not understand the longer-standing constraints that have curtailed women’s ability to participate in the labour force, regardless of current trends. Ultimately, the number of women in the workforce is a function of the demand for their labour as well as their ability to supply labour. Data from household surveys can throw light on the latter (as we do in this paper); however, our analysis also speaks to demand-side issues.
Our analysis is based on a purposively designed primary survey of women’s labour force behaviour in seven districts in the state of West Bengal in 2017. Our main findings are that, as women are primarily responsible for routine domestic tasks such as cooking, cleaning, and household maintenance, (over and above the standard explanations in the literature—age, location, education, and so on), as well as for elderly care, this lowers their probability of working. Factors traditionally viewed as cultural norms which constrain women’s participation in paid work, such as the practice of veiling or adherence to Islam, are insignificant in our analysis after the conventional variables have been accounted for. Given that the primary responsibility for domestic chores falls on women, we argue that the conventional definition of cultural norms needs to be revised and shifted to focus on the real culprit, i.e. the cultural norm which places the burden of domestic chores almost exclusively on women. We show that ‘good’ family traditions, i.e. a history of older women (mothers or mothers-in-law) having worked, increases the probability of women being in paid work by between 18 and 21 percentage points, over and above standard controls.
1.1 Alternative explanations for low female LFPRs in India
In examining the main explanations for women’s low levels of labour force participation, we can distinguish three broad categories. The first focuses on the issue of measurement. Most quantitative studies of the labour force participation in India rely on the National Sample Survey (NSS) household surveys. While the definition of economic activity in the NSS is broadly in line with internationally accepted definitions, the distinction between unpaid family workers and those exclusively engaged in domestic duties is not always consistently applied. As a result, it has been argued that economically active individuals may be erroneously classified as inactive (Hirway and Jose 2011; Sudarshan 2014). As it is largely women who dominate these activities, it has been suggested that the low rates of female participation reflect the failure of official statistics to correctly conceptualize and measure the contribution of women to the economy.
A second strand of the literature draws on economic theory. Some of this literature focuses on the lack of demand for labour in the occupations and activities in which women tend to be concentrated. Education is one factor that determines how employable women are. However, the relationship between women’s labour force participation and their education levels shows a U-shape: participation rates are highest among illiterate women, decline with primary and secondary levels of education, and then rise again among women with tertiary education. This suggests that
2
if the ‘dearth of demand’ explanation is valid, it applies most strongly to jobs that are suitable for women with primary and secondary education. Other economic explanations focus on household need as the major factor which determines women’s economic activity. It is generally women from the poorest households who have historically reported the highest rates of economic activity, and who continue to do so (Olsen and Mehta 2006; Srivastava and Srivastava 2010). This explanation suggests that as household per capita income rises, an ‘income’ effect comes into play, leading women to withdraw from the labour force, possibly to focus on their domestic responsibilities, so that participation rates decline with rising income (Das et al. 2015; Kapsos et al. 2014; Srivastava and Srivastava 2010).
A third strand of the literature draws on sociological explanations. It points to the power of the male breadwinner ideologies which prevail across India and which treat women as being dependent on male earnings. It also points to cultural norms of female seclusion, cutting across religious groups which link the honour and status of households to their ability to keep female family members within the home. These result in strict controls over women’s mobility in the public domain (Bardhan 1985). It is only the very poor and illiterate women who cannot afford to abide by the norms of female seclusion who take up paid work. These explanations interpret the downward sloping part of the U-shaped relationship between female education and participation as the ‘sanskritization’ effect, whereby poorer, lower-caste households seek to signal improvements in their status by emulating the behaviour of higher-caste/higher-status households (Kingdon and Unni 2001). The upward sloping part of the U-shaped relationship is interpreted as the effects of ‘modernization’, i.e. the rising aspirations that come into play with rising education.
Cultural restrictions on women’s mobility have been found to be particularly severe for married women, interrupting their ability to do paid work and leading to a ‘marriage effect’ within the female labour force (Sudarshan and Bhattacharya 2009). This diverges from the ‘motherhood penalty’ found in the OECD literature (Hegewisch and Gornick 2011) where it is childcare responsibilities rather than marriage per se that interrupt women’s labour market participation (Afridi et al. 2017; Chatterjee et al. 2015; Chaudhary and Verick 2014). While the relevance of marital status for women’s labour force participation can also been seen in the lower rates of participation by married women compared to divorced/widowed/separated women, here, economic factors may also be at play as those in the latter category tend to be poorer and less able to afford the status of staying at home.
Other forms of social identity also feature strongly in sociological explanations of women’s labour market behaviour, although these also tend to be bound up with economic explanations as social groups correspond significantly with income/wealth groups. In particular, women from the lowest ranked scheduled tribe (ST) and scheduled caste (SC) groups1 who have traditionally had the highest participation rates of all social groups come from the poorest households and are also subject to fewer cultural restrictions; indeed, they are expected to work. Religion also features. Islam is generally associated with stricter controls over women’s public mobility than other religions and Muslim women are found to have lower participation rates than women from the majority Hindu religion (Neff et al. 2012; Srivastava and Srivastava 2010).
1.2 Contributions to the literature
Our paper goes beyond revisiting older discussion on women’s labour force participation and makes the following new contributions. First, we document the mismeasurement of women’s work. If mismeasurement is the problem, then existing analyses of the determinants of female
1 See footnote 6 for details of these categories.

3
labour force participation (FLFP) have been working with an inaccurate dependent variable. Therefore, we ask: what exactly do women do, what would more accurately measured estimates of labour force participation look like, and what would the standard explanations look like with this more accurately measured variable? We reference the larger international literature and note various areas of women’s work that do not enter Indian measures. We use these: firstly, to arrive at a more inclusive definition of ‘conventional’ labour force participation than captured by the Indian NSS (working for pay or doing work that saves household money); secondly, to produce an estimate of those doing ‘expenditure-saving’ work; and, thirdly, to estimate how many are out of the labour force. Thus, we demonstrate the need to move away from the standard binary measurement (i.e. in or out of the labour force) of women’s productive work.
In addition, our survey measures who in the household is primarily responsible for activities that are explicitly excluded by labour force definitions but that feminists have highlighted as being part of women’s unpaid domestic and care responsibilities.
Second, given that our conventional measurement of FLFP is more inclusive than that estimated by the NSS, our estimates show the determinants of women’s productive contributions to the household economy/labour market when they are measured accurately. We explicitly demonstrate how the excluded activities of domestic/care work affect women’s ability to participate in conventional work and in expenditure-saving activities. The fact that we do this for both conventional labour force activity and for expenditure-saving activities makes our analysis particularly interesting and unique.
Third, we identify the norms that matter in shaping women’s participation in productive work. There is a great deal of attention on cultural constraints arising from conservative values from specific religious beliefs.2 We show that the cultural norm which makes women primarily responsible for domestic chores3 is the major constraint that prevents women from accessing paid work, and not the religious norms of veiling or Islam.
Fourth, we show that these norms are not set in stone. Women in families where older women have worked (mothers or mothers-in-law) are more likely to work, conditional on all other covariates.
The rest of the paper is organized as follows. Section 2 outlines the data and focuses on the measurement issue, data collection, and definitions of labour force activity, where we contrast the standard definitions with our proposed revisions. Section 3 presents summary statistics. Section 4 contains the methodology and main results. Section 5 offers concluding comments.
2 Revisiting the measurement issue
Our survey covered 3,701 women in seven districts of West Bengal and was carried out between July and September 2017. A detailed account of our sampling procedure is provided in Appendix A. Here, we describe how we went about defining women’s labour force participation in order to correct for some of the criticisms levelled at official estimates. These criticisms are both practical and conceptual. On the practical side, there is the problem of under-reporting. Both interviewers and respondents in the large-scale surveys used to gather information on labour force activity tend to discount many aspects of women’s productive work. In particular, they tend to view productive work that is unpaid and carried out within the domestic domain as an extension
2 See The Economist (2018).
3 Brilliantly demonstrated in a recent movie called The Great Indian Kitchen (Wikipedia n.d.).

4
of housework (Deshpande 2002, 2007; Jain 1996; Chaudhary and Verick 2014). In view of this, we laid particular emphasis on training our field workers and enumerators to be sensitive to these issues of under-reporting.
The conceptual problem relates to the definition of labour force activity used in official statistics. The NSS obtains the work status from the section of its Employment-Unemployment Survey (EUS) which provides a household roster in which the work details of each individual household member are listed. The head of the household typically provides this information for all members, which makes it a highly likely source of under-reporting. The information sought relates to details about the ‘usual principal activity status’ of each member of the household. This is the activity status of the person in the 365 days preceding the survey based on the ‘majority time criterion’, i.e. the activity on which the person spent a ‘relatively long time’.
However, before this question is asked, the NSS surveyors make a dichotomous classification between ‘those in the labour force’ (working or not working) and those not in the labour force, by asking whether the woman is currently working or looking for work. Those who say they have not worked in the last year and are not looking for work are classified as out of the labour force, and all follow-up questions about the usual principal activity status are asked only to those who are classified as being ‘in the labour force’.4 Thus, if women are more likely to be classified as being out of the labour force because their work is home-based or unpaid, or both, then no follow-up questions about the nature of their involvement in productive work will be sought.
We decided to use the NSS definition but to extend it to capture the International Labour Organization (ILO) definition. We also decided to use additional questions in order to capture forms of women’s labour force activities which are typically omitted from the NSS estimates. We asked these questions of the women themselves rather than the heads of household or any other male respondents as the women were in the best position to answer accurately. Finally, given the interrupted and seasonal nature of women’s work, we did not restrict the number of days they were involved in an activity for it to count as labour force participation. For these reasons, our approach is likely to be far more inclusive of women’s actual labour force activities than that taken in the NSS.
We started our estimation procedure with a dichotomous question which asked women whether they had engaged in any economic activity in the past 12 months either by earning an income or ‘doing work that had saved household money’. While the latter category falls within the System of National Accounts (SNA) boundary, it is excluded from NSS questionnaires. Those who answered ‘yes’ to this question were classified as economically active by our conventional criteria.
To those who answered ‘no’ to this question, we asked a series of questions about different kinds of work that they themselves were likely to consider to be an extension of their domestic duties but which fell within the SNA production boundary. These questions are analogous to usual principal activity status (UPAS) Codes 92 and 93 in the NSS EUS which are administered to all those classified as ‘attended to domestic duties’ or ‘attended domestic duties and engaged in free collection of goods for household use’. In the NSS data, these two categories have been found to be made up almost exclusively of women.
Specifically, following NSS practice, we asked about the following activities: working in kitchen gardens or orchards, rearing poultry, free collection of fish, small game, wild fruit, vegetables for household consumption, husking paddy, preparing jaggery (gur), preservation of meat or fish,
4 NSS 2011–12: A-6 (NSSO 2012).

5
weaving baskets/mats, making cow dung cakes for fuel, tailoring/weaving, and tutoring of own or other children free of charge.
The NSS questions ask women to answer ‘yes’ or ‘no’ to these questions about these activites. Again, we tweaked this format slightly. We asked about each activity separately in a set of two questions: first, whether they were involved in that activity and, second, if they did the activity not just for their own use/consumption but to support the family’s income-generating work.
We classified the women who answered ‘yes’ to the second question, i.e. those who did these activities as income support, as being economically active. If they answered ‘no’ to the first question and to the series of follow-up questions but their household possessed agricultural land or livestock, we classified them as being economically active because of the evidence that women who belong to such households contribute to household economic activity as a part of their domestic duties. Several women reported doing multiple activities; we counted all women who did at least one activity in this definition (i.e. additional activities are not double counted).
We counted the women in this category as being economically active according to our expenditure-saving criteria. It is worth noting that this extended definition does not include care work and domestic chores; it only includes those unpaid activities that fall within the conventional SNA boundary but which tend to be treated by women themselves as part of their routine domestic duties.
We classified all the remaining women, i.e. those who were not classified as economically active by either conventional or expenditure-saving criteria, as being outside the labour force (OLF). These women did at least one of the activities counted in the extended definition of production for home use. In our data, we found that 63 per cent of these women did at least one of the activities and 15 per cent did three. Given that these are expenditure-saving productive activities, the demarcation between doing them exclusively for home use versus for economic help is fuzzy. Thus, the line dividing women included in the expanded definition of economic activity and those classified as unpaid/OLF is a blurred one. We should note that all women did at least one economic activity, either for home use or as unpaid labour in household economic activities.
3 Variations in female participation in conventional labour force and expenditure-saving activity
Table 1 allows us to compare the estimates provided by our three labour force categories in the districts covered by our survey. It also includes estimates from the Periodic Labour Force Survey (PLFS) of the NSS conducted in 2017–18, which has the closest official data to our survey.
Using the conventional definition, our estimate of FLFPRs is 27.85 per cent. This is significantly higher than the 18 per cent for working-aged women for the entire state of West Bengal from the PLFS. One reason for the divergence between these two figures is that our sample is from seven districts, whereas the NSS estimate is based on the entire state. Adding both conventional economic and expenditure-saving activity, we get a FLFPR of 52 per cent. This is clearly a gendered issue, i.e. relevant to measuring women’s work, as 97.16 per cent of our male respondents said that they had been engaged in work generating cash or in-kind payment.
Again, a concern here might be that our higher estimates reflect that we selectively chose districts with higher female LFPRs compared to the other districts in the state. Table B2 in Appendix B shows the distribution of women’s work status according to the 2017–18 PLFS. This reveals that the sample districts lie both above and below the state average.

6
Table 1 also reveals that the district-level variations in participation rates are not neatly associated either with the proportion of Muslims in the district, who are typically associated with greater social conservatism with regard to women’s work, or with the economic development of the district. Murshidabad, which has the highest proportion of Muslims in the state, has the third highest participation rates and, while Kolkata, the richest district in our survey, has the highest participation rates, it is followed by Bankura, one of the poorest. Prima facie, it appears that simple explanations based on income or religious/cultural differences do not contribute a great deal to understanding inter-district variations.
Table 2 presents key summary statistics by our three labour force categories: conventional economic activity; expenditure-saving activity; and OLF. These include statistics on age, marital status, female headship, religion, caste,5 education, monthly per capita income, ownership of livestock and poultry, and location. Rural women were more likely to be economically active—by both of our criteria—than urban women. Ninety per cent of women were married, with an average age of 36; very few had children under the age of five. While illiterate women were more likely to be conventionally active than the rest, there was no consistent pattern among educated women. Muslims made up 30 per cent of the sample, which is about the average for the state.
Along with religion, we included a variable on whether women veiled or not as an indicator of cultural norms. This took the form of asking women whether they covered their heads sometimes, always, or never, using a burqa, hijab, niqab (varieties of ways that Muslim women cover their heads or faces), or ghunghat or veil (typical ways that Hindu women might cover their heads). We created a dummy variable called ‘veiling’, which took the value 1 if they covered their heads sometimes or always and 0 if they never covered their heads. We see that the proportions of women who covered their heads was higher for those in expenditure-saving activities, but similar for working women and the OLF category.
Table 2 also includes information on women’s unpaid domestic and childcare responsibilities. These are explicitly excluded from definitions of economic activity, but they make demands on (mainly) women’s time in ways that are theorized to have an important influence on their ability to undertake labour force activities. Information was collected on childcare, care of the elderly, and five domestic tasks: cooking, cleaning the house, washing clothes, household maintenance, and fetching water. Table 2 suggests that, overall, women reported an average of four tasks. Fifty-three per cent of women reported themselves to be solely responsible for childcare, while close to 71 per cent were solely responsible for elderly care.
While our three labour force categories (conventional labour force activity, expenditure-saving activity, and OLF) are mutually exclusive and together add up to our entire sample, unpaid domestic responsibilities cut across the three categories; in other words, they can be, and many were, undertaken by women in each of these categories. As we can see, the proportion of those responsible for elderly care was higher in the OLF categories compared to economically active ones. The proportion of those solely responsible for childcare was lower among women in conventional economic activity.
5 We divided the sample into five broad social group categories: scheduled caste (SC); scheduled tribe (ST); other backward classes (OBC); upper castes (UC), which are the non-Brahmin upper castes; and Brahmins. SC, ST, and OBC are administrative categories formed for the purpose of reservation or affirmative action. Typically, most data sets have four categories, with ‘others’ being the residual category. We have data for the jati affiliation of respondents and are able to disaggregate the ‘others’ into the topmost ranked Brahmins and other upper castes. For details about jati classifications and administrative categories, see Deshpande (2017).
7
Our questionnaire also had data on both productive and consumption assets. The former was comprised of physical assets,6 livestock,7 retail shops (where ready-made items are directly sold to consumers and not to middlemen), and workshops (e.g., garage, pottery, tailoring, etc., where the household may or may not manufacture items and sell to both customers and middlemen). Consumption assets were comprised of simple household items.8 Using principal component analysis, we combined the production and consumer assets into two separate indices, one for each category of assets. The former are a rough proxy for household wealth. The distribution of women across quartiles of both the consumer asset index and wealth index is not reported in Table 2 but is available from the authors upon request.
In the next step of our analysis, we considered how our labour force categories varied by three variables identified in the Indian literature as having particular significance for labour force activity. Figure 1 reports on the nature of correlations between these variables and our measures of FLFPR.
Figure 1, Panel A shows the distribution of women by the three labour force categories within the four broad educational categories. It tells us that the U-shape relationship between women’s education and labour force participation found in the broader Indian literature appears to apply most strongly to our conventional measure of the labour force. However, contrary to what is suggested by the broader literature, women with primary and secondary education do not drop out of the labour force but specialize in expenditure-saving activities around the home. Indeed, the relationship between women’s education and expenditure-saving activity appears to be an inverted U-shape.
Finally, the likelihood of being out of the labour force increases steadily with education levels: if there is a dearth of suitable jobs for educated women, it seems to increase with levels of education.
The relationship with productive assets (Panel B) tells us that there are high levels of women out of the labour force in all asset quartiles, but the likelihood of conventional labour force activity rises with asset holdings, while engagement in expenditure-saving activities declines. Asset endowments clearly increase women’s ability to engage in the conventional labour force.
Finally, Panel C plots the distribution of women in the three labour force categories across four quartiles of monthly per capita expenditure (MPCE). It suggests a weak U-shape between women’s engagement in the conventional labour force and per capita income but stronger evidence that women in higher-income households are more likely to be out of the labour force—as suggested by the wider data.
Of course, the underlying causality in the relationship between women’s work on the one hand and household wealth and MPCE on the other is bi-directional: households where the women are working are likely to be wealthier. We should note that of the two, the productive asset index is less likely to be affected by women’s incomes, especially for women earning low wages, given the items that appear in the productive asset index. Thus, it has the lowest problem of endogeneity or reverse causality. What our West Bengal data suggests is that there may be an ‘income’ effect, with women in higher-income households less likely to be in the labour force, but there does not appear
6 Plough, harrow, pump/motor sets, bullock carts, tractor, spray pump, power tiller, borewell, drip irrigation sprinkler, hand tools (e.g., sickle, shovel, axe). 7 Cows, bulls, buffaloes, goats, sheep, poultry, pigs. 8 Sewing machine, refrigerator, almirah, kerosene stove, gas stove, bicycle, two-wheeler, car/jeep/tempo/mini-truck, telephone, mobile phone, television, VCR/CD/DVD player, electric fan, computer/laptop, pressure cooker, cooler, radio.

8
to be a ‘wealth’ effect—asset endowments are associated with higher levels of labour force participation.
4 Estimating women’s labour force participation
4.1 Determinants of LFPRs
In this section, we explore the main determinants of women’s economic activity. To that end, we estimated a multinomial logit model to estimate the probability of women being in conventional economic activity, an expenditure-saving activity, and out of the labour force. The probability of individual i being in the labour force category j is:
𝜋𝜋𝑖𝑖𝑖𝑖 = 𝑙𝑙𝑙𝑙𝑙𝑙 𝜋𝜋𝑖𝑖𝑖𝑖𝜋𝜋𝑖𝑖𝑖𝑖
= 𝛼𝛼𝑖𝑖 + 𝑋𝑋𝑖𝑖′𝛽𝛽𝑖𝑖 (1)
where, 𝛼𝛼𝑖𝑖 is a constant and 𝛽𝛽𝑖𝑖 is a vector of regression coefficients for j = 1, 2, …J-1. The number of equations is one less than the number of outcomes because one of the outcomes is arbitrarily set to zero so that the system is identified and we get unique solutions. 𝑋𝑋𝑖𝑖′ is a vector of covariates that predict the probability of being in a given labour force category. Therefore, the individual 𝛽𝛽𝛽𝛽 measure the effect of individual covariates of being in a given outcome category relative to the base outcome category, conditional on other covariates. Depending on which category of the outcome variable is chosen as the base, the interpretation of the coefficients will change but the predicted probabilities for the outcome variables will remain the same. We show the predicted probabilities below.
Our estimation equation is the following:
Pr (LFij) = 𝛼𝛼𝑖𝑖 + 𝛽𝛽1 ∗ 𝑣𝑣𝑣𝑣𝑣𝑣𝑙𝑙𝑣𝑣𝑣𝑣𝑙𝑙𝑖𝑖 + 𝛽𝛽2 ∗ 𝑟𝑟𝑣𝑣𝑙𝑙𝑣𝑣𝑙𝑙𝑣𝑣𝑙𝑙𝑣𝑣𝑖𝑖 + 𝛽𝛽3 ∗ 𝑑𝑑𝑙𝑙𝑚𝑚_𝑡𝑡𝑡𝑡𝛽𝛽𝑡𝑡𝛽𝛽𝑖𝑖 + 𝛽𝛽4 ∗𝑐𝑐ℎ𝑣𝑣𝑙𝑙𝑑𝑑𝑐𝑐𝑡𝑡𝑟𝑟𝑣𝑣𝑖𝑖 + 𝛽𝛽5 ∗ 𝑣𝑣𝑙𝑙𝑑𝑑𝑣𝑣𝑟𝑟𝑙𝑙𝑒𝑒𝑐𝑐𝑡𝑡𝑟𝑟𝑣𝑣𝑖𝑖 + 𝑋𝑋𝛽𝛽𝑖𝑖 + 𝑣𝑣𝑟𝑟𝑟𝑟𝑙𝑙𝑟𝑟𝑡𝑡𝑣𝑣𝑟𝑟𝑚𝑚 (2)
where j = labour force status (working or expenditure-saving, relative to OLF) for the ith woman, where the X vector includes the standard variables used in the literature: age, age squared, rural/urban residence, educational categories, marital status, and household size9.
Our quantitative analysis combines covariates which draw from both standard economic explanations and the sociological literature. One set of the sociological covariates captures the effect of domestic constraints, measured by three variables: whether the respondent was primarily responsible for childcare; whether she was primarily responsible for elderly care; and the number of domestic chores she had to do. The second set attempts to capture the effect of cultural norms. We include religion, which features widely in the Indian literature, with Muslim women generally being assumed to be far more constrained in their ability to undertake labour market activity than women from other religions. We also include our measure for veiling practices to ascertain whether more conservative practices prevent women’s participation in the labour force. Standard errors are clustered at the village level.
9 We have an alternative specification with caste instead of religion which shows that the average marginal effect of caste is not significant (available from the authors upon request).

9
The coefficients of interest are 𝛽𝛽1 to 𝛽𝛽5, as these capture the effects of cultural norms and care/unpaid work on the woman’s labour force status.
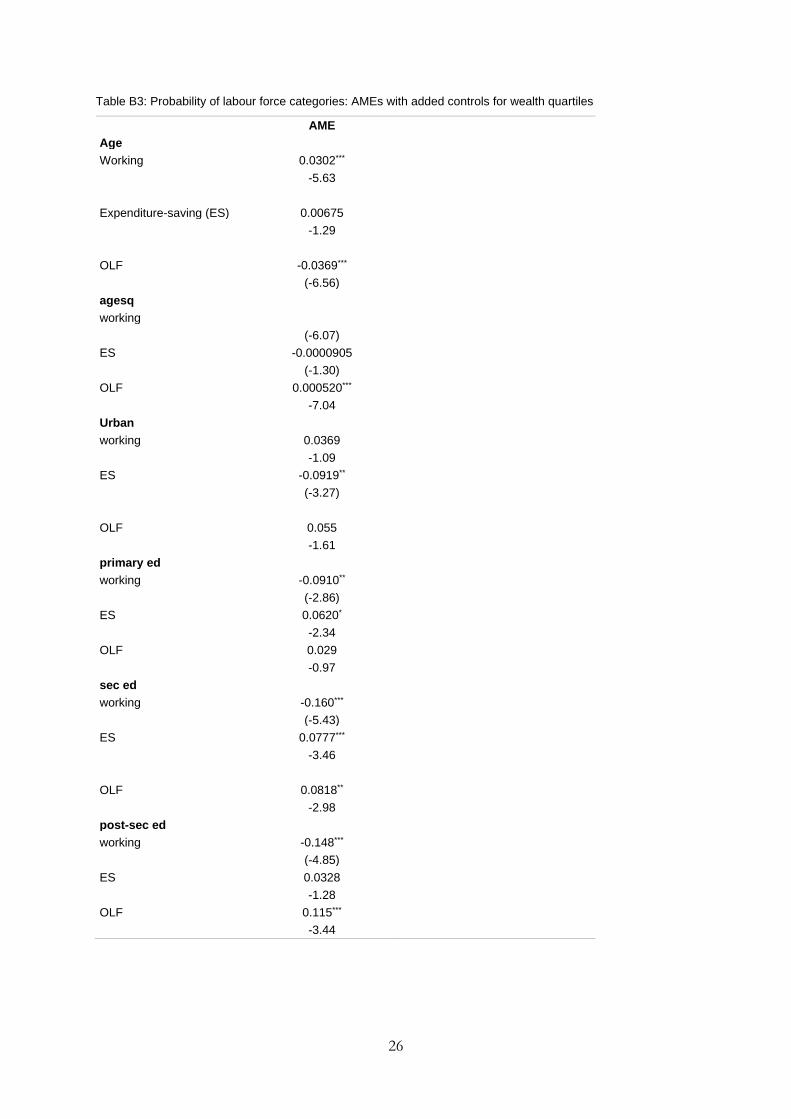
We did not include wealth quartiles (as proxied by productive assets) because of the reverse causality mentioned above. However, Table B3 in Appendix B shows the results of this regression with additional controls for wealth quartiles, which indicates the direction and strength of the correlation between women’s work status and their household’s position in wealth distribution. It also shows the strength and direction of the correlation between women’s work status and other covariates when household wealth is controlled for.
Figure 2 presents the average marginal effects (AMEs) of all the covariates for the three labour force categories, working (conventional definition), expenditure-saving activity (extended definition), and OLF. These AMEs are useful because they reflect the average of the marginal effects calculated at every value of the covariate and, therefore, convey information about the influence of each covariate on the outcome variable.
According to Figure 2, the relationship between age and economic activity follows a standard pattern, with both conventional and expenditure-saving activity rates increasing with age and then declining. The probability of conventional labour force participation is higher for urban women than rural women, while the probability of expenditure-saving work is higher for rural women. These are plausible findings. Our sample includes Kolkata and Howrah, two important economic urban locations in the state of West Bengal, where jobs are more likely to be available than elsewhere. Furthermore, if we revisit the activities that make up expenditure-saving work, it is clear that they are harder to carry out in the built-up environment of urban areas.
Relative to women with post-secondary education, women in all other educational categories are less likely to be in the conventional work force and more likely to be in expenditure-saving work. Thus the U-shaped relationship between women’s education and participation in the conventional labour force reported in the wider literature and observed in the descriptive statistics disappears in the conditional estimates.
The general story of the effects of cultural norms is given a more nuanced interpretation by our sample. It suggests that women who veil and Muslim women have the same probability of participating in the conventional labour force as women who do not veil, in the first case, and as Hindu women, in the second. However, cultural norms introduce differences among women who are not in the conventional labour force. Of these women, women from Muslim households are more likely than Hindu women to be out of the labour force, while Hindu women are more likely to be engaged in expenditure-saving work. Women who veil, on the other hand, are more likely to be in expenditure-saving activities than those who do not and are less likely to be out of the labour force.
Our sample makes some interesting points about the effects of marriage, motherhood, and women’s domestic responsibilities. First of all, relatively to currently married women, all other categories of women (never married, widowed, and divorced) are considerably more likely to be working. This reflects the ‘marriage effect’ we noted earlier.
Very few women in our sample had children under five, but we have other measures of women’s responsibilities in both unpaid care and in domestic work. We find that having primary responsibility for childcare has little effect on participation in conventional economic activity but it reduces the likelihood of being out of the labour force and increases the likelihood of expenditure-saving work. The weak impact of having primary responsibility for childcare on participation in the conventional labour force is not surprising, given that the average age of

10
women in our sample is 36 and very few have young children, but it is also in line with findings from other studies. Care for the elderly, on the other hand, increases the likelihood of women doing conventional work, while among the rest of the population, it increases the likelihood of being out of the labour force rather than in expenditure-saving work.
Turning to responsibility for domestic chores, we find that having primary responsibility for domestic chores lowers the probability of conventional economic activity while increasing the probability of expenditure-saving work. In fact, each additional domestic chore for which women are primarily responsible—out of the five for which we collected data (cooking, cleaning, household maintenance, washing clothes, and collecting water)—lowers the probability of participating in conventional economic activity. This is over and above the effect of household size, which has a similar effect. Every additional domestic task increases the probability of being in expenditure-saving work.
The impact of domestic chores relative to care responsibilities on women’s labour force participation resonates with other evidence. For instance, in a study by Chopra and Zambelli (2017) based in India, Nepal, Rwanda, and Tanzania, it was found that in both nuclear and extended families, the proportions of women who were solely responsible for housework/domestic chores were much higher than the proportions of women who were solely responsible for childcare.
Finally, Table B3 in Appendix B, which estimates the same regressions but includes wealth quartiles, suggests that wealth is not a significant predictor of women’s participation in either conventional labour force activity or in expenditure-saving work, over and above other predictors.
4.2 Domestic work and labour-saving devices
Our analysis draws attention to the relevance of both marriage and motherhood in depressing women’s ability to participate in the conventional labour force, but it also suggests that the extent to which they bear primary responsible for the care and domestic responsibilities that go with these roles also makes a difference. Women who have primary responsibilities for these unpaid domestic activities are far less likely to engage in the conventional labour force and are more likely to be found in expenditure-saving work than those who are not, regardless of marital status and household size. While we do not have specific information on what determines primary responsibility for these unpaid activities, we can examine some suggestive evidence.
One important point to note is that the local equivalent of what is described as women’s unpaid ‘reproductive labour’ (cooking, care, and cleaning) in the literature from the global north is far more time-consuming in the context that we are dealing with. Fetching water in West Bengal may be from the household tap or from a water source some distance away from the household. Cooking may involve using a gas stove or walking miles in search of fuel. Clothes may be washed in a washing machine or down by the river by hand. In other words, as the literature from the global north suggests, labour-saving consumer durables can, and have, played an important role in reducing the amount of time spent on housework in earlier-industrialized countries like the USA.10
We explored whether this factor is relevant in the West Bengal context. From the data collected on household assets, we identified five simple gadgets—refrigerator, mixer, gas, washing machine, and pressure cooker—which could be termed labour-saving devices. A simple regression of
10 Greenwood et al. (2005), for instance, tracked how progress in labour-saving consumer durables in the USA since 1900 led to a steady decline in hours spent on housework from 58 to 14 hours in 2011. This was accompanied by a steady rise in the labour force participation of married women.

11
whether the woman was primarily responsible for domestic chores on the number of these five labour-saving devices shows that an increase in the number of these gadgets reduces the likelihood of woman being primarily responsible for the five domestic chores (Table 3).
This is a simple correlation. It is highly likely that working women are more able to purchase gadgets than those who are not working. But a plausible interpretation of Table 3 is that working women are also likely to prioritize labour-saving gadgets in order to reduce the demands of domestic chores on their time, enabling them to take up conventional economic activity and easing their ability to reconcile paid work and domestic responsibilities or, at least, allowing these chores to be shared with other household members (generally other female members) so that they no longer have primary responsibility.
4.3 Is there an unmet demand for work?
The Indian literature reviewed earlier suggests the possibility of an unmet demand for paid work. Our survey evidence throws light on at least one of the reasons why this demand goes unmet. We asked women who were classified as OLF if they would accept paid work if it was made available at or near their homes. Of these, 73.5 per cent said ‘yes’. The desire for proximity could reflect a cultural concern with seclusion or a practical concern with the demands of household responsibility. We explore this further in Figure 3, which shows the AMEs of the logistic estimation of the demand for work, measured as a ‘yes’ response to this question.
We find that among the OLF category, urban women have a lower demand for paid work compared to rural women. They are less likely to be out of the labour force than women in rural areas. Widowed women are more likely to want such work than never-married and married women, possibly because they are more likely to need it. Women who are primarily responsible for childcare are less likely to express a demand for such work, but those who are responsible for elderly care and, to a lesser extent, those primarily responsible for domestic tasks have a higher demand for such work. The impact of having primary responsibility for elderly care on the demand for work is consistent with its impact on the likelihood of participation in the conventional labour force and suggests greater pressure to take up paid work. Cultural explanations, on the other hand, do not seem relevant—none of religion, veiling or education were significant.
When questioned further, 18.7 per cent expressed a preference for regular full-time work, 7.8 per cent for regular part-time work; 67.8 per cent for occasional full-time work, and 5.78 per cent for occasional part-time work. It therefore appears that there is indeed an unmet demand for paid work, whether regular or occasional, full-time or part-time, as long as the work in question is compatible with women’s domestic responsibilities.
If domestic chores emerge as an important determinant of women’s labour force participation, after controlling for the standard explanatory factors, a further question suggests itself: to what extent do the low LFPRs found in India, in particular, but also in South Asia and Middle East and North Africa (MENA) countries more broadly reflect international differences in women’s involvement in housework? There is some indicative evidence that, in these regions, women spend more time on unpaid care work, broadly defined (i.e. including care of persons, housework, or other voluntary care work), relative to a range of other developing and developed countries in the world. As Figure 4 shows, in 2014, the female-to-male ratio of time devoted to unpaid care work was 10.25 and 9.83 in Pakistan and India respectively—the two countries with the lowest female LFPRs within South Asia—compared to 1.85 in UK and 1.61 in the USA.

12
4.4 Can the presence of a family tradition increase FLFP?
There is one other question that we addressed in our analysis. If cultural norms are reproduced over time because succeeding generations conform to them, then a break with tradition, for whatever reason, may lay the initial groundwork for change. We explored this possibility by examining the effects of certain characteristics of the previous generation of women within the family on the labour force status of the cohort we studied. One of these characteristics was education: did the education levels of parents and parents-in-law have such an effect? We found that women with mothers who had post-secondary education were more likely to be in conventional (paid) economic work. But parental (as well as in-laws’) education was highly correlated with other socioeconomic characteristics and the independent marginal effect of a mother’s education level on a woman’s probability of being in conventional work was small.
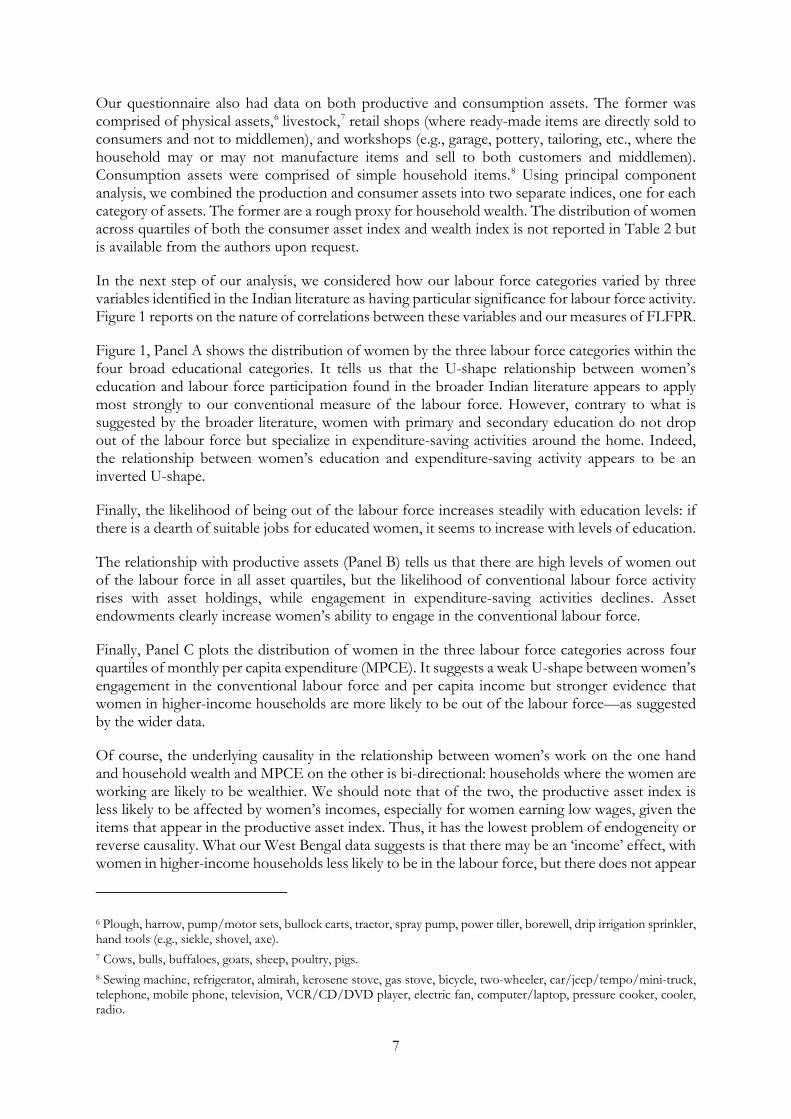
However, this is not true for the effect of mother’s and mother-in-law’s work status. In our sample, 13 per cent of women reported that their mothers had ever worked and 12 per cent reported that their mothers-in-law had ever worked. Women whose mothers (mothers-in-law) had ever worked were 17.5 (20.7) percentage points more likely to be in conventional work compared to women whose mothers and mothers-in-law had never worked. This effect is robust to the inclusion of standard controls. Figure 5 shows the results of estimating Equation 2 with two added regressors: a dummy variable which takes the value 1 if the respondent’s mother had ever worked, and a dummy variable for a mother-in-law who had ever worked. This suggests that the behaviour of the older generation of women within a family can have consequences for the behaviour of the younger one. More specifically, if the older generation of women have worked, then the younger generation are more likely to do so, even after accounting for all the standard factors.
5 Concluding comments
Based on primary data from a large household survey in seven districts in West Bengal in India, this paper analysed the reasons underlying the low rates of labour force participation of women. In particular, it tried to disentangle the intertwined strands of constraints, opportunities, and norms in explaining these rates. We designed our survey to capture women’s engagement in the conventional labour force more accurately than is the case in the official surveys. While this gave us higher estimates of women’s conventional work participation than the official statistics, they were still low at 28 per cent, with 23 per cent of women engaged in expenditure-saving activities and 48 per cent being out of the labour force. In this concluding section, we summarize how the findings, based on our more inclusive estimate of women’s labour force participation, differ from those reported by studies that rely on the narrower estimates found in the official data. In addition, we discuss the specific contributions of our study.
We found that some of the effects of the standard variables used in our analysis converged with those found in the wider Indian literature: age and age squared, marital status, and education—although we found participation rates to be higher in urban areas than in rural areas, contrary to the national picture.
We were able to provide a more complex picture of the relationship between cultural norms and women’s work than can be found in the wider literature. First, we found that Muslim women are as likely to be economically active, by conventional criteria, as Hindu women, contrary to standard findings. However, of the women who were not in the conventional labour force, Muslim women were more likely to be outside the labour force than Hindu women and less likely to be engaged in expenditure-saving work. Note that the insignificance of religion is not an artefact of our study;

13
a similar regression using national level NSS EUS data also found religious difference in work participation to be largely insignificant.11
Like religion, veiling did not make a difference as to whether women were in the conventional labour force or not, but, unlike religion, veiling increased the likelihood of participation in expenditure-saving activity rather than being outside the labour force.
Perhaps the most important insight that our analysis contributes to the general literature is the finding that many of the women who were not in conventional forms of labour force activity were not necessarily OLF. Rather, many of them were involved in expenditure-saving activities—which were, strictly speaking, labour force activities. We found that, while women with education, married women, and women with primary responsibility for childcare and domestic chores were less likely than illiterate women, divorced, separated, widowed, and unmarried women to be in the conventional labour force, at the same time, they were more likely to participate in expenditure-saving activities rather than being outside the labour force.
This result highlights the larger question of what women do when they are not working outside the home in paid activities. The 32nd round of the NSS EUS, conducted in 1977–78, marked a first attempt to understand women’s work in the Indian official labour force statistics. As Sen and Sen (1985: WS-49) argued, in ‘partly commodified rural economies, the dividing line between domestic work and economic activity is fuzzy’. Jain (1996) also emphasized that unpaid work by women should not necessarily be seen as household care work.
The NSS introduced questions with UPAS codes 92 and 93 to try to capture women’s domestic work, especially domestic work that combined home-based economic activity. Sen and Sen (1985) found a strong negative correlation between women’s LFPR and the economic components of UPAS code 93 which capture resource-based activities around the home when such resources are available. Thus, women from the poorest households, where the need for cash income is strongest and there is a paucity of owned resources, tend to display high LFPRs, as our study confirms. Women in the middle part of the income/wealth distribution might not be seen to be in work outside the home, but they are engaged in expenditure-saving work, i.e. they substitute work outside the home with a range of economic activities in and around the home rather than purely non-economic domestic work alone.
The other important insight offered by our study relates to the effects of women’s unpaid domestic responsibilities, variables which are not typically included in other labour force surveys, on other aspects of their work. Our results support the findings of other studies that marriage rather than motherhood is the main constraint on women’s participation in conventional work. Primary responsibility for childcare is not a significant constraint on women’s ability to participate in conventional work but primary responsibility for domestic chores is, regardless of marital status. This is an important finding and testifies to the heavy burden that domestic work can represent in contexts where labour-saving infrastructure, utilities, and technologies are not widespread.
While we were interested in the effects of cultural norms relating to religion and veiling on women’s labour force behaviour, our study suggests that in the West Bengal context, at least, neither religion nor the practice of veiling appear to constrain women’s participation in conventional work. Indeed, religion is largely insignificant even in the NSS data. Instead, the cultural norms relating to the gender division of unpaid labour appear to have much greater significance. Not only are women’s unpaid domestic responsibilities far more significant in
11 Results available from the authors upon request.

14
constraining conventional labour force participation but we found substantial unmet need for paid work among women outside the labour force but on terms that would allow them to manage their household responsibilities. The resilience of cultural norms governing the gender division of unpaid labour is relevant beyond West Bengal. As Figure 4 shows, gender asymmetries in responsibility for unpaid care work can be found in a range of developed and developing economies, but, as the figure also shows, India and Pakistan have far more marked gender asymmetries than the other countries on which data is reported.
Based on the results of this paper, we would argue that the definition of cultural norms needs to be rearticulated or shifted to reflect the unequal sharing of domestic unpaid care work from its current focus on religious differences, especially the spotlight on Islam or veiling as a constraint to labour force participation.
References
Afridi, F., T. Dinkelman, and K. Mahajan (2017). ‘Why are Fewer Married Women Joining the Work Force in Rural India? A Decomposition Analysis over Two Decades’. Journal of Population Economics, 31(3): 783–818. https://doi.org/10.1007/s00148-017-0671-y
Afridi, F., M. Bishnu, and K. Mahajan (2020). ‘Gendering Technological Change: Evidence from Agricultural Mechanization’. IZA DP 13712. Bonn: IZA. Available at : https://www.iza.org/publications/dp/13712/gendering-technological-change-evidence-from-agricultural-mechanization# (accessed 12 July 2021).
Bardhan, K. (1985). ‘Women’s Work, Welfare, and Status: Forces of Tradition and Change in India’. Economic and Political Weekly, 20(50): 2261–69.
Chatterjee, U., R. Murgai, and M. Rama (2015). ‘Job Opportunities Along the Rural-Urban Gradation and Female Labor Force Participation in India’. Economic & Political Weekly, 50(26/27): 5–10.
Chaudhary, R., and S. Verick (2014), ‘Female Labor Force Participation in India and Beyond’. ILO Asia-Pacific Working Paper Series, ISSN 2227-4391; 2227-4405. New Delhi: ILO.
Chopra, D., with E. Zambelli (2017), ‘No Time to Rest: Women’s Lived Experiences of Balancing Paid Work and Unpaid Care Work’. Global Synthesis Report for Women’s Economic Empowerment Policy and Programming. Brighton: IDS.
Das, S., S. Jain-Chandra, K. Kochhar, and N. Kumar (2015). ‘Women Workers in India: Why So Few Among So Many?’. International Monetary Fund Working Paper, IMF WP/15/55. Washington, DC: IMF. https://doi.org/10.5089/9781498315005.001
Deshpande, A. (2002). ‘Assets versus Autonomy? The Changing Face of the Gender–Caste Overlap in India’. Feminist Economics, 8(2): 19–35. https://doi.org/10.1080/13545700210160005
Deshpande, A. (2007). ‘Overlapping Identities under Liberalization: Gender and Caste in India’. Economic Development and Cultural Change, 55(4): 735–60. https://doi.org/10.1086/516763
Deshpande, A. (2017). The Grammar of Caste: Economic Discrimination in Contemporary India. New Delhi: Oxford University Press.
Dubey, A., W. Olsen, and K. Sen (2017). ‘The Decline in the Labour Force Participation of Rural Women in India: Taking a Long-Run View’. The Indian Journal of Labour Economics, 60: 589–612.
Greenwood, J., A. Seshadri, and M. Yorukoglu (2005). ‘Engines of Liberation’. The Review of Economic Studies, 72(1): 109–33. https://doi.org/10.1111/0034-6527.00326
Hegewisch, A., and J.C. Gornick (2011). ‘The Impact of Work-family Policies on Women’s Employment: A Review of Research from OECD Countries’. Community, Work & Family, 14(2): 119–38. https://doi.org/10.1080/13668803.2011.571395

15
Hirway, I., and S. Jose (2011). ‘Understanding women’s Work Using Time Use Statistics: The Case of India’. Feminist Economics, 17(4): 67–92. https://doi.org/10.1080/13545701.2011.622289
Jain, D.(1996). ‘Valuing Work: Time as a Measure’. Economic & Political Weekly, 31(23):.WS-46–WS-57.
Kapsos, S., A. Silberman, and E. Bourmpoula (2014). ‘Why is Female Labor Force Participation Declining So Sharply in India?’. ILO Research Paper 10. Available at: https://www.ilo.org/wcmsp5/groups/public/---dgreports/---inst/documents/publication/wcms_250977.pdf (accessed 12 July 2021).
Kingdon, G.G., and J. Unni (2001). ‘Education and Women’s Labour Market Outcomes in India’. Education Economics, 9(2): 173–95. https://doi.org/10.1080/09645290110056994
Klasen, S., and J. Pieters (2012). ‘Push or Pull? Drivers of Female Labor Force Participation During India’s Economic Boom’. IZA Discussion Paper Series, Working Paper 6395. Bonn: Institute for the Study of Labor.
Neff, D., K. Sen, and V. Kling (2012). ‘The Puzzling Decline in Rural Women’s Labor Force Participation in India: A Reexamination’. German Institute of Global and Area Studies Working Paper 196. Hamburg: GIGA. https://doi.org/10.2139/ssrn.2066585
NSSO (National Sample Survey Office) (2012). ‘India – Employment and Unemployment: NSS 68th Round, Schedule 10, July 2011- June 2012’. Available at: file:///C:/Users/lesle/Downloads/ddi-documentation-english-92%20(1).pdf (accessed December 2019).
Olsen, W., and S. Mehta (2006). ‘A Pluralist Account of Labor Participation in India’. GPRG-WPS-042. Global Poverty Research Group. Available at: https://sarpn.org/documents/d0002376/Pluralist_India_GPRG_May2006.pdf (accessed 14 October 2014).
Ortiz-Ospina, E., and S. Tzvetkova (2017). ‘Working Women: Key Facts and Trends in Female Labor Force Participation’. Available at: https://ourworldindata.org/female-labor-force-participation-key-facts (accessed 24 April 2019).
Sarkar, S., S. Sahoo, and S. Klasen (2019). ‘Employment Transitions of Women in India: A Panel Analysis’. World Development, 115, 291–309. https://doi.org/10.1016/j.worlddev.2018.12.003
Sen, G., and C. Sen (1985). ‘Women’s Domestic Work and Economic Activity: Results from National Sample Survey’. Economic and Political Weekly, XX(17): WS49‒WS56.
Siddiqui, M.Z., K. Lahiri-Dutt, S. Lockie, and B. Pritchard (2017). ‘Reconsidering Women’s Work in Rural India’. Economic and Political Weekly, 52(1): 45–52.
Srivastava, N., and R. Srivastava (2010). ‘Women, Work and Employment Outcomes in Rural India’. Economic and Political Weekly, 45(28): 49–63.
Sudarshan, R.M., and S. Bhattacharya (2009). ‘Through the Magnifying Glass: Women’s Work and Labor Force Participation in Urban Delhi’. Economic and Political Weekly, 44(48): 59–66.
Sudarshan, R.M. (2014). ‘Enabling Women’s Work’. ILO Asia-Pacific Working Paper Series ISSN: 2227-4391; 2227-4405. New Delhi: ILO.
The Economist (2018). ‘Culture and the Labour Market Keep India’s Women at Home: How Can they Be Helped to Return to the Workforce?’. Available at: https://www.economist.com/briefing/2018/07/05/culture-and-the-labour-market-keep-indias-women-at-home (accessed 12 July 2021).
Wikipedia (n.d.). The Great Indian Kitchen. Available at: https://en.wikipedia.org/wiki/The_Great_Indian_Kitchen (accessed 12 July 2021).

16
Figures
Figure 1: Women’s labour force participation status by education level, productive asset quartiles, and MPCE quartiles
Note: Figure 1 depicts the distribution of women in the working age group (16–60 years) from the West Bengal Labour Force Survey (WBLFS) sample across the three labour force categories (conventional, expenditure-saving, and out of labour force). The bars are mean female labour force participation rates (FLFPRs) for the three categories. N (conventional) = 1,004; N (expenditure-saving or extended) = 860 and N (OLF) = 1,740.
Source: authors’ calculations based on data from their primary survey.

17
Figure 2: Determinants of female labour force participation rates
Note: Figure 2 depicts the average marginal effects of various covariates on the probability of being in the three labour force categories. The omitted category for rural is urban. For the three educational categories, the omitted category is post-secondary education. For religion, the omitted category is Hindu. For marital status, the omitted category is currently married. For veiling, the omitted category is ’never veil’. For nuclear family, the omitted category is extended family. Domestic chores is a continuous variable going from 0 to 5. Childcare and elderly care are binary (0/1) dummy variables. N_conventional = 1,004; N_extended = 860 and N_OLF = 1,740.
Source: authors’ calculations based on data from their primary survey.

18
Figure 3: Determinants of women’s demand for work
Note: Figure 3 is based on responses of women who are classified as OLF (N = 1,740). The covariates are standard.
Source: authors’ calculations based on data from their primary survey.
Figure 4: Female-to-male ratio of unpaid care work
Source: Our World in Data (Ortiz-Ospina and Tzvetkova 2017). Licensed under CC-BY.
19
Figure 5: Effect of older working women on FLFPR
Note: Figure 3 depicts the added effect of an older working woman along with the average marginal effects of various covariates on the probability of being in the three labour force categories. Motherworks and MILworks are binary (0/1) dummy variables. The explanations for all variables are the same as in Figure 2.
Source: authors’ calculations based on data from their primary survey.

20
Tables
Table 1: Female labour force participation rates, West Bengal Labour Force Survey(WBLFS) 2017 and PLFS, NSS (2017–18)
Principal activity status of women, WBLFS, 2017 % of women 16–60 yrs
Howrah Murshidabad Kolkata North 24 Bankura Purulia South 24 Total
Sample Conventional 28.31 30.78 37.74 22.92 33.04 21.47 19.2 28 N 169 169 214 212 111 76 53 1,004 Extended 24.46 31.33 16.23 17.08 27.38 29.38 34.78 23.86 N 146 172 92 158 92 104 96 860 OLF 47.24 37.89 46.03 60 39.58 49.15 46.01 48.28 N 282 208 261 555 133 174 127 1,740 Total 100 100 100 100 100 100 100 100 N 597 549 567 925 336 354 276 3,604
UPAS of Women, PLFS, NSS, 2017-18 % of women 16-60 yrs West Bengal
Working 16.61 28.17 19.5 28.89 17.04 18.91 20.81 18.12 Invol unemp 1.44 0 0.49 5.22 3.43 1.35 0.5 1.54 Domestic 70.74 49.93 67.18 49.53 65.68 70.31 65.48 66.61 OLF 11.2 21.9 12.83 16.36 13.86 9.43 13.21 13.73 Total 100 100 100 100 100 100 100 100
Note: in the NSS estimates, ’working’ refers to all women with usual principal activity status (UPAS) codes 11 to 51. Involuntary unemployment refers to UPAS code 81 (did not work but was seeking and/or available for work), domestic refers to UPAS codes 92 and 93 (women engaged in domestic duties, as well as in unpaid economic activities free collection of goods, as well as sewing, tutoring, weaving etc. for household use), and OLF refers to all remaining women who are out of the labour force for various reasons.
Source: authors’ calculations from primary survey (WBLFS) and unit-level data from PLFS, NSS 2017–18.

21
Table 2: Selected summary statistics by labour force categories: WBLFS, 2017
-1 -2 -3 -4 Conventional Expenditure-saving OLF ALL
mean mean mean mean Age 36.29 34.27 35.89 35.62 SC 0.27 0.25 0.27 0.26 ST 0.06 0.08 0.05 0.06 OBC 0.13 0.13 0.13 0.13 Brahmin 0.04 0.02 0.04 0.04 UC 0.49 0.51 0.49 0.49 Hindu 0.69 0.65 0.67 0.67 Muslim 0.29 0.31 0.31 0.31 Rural 0.52 0.67 0.55 0.57 Urban 0.48 0.33 0.45 0.43 Illit 0.31 0.22 0.22 0.24 Primary 0.18 0.21 0.17 0.18 Secondary 0.28 0.45 0.40 0.38 Post-sec 0.19 0.12 0.20 0.18 Nev_married 0.07 0.03 0.05 0.05 Married 0.84 0.94 0.92 0.90 Widow 0.07 0.03 0.03 0.04 Sep_div 0.02 0.00 0.00 0.01 Children under age 5: 0 81.97 71.28 76.44 76.75 1 14.64 23.26 19.83 19.20 2 2.69 5.12 3.33 3.58 Fhh 0.11 0.05 0.04 0.06 MPCE 9,392.95 6,757.11 8,810.42 8,474.53 Cattle 0.12 0.19 0.17 0.16 Goat 0.09 0.11 0.09 0.09 Chicken 0.08 0.08 0.09 0.09 Veiling 0.58 0.70 0.59 0.61 Dom_tasks 3.48 4.04 3.65 3.70 Childcare 0.49 0.62 0.52 0.53 Eldercare 0.69 0.66 0.73 0.71 N 1,004 860 1,740 3,604
Source: authors’ calculations based on data from their primary survey.

22
Table 3: Ordinary least squares estimation of domestic tasks
dom_tasks N_labsaving -0.419***
(-7.87)
_cons 4.208*** (96.9) N 3,604
Note: t statistics in parentheses. * p<0.05, **p,0.01, ***p<0.001.
Source: authors’ calculations based on data from their primary survey.

23
Appendix A: Sample selection
The data for this study was collected through a primary survey conducted in the state of West Bengal (WBLFS 2017, hereafter) between July and September 2017. One concern could be that by focusing on one state in a diverse and heterogenous country, we could be presenting a story that is not representative of India as a whole. Table B1 in Appendix B shows female labour force participation rates in West Bengal in a comparative perspective. We see that West Bengal is above the all-India average of women who report themselves to be working according to their usual principal activity status (UPAS) but it is not an outlier. We should also note that six of the states that report high proportions of ‘working’ women are predominantly tribal states, with communities that have historically had high labour force participation of women. If we exclude these states (Sikkim, Manipur, Meghalaya, Mizoram, Chhatisgarh), the relative rank of West Bengal (in terms of women who report themselves to be working) improves.
The sampling procedure was as follows. Our first-stage sampling units (FSUs) were districts. For the selection of FSUs, we used data on district per capita income compiled by the West Bengal Government and data from the national 2011 Census for the rural–urban and demographic composition of the districts. The criteria guiding the selection of FSUs were percentage of Muslims and per capita income and, in both dimensions, we wanted to include districts representing both the top and the bottom ends of the distribution. By capturing the richest districts, we also purposively oversampled urban and peri-urban residents in order to obtain a deeper understanding of urban women than is possible from secondary data (which is predominantly rural representing the underlying population distribution).
Based on these criteria, the following seven districts were chosen: Murshidabad (highest proportion of Muslims); Howrah, North 24 Paraganas, and South 24 Paraganas (in the top eight for Muslim share, as well as for per capita income); Bankura (one of the bottom three in per capita income); Purulia (one of the bottom three for income, as well as the one of the bottom two for Muslim share); and Kolkata (richest district, fully urban). Originally, Darjeeling, a hill district, was also chosen in order to understand the hills versus plains differentiation, but the area was plagued with disturbances at the time of our survey and we therefore had to drop that entire district.
The second-stage units (SSUs) were villages/urban blocks. The SSUs were randomly chosen based on the sampling frame of the full list of villages/urban blocks from 2011 Census data. In order to avoid clustering, 40 households per village/urban block were chosen randomly, covering all the hamlets within each village. One woman per household was interviewed and from roughly half the households, a man (not necessarily the woman’s husband) was interviewed. The final sample consisted of 3,701 women and 1,817 men.
Close to 57 per cent of our sample households lived in villages and 43 per cent in towns. By design, our sample has a greater proportion of urban women compared, for instance, with the PLFS estimate from 2017–18, which is 30.35 per cent urban.12 Roughly 9 per cent of the respondents were from Bankura, 16 per cent from Howrah, 16.7 per cent from Kolkata, 15 per cent from Murshidabad, 25 per cent from North 24-Parganas, 9.7 per cent from Purulia, and 7.5 per cent from South 24-Parganas.
12 Authors’ calculations based on PLFS unit-level data.

24
Appendix B: Additional tables
Table B1: Distribution of usual principal activity status (UPAS) of Women, age 16–60 by state, 2017–18
Working Invol unemp Domestic OLF Total Sikkim 28.26 3.43 50.22 18.09 100 Goa 26.28 7.5 52.13 14.09 100 Andhra Pradesh 24.8 3.58 55.48 16.14 100 Manipur 24.12 3.19 55.91 16.77 100 D & N Haveli 23.24 0 64.83 11.93 100 Meghalaya 23.03 3.87 48.16 24.94 100 Kerala 22.21 3.7 60.13 13.96 100 Mizoram 21.54 5.42 50.92 22.12 100 Karnataka 20.64 2.17 60.18 17.01 100 Chhattisgarh 19.55 3.9 60.76 15.78 100 A & N Island 19.47 3.5 62.57 14.47 100 Puducherry 19.24 18.84 50.36 11.56 100 Chandigarh 18.38 2 58.45 21.17 100 West Bengal 18.12 1.54 66.61 13.73 100 Himachal Pradesh 16.71 4.26 58.43 20.6 100 Maharashtra 16.64 2.44 65.35 15.56 100 Assam 15.91 1.71 69 13.38 100 India 15.82 2.51 65.95 15.73 100 Lakshadweep 14.74 8.04 61.12 16.1 100 Punjab 14.71 2.21 69.89 13.2 100 Madhya Pradesh 14.69 2.05 66.97 16.28 100 Gujarat 13.9 0.76 74.01 11.34 100 Tamil Nadu 13.28 3.91 67.39 15.42 100 Tripura 13.06 7.12 62.84 16.98 100 Odisha 13.05 2.61 67.95 16.39 100 Daman & Diu 12.71 0.59 80.13 6.57 100 Jammu & Kashmir 12.63 4.17 62.52 20.68 100 Rajasthan 11.85 1.19 71.25 15.71 100 Delhi 11.35 1.67 69.1 17.88 100 Uttrakhand 10.99 3.07 64.18 21.76 100 Jharkhand 9.84 2.22 65.46 22.48 100 Uttar Pradesh 9.63 1.7 71.81 16.85 100 Haryana 9.44 2.24 67.84 20.48 100 Arunachal Pradesh 9.42 3.57 66.12 20.89 100 Nagaland 8.3 9.37 53.71 28.62 100 Bihar 6.3 0.56 76.71 16.44 100
Note: ’Working’ refers to all women with UPAS codes 11 to 51. Involuntary unemployment refers to UPAS code 81 (did not work but was seeking and/or available for work). Domestic refers to UPAS codes 92 and 93 (women engaged in domestic duties, as well as in unpaid economic activities free collection of goods, as well as sewing, tutoring, weaving etc. for household use), and OLF refers to all remaining women who are out of the labour force for various reasons.
Source: authors’ calculations based on NSS PLFS, 2017–18.

25
Table B2: Women’s LFPR by district, West Bengal, 2017–18
Working Invol unemp Domestic OLF Total
Darjiling 10.51 0 63.96 25.53 100 Jalpaiguri 13.41 2.19 73.4 10.99 100 Koch Bihar 18.11 0 47.48 34.41 100 Uttar Dinajpur 19.45 0.64 66.01 13.89 100 Dakshin Dinajpur 45.97 0 38.01 16.02 100 Maldah 27.7 3.68 56.81 11.8 100 Murshidabad 28.17 0 49.93 21.9 100 Birbhum 14.09 0 69.29 16.62 100 Nadia 6.29 0.97 79.01 13.73 100 North 24-Parganas 28.89 5.22 49.53 16.36 100 Kolkata 19.5 0.49 67.18 12.83 100 South 24-Parganas 20.81 0.5 65.48 13.21 100 Barddhaman 0 0 77.39 22.61 100 Hugli 2.75 0 82.78 14.46 100 Howrah 16.61 1.44 70.74 11.2 100 Bankura 17.04 3.43 65.68 13.86 100 Puruliya 18.91 1.35 70.31 9.43 100 Paschim Midnapur 12.61 2.53 71.49 13.38 100 Purba Midnapur 0.89 0 91.5 7.61 100
West Bengal 18.12 1.54 66.61 13.73 100
Note: the districts highlighted in bold are included in our sample.
Source: authors’ calculation based on PLFS, 2017–18.
26
Table B3: Probability of labour force categories: AMEs with added controls for wealth quartiles
AME Age
Working 0.0302*** -5.63
Expenditure-saving (ES) 0.00675
-1.29
OLF -0.0369*** (-6.56)
agesq
working
(-6.07) ES -0.0000905
(-1.30) OLF 0.000520***
-7.04 Urban
working 0.0369 -1.09
ES -0.0919** (-3.27)
OLF 0.055
-1.61 primary ed
working -0.0910** (-2.86)
ES 0.0620* -2.34
OLF 0.029 -0.97
sec ed
working -0.160***
(-5.43) ES 0.0777***
-3.46
OLF 0.0818** -2.98
post-sec ed
working -0.148***
(-4.85) ES 0.0328
-1.28 OLF 0.115***
-3.44

27
Muslim
working 0.000923
-0.02 ES -0.0352
(-1.29) OLF 0.0343
-0.99 Other relig
working -0.0167 (-0.33)
ES 0.125 -1.8
OLF -0.108 (-1.40)
never married working 0.135**
-3.02 ES -0.0261
(-0.61) OLF -0.109**
(-2.71) widowed
working 0.201*** -4.31
ES -0.0504 (-1.14)
OLF -0.150***
(-3.66) sep/div
working 0.495*** -4.23
ES -0.123 (-1.56)
OLF -0.372*** (-5.03)
veiling
working -0.00641
(-0.26) ES 0.0703**
-3.02 OLF -0.0639*
(-2.39) dom_tasks
working -0.0278*** (-3.81)
ES 0.0391*** -4.57
OLF -0.0113 (-1.35)

28
childcare
working -0.0105
(-0.60) ES 0.0562**
-2.6 OLF -0.0457*
(-2.01) eldercare
working 0.0378 -1.66
ES -0.128*** (-4.85)
OLF 0.0905*** -3.82
hhsize
working -0.0188**
(-3.20) ES 0.00794
-1.79 OLF 0.0108
-1.8 2.wealth quart working 0.0136
-0.66 ES 0.00312
-0.16 OLF -0.0168
(-0.74) 3.wealth quart working 0.0463
-1.54 ES 0.0395
-1.47 OLF -0.0858**
(-2.83) 4.wealth_quart working 0.124
-1.69 ES -0.0461
(-0.80) OLF -0.0774
(-1.37) N 3,522
Note: t statistics in parentheses. * p < 0.05, ** p < 0.01, *** p < 0.001.
Source: authors’ calculations based on data from their primary survey.