Embed Size (px)
Citation preview
WIDER Working Paper 2021/41
Traditional and modern employee benefits in Myanmar’s manufacturing sector
Henrik Hansen, John Rand, and Neda Trifković*
February 2021
* University of Copenhagen, Copenhagen, Denmark; corresponding author: [email protected]
This study has been prepared within the UNU-WIDER project Towards inclusive development in Myanmar.
Copyright © UNU-WIDER 2021
UNU-WIDER employs a fair use policy for reasonable reproduction of UNU-WIDER copyrighted content—such as the reproduction of a table or a figure, and/or text not exceeding 400 words—with due acknowledgement of the original source, without requiring explicit permission from the copyright holder.
Information and requests: [email protected]
ISSN 1798-7237 ISBN 978-92-9256-979-2
https://doi.org/10.35188/UNU-WIDER/2021/979-2
Typescript prepared by Gary Smith.
The United Nations University World Institute for Development Economics Research provides economic analysis and policy advice with the aim of promoting sustainable and equitable development. The Institute began operations in 1985 in Helsinki, Finland, as the first research and training centre of the United Nations University. Today it is a unique blend of think tank, research institute, and UN agency—providing a range of services from policy advice to governments as well as freely available original research.
The Institute is funded through income from an endowment fund with additional contributions to its work programme from Finland, Sweden, and the United Kingdom as well as earmarked contributions for specific projects from a variety of donors.
Katajanokanlaituri 6 B, 00160 Helsinki, Finland
The views expressed in this paper are those of the author(s), and do not necessarily reflect the views of the Institute or the United Nations University, nor the programme/project donors.
Abstract: Employer-provided benefits are independent elements in the compensation packages that make up firms’ payment strategies. Such benefits are aimed at attracting and retaining preferred employees and improving incentives. In Myanmar, there are two employee benefit systems: (1) an unregulated traditional system in which firms offer their employees in-kind benefits such as meals and accommodation; and (2) a modern mandatory system in which firms are required by law to offer payment schemes such as payment-while-absent and compensation for accidents. Using a survey of matched employers and employees in the manufacturing sector in Myanmar, we identify firms and workers that supply and demand the two types of employee benefits. We show that traditional benefits are widely supplied and demanded, while modern benefits are supplied by fewer firms and provided to fewer workers. We analyse the relative importance of a range of observable firm and worker attributes that may be associated with the supply and demand for the benefits. We find that firms that provide accommodation appear to attract young, unmarried, uneducated workers who are often migrants, and who, on average, receive lower wages compared to similar workers who do not receive equal in-kind payments. Large firms are more likely to offer the modern benefits and highly educated workers are more likely to demand them. Moreover, workers who receive modern benefits tend to stay longer with the firm and the benefit appears not to have an adverse impact on their wage level. Our findings indicate that both types of benefits contribute to sorting in the labour market. Therefore, both must be considered when labour laws are amended. Moreover, if increased minimum wages are accompanied by reduced provision of traditional in-kind benefits to low-wage workers, then there is a real risk that inequality in consumption will increase even though wage inequality decreases.
Keywords: compensation packages, employee benefits, labour law, Myanmar
JEL classification: J33, K31, M52, O53
Acknowledgements: This paper was prepared within the context of the UNU-WIDER project on inclusive development in Myanmar. We also acknowledge funding by the Ministry of Foreign Affairs of Denmark (administered by Danida Fellowship Centre, DFC) for the project ‘Reintegration through Active Labour Market Reforms’, project number 18-M08-KU. We are grateful for productive collaboration with the Central Statistical Organisation (CSO) in Myanmar. The usual caveats apply.
1 Introduction
Employer-provided benefits are an important motivator in the exchange between employers and employ-ees, and benefits in the form of in-kind payments such as provision of meals and lodgings are widelyused in developing countries. At the same time, international organizations, notably the ILO, showstrong interest in securing specific benefits through laws and regulations. For example, the ILO’s Con-vention No. 183, which has been ratified by the Government of Myanmar, provides for 14 weeks ofmaternity benefit to women to whom the instrument applies. In Myanmar, the labour laws have beenreformed substantially since the general election in 2010. Important changes for employee benefits wereintroduced with the Social Security Law (2012) and the Leave and Holiday Rules (2018). The new andrevised laws and regulations have introduced ‘modern’ benefits and benefit organization, for examplein the form of mandatory contributions to the Social Security Fund for employers and employees infirms with more than four employees.1 Thus, firms and wage workers in Myanmar now have two sets ofbenefit systems: a traditional unregulated system, in which firms offer their employees in-kind benefitsin the form of meals and accommodation; and a modern, highly regulated, system in which firms offertheir employees special payment schemes, such as payment-while-absent, and pension savings.
In this paper we describe and analyse how firms and workers in Myanmar’s manufacturing sector use thetwo benefit systems. Despite the mandatory nature of the modern benefits, firms may choose to ignorethe rules (i.e. to not comply with the law) and, as such, we argue that the use of both systems is governedby classical motives in the sense that it must be advantageous for both firms and workers if they are tosupply and demand the specific benefit scheme.
There is a large literature on employer-provided benefits spanning a broad range of the social sciences,including business and management, economics, sociology, and psychology.2 Today, most researchersagree that wages and employer-provided benefits are independent elements in firms’ payment strategies.Initially, benefits were viewed as a means to attract and retain desired employees, but some theoriessuggest that benefits can also improve incentives (or motivation) and thereby productivity (Oyer 2008).Still, business surveys show that attraction and retention are more important than productivity incentivesin the choice of payment strategies (Gerakos et al. 2017), although, to our knowledge, such evidenceonly exists for firms in developed countries.
The economic literature initially focused on the attraction element, and most theoretical models withinthis literature originate from Rosen (1974), who showed that non-monetary benefits can add value to theemployee when firms can purchase goods and services more cost-effectively than can employees. Thehedonic wage framework of Rosen (1974), in which workers have homogeneous preferences, leads to asorting in the labour market with a negative association between wages and benefits because high-wagefirms can offer low levels of benefits (and vice versa), keeping the worker’s utility constant. Alpert andWoodbury (2000) extend the model to include workers with unobservable differences in preferencesand show that in this setting it is optimal for firms to offer a combination of wages and benefits as thisinduces workers to self-select into the firm that offers the pay scheme giving the highest utility for theworker.
By introducing search frictions in the hedonic wage model, Hwang et al. (1998) bring in the retentionelement as they show how firms with low wages and few benefits may co-exist with firms offering high
1 We list the central labour laws for wages and benefits in Appendix A. ILO (2017) gives a more in-depth overview of thelabour laws in Myanmar.
2 Gerhart and Milkovich (1991) offer an early review of the literature on employee compensation, and the edited volume byAlpert and Woodbury (2000) contains both theoretical models and empirical studies of employer-provided benefits in Canadaand the United States. Rosen (1986) surveys the economic literature on compensating differentials in labour markets.
1
wages and many benefits. The firms can co-exist because the low-wage enterprises have high workerturnover, while the high-wage enterprises have low turnover rates, and both types of firms have equalprofit rates.
Oyer (2008) also formulates a model with search frictions that has a positive relationship between ben-efits and job tenure. Moreover, Oyer explicitly considers situations in which benefits are provided toreduce the employees’ cost of effort. If the cost of effort is increasing in hours worked, the firm mayaim to buy additional hours that are very costly to the employee. By offering benefits such as mealsand accommodation, the firm lowers the employee’s cost of effort whereby she or he may be willing towork longer hours with less wage compensation compared to the situation without the benefits. In thisway, Oyer formulates a theoretical model that addresses attraction, retention, and incentives. Further,the model implies that larger firms (having larger economies of scale in purchasing benefits) are morelikely to provide several benefits. Firms are also more likely to provide benefits that they can buy orcreate at low cost, indicating that the benefits are related to their sector of production and possibly theirlocation.
Using a survey of matched employers and employees in micro, small, and medium enterprises (MSMEs)in the manufacturing sector in Myanmar (see Hansen et al. 2020b), we characterize the firms that sup-ply and the workers who demand the traditional and modern benefits, respectively. We show that thetraditional benefits (meals, accommodation, and transport) are widely supplied and demanded. Almosthalf of the firms in our sample offer at least one of the three types of benefits, and about one-third (31per cent) of the firms offer both meals and accommodation. This is countered on the worker side, where33 per cent of the employees get meals, 32 per cent get accommodation, and 23 per cent get the twobenefits in combination. Many of these firms are small family firms in which the employee is a familymember, but we have restricted the sample such that we do not include employees who do not receivewage payments.
The use of modern benefits in the form of compensation for accidents in the workplace and payment-while-absent (sick leave, maternity leave, or paid leave) are supplied by fewer firms. The most commonmodern benefit is compensation for accidents, which is provided by 27.5 per cent of the firms. Paidleave is second, but only provided by 13.3 per cent of the firms, followed by sick leave (10 per cent ofthe firms). On the worker side we also find lower coverage of the modern benefits, as only 24 per cent ofthe employees are covered by compensation for accidents and 22 per cent are entitled to payment-while-absent. Considering that about 60 per cent of workers are supposed to be covered according to the newlabour laws, it is clear that compliance rates are low, supporting our claim that economic incentives aremore important than legal regulations when firms decide if they wish to offer the modern benefits.
We analyse the relative importance of a range of observable firm and worker attributes that may be as-sociated with the supply of and demand for employment benefits. Our main findings include that firmsin the food sector have a higher probability of supplying meals. Moreover, outside family members,migrant workers frequently receive accommodation and meals. As such, firms that provide accommoda-tion appear to attract young, unmarried, uneducated workers, who are often migrants. These workers arepaid lower wages than their colleagues who do not receive in-kind payments in the form of meals andaccommodation. In this sense, the provision of traditional benefits by manufacturing firms in Myanmaris in line with predictions based on classical economic arguments.
The use of modern benefits also has an economic rationale, although the profiles of firms and workersis less clear. We find that larger firms are more likely to offer the modern benefits and highly educatedworkers are more likely to demand them, in particular the payment-while-absent schemes. In addition,workers who get modern benefits tend to stay longer with the firm and they get the same wage as thosewho do not get modern benefits, conditional on other factors that determine the wage level. Thus, theresults for the modern benefits are in accordance with the theories developed by Oyer (2008).
2
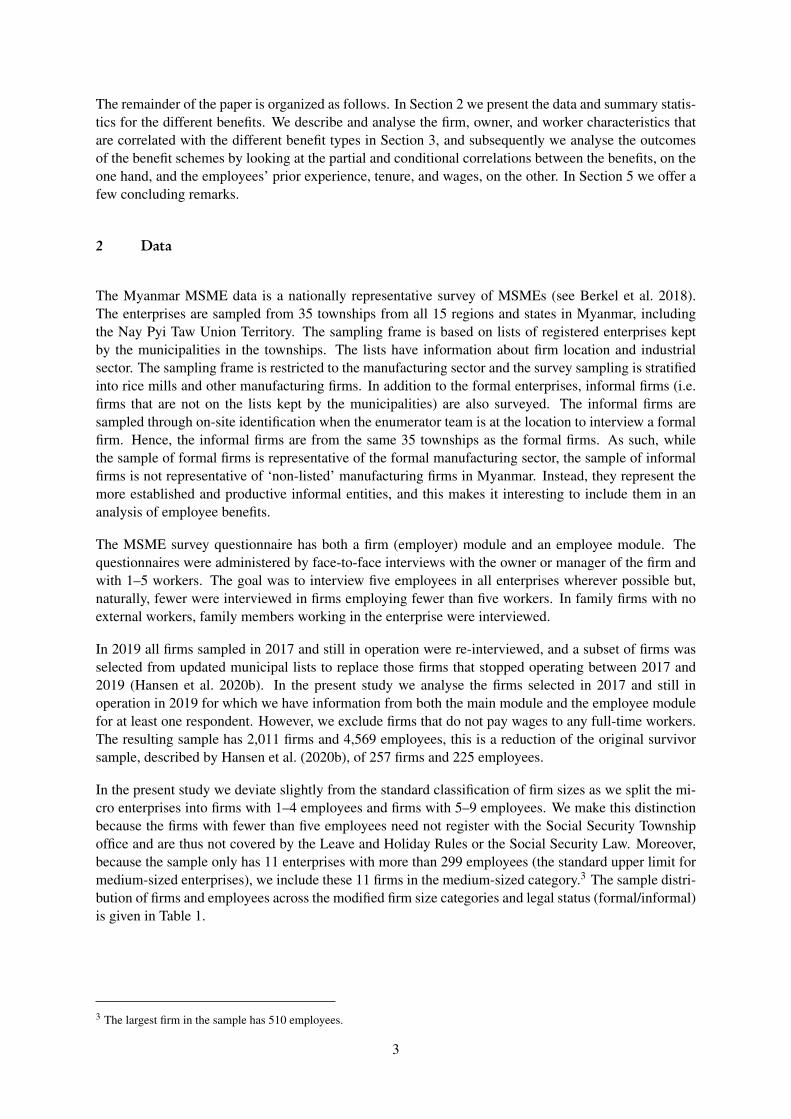
The remainder of the paper is organized as follows. In Section 2 we present the data and summary statis-tics for the different benefits. We describe and analyse the firm, owner, and worker characteristics thatare correlated with the different benefit types in Section 3, and subsequently we analyse the outcomesof the benefit schemes by looking at the partial and conditional correlations between the benefits, on theone hand, and the employees’ prior experience, tenure, and wages, on the other. In Section 5 we offer afew concluding remarks.
2 Data
The Myanmar MSME data is a nationally representative survey of MSMEs (see Berkel et al. 2018).The enterprises are sampled from 35 townships from all 15 regions and states in Myanmar, includingthe Nay Pyi Taw Union Territory. The sampling frame is based on lists of registered enterprises keptby the municipalities in the townships. The lists have information about firm location and industrialsector. The sampling frame is restricted to the manufacturing sector and the survey sampling is stratifiedinto rice mills and other manufacturing firms. In addition to the formal enterprises, informal firms (i.e.firms that are not on the lists kept by the municipalities) are also surveyed. The informal firms aresampled through on-site identification when the enumerator team is at the location to interview a formalfirm. Hence, the informal firms are from the same 35 townships as the formal firms. As such, whilethe sample of formal firms is representative of the formal manufacturing sector, the sample of informalfirms is not representative of ‘non-listed’ manufacturing firms in Myanmar. Instead, they represent themore established and productive informal entities, and this makes it interesting to include them in ananalysis of employee benefits.
The MSME survey questionnaire has both a firm (employer) module and an employee module. Thequestionnaires were administered by face-to-face interviews with the owner or manager of the firm andwith 1–5 workers. The goal was to interview five employees in all enterprises wherever possible but,naturally, fewer were interviewed in firms employing fewer than five workers. In family firms with noexternal workers, family members working in the enterprise were interviewed.
In 2019 all firms sampled in 2017 and still in operation were re-interviewed, and a subset of firms wasselected from updated municipal lists to replace those firms that stopped operating between 2017 and2019 (Hansen et al. 2020b). In the present study we analyse the firms selected in 2017 and still inoperation in 2019 for which we have information from both the main module and the employee modulefor at least one respondent. However, we exclude firms that do not pay wages to any full-time workers.The resulting sample has 2,011 firms and 4,569 employees, this is a reduction of the original survivorsample, described by Hansen et al. (2020b), of 257 firms and 225 employees.
In the present study we deviate slightly from the standard classification of firm sizes as we split the mi-cro enterprises into firms with 1–4 employees and firms with 5–9 employees. We make this distinctionbecause the firms with fewer than five employees need not register with the Social Security Townshipoffice and are thus not covered by the Leave and Holiday Rules or the Social Security Law. Moreover,because the sample only has 11 enterprises with more than 299 employees (the standard upper limit formedium-sized enterprises), we include these 11 firms in the medium-sized category.3 The sample distri-bution of firms and employees across the modified firm size categories and legal status (formal/informal)is given in Table 1.
3 The largest firm in the sample has 510 employees.
3
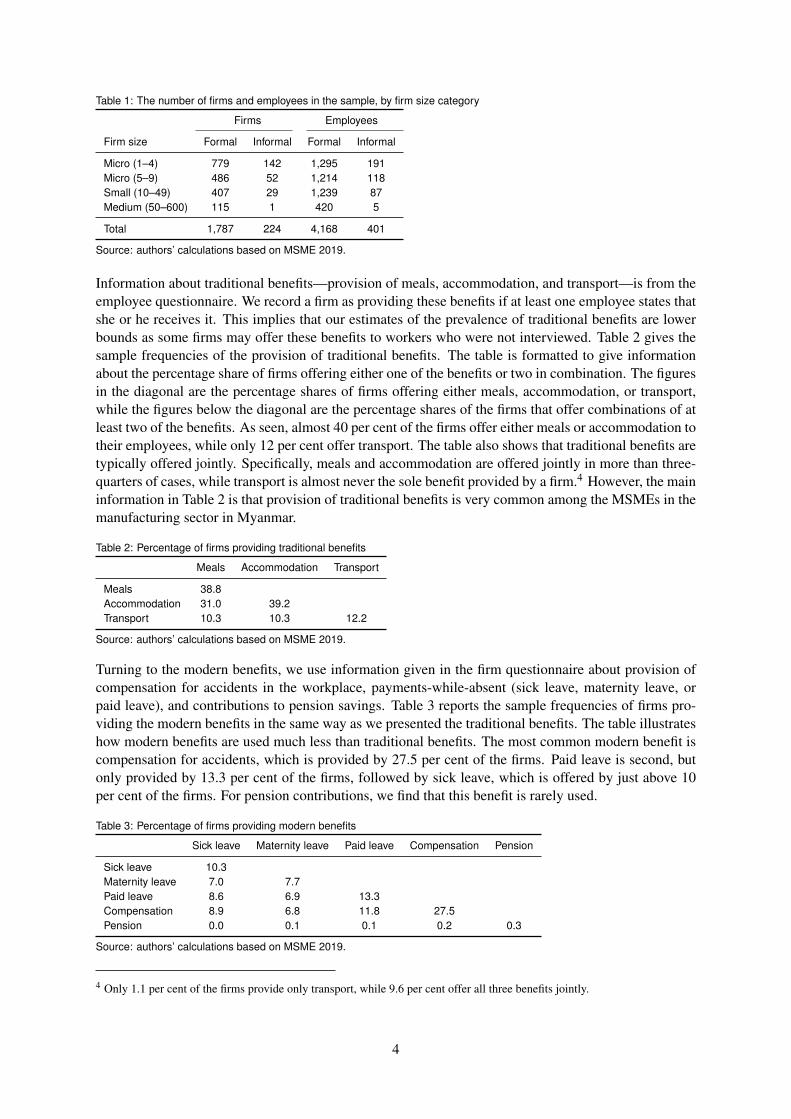
Table 1: The number of firms and employees in the sample, by firm size category
Firms Employees
Firm size Formal Informal Formal Informal
Micro (1–4) 779 142 1,295 191Micro (5–9) 486 52 1,214 118Small (10–49) 407 29 1,239 87Medium (50–600) 115 1 420 5
Total 1,787 224 4,168 401
Source: authors’ calculations based on MSME 2019.
Information about traditional benefits—provision of meals, accommodation, and transport—is from theemployee questionnaire. We record a firm as providing these benefits if at least one employee states thatshe or he receives it. This implies that our estimates of the prevalence of traditional benefits are lowerbounds as some firms may offer these benefits to workers who were not interviewed. Table 2 gives thesample frequencies of the provision of traditional benefits. The table is formatted to give informationabout the percentage share of firms offering either one of the benefits or two in combination. The figuresin the diagonal are the percentage shares of firms offering either meals, accommodation, or transport,while the figures below the diagonal are the percentage shares of the firms that offer combinations of atleast two of the benefits. As seen, almost 40 per cent of the firms offer either meals or accommodation totheir employees, while only 12 per cent offer transport. The table also shows that traditional benefits aretypically offered jointly. Specifically, meals and accommodation are offered jointly in more than three-quarters of cases, while transport is almost never the sole benefit provided by a firm.4 However, the maininformation in Table 2 is that provision of traditional benefits is very common among the MSMEs in themanufacturing sector in Myanmar.
Table 2: Percentage of firms providing traditional benefits
Meals Accommodation Transport
Meals 38.8Accommodation 31.0 39.2Transport 10.3 10.3 12.2
Source: authors’ calculations based on MSME 2019.
Turning to the modern benefits, we use information given in the firm questionnaire about provision ofcompensation for accidents in the workplace, payments-while-absent (sick leave, maternity leave, orpaid leave), and contributions to pension savings. Table 3 reports the sample frequencies of firms pro-viding the modern benefits in the same way as we presented the traditional benefits. The table illustrateshow modern benefits are used much less than traditional benefits. The most common modern benefit iscompensation for accidents, which is provided by 27.5 per cent of the firms. Paid leave is second, butonly provided by 13.3 per cent of the firms, followed by sick leave, which is offered by just above 10per cent of the firms. For pension contributions, we find that this benefit is rarely used.
Table 3: Percentage of firms providing modern benefits
Sick leave Maternity leave Paid leave Compensation Pension
Sick leave 10.3Maternity leave 7.0 7.7Paid leave 8.6 6.9 13.3Compensation 8.9 6.8 11.8 27.5Pension 0.0 0.1 0.1 0.2 0.3
Source: authors’ calculations based on MSME 2019.
4 Only 1.1 per cent of the firms provide only transport, while 9.6 per cent offer all three benefits jointly.
4
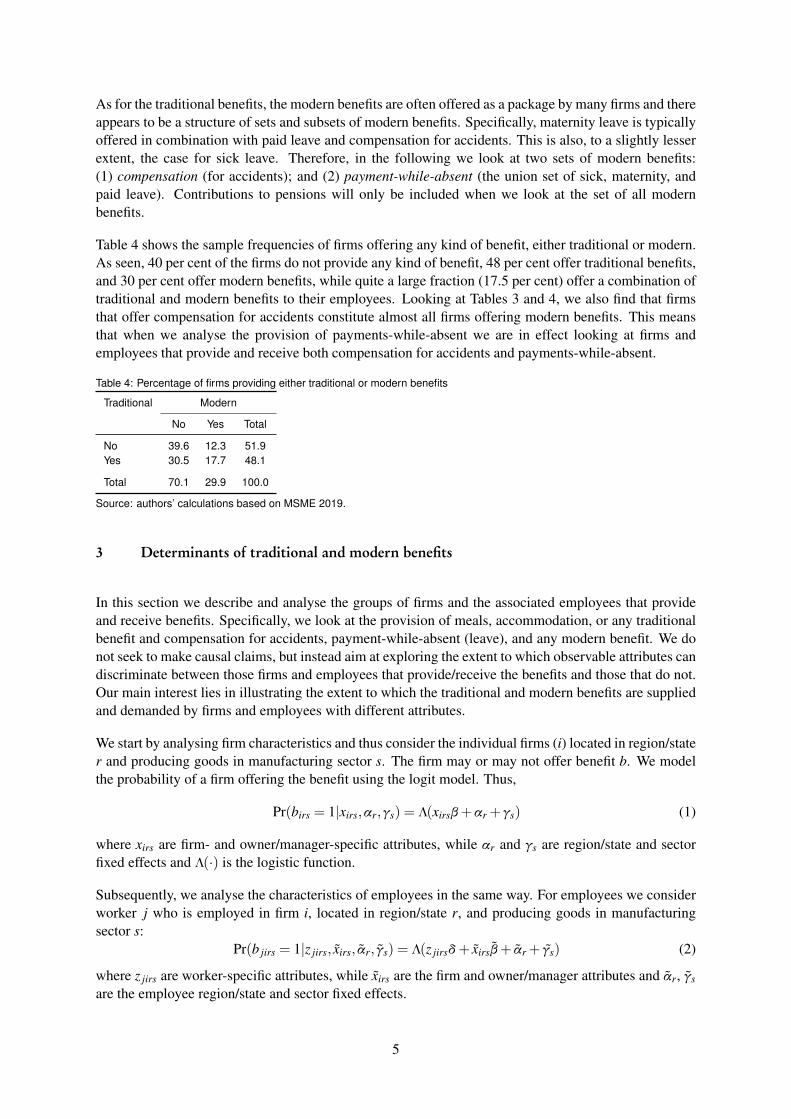
As for the traditional benefits, the modern benefits are often offered as a package by many firms and thereappears to be a structure of sets and subsets of modern benefits. Specifically, maternity leave is typicallyoffered in combination with paid leave and compensation for accidents. This is also, to a slightly lesserextent, the case for sick leave. Therefore, in the following we look at two sets of modern benefits:(1) compensation (for accidents); and (2) payment-while-absent (the union set of sick, maternity, andpaid leave). Contributions to pensions will only be included when we look at the set of all modernbenefits.
Table 4 shows the sample frequencies of firms offering any kind of benefit, either traditional or modern.As seen, 40 per cent of the firms do not provide any kind of benefit, 48 per cent offer traditional benefits,and 30 per cent offer modern benefits, while quite a large fraction (17.5 per cent) offer a combination oftraditional and modern benefits to their employees. Looking at Tables 3 and 4, we also find that firmsthat offer compensation for accidents constitute almost all firms offering modern benefits. This meansthat when we analyse the provision of payments-while-absent we are in effect looking at firms andemployees that provide and receive both compensation for accidents and payments-while-absent.
Table 4: Percentage of firms providing either traditional or modern benefits
Traditional Modern
No Yes Total
No 39.6 12.3 51.9Yes 30.5 17.7 48.1
Total 70.1 29.9 100.0
Source: authors’ calculations based on MSME 2019.
3 Determinants of traditional and modern benefits
In this section we describe and analyse the groups of firms and the associated employees that provideand receive benefits. Specifically, we look at the provision of meals, accommodation, or any traditionalbenefit and compensation for accidents, payment-while-absent (leave), and any modern benefit. We donot seek to make causal claims, but instead aim at exploring the extent to which observable attributes candiscriminate between those firms and employees that provide/receive the benefits and those that do not.Our main interest lies in illustrating the extent to which the traditional and modern benefits are suppliedand demanded by firms and employees with different attributes.
We start by analysing firm characteristics and thus consider the individual firms (i) located in region/stater and producing goods in manufacturing sector s. The firm may or may not offer benefit b. We modelthe probability of a firm offering the benefit using the logit model. Thus,
Pr(birs = 1|xirs,αr,γs) = Λ(xirsβ+αr +γs) (1)
where xirs are firm- and owner/manager-specific attributes, while αr and γs are region/state and sectorfixed effects and Λ(·) is the logistic function.
Subsequently, we analyse the characteristics of employees in the same way. For employees we considerworker j who is employed in firm i, located in region/state r, and producing goods in manufacturingsector s:
Pr(b jirs = 1|z jirs, xirs, αr, γs) = Λ(z jirsδ+ xirsβ+ αr + γs) (2)
where z jirs are worker-specific attributes, while xirs are the firm and owner/manager attributes and αr, γs
are the employee region/state and sector fixed effects.
5
3.1 Firm and owner characteristics
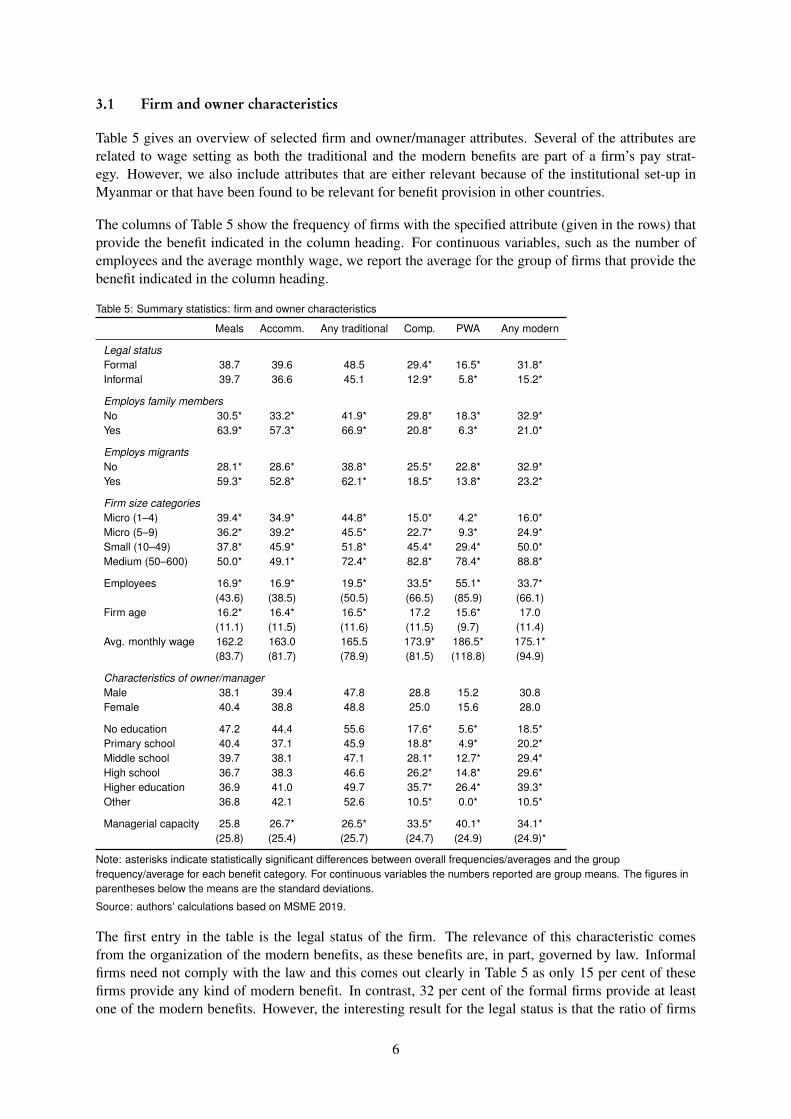
Table 5 gives an overview of selected firm and owner/manager attributes. Several of the attributes arerelated to wage setting as both the traditional and the modern benefits are part of a firm’s pay strat-egy. However, we also include attributes that are either relevant because of the institutional set-up inMyanmar or that have been found to be relevant for benefit provision in other countries.
The columns of Table 5 show the frequency of firms with the specified attribute (given in the rows) thatprovide the benefit indicated in the column heading. For continuous variables, such as the number ofemployees and the average monthly wage, we report the average for the group of firms that provide thebenefit indicated in the column heading.
Table 5: Summary statistics: firm and owner characteristics
Meals Accomm. Any traditional Comp. PWA Any modern
Legal statusFormal 38.7 39.6 48.5 29.4* 16.5* 31.8*Informal 39.7 36.6 45.1 12.9* 5.8* 15.2*
Employs family membersNo 30.5* 33.2* 41.9* 29.8* 18.3* 32.9*Yes 63.9* 57.3* 66.9* 20.8* 6.3* 21.0*
Employs migrantsNo 28.1* 28.6* 38.8* 25.5* 22.8* 32.9*Yes 59.3* 52.8* 62.1* 18.5* 13.8* 23.2*
Firm size categoriesMicro (1–4) 39.4* 34.9* 44.8* 15.0* 4.2* 16.0*Micro (5–9) 36.2* 39.2* 45.5* 22.7* 9.3* 24.9*Small (10–49) 37.8* 45.9* 51.8* 45.4* 29.4* 50.0*Medium (50–600) 50.0* 49.1* 72.4* 82.8* 78.4* 88.8*
Employees 16.9* 16.9* 19.5* 33.5* 55.1* 33.7*(43.6) (38.5) (50.5) (66.5) (85.9) (66.1)
Firm age 16.2* 16.4* 16.5* 17.2 15.6* 17.0(11.1) (11.5) (11.6) (11.5) (9.7) (11.4)
Avg. monthly wage 162.2 163.0 165.5 173.9* 186.5* 175.1*(83.7) (81.7) (78.9) (81.5) (118.8) (94.9)
Characteristics of owner/managerMale 38.1 39.4 47.8 28.8 15.2 30.8Female 40.4 38.8 48.8 25.0 15.6 28.0
No education 47.2 44.4 55.6 17.6* 5.6* 18.5*Primary school 40.4 37.1 45.9 18.8* 4.9* 20.2*Middle school 39.7 38.1 47.1 28.1* 12.7* 29.4*High school 36.7 38.3 46.6 26.2* 14.8* 29.6*Higher education 36.9 41.0 49.7 35.7* 26.4* 39.3*Other 36.8 42.1 52.6 10.5* 0.0* 10.5*
Managerial capacity 25.8 26.7* 26.5* 33.5* 40.1* 34.1*(25.8) (25.4) (25.7) (24.7) (24.9) (24.9)*
Note: asterisks indicate statistically significant differences between overall frequencies/averages and the groupfrequency/average for each benefit category. For continuous variables the numbers reported are group means. The figures inparentheses below the means are the standard deviations.
Source: authors’ calculations based on MSME 2019.
The first entry in the table is the legal status of the firm. The relevance of this characteristic comesfrom the organization of the modern benefits, as these benefits are, in part, governed by law. Informalfirms need not comply with the law and this comes out clearly in Table 5 as only 15 per cent of thesefirms provide any kind of modern benefit. In contrast, 32 per cent of the formal firms provide at leastone of the modern benefits. However, the interesting result for the legal status is that the ratio of firms
6
offering traditional benefits is equal for formal and informal enterprises. This suggests that the supply oftraditional benefits is motivated by forces in the labour market, or possibly a mix of market forces andcultural norms.5
The second entry shows whether the firm employs family members. A family member is defined asan employee who is either a member of the firm owner’s household or a relative of the owner who isnot living in the household. In the sample of firms, 25 per cent employ family members and they arenaturally more likely to get either accommodation (as some live in the household) and/or meals. On theother hand, owners who employ family members are apparently less likely to provide any of the modernbenefits. However, this may be driven by other factors, such as legal status or firm size.
The third attribute is more strategic than employment of family members. It identifies firms in thesample that employ workers who are born in another state/region than the one in which they are currentlyworking. We consider these workers to be (domestic) migrants. Comparing the provision of benefits byfirms that employ family members and those that employ migrants, we find a striking similarity, andeven a close match in terms of the order of magnitude. Firms that employ migrants are much morelikely to offer traditional benefits and much less likely to offer modern benefits.
Firm size, given as the number of employees (both permanent and temporary), is the fourth entry inTable 5. First, we report the share of firms offering a given benefit within the four firm size categories.Following these frequencies, we report the average number of employees in firms providing the benefit.For all benefit types we find a strong size dependence. Specifically, half of the small firms and just below90 per cent of the medium-sized firms provide some kind of modern benefit. In contrast, as expected,relatively few micro firms provide the modern benefits, and when they do, it is in the form of paymentfor accidents, not payment-while-absent. The association between firm size and modern benefits maythus also be driven by the institutional setting, as small and medium enterprises can be expected to beinduced to adhere to labour laws and regulations to a greater extent than micro firms.
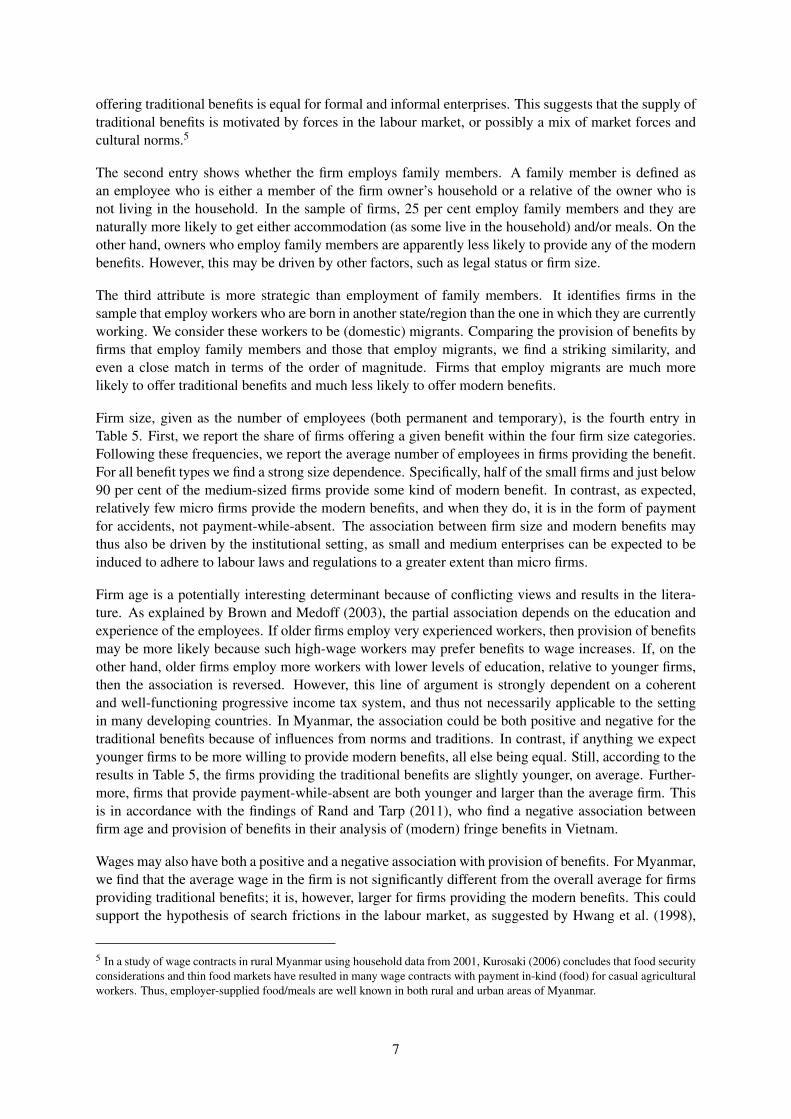
Firm age is a potentially interesting determinant because of conflicting views and results in the litera-ture. As explained by Brown and Medoff (2003), the partial association depends on the education andexperience of the employees. If older firms employ very experienced workers, then provision of benefitsmay be more likely because such high-wage workers may prefer benefits to wage increases. If, on theother hand, older firms employ more workers with lower levels of education, relative to younger firms,then the association is reversed. However, this line of argument is strongly dependent on a coherentand well-functioning progressive income tax system, and thus not necessarily applicable to the settingin many developing countries. In Myanmar, the association could be both positive and negative for thetraditional benefits because of influences from norms and traditions. In contrast, if anything we expectyounger firms to be more willing to provide modern benefits, all else being equal. Still, according to theresults in Table 5, the firms providing the traditional benefits are slightly younger, on average. Further-more, firms that provide payment-while-absent are both younger and larger than the average firm. Thisis in accordance with the findings of Rand and Tarp (2011), who find a negative association betweenfirm age and provision of benefits in their analysis of (modern) fringe benefits in Vietnam.
Wages may also have both a positive and a negative association with provision of benefits. For Myanmar,we find that the average wage in the firm is not significantly different from the overall average for firmsproviding traditional benefits; it is, however, larger for firms providing the modern benefits. This couldsupport the hypothesis of search frictions in the labour market, as suggested by Hwang et al. (1998),
5 In a study of wage contracts in rural Myanmar using household data from 2001, Kurosaki (2006) concludes that food securityconsiderations and thin food markets have resulted in many wage contracts with payment in-kind (food) for casual agriculturalworkers. Thus, employer-supplied food/meals are well known in both rural and urban areas of Myanmar.
7
but it could also be a result of differences in the employees’ education and experience along the linesdiscussed for firm age above.
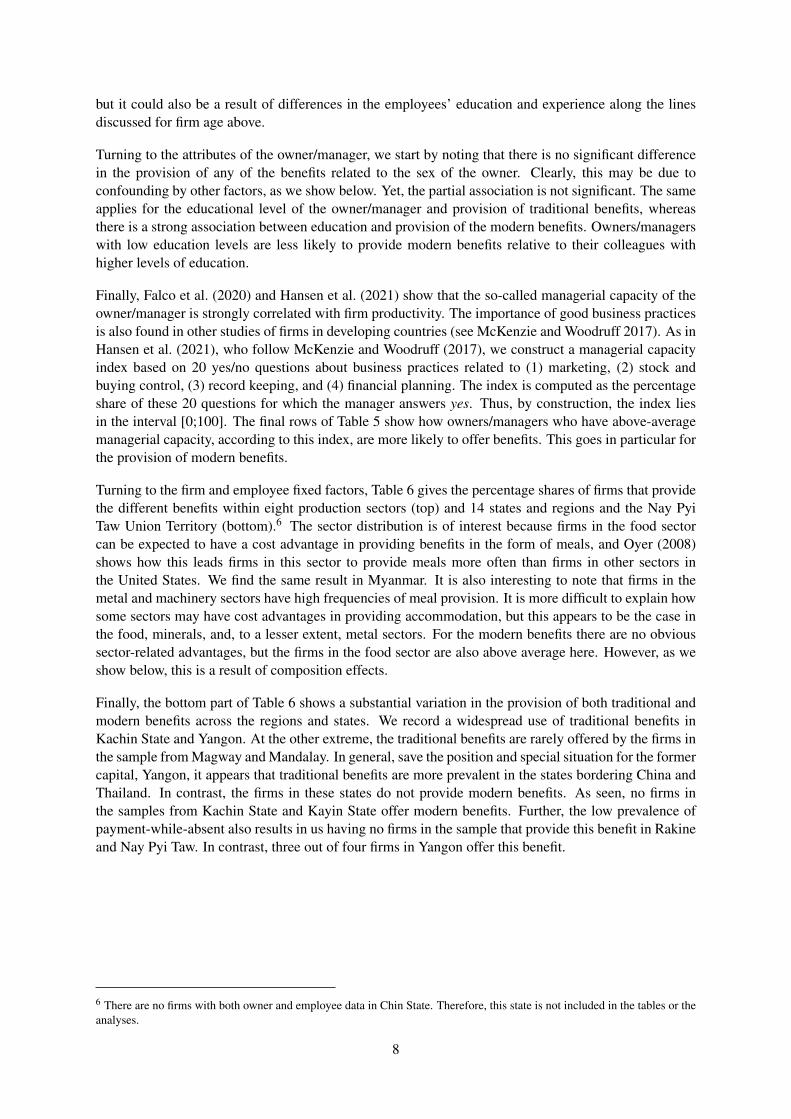
Turning to the attributes of the owner/manager, we start by noting that there is no significant differencein the provision of any of the benefits related to the sex of the owner. Clearly, this may be due toconfounding by other factors, as we show below. Yet, the partial association is not significant. The sameapplies for the educational level of the owner/manager and provision of traditional benefits, whereasthere is a strong association between education and provision of the modern benefits. Owners/managerswith low education levels are less likely to provide modern benefits relative to their colleagues withhigher levels of education.
Finally, Falco et al. (2020) and Hansen et al. (2021) show that the so-called managerial capacity of theowner/manager is strongly correlated with firm productivity. The importance of good business practicesis also found in other studies of firms in developing countries (see McKenzie and Woodruff 2017). As inHansen et al. (2021), who follow McKenzie and Woodruff (2017), we construct a managerial capacityindex based on 20 yes/no questions about business practices related to (1) marketing, (2) stock andbuying control, (3) record keeping, and (4) financial planning. The index is computed as the percentageshare of these 20 questions for which the manager answers yes. Thus, by construction, the index liesin the interval [0;100]. The final rows of Table 5 show how owners/managers who have above-averagemanagerial capacity, according to this index, are more likely to offer benefits. This goes in particular forthe provision of modern benefits.
Turning to the firm and employee fixed factors, Table 6 gives the percentage shares of firms that providethe different benefits within eight production sectors (top) and 14 states and regions and the Nay PyiTaw Union Territory (bottom).6 The sector distribution is of interest because firms in the food sectorcan be expected to have a cost advantage in providing benefits in the form of meals, and Oyer (2008)shows how this leads firms in this sector to provide meals more often than firms in other sectors inthe United States. We find the same result in Myanmar. It is also interesting to note that firms in themetal and machinery sectors have high frequencies of meal provision. It is more difficult to explain howsome sectors may have cost advantages in providing accommodation, but this appears to be the case inthe food, minerals, and, to a lesser extent, metal sectors. For the modern benefits there are no obvioussector-related advantages, but the firms in the food sector are also above average here. However, as weshow below, this is a result of composition effects.
Finally, the bottom part of Table 6 shows a substantial variation in the provision of both traditional andmodern benefits across the regions and states. We record a widespread use of traditional benefits inKachin State and Yangon. At the other extreme, the traditional benefits are rarely offered by the firms inthe sample from Magway and Mandalay. In general, save the position and special situation for the formercapital, Yangon, it appears that traditional benefits are more prevalent in the states bordering China andThailand. In contrast, the firms in these states do not provide modern benefits. As seen, no firms inthe samples from Kachin State and Kayin State offer modern benefits. Further, the low prevalence ofpayment-while-absent also results in us having no firms in the sample that provide this benefit in Rakineand Nay Pyi Taw. In contrast, three out of four firms in Yangon offer this benefit.
6 There are no firms with both owner and employee data in Chin State. Therefore, this state is not included in the tables or theanalyses.
8
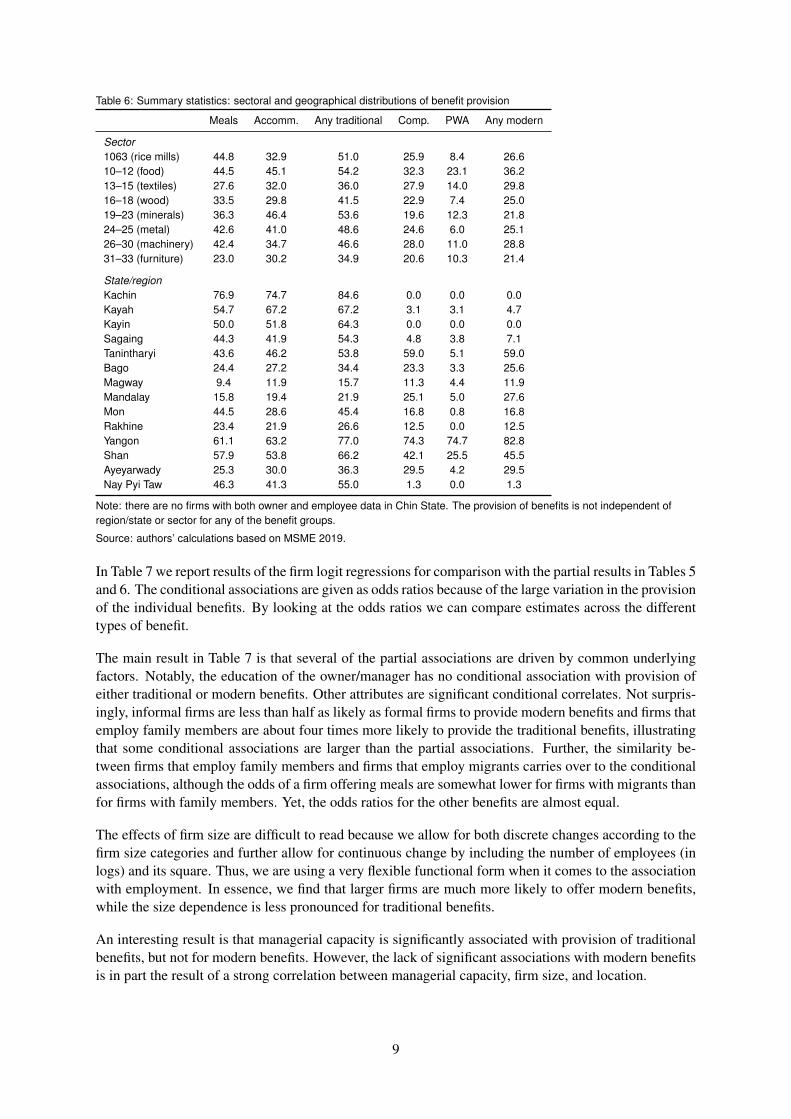
Table 6: Summary statistics: sectoral and geographical distributions of benefit provision
Meals Accomm. Any traditional Comp. PWA Any modern
Sector1063 (rice mills) 44.8 32.9 51.0 25.9 8.4 26.610–12 (food) 44.5 45.1 54.2 32.3 23.1 36.213–15 (textiles) 27.6 32.0 36.0 27.9 14.0 29.816–18 (wood) 33.5 29.8 41.5 22.9 7.4 25.019–23 (minerals) 36.3 46.4 53.6 19.6 12.3 21.824–25 (metal) 42.6 41.0 48.6 24.6 6.0 25.126–30 (machinery) 42.4 34.7 46.6 28.0 11.0 28.831–33 (furniture) 23.0 30.2 34.9 20.6 10.3 21.4
State/regionKachin 76.9 74.7 84.6 0.0 0.0 0.0Kayah 54.7 67.2 67.2 3.1 3.1 4.7Kayin 50.0 51.8 64.3 0.0 0.0 0.0Sagaing 44.3 41.9 54.3 4.8 3.8 7.1Tanintharyi 43.6 46.2 53.8 59.0 5.1 59.0Bago 24.4 27.2 34.4 23.3 3.3 25.6Magway 9.4 11.9 15.7 11.3 4.4 11.9Mandalay 15.8 19.4 21.9 25.1 5.0 27.6Mon 44.5 28.6 45.4 16.8 0.8 16.8Rakhine 23.4 21.9 26.6 12.5 0.0 12.5Yangon 61.1 63.2 77.0 74.3 74.7 82.8Shan 57.9 53.8 66.2 42.1 25.5 45.5Ayeyarwady 25.3 30.0 36.3 29.5 4.2 29.5Nay Pyi Taw 46.3 41.3 55.0 1.3 0.0 1.3
Note: there are no firms with both owner and employee data in Chin State. The provision of benefits is not independent ofregion/state or sector for any of the benefit groups.
Source: authors’ calculations based on MSME 2019.
In Table 7 we report results of the firm logit regressions for comparison with the partial results in Tables 5and 6. The conditional associations are given as odds ratios because of the large variation in the provisionof the individual benefits. By looking at the odds ratios we can compare estimates across the differenttypes of benefit.
The main result in Table 7 is that several of the partial associations are driven by common underlyingfactors. Notably, the education of the owner/manager has no conditional association with provision ofeither traditional or modern benefits. Other attributes are significant conditional correlates. Not surpris-ingly, informal firms are less than half as likely as formal firms to provide modern benefits and firms thatemploy family members are about four times more likely to provide the traditional benefits, illustratingthat some conditional associations are larger than the partial associations. Further, the similarity be-tween firms that employ family members and firms that employ migrants carries over to the conditionalassociations, although the odds of a firm offering meals are somewhat lower for firms with migrants thanfor firms with family members. Yet, the odds ratios for the other benefits are almost equal.
The effects of firm size are difficult to read because we allow for both discrete changes according to thefirm size categories and further allow for continuous change by including the number of employees (inlogs) and its square. Thus, we are using a very flexible functional form when it comes to the associationwith employment. In essence, we find that larger firms are much more likely to offer modern benefits,while the size dependence is less pronounced for traditional benefits.
An interesting result is that managerial capacity is significantly associated with provision of traditionalbenefits, but not for modern benefits. However, the lack of significant associations with modern benefitsis in part the result of a strong correlation between managerial capacity, firm size, and location.
9
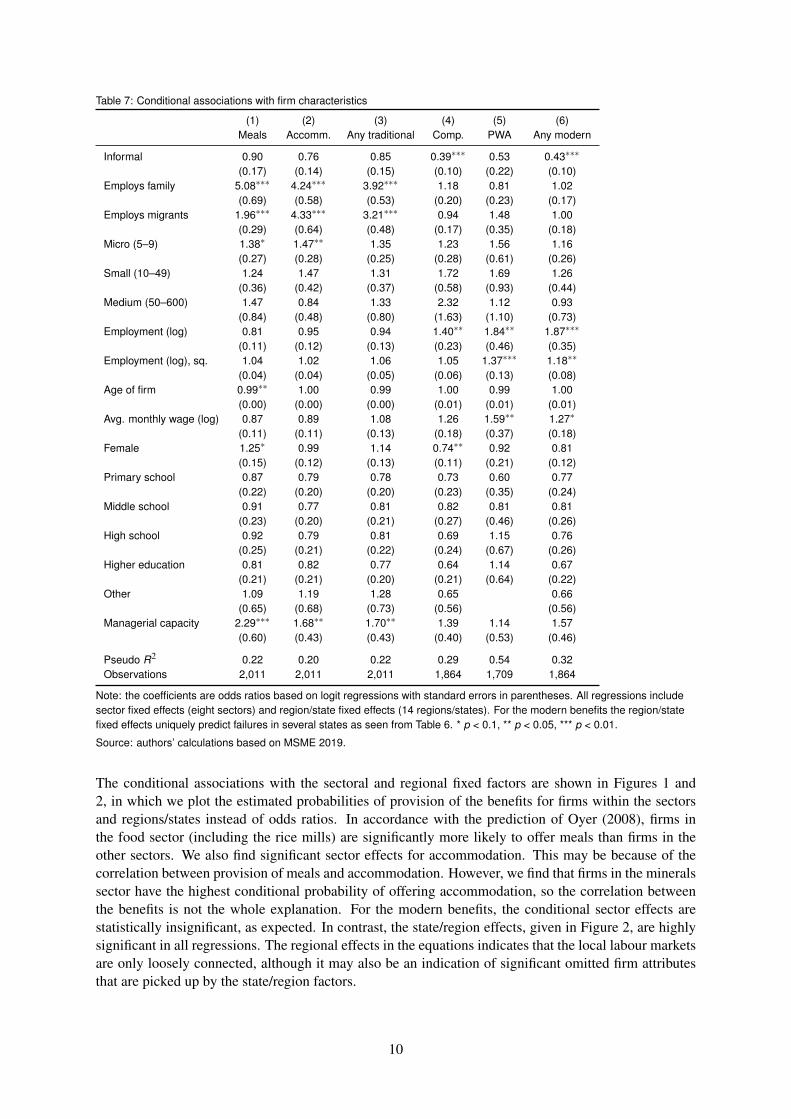
Table 7: Conditional associations with firm characteristics
(1) (2) (3) (4) (5) (6)Meals Accomm. Any traditional Comp. PWA Any modern
Informal 0.90 0.76 0.85 0.39∗∗∗ 0.53 0.43∗∗∗
(0.17) (0.14) (0.15) (0.10) (0.22) (0.10)Employs family 5.08∗∗∗ 4.24∗∗∗ 3.92∗∗∗ 1.18 0.81 1.02
(0.69) (0.58) (0.53) (0.20) (0.23) (0.17)Employs migrants 1.96∗∗∗ 4.33∗∗∗ 3.21∗∗∗ 0.94 1.48 1.00
(0.29) (0.64) (0.48) (0.17) (0.35) (0.18)Micro (5–9) 1.38∗ 1.47∗∗ 1.35 1.23 1.56 1.16
(0.27) (0.28) (0.25) (0.28) (0.61) (0.26)Small (10–49) 1.24 1.47 1.31 1.72 1.69 1.26
(0.36) (0.42) (0.37) (0.58) (0.93) (0.44)Medium (50–600) 1.47 0.84 1.33 2.32 1.12 0.93
(0.84) (0.48) (0.80) (1.63) (1.10) (0.73)Employment (log) 0.81 0.95 0.94 1.40∗∗ 1.84∗∗ 1.87∗∗∗
(0.11) (0.12) (0.13) (0.23) (0.46) (0.35)Employment (log), sq. 1.04 1.02 1.06 1.05 1.37∗∗∗ 1.18∗∗
(0.04) (0.04) (0.05) (0.06) (0.13) (0.08)Age of firm 0.99∗∗ 1.00 0.99 1.00 0.99 1.00
(0.00) (0.00) (0.00) (0.01) (0.01) (0.01)Avg. monthly wage (log) 0.87 0.89 1.08 1.26 1.59∗∗ 1.27∗
(0.11) (0.11) (0.13) (0.18) (0.37) (0.18)Female 1.25∗ 0.99 1.14 0.74∗∗ 0.92 0.81
(0.15) (0.12) (0.13) (0.11) (0.21) (0.12)Primary school 0.87 0.79 0.78 0.73 0.60 0.77
(0.22) (0.20) (0.20) (0.23) (0.35) (0.24)Middle school 0.91 0.77 0.81 0.82 0.81 0.81
(0.23) (0.20) (0.21) (0.27) (0.46) (0.26)High school 0.92 0.79 0.81 0.69 1.15 0.76
(0.25) (0.21) (0.22) (0.24) (0.67) (0.26)Higher education 0.81 0.82 0.77 0.64 1.14 0.67
(0.21) (0.21) (0.20) (0.21) (0.64) (0.22)Other 1.09 1.19 1.28 0.65 0.66
(0.65) (0.68) (0.73) (0.56) (0.56)Managerial capacity 2.29∗∗∗ 1.68∗∗ 1.70∗∗ 1.39 1.14 1.57
(0.60) (0.43) (0.43) (0.40) (0.53) (0.46)
Pseudo R2 0.22 0.20 0.22 0.29 0.54 0.32Observations 2,011 2,011 2,011 1,864 1,709 1,864
Note: the coefficients are odds ratios based on logit regressions with standard errors in parentheses. All regressions includesector fixed effects (eight sectors) and region/state fixed effects (14 regions/states). For the modern benefits the region/statefixed effects uniquely predict failures in several states as seen from Table 6. * p < 0.1, ** p < 0.05, *** p < 0.01.
Source: authors’ calculations based on MSME 2019.
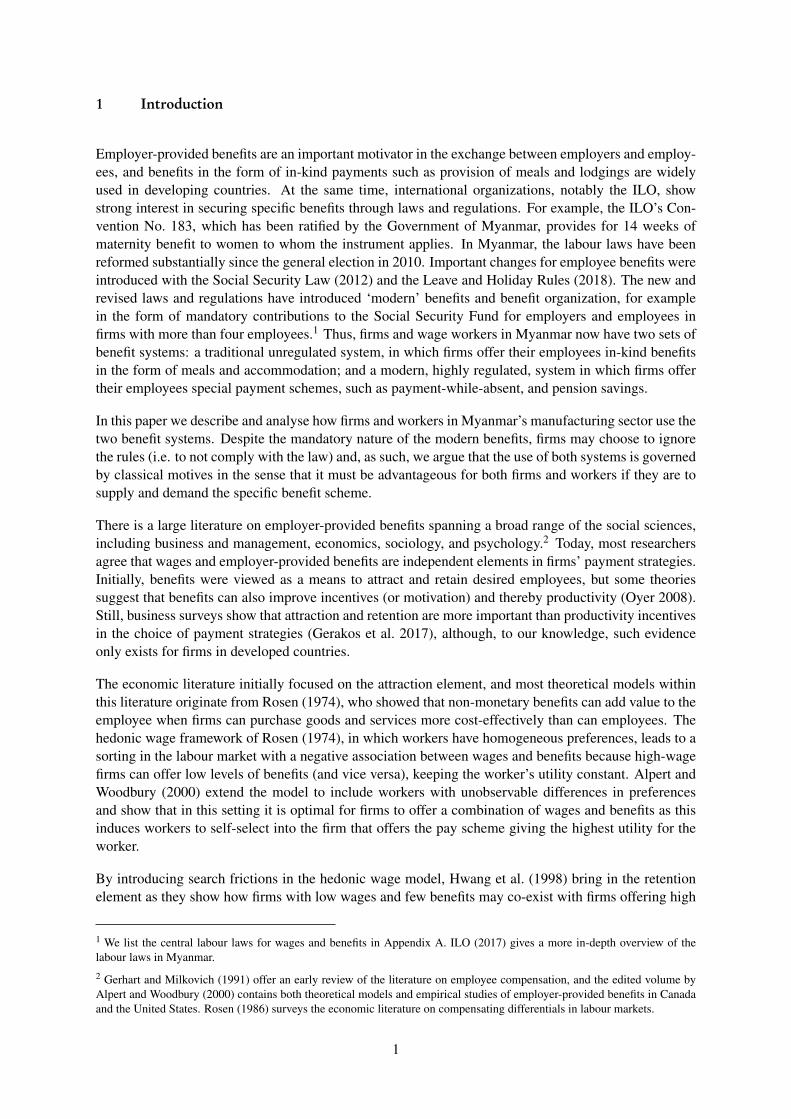
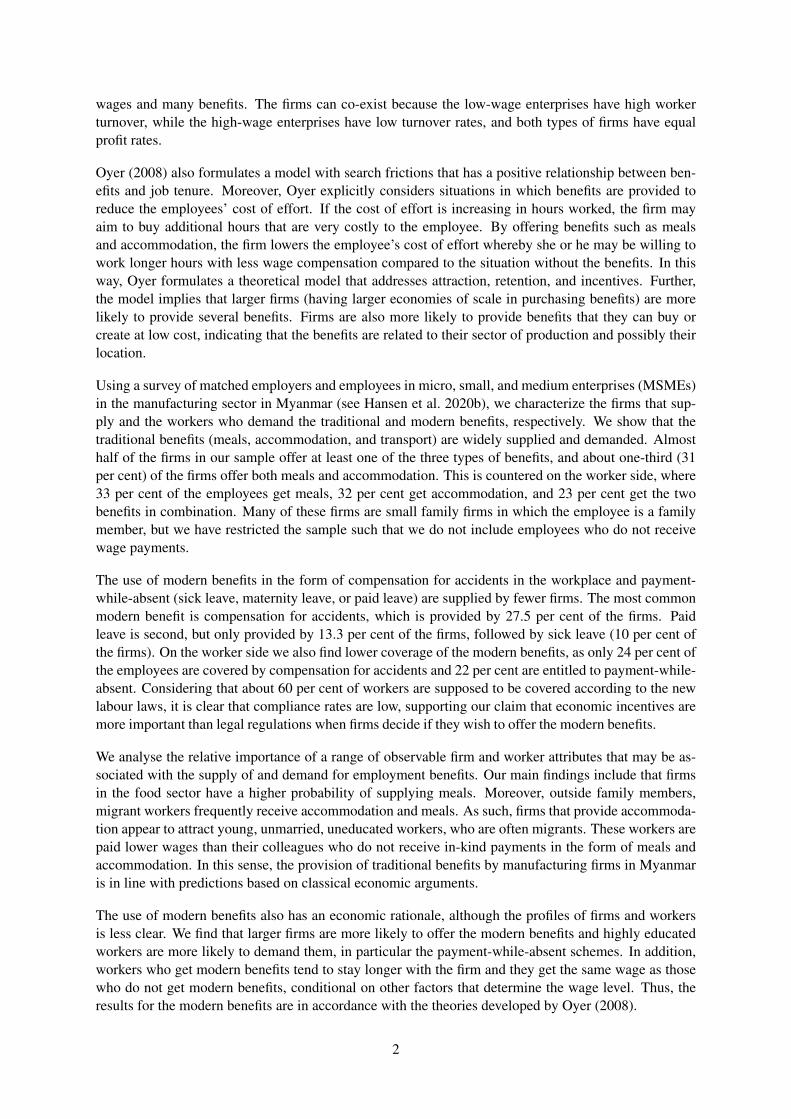
The conditional associations with the sectoral and regional fixed factors are shown in Figures 1 and2, in which we plot the estimated probabilities of provision of the benefits for firms within the sectorsand regions/states instead of odds ratios. In accordance with the prediction of Oyer (2008), firms inthe food sector (including the rice mills) are significantly more likely to offer meals than firms in theother sectors. We also find significant sector effects for accommodation. This may be because of thecorrelation between provision of meals and accommodation. However, we find that firms in the mineralssector have the highest conditional probability of offering accommodation, so the correlation betweenthe benefits is not the whole explanation. For the modern benefits, the conditional sector effects arestatistically insignificant, as expected. In contrast, the state/region effects, given in Figure 2, are highlysignificant in all regressions. The regional effects in the equations indicates that the local labour marketsare only loosely connected, although it may also be an indication of significant omitted firm attributesthat are picked up by the state/region factors.
10

Figure 1: The probability of benefit provision across production sectors
0.20
0.30
0.40
0.50
0.60
Rice mill Food Textiles Wood Minerals Metal MachineryFurniture
Meals
0.25
0.30
0.35
0.40
0.45
0.50
Rice mill Food Textiles Wood Minerals Metal MachineryFurniture
Acc
0.30
0.40
0.50
0.60
Rice mill Food Textiles Wood Minerals Metal MachineryFurniture
Any traditional
0.15
0.20
0.25
0.30
0.35
0.40
Rice mill Food Textiles Wood Minerals Metal MachineryFurniture
Compensation
0.10
0.15
0.20
0.25
0.30
Rice mill Food Textiles Wood Minerals Metal MachineryFurniture
Pwa
0.20
0.25
0.30
0.35
0.40
0.45
Rice mill Food Textiles Wood Minerals Metal MachineryFurniture
Any modern
Prob
abili
ty o
f ben
efit
Sector
Source: authors’ calculations based on MSME 2019.
Figure 2: The probability of benefit provision across states and regions
0.00
0.20
0.40
0.60
0.80
KachinKayah
KayinSagaing
TanintharyiBago
MagwayMandalay
MonRakhine
YangonShanAyeyarwady
Nay Pyi Taw
Meals
0.00
0.20
0.40
0.60
0.80
KachinKayah
KayinSagaing
TanintharyiBago
MagwayMandalay
MonRakhine
YangonShanAyeyarwady
Nay Pyi Taw
Acc
0.20
0.40
0.60
0.80
1.00
KachinKayah
KayinSagaing
TanintharyiBago
MagwayMandalay
MonRakhine
YangonShanAyeyarwady
Nay Pyi Taw
Any traditional
0.00
0.20
0.40
0.60
0.80
KayahSagaing
TanintharyiBago
MagwayMandalay
MonRakhine
YangonShanAyeyarwady
Nay Pyi Taw
Compensation
0.00
0.20
0.40
0.60
KayahSagaing
TanintharyiBago
MagwayMandalay
MonYangon
ShanAyeyarwady
Pwa
0.00
0.20
0.40
0.60
0.80
KayahSagaing
TanintharyiBago
MagwayMandalay
MonRakhine
YangonShanAyeyarwady
Nay Pyi Taw
Any modern
Prob
abili
ty o
f ben
efit
State/Region
Source: authors’ calculations based on MSME 2019.
11
3.2 Employee characteristics
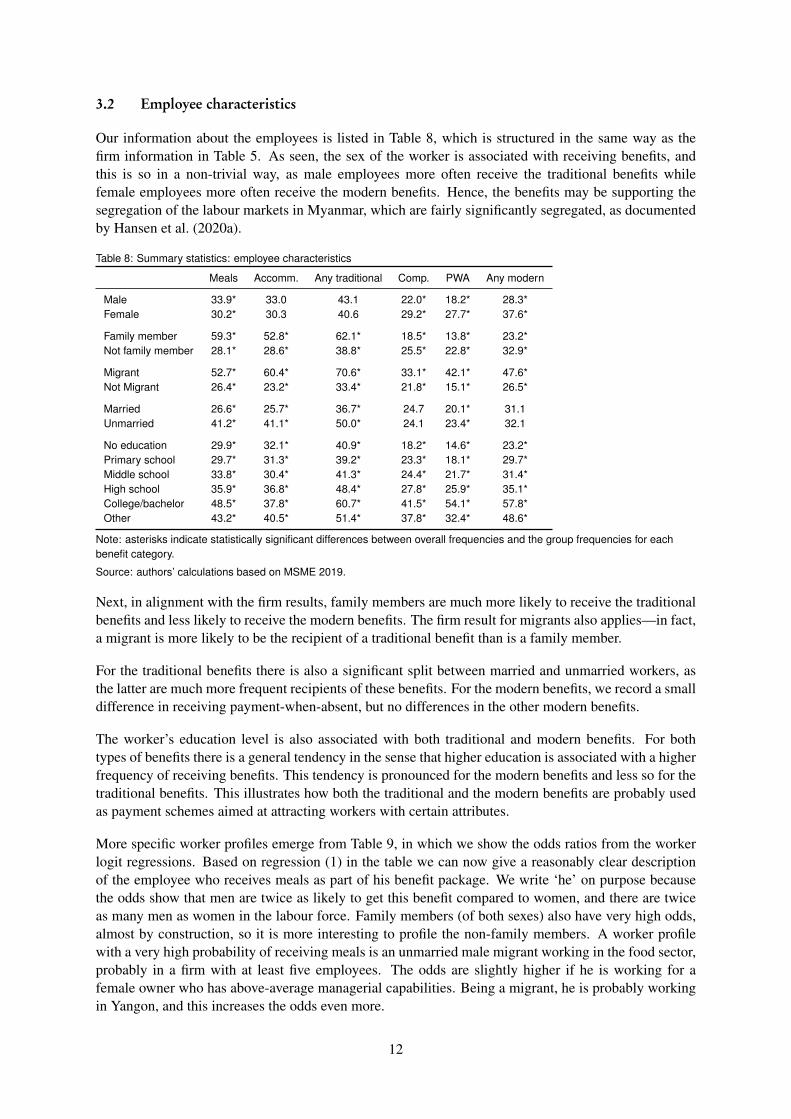
Our information about the employees is listed in Table 8, which is structured in the same way as thefirm information in Table 5. As seen, the sex of the worker is associated with receiving benefits, andthis is so in a non-trivial way, as male employees more often receive the traditional benefits whilefemale employees more often receive the modern benefits. Hence, the benefits may be supporting thesegregation of the labour markets in Myanmar, which are fairly significantly segregated, as documentedby Hansen et al. (2020a).
Table 8: Summary statistics: employee characteristics
Meals Accomm. Any traditional Comp. PWA Any modern
Male 33.9* 33.0 43.1 22.0* 18.2* 28.3*Female 30.2* 30.3 40.6 29.2* 27.7* 37.6*
Family member 59.3* 52.8* 62.1* 18.5* 13.8* 23.2*Not family member 28.1* 28.6* 38.8* 25.5* 22.8* 32.9*
Migrant 52.7* 60.4* 70.6* 33.1* 42.1* 47.6*Not Migrant 26.4* 23.2* 33.4* 21.8* 15.1* 26.5*
Married 26.6* 25.7* 36.7* 24.7 20.1* 31.1Unmarried 41.2* 41.1* 50.0* 24.1 23.4* 32.1
No education 29.9* 32.1* 40.9* 18.2* 14.6* 23.2*Primary school 29.7* 31.3* 39.2* 23.3* 18.1* 29.7*Middle school 33.8* 30.4* 41.3* 24.4* 21.7* 31.4*High school 35.9* 36.8* 48.4* 27.8* 25.9* 35.1*College/bachelor 48.5* 37.8* 60.7* 41.5* 54.1* 57.8*Other 43.2* 40.5* 51.4* 37.8* 32.4* 48.6*
Note: asterisks indicate statistically significant differences between overall frequencies and the group frequencies for eachbenefit category.
Source: authors’ calculations based on MSME 2019.
Next, in alignment with the firm results, family members are much more likely to receive the traditionalbenefits and less likely to receive the modern benefits. The firm result for migrants also applies—in fact,a migrant is more likely to be the recipient of a traditional benefit than is a family member.
For the traditional benefits there is also a significant split between married and unmarried workers, asthe latter are much more frequent recipients of these benefits. For the modern benefits, we record a smalldifference in receiving payment-when-absent, but no differences in the other modern benefits.
The worker’s education level is also associated with both traditional and modern benefits. For bothtypes of benefits there is a general tendency in the sense that higher education is associated with a higherfrequency of receiving benefits. This tendency is pronounced for the modern benefits and less so for thetraditional benefits. This illustrates how both the traditional and the modern benefits are probably usedas payment schemes aimed at attracting workers with certain attributes.
More specific worker profiles emerge from Table 9, in which we show the odds ratios from the workerlogit regressions. Based on regression (1) in the table we can now give a reasonably clear descriptionof the employee who receives meals as part of his benefit package. We write ‘he’ on purpose becausethe odds show that men are twice as likely to get this benefit compared to women, and there are twiceas many men as women in the labour force. Family members (of both sexes) also have very high odds,almost by construction, so it is more interesting to profile the non-family members. A worker profilewith a very high probability of receiving meals is an unmarried male migrant working in the food sector,probably in a firm with at least five employees. The odds are slightly higher if he is working for afemale owner who has above-average managerial capabilities. Being a migrant, he is probably workingin Yangon, and this increases the odds even more.
12
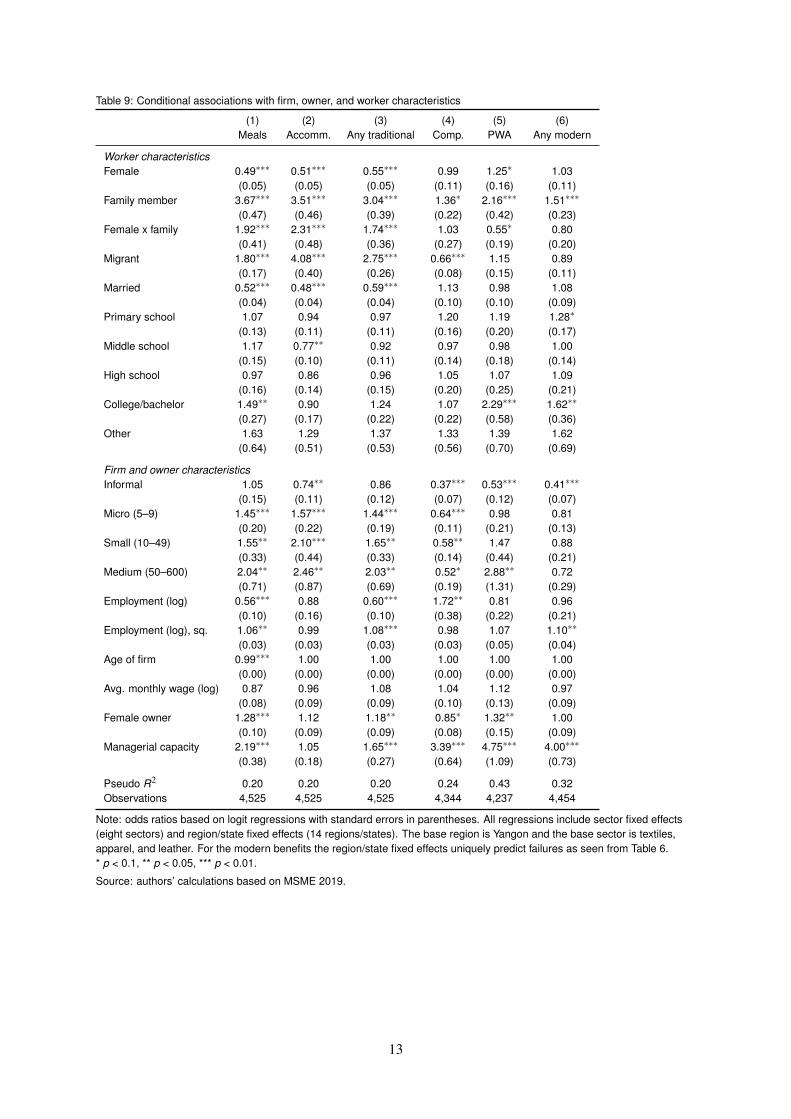
Table 9: Conditional associations with firm, owner, and worker characteristics
(1) (2) (3) (4) (5) (6)Meals Accomm. Any traditional Comp. PWA Any modern
Worker characteristicsFemale 0.49∗∗∗ 0.51∗∗∗ 0.55∗∗∗ 0.99 1.25∗ 1.03
(0.05) (0.05) (0.05) (0.11) (0.16) (0.11)Family member 3.67∗∗∗ 3.51∗∗∗ 3.04∗∗∗ 1.36∗ 2.16∗∗∗ 1.51∗∗∗
(0.47) (0.46) (0.39) (0.22) (0.42) (0.23)Female x family 1.92∗∗∗ 2.31∗∗∗ 1.74∗∗∗ 1.03 0.55∗ 0.80
(0.41) (0.48) (0.36) (0.27) (0.19) (0.20)Migrant 1.80∗∗∗ 4.08∗∗∗ 2.75∗∗∗ 0.66∗∗∗ 1.15 0.89
(0.17) (0.40) (0.26) (0.08) (0.15) (0.11)Married 0.52∗∗∗ 0.48∗∗∗ 0.59∗∗∗ 1.13 0.98 1.08
(0.04) (0.04) (0.04) (0.10) (0.10) (0.09)Primary school 1.07 0.94 0.97 1.20 1.19 1.28∗
(0.13) (0.11) (0.11) (0.16) (0.20) (0.17)Middle school 1.17 0.77∗∗ 0.92 0.97 0.98 1.00
(0.15) (0.10) (0.11) (0.14) (0.18) (0.14)High school 0.97 0.86 0.96 1.05 1.07 1.09
(0.16) (0.14) (0.15) (0.20) (0.25) (0.21)College/bachelor 1.49∗∗ 0.90 1.24 1.07 2.29∗∗∗ 1.62∗∗
(0.27) (0.17) (0.22) (0.22) (0.58) (0.36)Other 1.63 1.29 1.37 1.33 1.39 1.62
(0.64) (0.51) (0.53) (0.56) (0.70) (0.69)
Firm and owner characteristicsInformal 1.05 0.74∗∗ 0.86 0.37∗∗∗ 0.53∗∗∗ 0.41∗∗∗
(0.15) (0.11) (0.12) (0.07) (0.12) (0.07)Micro (5–9) 1.45∗∗∗ 1.57∗∗∗ 1.44∗∗∗ 0.64∗∗∗ 0.98 0.81
(0.20) (0.22) (0.19) (0.11) (0.21) (0.13)Small (10–49) 1.55∗∗ 2.10∗∗∗ 1.65∗∗ 0.58∗∗ 1.47 0.88
(0.33) (0.44) (0.33) (0.14) (0.44) (0.21)Medium (50–600) 2.04∗∗ 2.46∗∗ 2.03∗∗ 0.52∗ 2.88∗∗ 0.72
(0.71) (0.87) (0.69) (0.19) (1.31) (0.29)Employment (log) 0.56∗∗∗ 0.88 0.60∗∗∗ 1.72∗∗ 0.81 0.96
(0.10) (0.16) (0.10) (0.38) (0.22) (0.21)Employment (log), sq. 1.06∗∗ 0.99 1.08∗∗∗ 0.98 1.07 1.10∗∗
(0.03) (0.03) (0.03) (0.03) (0.05) (0.04)Age of firm 0.99∗∗∗ 1.00 1.00 1.00 1.00 1.00
(0.00) (0.00) (0.00) (0.00) (0.00) (0.00)Avg. monthly wage (log) 0.87 0.96 1.08 1.04 1.12 0.97
(0.08) (0.09) (0.09) (0.10) (0.13) (0.09)Female owner 1.28∗∗∗ 1.12 1.18∗∗ 0.85∗ 1.32∗∗ 1.00
(0.10) (0.09) (0.09) (0.08) (0.15) (0.09)Managerial capacity 2.19∗∗∗ 1.05 1.65∗∗∗ 3.39∗∗∗ 4.75∗∗∗ 4.00∗∗∗
(0.38) (0.18) (0.27) (0.64) (1.09) (0.73)
Pseudo R2 0.20 0.20 0.20 0.24 0.43 0.32Observations 4,525 4,525 4,525 4,344 4,237 4,454
Note: odds ratios based on logit regressions with standard errors in parentheses. All regressions include sector fixed effects(eight sectors) and region/state fixed effects (14 regions/states). The base region is Yangon and the base sector is textiles,apparel, and leather. For the modern benefits the region/state fixed effects uniquely predict failures as seen from Table 6.* p < 0.1, ** p < 0.05, *** p < 0.01.
Source: authors’ calculations based on MSME 2019.
13
The workers who receive accommodation have a slightly different profile. If he is an unmarried migrantthe odds are even higher, but in comparison to the worker who receives meals, the odds increase if hehas no education. Further, the odds are independent of whether or not the firm in which he is employedis owned/managed by a male or female person who has about average managerial capacity.7
For workers who receive modern benefits we record differences between compensation for accidentsand payment-while-absent. First, the odds for receiving compensation are equal for male and femaleworkers. But if the worker is a migrant, the odds that he gets compensation are low. For payment-while-absent the odds are a little higher for female than male workers (but this is only marginally significant).Hence, in general, we find very small gender differences for employees who receive modern benefits. Forthe level of education, we find no differences in compensation for accidents, while the odds for workerswith a college or bachelor’s degree are clearly in favour of receiving payment-while-absent.
When looking from the workers’ perspective, firm characteristics change somewhat compared to thefirm perspective in Table 7. Most notable is that high-capability managers increase the odds that workersreceive modern benefits. Workers in firms with female owners are more likely to receive payment-while-absent, but less likely to receive compensation for accidents compared to their colleagues in male-ownedenterprises. Finally, it should be no surprise that workers in formal firms are much more likely to getmodern benefits compared to the workers in informal firms.
4 Benefits and outcomes
The observable firm and worker attributes show that the benefits are not supplied and demanded atrandom. This illustrates that firms may (to some extent) use the benefits to attract certain types ofworkers. But we have not shown whether the benefits are also used to retain workers, nor have welooked at whether the benefits are associated with higher or lower wages for the workers. We turn tothese issues in this section.
Table 10 shows group means for three variables that we consider to be outcomes of the payment schemeand employer–employee sorting process. The first variable is the number of years of experience the em-ployee has with wage work prior to the current employment (prior experience), the second is the numberof years the worker has been employed in the firm (tenure), and the third is the monthly wage.
If the benefits are aimed at attracting either experienced or inexperienced workers, then the prior experi-ence should be higher or lower, on average, for some of the benefit groups. As seen in Table 10, we findthat employees who get traditional benefits and payment-while-absent have below-average experience(the overall average is 3.3 years), while workers who get other modern benefits are close to the averagelevel. The average tenure for all workers in the sample is 6.1 years. This is also the average numberof years for workers receiving traditional benefits. Employees who receive modern benefits have tenureabout one year above the average. Hence, modern benefits may be indicators of pay schemes that areintended to keep workers in the firm. Finally, for wages we find no difference for workers who get thetraditional benefits, but above-average wages for workers receiving the modern benefits, but these resultsare driven by other factors, as we show below.
7 There are 284 unmarried male migrants in our sample. Of these, 188 (66 per cent) receive meals, while 208 (73 per cent)receive accommodation. Adding the requirement that they must work in the food sector reduces the number of workers to 153,of which 109 (71 per cent) receive meals and 116 (75 per cent) receive accommodation. The latter shares are more than twicethe overall averages.
14
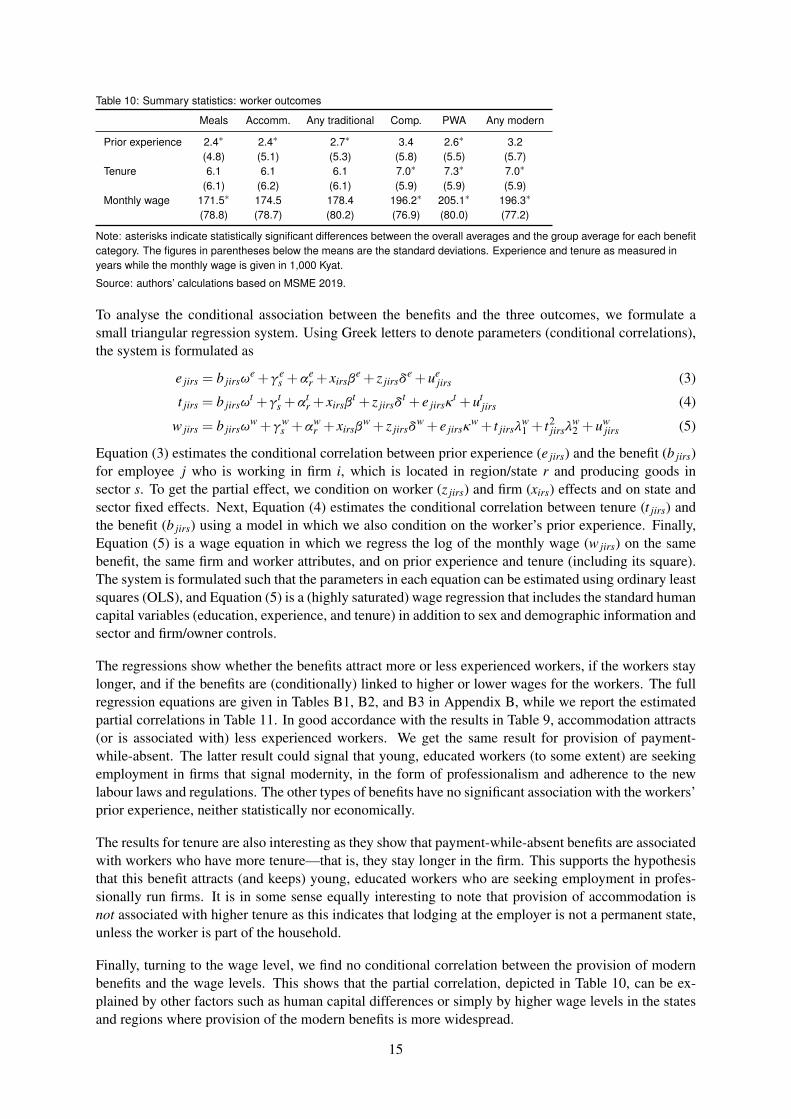
Table 10: Summary statistics: worker outcomes
Meals Accomm. Any traditional Comp. PWA Any modern
Prior experience 2.4∗ 2.4∗ 2.7∗ 3.4 2.6∗ 3.2(4.8) (5.1) (5.3) (5.8) (5.5) (5.7)
Tenure 6.1 6.1 6.1 7.0∗ 7.3∗ 7.0∗
(6.1) (6.2) (6.1) (5.9) (5.9) (5.9)Monthly wage 171.5∗ 174.5 178.4 196.2∗ 205.1∗ 196.3∗
(78.8) (78.7) (80.2) (76.9) (80.0) (77.2)
Note: asterisks indicate statistically significant differences between the overall averages and the group average for each benefitcategory. The figures in parentheses below the means are the standard deviations. Experience and tenure as measured inyears while the monthly wage is given in 1,000 Kyat.
Source: authors’ calculations based on MSME 2019.
To analyse the conditional association between the benefits and the three outcomes, we formulate asmall triangular regression system. Using Greek letters to denote parameters (conditional correlations),the system is formulated as
e jirs = b jirsωe +γes +αe
r + xirsβe + z jirsδe +uejirs (3)
t jirs = b jirsωt +γ ts +αt
r + xirsβt + z jirsδt + e jirsct +utjirs (4)
w jirs = b jirsωw +γws +αw
r + xirsβw + z jirsδw + e jirscw + t jirsλw1 + t2
jirsλw2 +uw
jirs (5)
Equation (3) estimates the conditional correlation between prior experience (e jirs) and the benefit (b jirs)for employee j who is working in firm i, which is located in region/state r and producing goods insector s. To get the partial effect, we condition on worker (z jirs) and firm (xirs) effects and on state andsector fixed effects. Next, Equation (4) estimates the conditional correlation between tenure (t jirs) andthe benefit (b jirs) using a model in which we also condition on the worker’s prior experience. Finally,Equation (5) is a wage equation in which we regress the log of the monthly wage (w jirs) on the samebenefit, the same firm and worker attributes, and on prior experience and tenure (including its square).The system is formulated such that the parameters in each equation can be estimated using ordinary leastsquares (OLS), and Equation (5) is a (highly saturated) wage regression that includes the standard humancapital variables (education, experience, and tenure) in addition to sex and demographic information andsector and firm/owner controls.
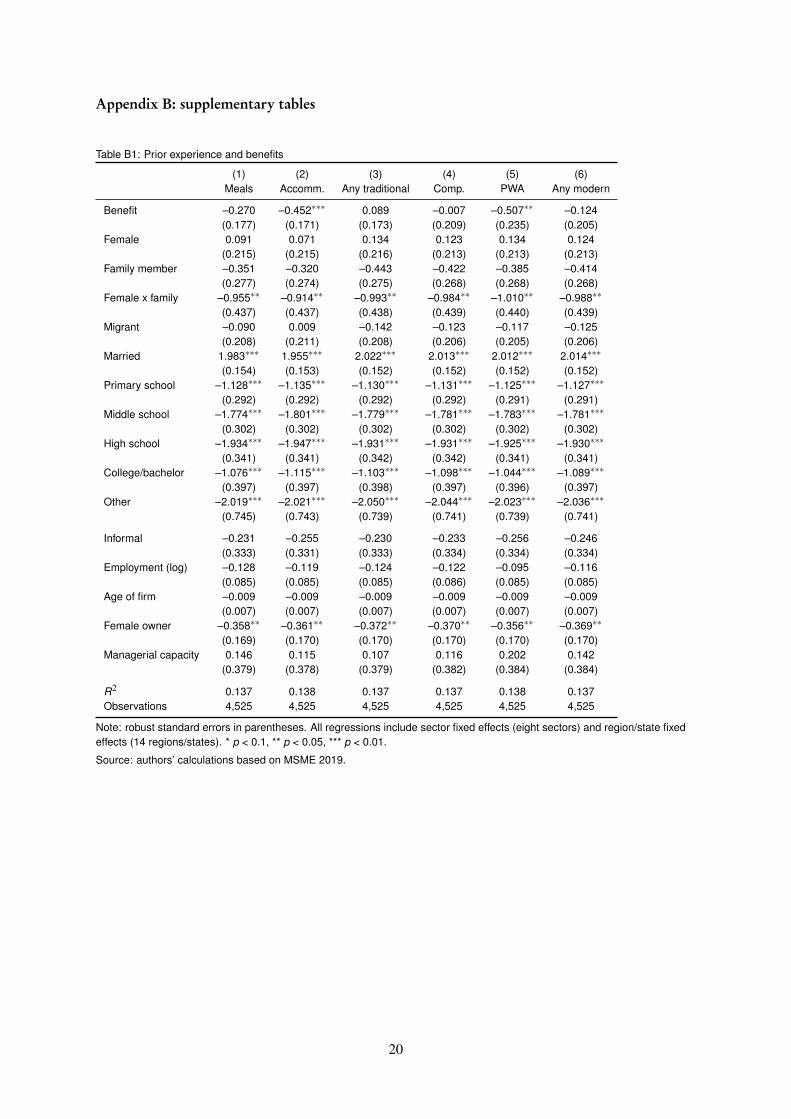
The regressions show whether the benefits attract more or less experienced workers, if the workers staylonger, and if the benefits are (conditionally) linked to higher or lower wages for the workers. The fullregression equations are given in Tables B1, B2, and B3 in Appendix B, while we report the estimatedpartial correlations in Table 11. In good accordance with the results in Table 9, accommodation attracts(or is associated with) less experienced workers. We get the same result for provision of payment-while-absent. The latter result could signal that young, educated workers (to some extent) are seekingemployment in firms that signal modernity, in the form of professionalism and adherence to the newlabour laws and regulations. The other types of benefits have no significant association with the workers’prior experience, neither statistically nor economically.
The results for tenure are also interesting as they show that payment-while-absent benefits are associatedwith workers who have more tenure—that is, they stay longer in the firm. This supports the hypothesisthat this benefit attracts (and keeps) young, educated workers who are seeking employment in profes-sionally run firms. It is in some sense equally interesting to note that provision of accommodation isnot associated with higher tenure as this indicates that lodging at the employer is not a permanent state,unless the worker is part of the household.
Finally, turning to the wage level, we find no conditional correlation between the provision of modernbenefits and the wage levels. This shows that the partial correlation, depicted in Table 10, can be ex-plained by other factors such as human capital differences or simply by higher wage levels in the statesand regions where provision of the modern benefits is more widespread.
15
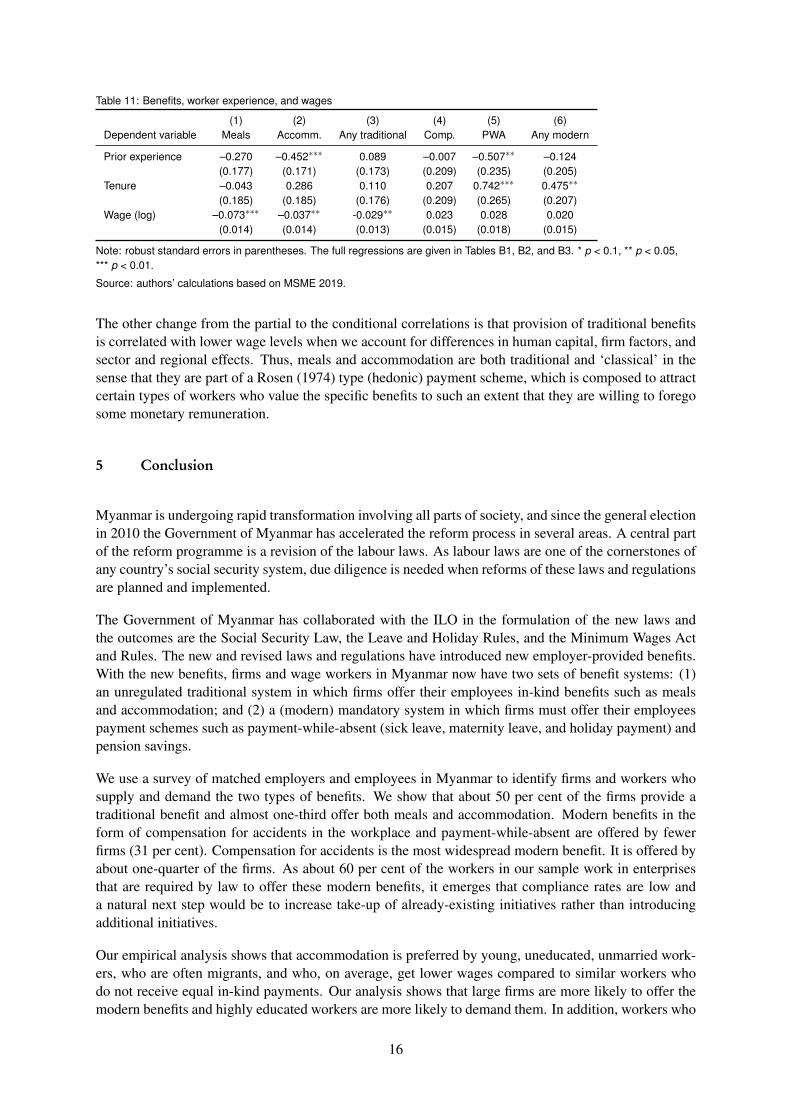
Table 11: Benefits, worker experience, and wages
(1) (2) (3) (4) (5) (6)Dependent variable Meals Accomm. Any traditional Comp. PWA Any modern
Prior experience –0.270 –0.452∗∗∗ 0.089 –0.007 –0.507∗∗ –0.124(0.177) (0.171) (0.173) (0.209) (0.235) (0.205)
Tenure –0.043 0.286 0.110 0.207 0.742∗∗∗ 0.475∗∗
(0.185) (0.185) (0.176) (0.209) (0.265) (0.207)Wage (log) –0.073∗∗∗ –0.037∗∗ -0.029∗∗ 0.023 0.028 0.020
(0.014) (0.014) (0.013) (0.015) (0.018) (0.015)
Note: robust standard errors in parentheses. The full regressions are given in Tables B1, B2, and B3. * p < 0.1, ** p < 0.05,*** p < 0.01.
Source: authors’ calculations based on MSME 2019.
The other change from the partial to the conditional correlations is that provision of traditional benefitsis correlated with lower wage levels when we account for differences in human capital, firm factors, andsector and regional effects. Thus, meals and accommodation are both traditional and ‘classical’ in thesense that they are part of a Rosen (1974) type (hedonic) payment scheme, which is composed to attractcertain types of workers who value the specific benefits to such an extent that they are willing to foregosome monetary remuneration.
5 Conclusion
Myanmar is undergoing rapid transformation involving all parts of society, and since the general electionin 2010 the Government of Myanmar has accelerated the reform process in several areas. A central partof the reform programme is a revision of the labour laws. As labour laws are one of the cornerstones ofany country’s social security system, due diligence is needed when reforms of these laws and regulationsare planned and implemented.
The Government of Myanmar has collaborated with the ILO in the formulation of the new laws andthe outcomes are the Social Security Law, the Leave and Holiday Rules, and the Minimum Wages Actand Rules. The new and revised laws and regulations have introduced new employer-provided benefits.With the new benefits, firms and wage workers in Myanmar now have two sets of benefit systems: (1)an unregulated traditional system in which firms offer their employees in-kind benefits such as mealsand accommodation; and (2) a (modern) mandatory system in which firms must offer their employeespayment schemes such as payment-while-absent (sick leave, maternity leave, and holiday payment) andpension savings.
We use a survey of matched employers and employees in Myanmar to identify firms and workers whosupply and demand the two types of benefits. We show that about 50 per cent of the firms provide atraditional benefit and almost one-third offer both meals and accommodation. Modern benefits in theform of compensation for accidents in the workplace and payment-while-absent are offered by fewerfirms (31 per cent). Compensation for accidents is the most widespread modern benefit. It is offered byabout one-quarter of the firms. As about 60 per cent of the workers in our sample work in enterprisesthat are required by law to offer these modern benefits, it emerges that compliance rates are low anda natural next step would be to increase take-up of already-existing initiatives rather than introducingadditional initiatives.
Our empirical analysis shows that accommodation is preferred by young, uneducated, unmarried work-ers, who are often migrants, and who, on average, get lower wages compared to similar workers whodo not receive equal in-kind payments. Our analysis shows that large firms are more likely to offer themodern benefits and highly educated workers are more likely to demand them. In addition, workers who
16
get modern benefits tend to stay longer with the firm and the benefit appears not to have adverse impactson their wage levels.
Thus, our findings indicate that both the traditional and modern benefits contribute to the sorting in thelabour markets and, therefore, they must be taken into account when the labour laws are amended in thefuture. Specifically, it is important to ensure that enforcement of the mandatory benefit schemes will noterode the more informal provision of meals and accommodation, which especially benefits low-wageworkers.
In the same vein, care must be taken when new minimum wage levels are set and implemented. Ifincreased minimum wages are accompanied by reduced provision of in-kind benefits to low-wage work-ers, then there is a real risk that inequality in consumption will increase even though wage inequalitydecreases. The extent to which this has been the case in Myanmar in recent years should be an area ofresearch in the future.
References
Alpert, W.T., and S.A. Woodbury (eds) (2000). Employee Benefits and Labor Markets in Canada and theUnited States. Kalamazoo, MI: W.E. Upjohn Institute for Employment Research. https://doi.org/10.17848/9780880995511
Berkel, H., M. Cardona, H. Hansen, J. Rand, P.C. Rodriguez, N. Trifkovic, E. de Witte, H. Zille, K.S. Latt, andF. Tarp (2018). ‘Myanmar Micro, Small, and Medium Enterprise Survey 2017’. Descriptive Report. Helsinki:UNU-WIDER.
Brown, C., and J. Medoff (2003). ‘Firm Age and Wages’. Journal of Labor Economics, 21(3): 677–97. https://doi.org/10.1086/374963
Falco, P., H. Hansen, J. Rand, F. Tarp, and N. Trifkovic (2020). ‘Business Practices and Productivity in theMyanmar Manufacturing Sector’. Unpublished Manuscript.
Gerakos, J.J., C.D. Ittner, and F. Moers (2017). ‘Compensation Objectives and Business Unit Pay Strategy’. Jour-nal of Management Accounting Research, 30(2): 105–30. https://doi.org/10.2308/jmar-51829
Gerhart, B., and G.T. Milkovich (1991). ‘Employee Compensation: Research and Practice’. CAHRS WorkingPaper 91-35. Ithaca, NY: Cornell University, School of Industrial and Labor Relations, Center for AdvancedHuman Resource Studies.
Hansen, H., J. Rand, F. Tarp, and N. Trifkovic (2021). ‘On the Link Between Managerial Attributes and FirmAccess to Formal Credit in Myanmar’. European Journal of Development Research. https://doi.org/10.1057/s41287-020-00318-4
Hansen, H., J. Rand, and N.W. Win (2020a). ‘The Gender Wage Gap in Myanmar: Adding Insult to Injury?’.DERG Working Paper 5. Copenhagen: University of Copenhagen. https://doi.org/10.2139/ssrn.3740822
Hansen, H., B. Sørensen, S. McGill, B. Gibertini, N. Trifkovic, J. Rand, F. Tarp, S. Myint, T. Zaw, K.M. Moe,P.P. Tun, and M.H. Aung (2020b). ‘Myanmar Micro, Small and Medium Enterprise Survey 2019’. DescriptiveReport. Helsinki: UNU-WIDER.
Hwang, H., D.T. Mortensen, and W.R. Reed (1998). ‘Hedonic Wages and Labor Market Search’. Journal of LaborEconomics, 16(4): 815–47. https://doi.org/10.1086/209907
ILO (2017). ILO Guide to the Myanmar Labour Law. Yangon: ILO Liaison Officer for Myanmar.
ILO (2018a). ‘Myanmar Labour Law: FAQs for Employers’. Fact Sheet. Available at: www.ilo.org/wcmsp5/groups/public/---asia/---ro-bangkok/---ilo-yangon/documents/publication/wcms_634853.pdf (accessed 11February 2021).
17
ILO (2018b). ‘Myanmar Labour Law: FAQs for Workers’. Fact Sheet. Available at: www.ilo.org/wcmsp5/groups/public/---asia/---ro-bangkok/---ilo-yangon/documents/publication/wcms_634852.pdf (accessed 11 February2021).
Kurosaki, T. (2006). ‘Labor Contracts, Incentives, and Food Security in Rural Myanmar’. Discussion Paper 134.Tokyo: Hitotsubashi University, Institute of Economic Research.
McKenzie, D., and C. Woodruff (2017). ‘Business Practices in Small Firms in Developing Countries’. Manage-ment Science, 63(9): 2967–81. https://doi.org/10.1287/mnsc.2016.2492
Oyer, P. (2008). ‘Salary or Benefits?’. In S.W. Polachek and K. Tatsiramos (eds), Work, Earnings and OtherAspects of the Employment Relation. Bingley: Emerald Group Publishing Limited.
Rand, J., and F. Tarp (2011). ‘Does Gender Influence the Provision of Fringe Benefits? Evidence from VietnameseSMEs’. Feminist Economics, 17(1): 59–87. https://doi.org/10.1080/13545701.2010.542003
Rosen, S. (1974). ‘Hedonic Prices and Implicit Markets: Product Differentiation in Pure Competition’. Journal ofPolitical Economy, 82: 34–55. https://doi.org/10.1086/260169
Rosen, S. (1986). ‘The Theory of Equalizing Differences’. In O. Ashenfelter and R. Layard (eds), Handbook ofLabor Economics, volume 1. New York: Elsevier. https://doi.org/10.1016/S1573-4463(86)01015-5
18
Appendix A: Labour laws and regulations
The central labour laws for wages and benefits are the Leave and Holidays Act (1951), amended in2006, and the Leave and Holiday Rules (2018) (LHA); the Social Security Law (2012) (SSL); theMinimum Wages Act (2013) and Rules (2013) and the notification on Minimum Wage No. 2/2015(MWA); the Payment of Wages Act (2016) (PWA), and the Occupational Safety and Health Act (2019)(OSHA).8
The MWA (section 2) and the PWA (section 2) define wages to include overtime fees and bonusespaid based on performance or ethics and other benefits which can be regarded as income. But the lawsexplicitly exclude:
1. travel allowances;
2. work-related expenses;
3. social welfare allowances (social security benefits);
4. contributions by the employer according to any existing law;
5. lodging and meal allowances, charges for electricity, charges for water, and other taxes;
6. medical expenses and recreational expenses;
7. contribution upon dismissal or in accordance with sympathy (severance pay); and
8. pension and reward based on service years upon their retirement.
Apart from this explicit exclusion from wage remuneration, the traditional benefits (lodging, meals, andtransport) are not regulated elsewhere, but several of the modern benefits are regulated in other labourlaws.
Payment for holidays is stipulated in the LHA, which specifies that all workers earn ten days of paidleave per year after their first 12 months of work. Moreover, the LHA and the SSL prescribe that mothersare provided 14 weeks of maternity leave while fathers are entitled to 15 days of paternity leave. Theemployer must pay for the maternity/paternity leave unless the worker contributes to the Social SecurityBoard scheme. All firms with at least five workers must register with the Social Security Township officeof the Social Security Board and must pay regular contributions. Moreover, workers—both permanentand temporary—must be registered. Both the employers and workers must make contributions to theSocial Security Fund. The contributions cover sickness, maternity, death, and work injury. The LHAand the SSL do not apply for family members in small family enterprises, but workers in these firms canregister on a voluntary basis.
8 See ILO (2017, 2018a,b) for an overview of the labour laws in Myanmar.
19
Appendix B: supplementary tables
Table B1: Prior experience and benefits
(1) (2) (3) (4) (5) (6)Meals Accomm. Any traditional Comp. PWA Any modern
Benefit –0.270 –0.452∗∗∗ 0.089 –0.007 –0.507∗∗ –0.124(0.177) (0.171) (0.173) (0.209) (0.235) (0.205)
Female 0.091 0.071 0.134 0.123 0.134 0.124(0.215) (0.215) (0.216) (0.213) (0.213) (0.213)
Family member –0.351 –0.320 –0.443 –0.422 –0.385 –0.414(0.277) (0.274) (0.275) (0.268) (0.268) (0.268)
Female x family –0.955∗∗ –0.914∗∗ –0.993∗∗ –0.984∗∗ –1.010∗∗ –0.988∗∗
(0.437) (0.437) (0.438) (0.439) (0.440) (0.439)Migrant –0.090 0.009 –0.142 –0.123 –0.117 –0.125
(0.208) (0.211) (0.208) (0.206) (0.205) (0.206)Married 1.983∗∗∗ 1.955∗∗∗ 2.022∗∗∗ 2.013∗∗∗ 2.012∗∗∗ 2.014∗∗∗
(0.154) (0.153) (0.152) (0.152) (0.152) (0.152)Primary school –1.128∗∗∗ –1.135∗∗∗ –1.130∗∗∗ –1.131∗∗∗ –1.125∗∗∗ –1.127∗∗∗
(0.292) (0.292) (0.292) (0.292) (0.291) (0.291)Middle school –1.774∗∗∗ –1.801∗∗∗ –1.779∗∗∗ –1.781∗∗∗ –1.783∗∗∗ –1.781∗∗∗
(0.302) (0.302) (0.302) (0.302) (0.302) (0.302)High school –1.934∗∗∗ –1.947∗∗∗ –1.931∗∗∗ –1.931∗∗∗ –1.925∗∗∗ –1.930∗∗∗
(0.341) (0.341) (0.342) (0.342) (0.341) (0.341)College/bachelor –1.076∗∗∗ –1.115∗∗∗ –1.103∗∗∗ –1.098∗∗∗ –1.044∗∗∗ –1.089∗∗∗
(0.397) (0.397) (0.398) (0.397) (0.396) (0.397)Other –2.019∗∗∗ –2.021∗∗∗ –2.050∗∗∗ –2.044∗∗∗ –2.023∗∗∗ –2.036∗∗∗
(0.745) (0.743) (0.739) (0.741) (0.739) (0.741)
Informal –0.231 –0.255 –0.230 –0.233 –0.256 –0.246(0.333) (0.331) (0.333) (0.334) (0.334) (0.334)
Employment (log) –0.128 –0.119 –0.124 –0.122 –0.095 –0.116(0.085) (0.085) (0.085) (0.086) (0.085) (0.085)
Age of firm –0.009 –0.009 –0.009 –0.009 –0.009 –0.009(0.007) (0.007) (0.007) (0.007) (0.007) (0.007)
Female owner –0.358∗∗ –0.361∗∗ –0.372∗∗ –0.370∗∗ –0.356∗∗ –0.369∗∗
(0.169) (0.170) (0.170) (0.170) (0.170) (0.170)Managerial capacity 0.146 0.115 0.107 0.116 0.202 0.142
(0.379) (0.378) (0.379) (0.382) (0.384) (0.384)
R2 0.137 0.138 0.137 0.137 0.138 0.137Observations 4,525 4,525 4,525 4,525 4,525 4,525
Note: robust standard errors in parentheses. All regressions include sector fixed effects (eight sectors) and region/state fixedeffects (14 regions/states). * p < 0.1, ** p < 0.05, *** p < 0.01.
Source: authors’ calculations based on MSME 2019.
20
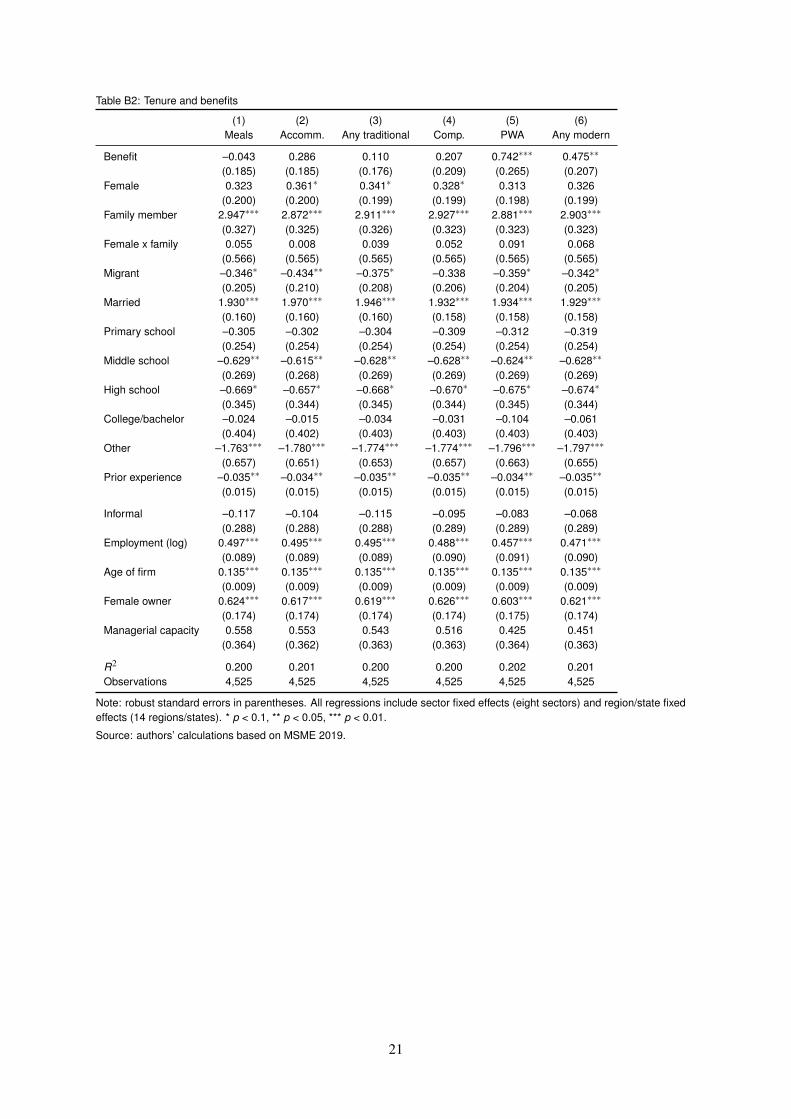
Table B2: Tenure and benefits
(1) (2) (3) (4) (5) (6)Meals Accomm. Any traditional Comp. PWA Any modern
Benefit –0.043 0.286 0.110 0.207 0.742∗∗∗ 0.475∗∗
(0.185) (0.185) (0.176) (0.209) (0.265) (0.207)Female 0.323 0.361∗ 0.341∗ 0.328∗ 0.313 0.326
(0.200) (0.200) (0.199) (0.199) (0.198) (0.199)Family member 2.947∗∗∗ 2.872∗∗∗ 2.911∗∗∗ 2.927∗∗∗ 2.881∗∗∗ 2.903∗∗∗
(0.327) (0.325) (0.326) (0.323) (0.323) (0.323)Female x family 0.055 0.008 0.039 0.052 0.091 0.068
(0.566) (0.565) (0.565) (0.565) (0.565) (0.565)Migrant –0.346∗ –0.434∗∗ –0.375∗ –0.338 –0.359∗ –0.342∗
(0.205) (0.210) (0.208) (0.206) (0.204) (0.205)Married 1.930∗∗∗ 1.970∗∗∗ 1.946∗∗∗ 1.932∗∗∗ 1.934∗∗∗ 1.929∗∗∗
(0.160) (0.160) (0.160) (0.158) (0.158) (0.158)Primary school –0.305 –0.302 –0.304 –0.309 –0.312 –0.319
(0.254) (0.254) (0.254) (0.254) (0.254) (0.254)Middle school –0.629∗∗ –0.615∗∗ –0.628∗∗ –0.628∗∗ –0.624∗∗ –0.628∗∗
(0.269) (0.268) (0.269) (0.269) (0.269) (0.269)High school –0.669∗ –0.657∗ –0.668∗ –0.670∗ –0.675∗ –0.674∗
(0.345) (0.344) (0.345) (0.344) (0.345) (0.344)College/bachelor –0.024 –0.015 –0.034 –0.031 –0.104 –0.061
(0.404) (0.402) (0.403) (0.403) (0.403) (0.403)Other –1.763∗∗∗ –1.780∗∗∗ –1.774∗∗∗ –1.774∗∗∗ –1.796∗∗∗ –1.797∗∗∗
(0.657) (0.651) (0.653) (0.657) (0.663) (0.655)Prior experience –0.035∗∗ –0.034∗∗ –0.035∗∗ –0.035∗∗ –0.034∗∗ –0.035∗∗
(0.015) (0.015) (0.015) (0.015) (0.015) (0.015)
Informal –0.117 –0.104 –0.115 –0.095 –0.083 –0.068(0.288) (0.288) (0.288) (0.289) (0.289) (0.289)
Employment (log) 0.497∗∗∗ 0.495∗∗∗ 0.495∗∗∗ 0.488∗∗∗ 0.457∗∗∗ 0.471∗∗∗
(0.089) (0.089) (0.089) (0.090) (0.091) (0.090)Age of firm 0.135∗∗∗ 0.135∗∗∗ 0.135∗∗∗ 0.135∗∗∗ 0.135∗∗∗ 0.135∗∗∗
(0.009) (0.009) (0.009) (0.009) (0.009) (0.009)Female owner 0.624∗∗∗ 0.617∗∗∗ 0.619∗∗∗ 0.626∗∗∗ 0.603∗∗∗ 0.621∗∗∗
(0.174) (0.174) (0.174) (0.174) (0.175) (0.174)Managerial capacity 0.558 0.553 0.543 0.516 0.425 0.451
(0.364) (0.362) (0.363) (0.363) (0.364) (0.363)
R2 0.200 0.201 0.200 0.200 0.202 0.201Observations 4,525 4,525 4,525 4,525 4,525 4,525
Note: robust standard errors in parentheses. All regressions include sector fixed effects (eight sectors) and region/state fixedeffects (14 regions/states). * p < 0.1, ** p < 0.05, *** p < 0.01.
Source: authors’ calculations based on MSME 2019.
21
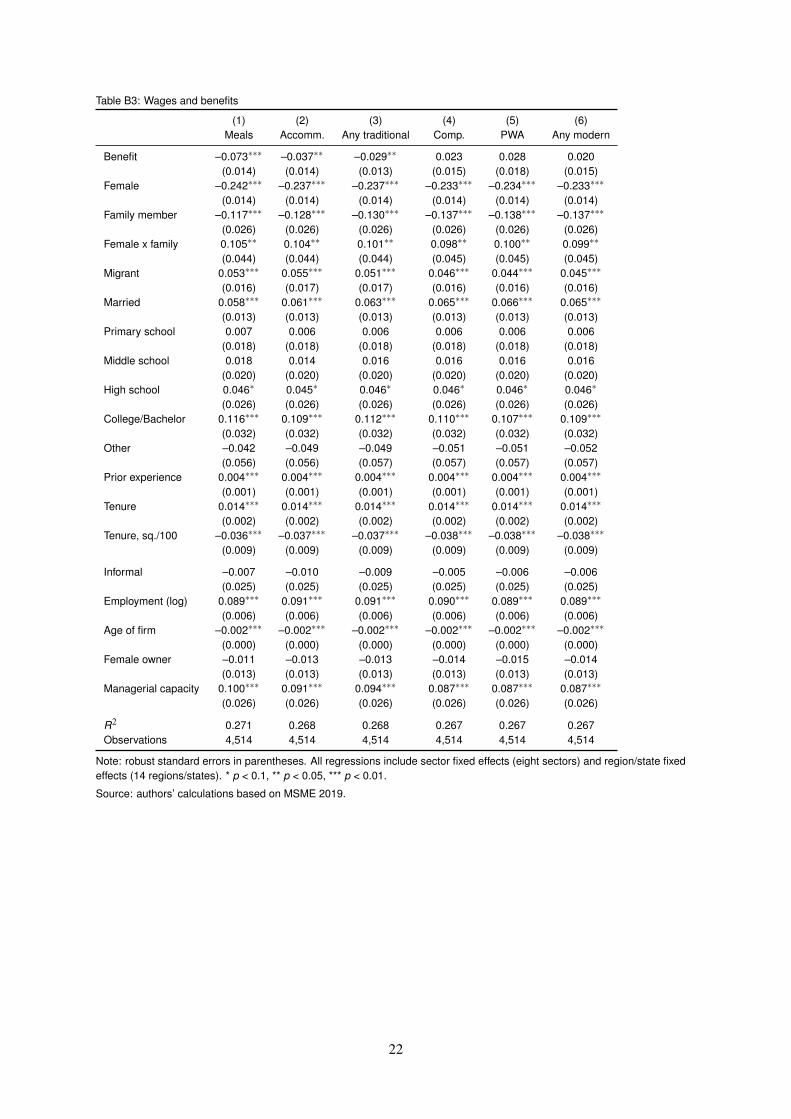
Table B3: Wages and benefits
(1) (2) (3) (4) (5) (6)Meals Accomm. Any traditional Comp. PWA Any modern
Benefit –0.073∗∗∗ –0.037∗∗ –0.029∗∗ 0.023 0.028 0.020(0.014) (0.014) (0.013) (0.015) (0.018) (0.015)
Female –0.242∗∗∗ –0.237∗∗∗ –0.237∗∗∗ –0.233∗∗∗ –0.234∗∗∗ –0.233∗∗∗
(0.014) (0.014) (0.014) (0.014) (0.014) (0.014)Family member –0.117∗∗∗ –0.128∗∗∗ –0.130∗∗∗ –0.137∗∗∗ –0.138∗∗∗ –0.137∗∗∗
(0.026) (0.026) (0.026) (0.026) (0.026) (0.026)Female x family 0.105∗∗ 0.104∗∗ 0.101∗∗ 0.098∗∗ 0.100∗∗ 0.099∗∗
(0.044) (0.044) (0.044) (0.045) (0.045) (0.045)Migrant 0.053∗∗∗ 0.055∗∗∗ 0.051∗∗∗ 0.046∗∗∗ 0.044∗∗∗ 0.045∗∗∗
(0.016) (0.017) (0.017) (0.016) (0.016) (0.016)Married 0.058∗∗∗ 0.061∗∗∗ 0.063∗∗∗ 0.065∗∗∗ 0.066∗∗∗ 0.065∗∗∗
(0.013) (0.013) (0.013) (0.013) (0.013) (0.013)Primary school 0.007 0.006 0.006 0.006 0.006 0.006
(0.018) (0.018) (0.018) (0.018) (0.018) (0.018)Middle school 0.018 0.014 0.016 0.016 0.016 0.016
(0.020) (0.020) (0.020) (0.020) (0.020) (0.020)High school 0.046∗ 0.045∗ 0.046∗ 0.046∗ 0.046∗ 0.046∗
(0.026) (0.026) (0.026) (0.026) (0.026) (0.026)College/Bachelor 0.116∗∗∗ 0.109∗∗∗ 0.112∗∗∗ 0.110∗∗∗ 0.107∗∗∗ 0.109∗∗∗
(0.032) (0.032) (0.032) (0.032) (0.032) (0.032)Other –0.042 –0.049 –0.049 –0.051 –0.051 –0.052
(0.056) (0.056) (0.057) (0.057) (0.057) (0.057)Prior experience 0.004∗∗∗ 0.004∗∗∗ 0.004∗∗∗ 0.004∗∗∗ 0.004∗∗∗ 0.004∗∗∗
(0.001) (0.001) (0.001) (0.001) (0.001) (0.001)Tenure 0.014∗∗∗ 0.014∗∗∗ 0.014∗∗∗ 0.014∗∗∗ 0.014∗∗∗ 0.014∗∗∗
(0.002) (0.002) (0.002) (0.002) (0.002) (0.002)Tenure, sq./100 –0.036∗∗∗ –0.037∗∗∗ –0.037∗∗∗ –0.038∗∗∗ –0.038∗∗∗ –0.038∗∗∗
(0.009) (0.009) (0.009) (0.009) (0.009) (0.009)
Informal –0.007 –0.010 –0.009 –0.005 –0.006 –0.006(0.025) (0.025) (0.025) (0.025) (0.025) (0.025)
Employment (log) 0.089∗∗∗ 0.091∗∗∗ 0.091∗∗∗ 0.090∗∗∗ 0.089∗∗∗ 0.089∗∗∗
(0.006) (0.006) (0.006) (0.006) (0.006) (0.006)Age of firm –0.002∗∗∗ –0.002∗∗∗ –0.002∗∗∗ –0.002∗∗∗ –0.002∗∗∗ –0.002∗∗∗
(0.000) (0.000) (0.000) (0.000) (0.000) (0.000)Female owner –0.011 –0.013 –0.013 –0.014 –0.015 –0.014
(0.013) (0.013) (0.013) (0.013) (0.013) (0.013)Managerial capacity 0.100∗∗∗ 0.091∗∗∗ 0.094∗∗∗ 0.087∗∗∗ 0.087∗∗∗ 0.087∗∗∗
(0.026) (0.026) (0.026) (0.026) (0.026) (0.026)
R2 0.271 0.268 0.268 0.267 0.267 0.267Observations 4,514 4,514 4,514 4,514 4,514 4,514
Note: robust standard errors in parentheses. All regressions include sector fixed effects (eight sectors) and region/state fixedeffects (14 regions/states). * p < 0.1, ** p < 0.05, *** p < 0.01.
Source: authors’ calculations based on MSME 2019.
22