Embed Size (px)
Citation preview
WiFi-ID: Human Identification using WiFi signalJin Zhang∗†, Bo Wei‡, Wen Hu∗†, Salil S. Kanhere∗
∗School of Computer Science and Engineering, The University of New South Wales, AustraliaEmail: {jin.zhang1,wen.hu,salil.kanhere}@unsw.edu.au†CSIRO Digital Productivity Flagship, Australia
‡Department of Computer Science, University of Oxford, UK Email: {bo.wei}@cs.ox.ac.uk
Abstract—Prior research has shown the potential of device-free WiFi sensing for human activity recognition. In this paper,we show for the first time WiFi signals can also be used touniquely identify people. There is strong evidence that suggeststhat all humans have a unique gait. An individual’s gait will thuscreate unique perturbations in the WiFi spectrum. We propose asystem called WiFi-ID that analyses the channel state informationto extract unique features that are representative of the walkingstyle of that individual and thus allow us to uniquely identifythat person. We implement WiFi-ID on commercial off-the-shelfdevices. We conduct extensive experiments to demonstrate thatour system can uniquely identify people with average accuracyof 93% to 77% from a group of 2 to 6 people, respectively. Weenvisage that this technology can find many applications in smalloffice or smart home settings.
I. INTRODUCTION
Wireless devices are everywhere - our homes, offices, shops,restaurants and virtually all of our urban spaces. They invisiblyfill the air with a spectrum of Radio Frequency (RF) signals.When a person walks through these spaces, they create aperturbation in this RF field. By closely examining theseperturbations using the Channel State Information (CSI), itis possible to identify basic human activities such as standing,sitting, walking and running [25] and even hand gestures [19]and keystrokes typed on a keyboard [3].
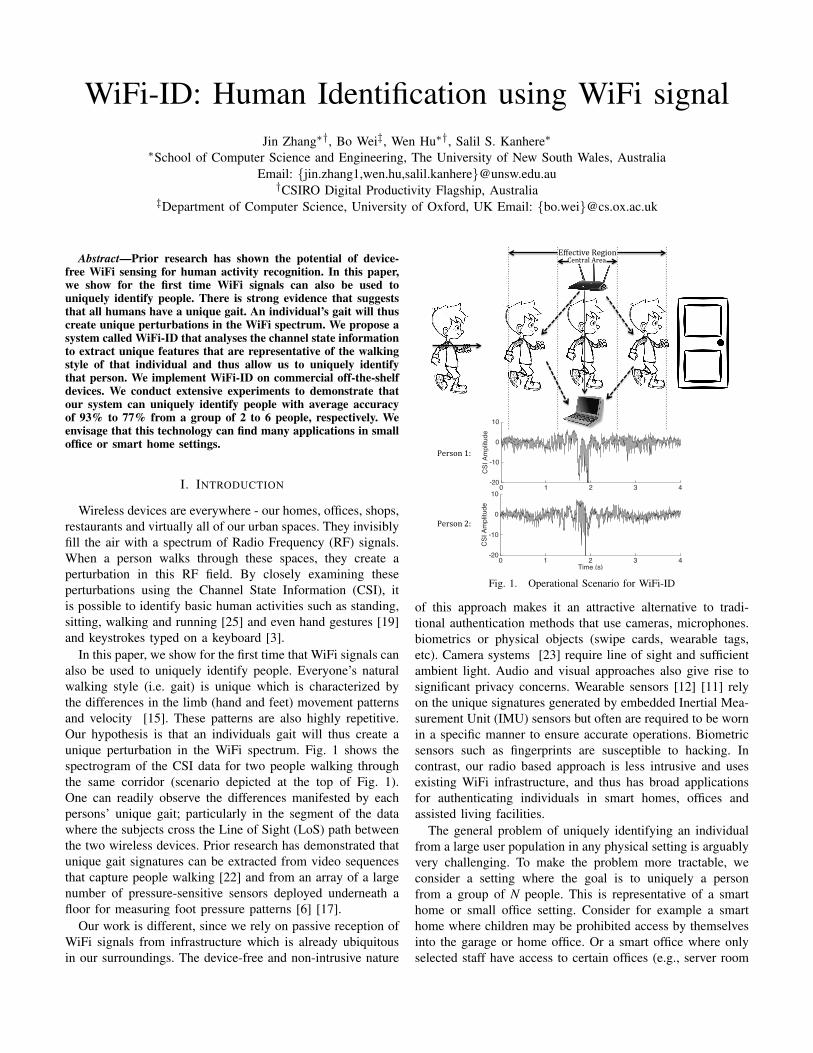
In this paper, we show for the first time that WiFi signals canalso be used to uniquely identify people. Everyone’s naturalwalking style (i.e. gait) is unique which is characterized bythe differences in the limb (hand and feet) movement patternsand velocity [15]. These patterns are also highly repetitive.Our hypothesis is that an individuals gait will thus create aunique perturbation in the WiFi spectrum. Fig. 1 shows thespectrogram of the CSI data for two people walking throughthe same corridor (scenario depicted at the top of Fig. 1).One can readily observe the differences manifested by eachpersons’ unique gait; particularly in the segment of the datawhere the subjects cross the Line of Sight (LoS) path betweenthe two wireless devices. Prior research has demonstrated thatunique gait signatures can be extracted from video sequencesthat capture people walking [22] and from an array of a largenumber of pressure-sensitive sensors deployed underneath afloor for measuring foot pressure patterns [6] [17].
Our work is different, since we rely on passive reception ofWiFi signals from infrastructure which is already ubiquitousin our surroundings. The device-free and non-intrusive nature
Time (s)0 1 2 3 4
CSI
Am
plitu
de-20
-10
0
10
CentralArea
Person1:
Person2:
EffectiveRegion
Time (s)0 1 2 3 4
CSI
Am
plitu
de
-20
-10
0
10
Fig. 1. Operational Scenario for WiFi-ID
of this approach makes it an attractive alternative to tradi-tional authentication methods that use cameras, microphones.biometrics or physical objects (swipe cards, wearable tags,etc). Camera systems [23] require line of sight and sufficientambient light. Audio and visual approaches also give rise tosignificant privacy concerns. Wearable sensors [12] [11] relyon the unique signatures generated by embedded Inertial Mea-surement Unit (IMU) sensors but often are required to be wornin a specific manner to ensure accurate operations. Biometricsensors such as fingerprints are susceptible to hacking. Incontrast, our radio based approach is less intrusive and usesexisting WiFi infrastructure, and thus has broad applicationsfor authenticating individuals in smart homes, offices andassisted living facilities.
The general problem of uniquely identifying an individualfrom a large user population in any physical setting is arguablyvery challenging. To make the problem more tractable, weconsider a setting where the goal is to uniquely a personfrom a group of N people. This is representative of a smarthome or small office setting. Consider for example a smarthome where children may be prohibited access by themselvesinto the garage or home office. Or a smart office where onlyselected staff have access to certain offices (e.g., server room
or file storage). Moreover, we consider a simple yet commonscenario for a home or office setting, wherein a single person(from a group of N people) walks through a corridor towardsa door as depicted. The goal is to uniquely identify this personso as to either permit or deny access to the room behind thedoor.
In this paper, we propose WiFi-ID, a WiFi based humanidentification system that is deployed on commercial off-the-shelf WiFi devices. A transmitter node (any typical WiFi AP)continuously sends packets to a receiver node (e.g. laptop)which passively records CSI data from the received packets.The CSI data captures the aggregate impact of multi-path,shadowing and interference on the WiFi signals in a givenenvironment. When a person walks, their gait impacts theenvironment in a unique manner, which changes the effect ofthese phenomena on the WiFi signal. It is expected that theseare in turn manifested as unique perturbations in the CSI data.There are several challenges in realising human identification,even in this seemingly simplified setting.
The CSI time series constitutes data from multiple trans-mit (Nt) and receive (Nr) antenna pairs each comprised ofmultiple subcarriers (e.g., 30 OFDM subcarriers for 802.11n).The first technical challenge is to determine if the CSI datais rich enough to capture unique signatures of a person’s gait.Prior work [24] has suggested that the perturbations causedby the motion of human limbs (hand and feet) while walkingis typically concentrated in certain specific RF bands. Usingempirical measurements we demonstrate that the effects ofhuman gait are most pronounced in the 20-80 Hz frequencybands for 5GHz WiFi. We adopt the FFT based ContinuousWavelet Transformation (CWT) method for extracting thesignals in the different frequency bands.
The second challenge is to find distinguishing features thatcan be used to uniquely identify an individual. In order tofind the unique patterns of each person we compute multiplefeatures from the CSI data. These features preserve both timeand frequency domain information of the CSI time series inorder to capture the effects of the gait patterns on an individual.However, given the dimension of the CSI data, the resultingfeature set is very large. We apply ReliefF, an efficient featureselection algorithm to rank the various features.
The third challenge is to segment the CSI time series data toextract the part of the signal which has the most pronouncedeffect due to the motion of the person, i.e. which correspondsto the effective region in Figure 1. We design a silence removalmethod which analyse the short time energy of the CSI timeseries data to determine the start and end points of the effectiveregion.
We conduct extensive experiments to evaluate performanceof WiFI-ID using 20 subjects in a scenario consistent withFigure 1. Our system can uniquely identify a person with anaverage accuracy from 93% to 77% from a group size of 2-6people, respectively.
The remaining paper is organised as follows. Section IIdiscuss the related work and introduce CSI in details inSection III. Section V shows the silence removal for movement
extractions. The signal separation is described in Section VI.Section VII introduces the feature extractions and hybridfeature selection approach. Section VIII shows SAC classi-fication. Section IX shows the implementation and compre-hensively evaluate the system. Section X concludes the paper.
II. RELATED WORK
Human identification has been researched for a decade. [23]and [22] all use video cameras to record people walking andextract patterns from images. [23] and [22] both capture thesilhouette of persons and extract the gait motions of personsfor identifications. While the above camera-based approachesachieve good accuracy in identifying individual’s they couldbe considered to be too intrusive (from the perspective ofprivacy) for use in offices and homes. Moreover, their resultsare dependent on good lighting conditions. Other works ex-ploit fingerprints [2], iris [13] or sclera [30] biometrics foridentifications. The accuracy of these approaches is higherthan using video cameras. However collecting biometric dataoften makes users uncomfortable and limit their applications.Moreover, several researchers have demonstrated that suchbiometric systems can faked [1]. [12] and [11] use wearablesensors and derive signatures that are unique to an individual’sactivity, which in turn can be used to identify people. However,these methods require that the sensors must be worn in aspecific manner to ensure accurate operations. Moreover, noteveryone is comfortable wearing such sensors on their body atall times. Our work is different in that it leverages the existingWiFi infrastructures for human identifications without the needfor additional sensors and intrusive monitoring.
Recently many works use wireless radio for human bodysensing. [16] considers the micro Doppler detected by radarsfor human gait recognitions. However the utilisation of radarsis limited due to high costs and regulations. [25], [29] and[24] utilise channel state information (CSI) reported fromWiFi cards for human activity recognition. Unlike RSSI whichprovides the coarse information about the received signalstrength, CSI data contain rich information from every wirelesssub-channels. Various human activities such as siting, walkingand running create unique perturbations in the CSI data andcan thus be used to recognise these activities [25]. In [29],the authors propose a CSI-speed model that establishes arelationship between the CSI variations and the speed ofhuman movement. CSI data has also be used to recognisehand gestures [19] and keystrokes [3] typed on a keyboard.Our work is a natural evolution of this prior work. We showfor the first time that CSI data can be used to uniquely identifyindividuals.
III. CHANNEL STATE INFORMATION
In this section, we provide a short overview of Channel StateInformation (CSI). Most modern off-the-shelf WiFi devicessupport the IEEE 802.11n/ac standard and typically includemultiple antennas for MIMO communications. These devicesoperate on both the 2.4GhZ and 5 Ghz bands and employOFDM at the PHY layer. The WiFi NICs continuously monitor
the frequency response of OFDM subcarriers as Channel StateInformation (CSI) [28]. Unlike RSSI that represent the totalreceived signal strength at the receiver, CSI contains informa-tion of individual subcarriers between each pair of transmitand receive antenna. Therefore the CSI can capture the effectsof multiple wireless phenomena such as frequency selectivefading, shadowing, multipath, destructive and constructiveinterference. The CSI information is very useful and can beused for improving the link quality of WiFi connections.
Let Nt and Nr represent the number of transmit and receiveantennas. Thus the MIMO system constitute Nt×Nr antennapairs. Let Y pi and Xp
i represent the frequency response forsubcarrier i and antenna pair p. Let Hp
i denote the ChannelFrequency Response (CFR) at any time instant. Then,
Y pi = Hpi ×X
pi i ∈ [1, C] p ∈ [1, Nt ×Nr] (1)
Hpi is a complex value and ‖Hp
i ‖ simplified as hpi denote itsamplitude. In this work we focus on amplitude. In our futurework, we plan to explore phase information. The time seriesof hpi are called CSI streams. The customised driver of theIntel 5300 NIC [5] which is used in our experiments reports30 OFDM subcarriers of 802.11n between each antenna pair(i.e. C = 30). Thus the total dimension of the CSI time seriesis 30×Nt ×Nr.
IV. OVERVIEW OF WIFI-ID
We consider the scenario depicted in Fig. 1 as the opera-tional setting for our system. Our system, WiFi-ID consists ofa transmitter (typically an AP) which periodically transmits(or are these broadcast) packets which are captured by areceiver which is capable of extracting the CSI informationas discussed in Section III. Our system has two operationalphases - training and testing. In each phase we ask the sameset of individuals to walk normally along the corridor (depictedin Section III) in a straight line by themselves. The CSI datacollected during the training phase is used to identify featuresthat are unique to each individuals’ gait, which in turn arestored in a database. The CSI data collected during the testingphase are processed in a similar manner to extract the same setof features which are then matched with those in the databaseto uniquely identify the test subjects.
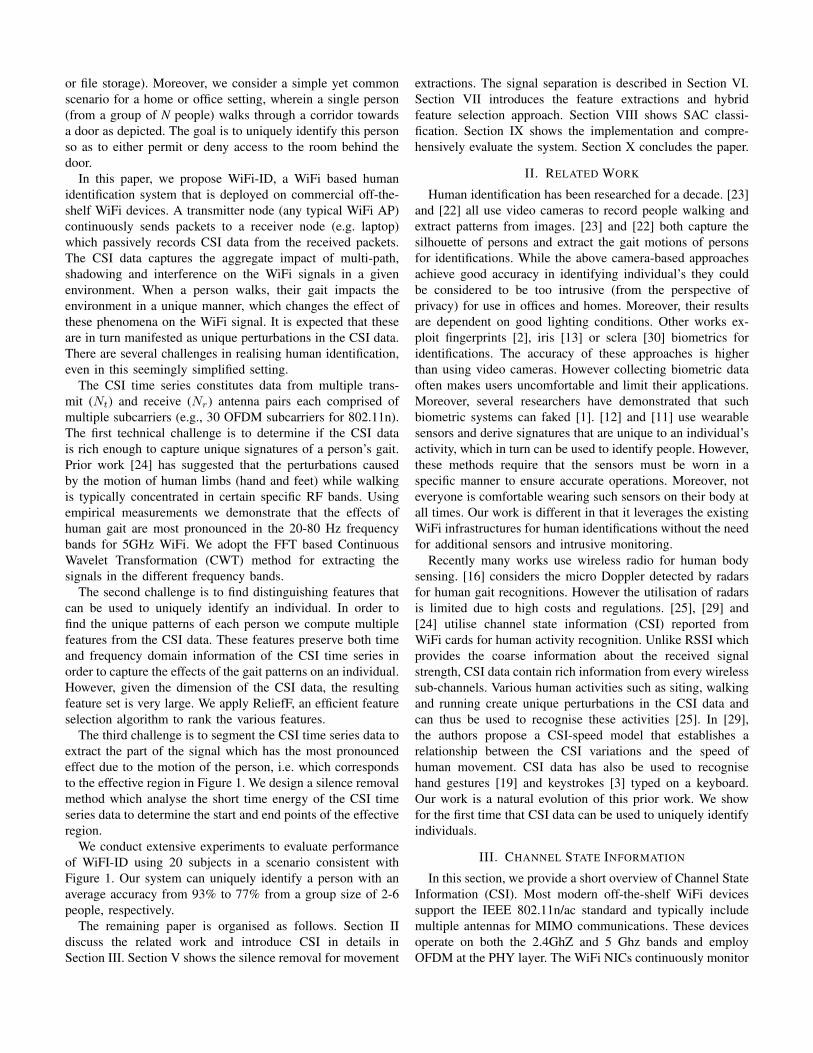
Fig. 2 depicts the basic building blocks of WiFi-ID. Inthe first step, WiFi-ID segments the CSI time series data toextract the portion of the signal which corresponds to theeffective region depicted in Section III. This portion of thesignal has the most pronounced impact of the human gaitand is thus most interesting to analyze. We employ a silenceremoval algorithm that uses the short time energy of the CSIsignal for this purpose (see Section V). As will be explainedin Section VI, we analyzed the CSI data to determine ifthe influence of the human gait is particularly pronouncedin specific frequency bands. Our investigation revealed thatthe CSI data in the 20 - 80 Hz frequency band for 5GHzWiFi contained the most unique features that are representativeof the individual’s gait (see Section IX). Hence, WiFi-IDemploys a signal separation module (see Section VI) that
uses Continuous Wavelet Transformation (CWT) to extractsignals in different frequency bands. Next, WiFi-ID usesthe RelieF feature selection algorithm to compute varioustime and frequency domain features from the CSI data inthe selected frequency bands (see Section VII). We use asubset of the feature set to represent the fingerprint of eachindividual. Finally, WiFi-ID uses Sparse Approximation basedClassification (SAC) to determine the identity of the subject(see Section VIII).
V. SILENCE REMOVAL AND SEGMENTATION
Note that, the transmitter and receiver in WiFi-ID areoperating continuously, i.e. the transmitter repeatedly sendspackets and the receiver extracts the CSI data from the receivedpackets. In the absence of people moving along the corridor,the CSI data will capture the effect of the ambient noise fromother RF transmissions in the vicinity. This data is not usefuland must be discarded. On the contrary, when a person walksalong the corridor, the corresponding CSI data is used foridentifying the individual. In particular, we are interested inthe CSI data that corresponds with the motion of the personin the effective region depicted in Fig. 1, since this wheretheir motion would have the most pronounced impact on theWiFi spectrum. There are two key challenges here. The firstchallenge is determining the length (or duration in terms oftime) of this effective region. If the region is set to be tooshort, then the corresponding CSI stream may not capturesufficient information that is representative of a person’s gait.On the other hand, if the region is too large, then the CSIstream will also include parts of the signal which are notimpacted by the human motion. We use the parameter T torepresent the duration of the effective region. In Section IX wecomprehensively evaluate the impact of varying the durationof T .
The second challenge is to determine the start point of theeffective region. An error in determining this will result inthe exclusion of some part of the useful signal that containsrepresentative information and instead include parts of the CSIstream that are not as meaningful. Observe from Fig. 1, that theCSI data does not exhibit abrupt changes as a person entersthe effective region. Hence, a simple thresholding approachis unlikely to work. Moreover, such a threshold may not beuniformly applicable to all people as each person may impactthe CSI data in a unique manner. In addition, such a thresholdmay not be robust to changing environmental conditions.
In the following, we outline our approach to addressingthese two challenges. Observe from Fig. 1 that when the per-son is directly crossing the LoS path between the transmitterand receiver, the impact of their motion is most pronouncedon the CSI data. We refer to this part of the effective region asthe central area. In our silence removal approach (outlined inAlgorithm 1), we aim to identify the approximate mid pointof this central area and then back track and determine thestart point of the effective region. As discussed in Section III,the CSI data consists of 30 × Nt × Nr streams all of whichexhibit similar perturbations due to the human motion. We
CSISourceData SilenceRemoval
ShadowEffects
MultipathEffects
SignalSeparation
FeatureExtraction
HumanIdentificationClassifier
ACC
CSISourceData
GaitMotionDatasets
ClassificationModel
BestFeatureSubsets
HumanIdentificationClassifier
HybridFeatureSelection
FeatureExtractionandSelection
HumanClassification
SignalSeparation Accuracy
Fig. 2. Overview of the WiFi-ID system.
select one arbitrary stream hpi . A Butterworth filter is appliedon hpi to remove the high frequency noise. Next, we partitionthe stream into short frames Sj of duration 0.05 seconds andcalculate the short time energy Ej for each frame. A medianfilter and log calculation are used to smooth the vector E,which represents the short time energy of all frames S. Theaverage value of E is determined and used as a threshold toidentify the central region. Precisely, a contiguous block offrames Smid, for which the energy of each frame is abovethe threshold is chosen. The portion of the original signalhpi that corresponds to the frames Smid is selected to be thecentral region, hmid. Next we determine the mid-point of thisregion, m, as the instantaneous signal which has the maximumdeviation form the average in hmid. Since the duration of theeffective region is T , the start point can be located at m−T/2.The selected CSI data of duration T , H, represents the datasetfrom one walking experiment.
Algorithm 1 Silence Removal1: Input: An arbitrary CSI stream hpi filtered by butterworth
and duration T2: partitioned into a sequence of frames Sj(n), j ∈ [1, Z],n ∈ [1, N ], where Z is the total number of frames, eachframe has N CSI values
3: for each frame j = 1 : Z do
4: Ej =1N
N∑n=1
|Sj(n)|2
5: end for6: E = log(MedianFilter(E))7: select Smid which Ej > mean(E) and map to hmid8: calculate the mid point m with maximum deviations and
the Start Point is m− T/2 in hpi9: apply Start Point to other CSI streams h
10: Output: One walk observation dataset H
VI. SIGNAL SEPARATION
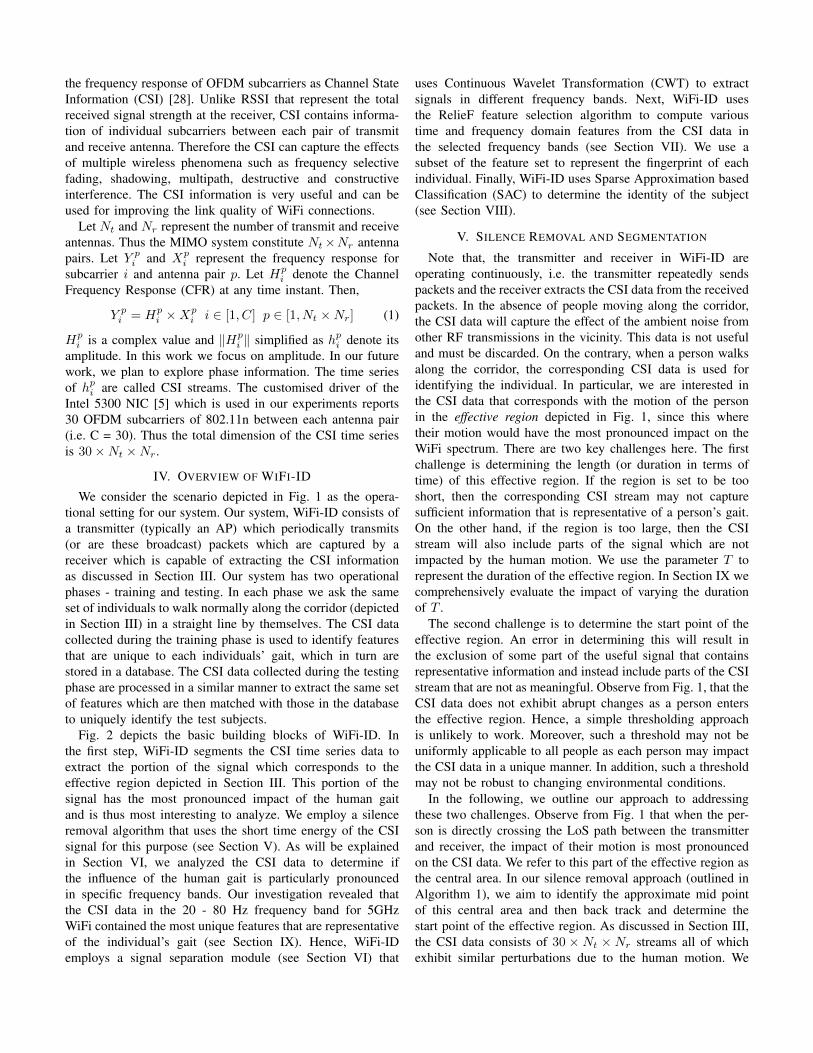
The output of the silence removal, H, corresponds to the CSIdata consisting of 30 × Nt × Nr time streams that capturesthe impact of a person walking through the effective region.In this section, we analyze H to understand how a person’sgait uniquely impacts the CSI signal. This will offer insightson how we can find distinguishing features that allow us touniquely identify an individual. To observe the signal energyin different frequency bands as a function of time, we plotthe spectrogram for walk observations from two differentpeople in Fig. 3. It is evident that the spectrograms have somesimilarities and differences at the same time. Both observationsexhibit strong energy in the low frequency bands (<30Hz)and lower energy in higher frequency bands (>100Hz). At the
Time (s)0.5 1 1.5 2 2.5 3 3.5
Freq
uenc
y (H
z)
0
10
20
30
40
50
60
70
80
90
100
Pow
er/F
requ
ency
(dB/
Hz)
-60
-50
-40
-30
-20
-10
0
(a) Spectrogram of 1st Person
Time (s)0.5 1 1.5 2 2.5 3 3.5
Freq
uenc
y (H
z)
0
10
20
30
40
50
60
70
80
90
100
Pow
er/F
requ
ency
(dB/
Hz)
-60
-50
-40
-30
-20
-10
0
(b) Spectrogram of 2nd Person
Fig. 3. Comparison between spectrograms of two persons.
same time, the first spectrogram appears to have more energy(i.e. more red regions) across all frequency bands compared tothe second. This initial investigation suggests that there maybe some merit to analyze the CSI data in different frequencybands.
The authors in [24] conducted experiments in a similarsetting as ours (i.e. Fig. 1) and demonstrated that there is acorrelation between the velocity of movement of human limbsand the frequency components of the CSI stream where theimpact of this motion is most pronounced. Specifically thefrequency is equal to the velocity of the motion divided byWiFi carrier wavelength. Prior work [21] has also shown thatdifferent parts of the human body exhibit different velocities.For example, the average velocity of human limbs (handsand legs) is around 2m/s whereas the human torso movesat approximately 1m/s. This suggest that the impact of aperson’s gait is likely to be most pronounced in a specificfrequency band of the CSI data, specifically the band thatmaps to velocities in the range of 1m/s to 2m/s. WiFi-IDuses the 5.18 Ghz band which has a wavelength of 5.79cm.The corresponding frequency band 20Hz - 80Hz is thusworth analyzing further. The above also suggests that higherfrequencies are unlikely contain any meaningful information
Time (s)0 1 2 3 4
CSI
Am
plitu
de
-10
-6
-2
2
6
10
(a) CSI Stream 20-80Hz.Time (s)
0 1 2 3 4
Freq
uenc
y (H
z)
0
10
20
30
40
50
60
70
80
Pow
er/F
requ
ency
(dB/
Hz)
-60
-50
-40
-30
-20
-10
0
(b) Spectrogram 20-80Hz.
Time (s)0 1 2 3 4
CSI
Am
plitu
de
-10
-6
-2
2
6
10
(c) CSI Stream 0-20Hz.Time (s)
0 1 2 3 4
Freq
uenc
y (H
z)
0
10
20
30
40
50
60
70
80
Pow
er/F
requ
ency
(dB/
Hz)
-60
-50
-40
-30
-20
-10
0
(d) Spectrogram 0-20Hz.
Time (s)0 1 2 3 4
CSI
Am
plitu
de
-10
-6
-2
2
6
10
(e) CSI Stream 0-80Hz.Time (s)
0 1 2 3 4
Freq
uenc
y (H
z)
0
10
20
30
40
50
60
70
80
Pow
er/F
requ
ency
(dB/
Hz)
-60
-50
-40
-30
-20
-10
0
(f) Spectrogram 0-80Hz.
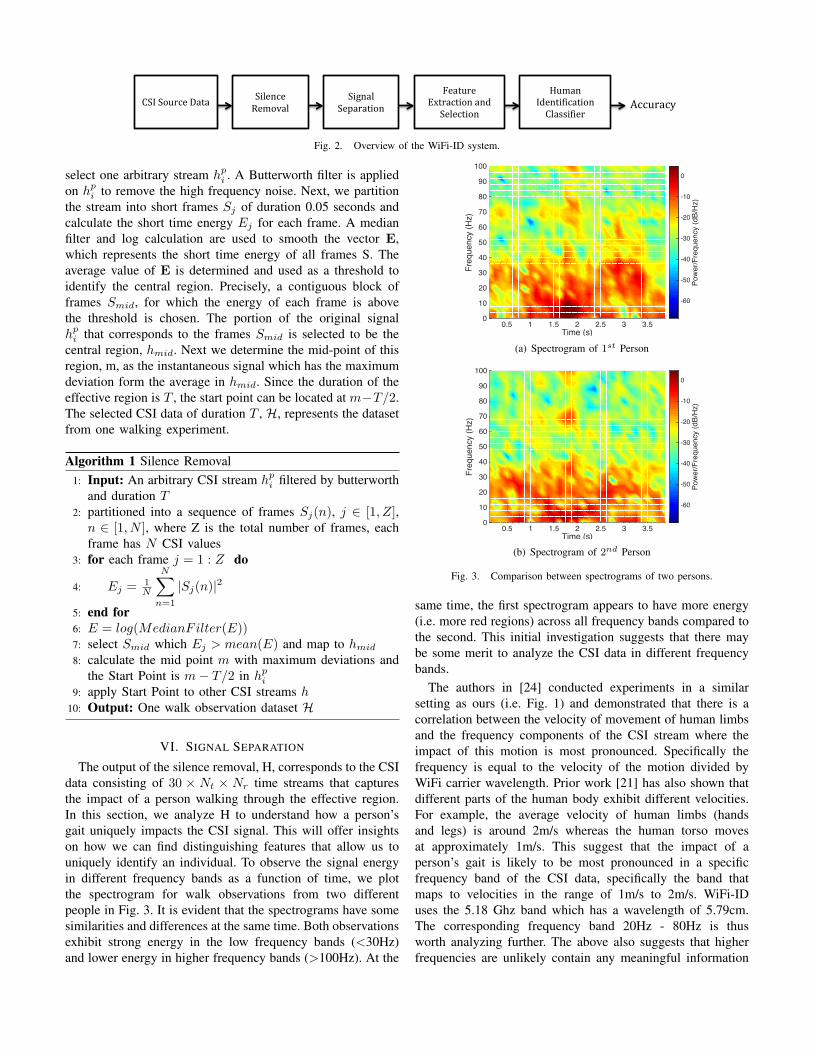
Fig. 4. The three frequency bands of interest. (a)(c)(e) illustrate the CSIstream and (b)(d)(f) show the spectrograms.
representative of human motion. This is also evident from thespectrograms in Fig. 3. Hence, we exclude the frequenciesabove 80Hz.
Prior work [4] has shown that the human body can bemodelled as a conducting cylinder when studying its impacton the WiFi spectrum. When a person walks across the centralarea (in Fig. 1) and crosses the direct LoS between thetransmitter and receiver, the WiFi spectrum is influenced by amixture of multipath and shadowing effects. This is manifestedby the strong energy observed in the lower frequency bands(<20Hz) as observed in Fig. 3. Thus, the low frequency bandof 0-20Hz is also worth investigating further.
In summary, we consider two specific frequency bands forfurther investigation - (i) 20-80Hz and (ii) 0-20 Hz in orderto determine which part of the signal is most likely to exhibitdistinguishing features specific to an individual’s gait. We alsoinclude the combined 0-80Hz frequency band as a baseline.
In order to separate these signals WiFi-ID use FFT basedContinuous Wavelet Transformation (CWT) [20] and Morletwavelet [7] to transform CSI streams into wavelet domain.WiFi-ID then applies Inverse CWT to restore the selectedsignal in particular frequency bands. Compared with ShortTime Fourier Transform(STFT) [26], CWT is more effectivein restoring highly varying signals such as impulse and peaks.
Feature NamesMean Max Min Skew Kurt Var EntroEnergyPeaksCross
Wei
ghts
-0.04
-0.02
0
0.02
0.04
0.06
0.08
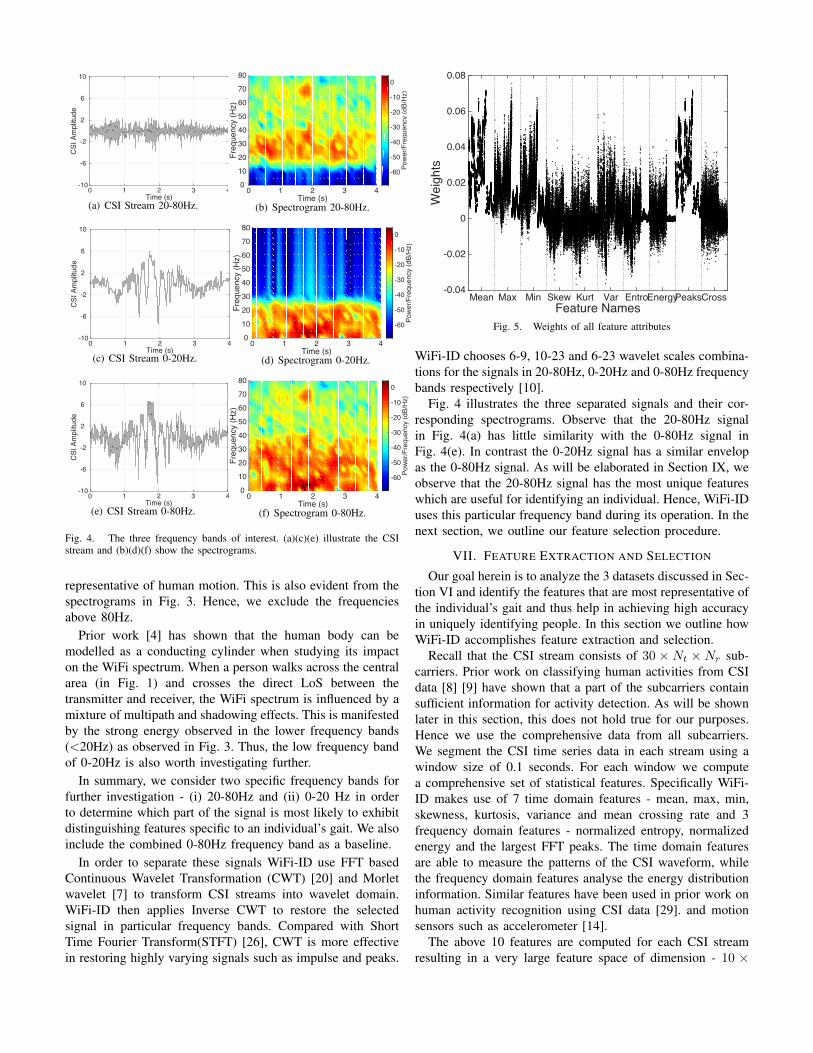
Fig. 5. Weights of all feature attributes
WiFi-ID chooses 6-9, 10-23 and 6-23 wavelet scales combina-tions for the signals in 20-80Hz, 0-20Hz and 0-80Hz frequencybands respectively [10].
Fig. 4 illustrates the three separated signals and their cor-responding spectrograms. Observe that the 20-80Hz signalin Fig. 4(a) has little similarity with the 0-80Hz signal inFig. 4(e). In contrast the 0-20Hz signal has a similar envelopas the 0-80Hz signal. As will be elaborated in Section IX, weobserve that the 20-80Hz signal has the most unique featureswhich are useful for identifying an individual. Hence, WiFi-IDuses this particular frequency band during its operation. In thenext section, we outline our feature selection procedure.
VII. FEATURE EXTRACTION AND SELECTION
Our goal herein is to analyze the 3 datasets discussed in Sec-tion VI and identify the features that are most representative ofthe individual’s gait and thus help in achieving high accuracyin uniquely identifying people. In this section we outline howWiFi-ID accomplishes feature extraction and selection.
Recall that the CSI stream consists of 30 × Nt × Nr sub-carriers. Prior work on classifying human activities from CSIdata [8] [9] have shown that a part of the subcarriers containsufficient information for activity detection. As will be shownlater in this section, this does not hold true for our purposes.Hence we use the comprehensive data from all subcarriers.We segment the CSI time series data in each stream using awindow size of 0.1 seconds. For each window we computea comprehensive set of statistical features. Specifically WiFi-ID makes use of 7 time domain features - mean, max, min,skewness, kurtosis, variance and mean crossing rate and 3frequency domain features - normalized entropy, normalizedenergy and the largest FFT peaks. The time domain featuresare able to measure the patterns of the CSI waveform, whilethe frequency domain features analyse the energy distributioninformation. Similar features have been used in prior work onhuman activity recognition using CSI data [29]. and motionsensors such as accelerometer [14].
The above 10 features are computed for each CSI streamresulting in a very large feature space of dimension - 10 ×
30 × Nt × Nr × T/0.1. For example, if T = 4 seconds,then we have 108000 feature attributes. Using the entirefeature set for classification is obviously very time consuming.Moreover, not all features may be useful for classificationpurposes and may thus introduce noise. Hence, we employfeature selection to identify the most useful features that arepertinent for uniquely identifying an individual. We adoptReliefF, an efficient feature selection algorithm [18]. ReliefFis a filter-based feature selection method with a low-orderpolynomial time complexity. In our context, ReliefF estimatesthe qualities of feature attributes, represented by a weight,based on how well they distinguish multiple individuals. Thefeature attributes with high weights are selected and used forclassification.
Fig. 5 shows the feature weights from the 20-80 Hz datasetof one individual. The y-axis represents the weights while thex-axis represents the feature categories. Each category consistsof 30×Nt×Nr×T/t points, corresponding to the total numberof streams. We observe that the FFT peaks and mean generallyhave higher weights than the other features. Moreover, thetime domain features tend to have higher weights that thefrequency domain features. It is also evident from Fig. 5that different sub-carriers have high weights across differentfeature categories. This confirms that the impact of the gaitis manifested in varying degree by all sub-carriers. This lendscredence to our earlier argument a subset of carriers are notsufficient for identifying distinct features. Next, we rank theweights of all attributes in descending order and select the topR percentage of features. In Section IX we comprehensivelyevaluate the impact of R on the detection accuracy.
VIII. CLASSIFICATION
In this section we outline the classification algorithm em-ployed in WiFi-ID. In [27], Wright et.al. proposed SparseApproximation based Classification (SAC) for face recognitionand showed that it is robust to noisy features due to the usageof `1 minimisation. Even though WiFi-ID employs featureselection to find representative features, it was shown in Fig.5that generally all features have low weights, which suggeststhat they may include some ineffective information. Hence,we chose to use SAC as the classifier.
To model human identification as a sparse representationproblem, we first build a dictionary containing the featuresselected in the previous section. Consider the scenario wherewe wish to identify a person that belongs to a group ofn people. Assume that we have l walking observations perperson as training samples which collected in training phaseof the system. Each walking observation is a p dimensionalfeature vector which are the R percentage features discussedin the previous section. We assemble the feature vectors ofi-th person in a p × l sub-dictionary Fi. The feature datasetsof n people can be compiled to form a p× ln dictionary F =[F1, ..., Fi, ..., Fn] i ∈ [1, n]. Let β denotes a test sample (i.e. anew walk observation) from one of the people from this group.It can be represented by the following linear equation β = Fα,where α is an unknown coefficient vector. If β belongs to the
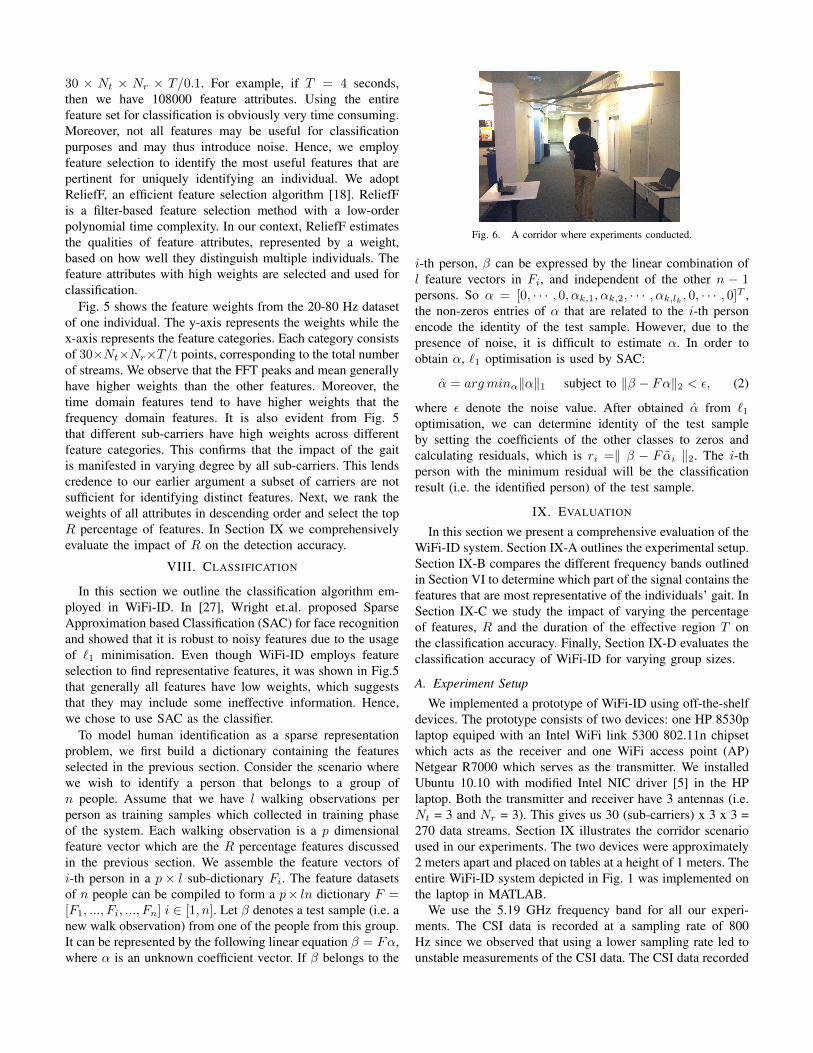
Fig. 6. A corridor where experiments conducted.
i-th person, β can be expressed by the linear combination ofl feature vectors in Fi, and independent of the other n − 1persons. So α = [0, · · · , 0, αk,1, αk,2, · · · , αk,lk , 0, · · · , 0]T ,the non-zeros entries of α that are related to the i-th personencode the identity of the test sample. However, due to thepresence of noise, it is difficult to estimate α. In order toobtain α, `1 optimisation is used by SAC:
α = argminα‖α‖1 subject to ‖β − Fα‖2 < ε, (2)
where ε denote the noise value. After obtained α from `1optimisation, we can determine identity of the test sampleby setting the coefficients of the other classes to zeros andcalculating residuals, which is ri =‖ β − Fαi ‖2. The i-thperson with the minimum residual will be the classificationresult (i.e. the identified person) of the test sample.
IX. EVALUATION
In this section we present a comprehensive evaluation of theWiFi-ID system. Section IX-A outlines the experimental setup.Section IX-B compares the different frequency bands outlinedin Section VI to determine which part of the signal contains thefeatures that are most representative of the individuals’ gait. InSection IX-C we study the impact of varying the percentageof features, R and the duration of the effective region T onthe classification accuracy. Finally, Section IX-D evaluates theclassification accuracy of WiFi-ID for varying group sizes.
A. Experiment Setup
We implemented a prototype of WiFi-ID using off-the-shelfdevices. The prototype consists of two devices: one HP 8530plaptop equiped with an Intel WiFi link 5300 802.11n chipsetwhich acts as the receiver and one WiFi access point (AP)Netgear R7000 which serves as the transmitter. We installedUbuntu 10.10 with modified Intel NIC driver [5] in the HPlaptop. Both the transmitter and receiver have 3 antennas (i.e.Nt = 3 and Nr = 3). This gives us 30 (sub-carriers) x 3 x 3 =270 data streams. Section IX illustrates the corridor scenarioused in our experiments. The two devices were approximately2 meters apart and placed on tables at a height of 1 meters. Theentire WiFi-ID system depicted in Fig. 1 was implemented onthe laptop in MATLAB.
We use the 5.19 GHz frequency band for all our experi-ments. The CSI data is recorded at a sampling rate of 800Hz since we observed that using a lower sampling rate led tounstable measurements of the CSI data. The CSI data recorded
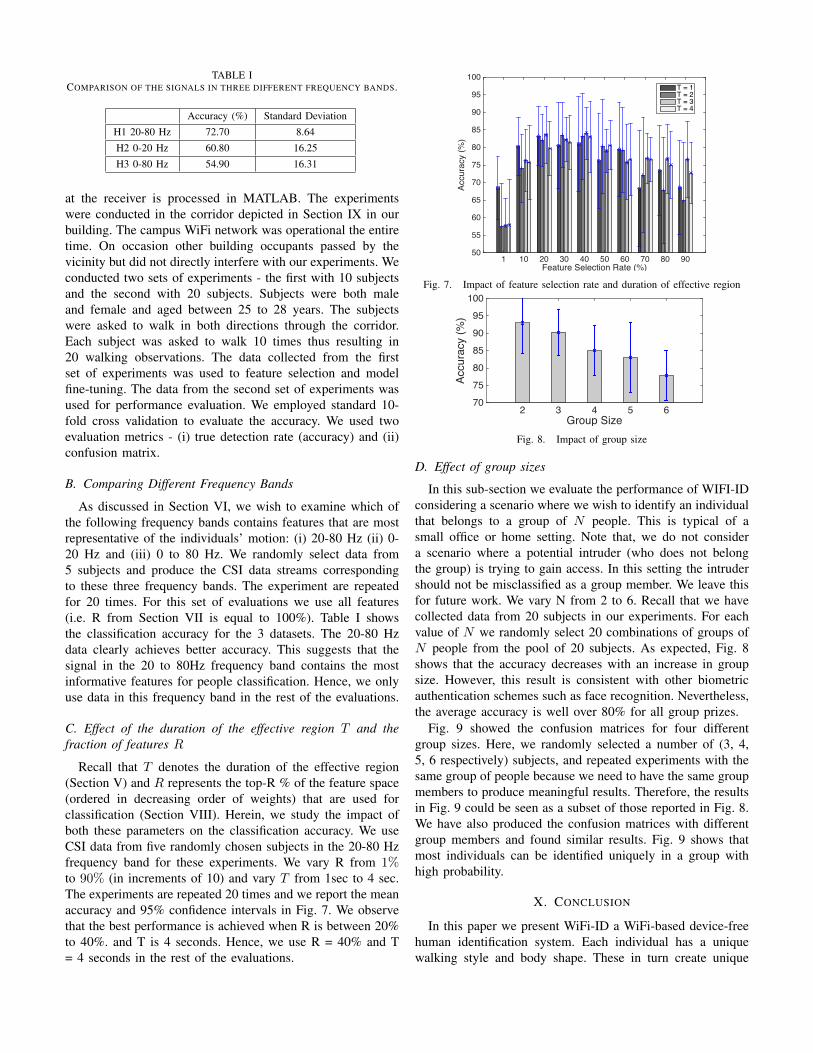
TABLE ICOMPARISON OF THE SIGNALS IN THREE DIFFERENT FREQUENCY BANDS.
Accuracy (%) Standard Deviation
H1 20-80 Hz 72.70 8.64
H2 0-20 Hz 60.80 16.25
H3 0-80 Hz 54.90 16.31
at the receiver is processed in MATLAB. The experimentswere conducted in the corridor depicted in Section IX in ourbuilding. The campus WiFi network was operational the entiretime. On occasion other building occupants passed by thevicinity but did not directly interfere with our experiments. Weconducted two sets of experiments - the first with 10 subjectsand the second with 20 subjects. Subjects were both maleand female and aged between 25 to 28 years. The subjectswere asked to walk in both directions through the corridor.Each subject was asked to walk 10 times thus resulting in20 walking observations. The data collected from the firstset of experiments was used to feature selection and modelfine-tuning. The data from the second set of experiments wasused for performance evaluation. We employed standard 10-fold cross validation to evaluate the accuracy. We used twoevaluation metrics - (i) true detection rate (accuracy) and (ii)confusion matrix.
B. Comparing Different Frequency Bands
As discussed in Section VI, we wish to examine which ofthe following frequency bands contains features that are mostrepresentative of the individuals’ motion: (i) 20-80 Hz (ii) 0-20 Hz and (iii) 0 to 80 Hz. We randomly select data from5 subjects and produce the CSI data streams correspondingto these three frequency bands. The experiment are repeatedfor 20 times. For this set of evaluations we use all features(i.e. R from Section VII is equal to 100%). Table I showsthe classification accuracy for the 3 datasets. The 20-80 Hzdata clearly achieves better accuracy. This suggests that thesignal in the 20 to 80Hz frequency band contains the mostinformative features for people classification. Hence, we onlyuse data in this frequency band in the rest of the evaluations.
C. Effect of the duration of the effective region T and thefraction of features R
Recall that T denotes the duration of the effective region(Section V) and R represents the top-R % of the feature space(ordered in decreasing order of weights) that are used forclassification (Section VIII). Herein, we study the impact ofboth these parameters on the classification accuracy. We useCSI data from five randomly chosen subjects in the 20-80 Hzfrequency band for these experiments. We vary R from 1%to 90% (in increments of 10) and vary T from 1sec to 4 sec.The experiments are repeated 20 times and we report the meanaccuracy and 95% confidence intervals in Fig. 7. We observethat the best performance is achieved when R is between 20%to 40%. and T is 4 seconds. Hence, we use R = 40% and T= 4 seconds in the rest of the evaluations.
Feature Selection Rate (%)1 10 20 30 40 50 60 70 80 90
Accu
racy
(%)
50
55
60
65
70
75
80
85
90
95
100T = 1T = 2T = 3T = 4
Fig. 7. Impact of feature selection rate and duration of effective region
Group Size2 3 4 5 6
Accu
racy
(%)
707580859095
100
Fig. 8. Impact of group size
D. Effect of group sizes
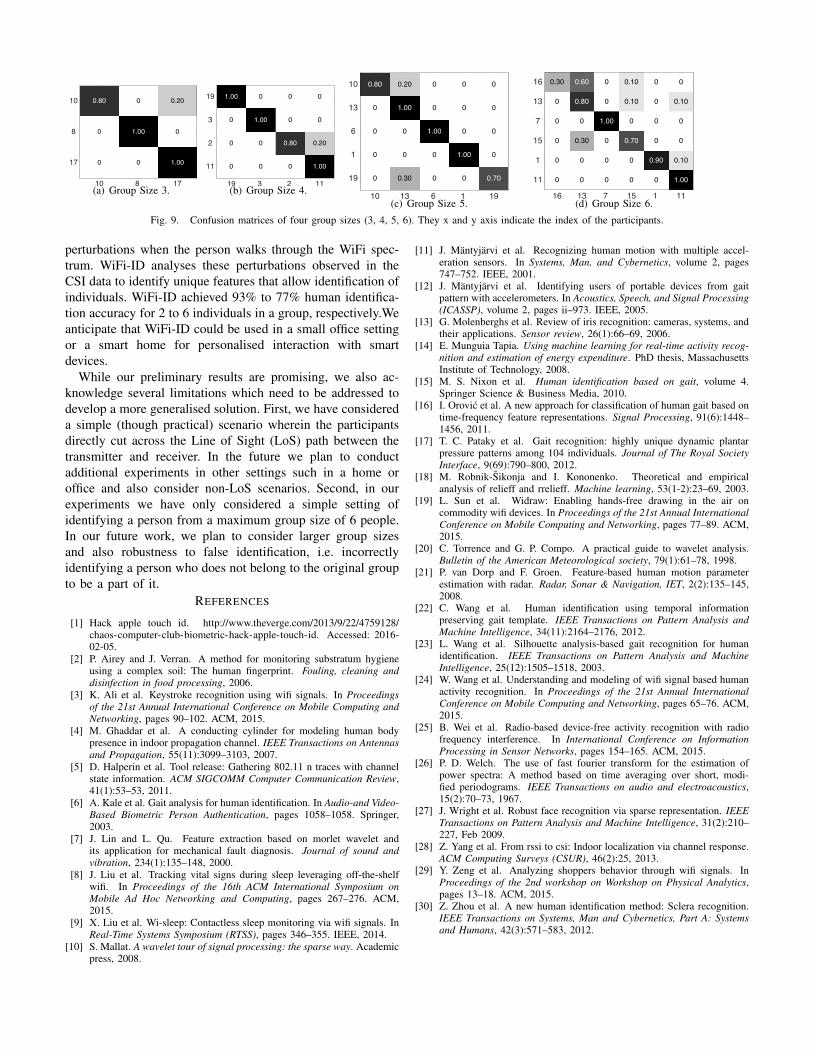
In this sub-section we evaluate the performance of WIFI-IDconsidering a scenario where we wish to identify an individualthat belongs to a group of N people. This is typical of asmall office or home setting. Note that, we do not considera scenario where a potential intruder (who does not belongthe group) is trying to gain access. In this setting the intrudershould not be misclassified as a group member. We leave thisfor future work. We vary N from 2 to 6. Recall that we havecollected data from 20 subjects in our experiments. For eachvalue of N we randomly select 20 combinations of groups ofN people from the pool of 20 subjects. As expected, Fig. 8shows that the accuracy decreases with an increase in groupsize. However, this result is consistent with other biometricauthentication schemes such as face recognition. Nevertheless,the average accuracy is well over 80% for all group prizes.
Fig. 9 showed the confusion matrices for four differentgroup sizes. Here, we randomly selected a number of (3, 4,5, 6 respectively) subjects, and repeated experiments with thesame group of people because we need to have the same groupmembers to produce meaningful results. Therefore, the resultsin Fig. 9 could be seen as a subset of those reported in Fig. 8.We have also produced the confusion matrices with differentgroup members and found similar results. Fig. 9 shows thatmost individuals can be identified uniquely in a group withhigh probability.
X. CONCLUSION
In this paper we present WiFi-ID a WiFi-based device-freehuman identification system. Each individual has a uniquewalking style and body shape. These in turn create unique
0.80
0
0
0
1.00
0
0.20
0
1.00
10 8 17
10
8
17
(a) Group Size 3.
1.00
0
0
0
0
1.00
0
0
0
0
0.80
0
0
0
0.20
1.00
19 3 2 11
19
3
2
11
(b) Group Size 4.
0.80
0
0
0
0
0.20
1.00
0
0
0.30
0
0
1.00
0
0
0
0
0
1.00
0
0
0
0
0
0.70
10 13 6 1 19
10
13
6
1
19
(c) Group Size 5.
0.30
0
0
0
0
0
0.60
0.80
0
0.30
0
0
0
0
1.00
0
0
0
0.10
0.10
0
0.70
0
0
0
0
0
0
0.90
0
0
0.10
0
0
0.10
1.00
16 13 7 15 1 11
16
13
7
15
1
11
(d) Group Size 6.
Fig. 9. Confusion matrices of four group sizes (3, 4, 5, 6). They x and y axis indicate the index of the participants.
perturbations when the person walks through the WiFi spec-trum. WiFi-ID analyses these perturbations observed in theCSI data to identify unique features that allow identification ofindividuals. WiFi-ID achieved 93% to 77% human identifica-tion accuracy for 2 to 6 individuals in a group, respectively.Weanticipate that WiFi-ID could be used in a small office settingor a smart home for personalised interaction with smartdevices.
While our preliminary results are promising, we also ac-knowledge several limitations which need to be addressed todevelop a more generalised solution. First, we have considereda simple (though practical) scenario wherein the participantsdirectly cut across the Line of Sight (LoS) path between thetransmitter and receiver. In the future we plan to conductadditional experiments in other settings such in a home oroffice and also consider non-LoS scenarios. Second, in ourexperiments we have only considered a simple setting ofidentifying a person from a maximum group size of 6 people.In our future work, we plan to consider larger group sizesand also robustness to false identification, i.e. incorrectlyidentifying a person who does not belong to the original groupto be a part of it.
REFERENCES
[1] Hack apple touch id. http://www.theverge.com/2013/9/22/4759128/chaos-computer-club-biometric-hack-apple-touch-id. Accessed: 2016-02-05.
[2] P. Airey and J. Verran. A method for monitoring substratum hygieneusing a complex soil: The human fingerprint. Fouling, cleaning anddisinfection in food processing, 2006.
[3] K. Ali et al. Keystroke recognition using wifi signals. In Proceedingsof the 21st Annual International Conference on Mobile Computing andNetworking, pages 90–102. ACM, 2015.
[4] M. Ghaddar et al. A conducting cylinder for modeling human bodypresence in indoor propagation channel. IEEE Transactions on Antennasand Propagation, 55(11):3099–3103, 2007.
[5] D. Halperin et al. Tool release: Gathering 802.11 n traces with channelstate information. ACM SIGCOMM Computer Communication Review,41(1):53–53, 2011.
[6] A. Kale et al. Gait analysis for human identification. In Audio-and Video-Based Biometric Person Authentication, pages 1058–1058. Springer,2003.
[7] J. Lin and L. Qu. Feature extraction based on morlet wavelet andits application for mechanical fault diagnosis. Journal of sound andvibration, 234(1):135–148, 2000.
[8] J. Liu et al. Tracking vital signs during sleep leveraging off-the-shelfwifi. In Proceedings of the 16th ACM International Symposium onMobile Ad Hoc Networking and Computing, pages 267–276. ACM,2015.
[9] X. Liu et al. Wi-sleep: Contactless sleep monitoring via wifi signals. InReal-Time Systems Symposium (RTSS), pages 346–355. IEEE, 2014.
[10] S. Mallat. A wavelet tour of signal processing: the sparse way. Academicpress, 2008.
[11] J. Mantyjarvi et al. Recognizing human motion with multiple accel-eration sensors. In Systems, Man, and Cybernetics, volume 2, pages747–752. IEEE, 2001.
[12] J. Mantyjarvi et al. Identifying users of portable devices from gaitpattern with accelerometers. In Acoustics, Speech, and Signal Processing(ICASSP), volume 2, pages ii–973. IEEE, 2005.
[13] G. Molenberghs et al. Review of iris recognition: cameras, systems, andtheir applications. Sensor review, 26(1):66–69, 2006.
[14] E. Munguia Tapia. Using machine learning for real-time activity recog-nition and estimation of energy expenditure. PhD thesis, MassachusettsInstitute of Technology, 2008.
[15] M. S. Nixon et al. Human identification based on gait, volume 4.Springer Science & Business Media, 2010.
[16] I. Orovic et al. A new approach for classification of human gait based ontime-frequency feature representations. Signal Processing, 91(6):1448–1456, 2011.
[17] T. C. Pataky et al. Gait recognition: highly unique dynamic plantarpressure patterns among 104 individuals. Journal of The Royal SocietyInterface, 9(69):790–800, 2012.
[18] M. Robnik-Sikonja and I. Kononenko. Theoretical and empiricalanalysis of relieff and rrelieff. Machine learning, 53(1-2):23–69, 2003.
[19] L. Sun et al. Widraw: Enabling hands-free drawing in the air oncommodity wifi devices. In Proceedings of the 21st Annual InternationalConference on Mobile Computing and Networking, pages 77–89. ACM,2015.
[20] C. Torrence and G. P. Compo. A practical guide to wavelet analysis.Bulletin of the American Meteorological society, 79(1):61–78, 1998.
[21] P. van Dorp and F. Groen. Feature-based human motion parameterestimation with radar. Radar, Sonar & Navigation, IET, 2(2):135–145,2008.
[22] C. Wang et al. Human identification using temporal informationpreserving gait template. IEEE Transactions on Pattern Analysis andMachine Intelligence, 34(11):2164–2176, 2012.
[23] L. Wang et al. Silhouette analysis-based gait recognition for humanidentification. IEEE Transactions on Pattern Analysis and MachineIntelligence, 25(12):1505–1518, 2003.
[24] W. Wang et al. Understanding and modeling of wifi signal based humanactivity recognition. In Proceedings of the 21st Annual InternationalConference on Mobile Computing and Networking, pages 65–76. ACM,2015.
[25] B. Wei et al. Radio-based device-free activity recognition with radiofrequency interference. In International Conference on InformationProcessing in Sensor Networks, pages 154–165. ACM, 2015.
[26] P. D. Welch. The use of fast fourier transform for the estimation ofpower spectra: A method based on time averaging over short, modi-fied periodograms. IEEE Transactions on audio and electroacoustics,15(2):70–73, 1967.
[27] J. Wright et al. Robust face recognition via sparse representation. IEEETransactions on Pattern Analysis and Machine Intelligence, 31(2):210–227, Feb 2009.
[28] Z. Yang et al. From rssi to csi: Indoor localization via channel response.ACM Computing Surveys (CSUR), 46(2):25, 2013.
[29] Y. Zeng et al. Analyzing shoppers behavior through wifi signals. InProceedings of the 2nd workshop on Workshop on Physical Analytics,pages 13–18. ACM, 2015.
[30] Z. Zhou et al. A new human identification method: Sclera recognition.IEEE Transactions on Systems, Man and Cybernetics, Part A: Systemsand Humans, 42(3):571–583, 2012.