Embed Size (px)
Citation preview
William H. FreyThe Brookings Institution
Hispanics and the Changing Racial Demographics
of the Intermountain West
www.frey-demographer.org
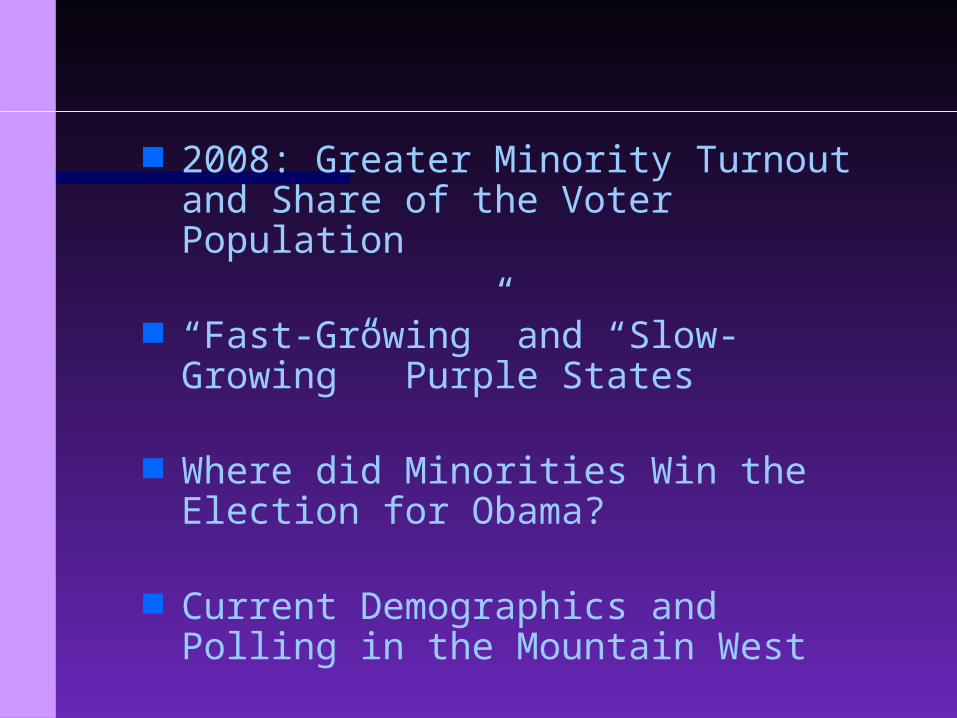
2008: Greater Minority Turnout and Share of the Voter Population
“Fast-Growing” and “Slow-Growing” Purple States
Where did Minorities Win the Election for Obama?
Current Demographics and Polling in the Mountain West
Source: William H. Frey analysis of National Election Poll and VNS
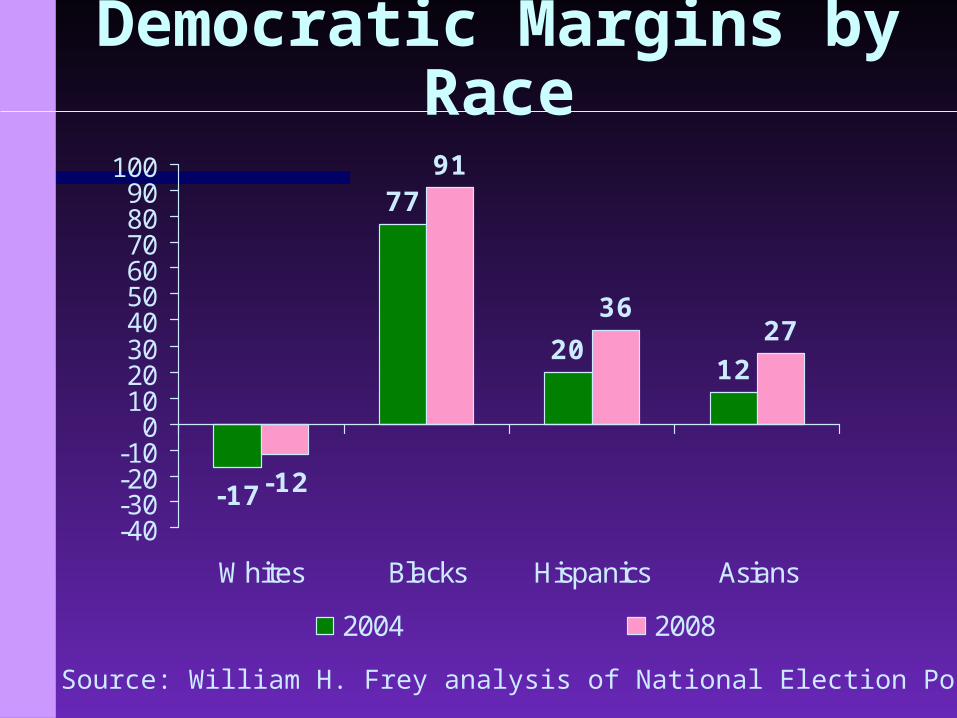
Democratic Margins by Race
-17
77
2012
-12
91
3627
-40-30-20-10
0102030405060708090
100
Whites Blacks Hispanics Asians
2004 2008
Source: William H. Frey analysis of CPS November 2004, 2008 supplements
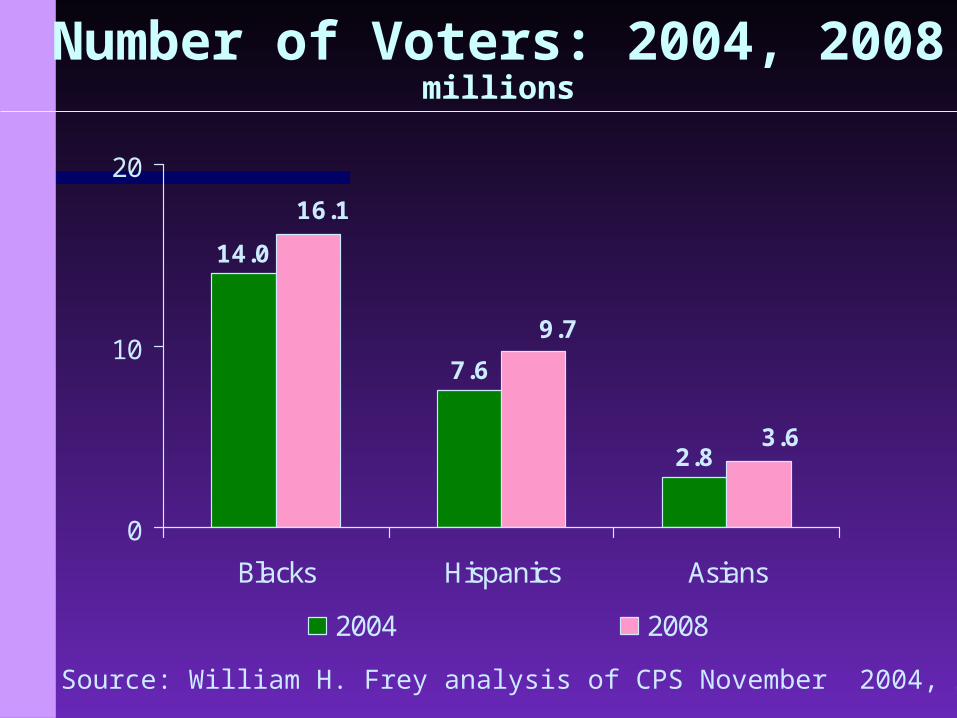
Number of Voters: 2004, 2008millions
7.6
2.8
14.0
9.7
3.6
16.1
0
10
20
Blacks Hispanics Asians
2004 2008
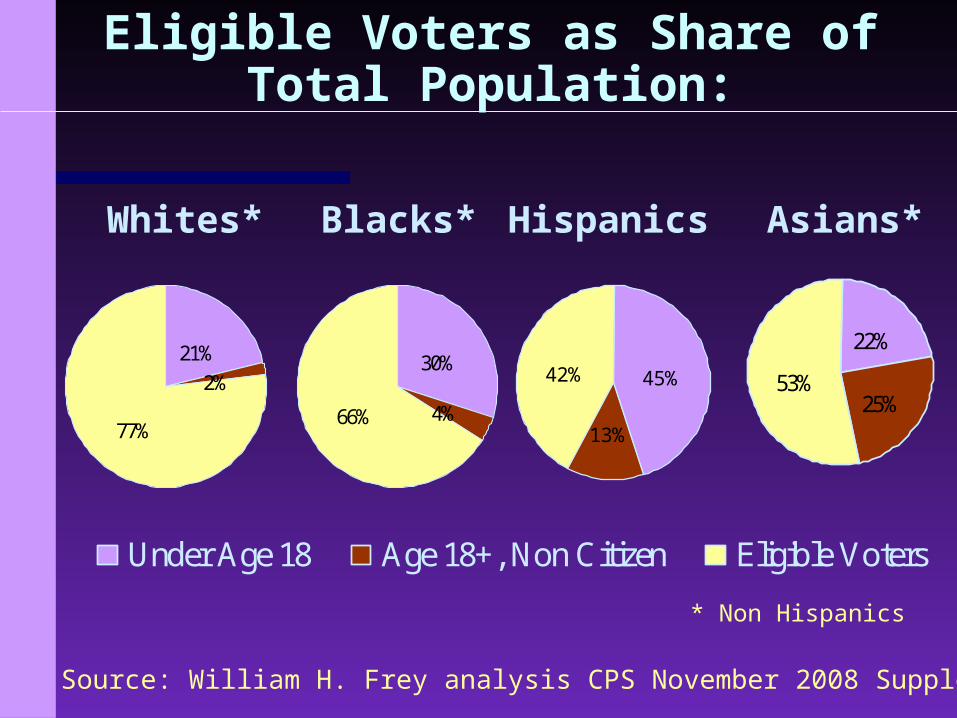
22%
25%53%
Under Age 18 Age 18+, Non Citizen Eligible Voters
Source: William H. Frey analysis CPS November 2008 Supplement
Eligible Voters as Share of Total Population:
* Non Hispanics
30%
66% 4%
45%42%
13%
Whites* Blacks* Hispanics Asians*
21%
77%
2%
Source: William H. Frey analysis of CPS November 2004, 2008 supplements
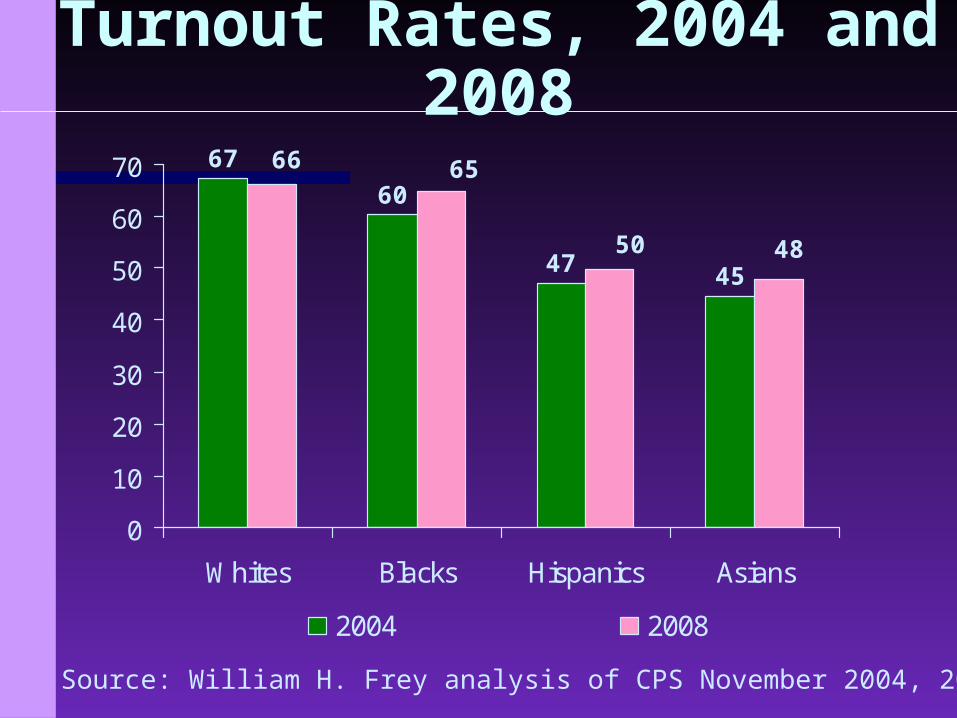
Turnout Rates, 2004 and 2008
60
47 45
67 65
50 48
66
0
10
20
30
40
50
60
70
Whites Blacks Hispanics Asians
2004 2008
Source: Lopez and Taylor, Pew Hispanic Center, 2009
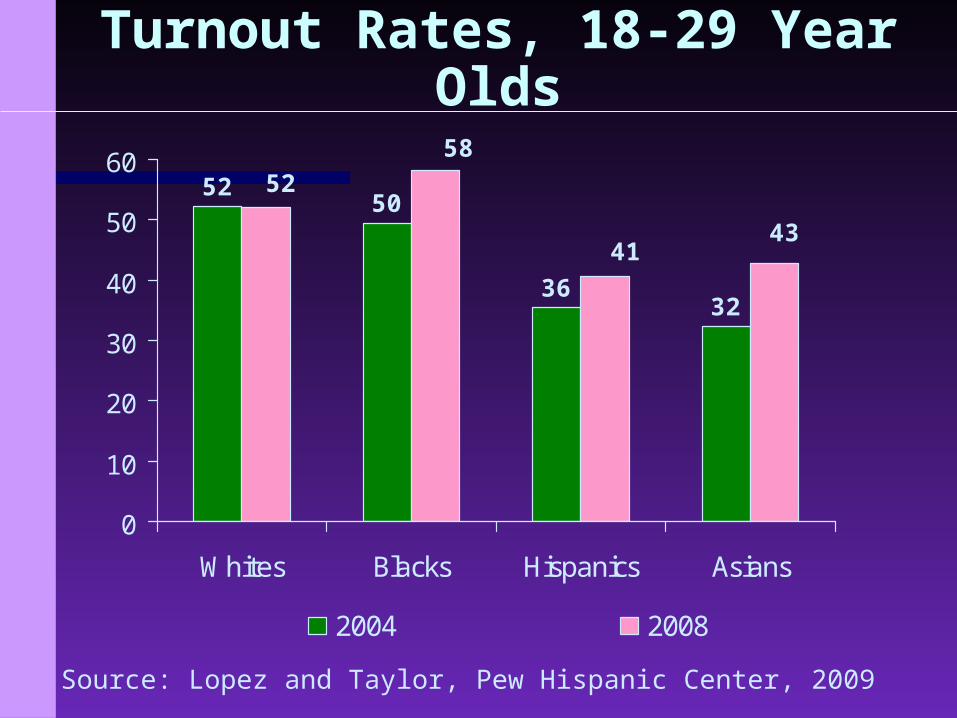
Turnout Rates, 18-29 Year Olds
50
3632
52
58
4143
52
0
10
20
30
40
50
60
Whites Blacks Hispanics Asians
2004 2008
Source: William H. Frey analysis of CPS November 2004, 2008 supplements
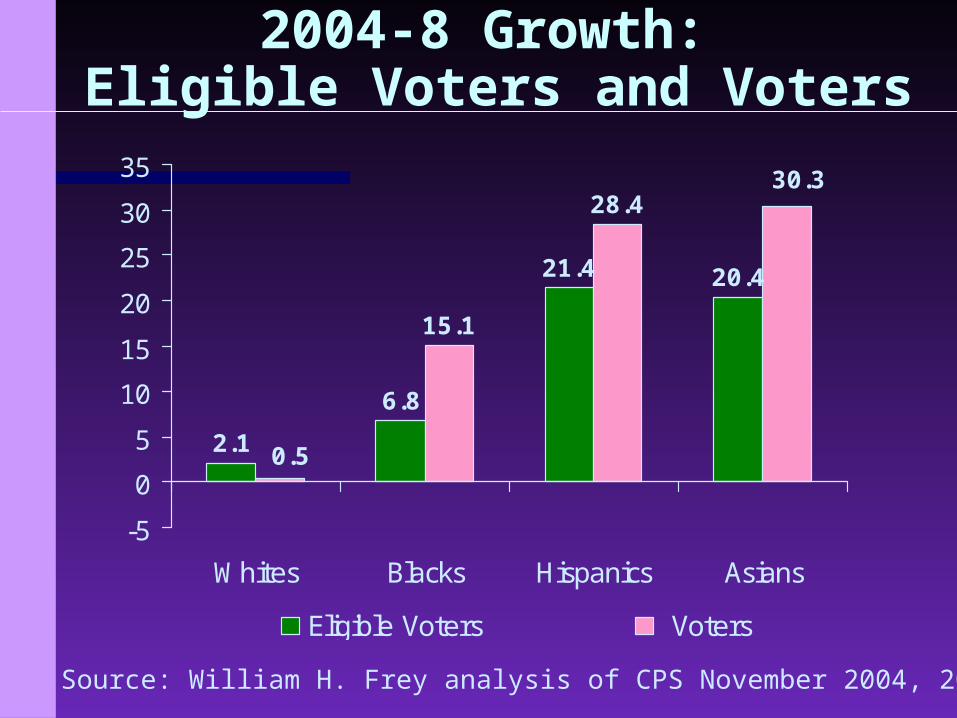
2004-8 Growth: Eligible Voters and Voters
2.1
6.8
21.4 20.4
15.1
28.4
0.5
30.3
-5
0
5
10
15
20
25
30
35
Whites Blacks Hispanics Asians
Eligible Voters Voters
Source: William H. Frey analysis of CPS November supplements
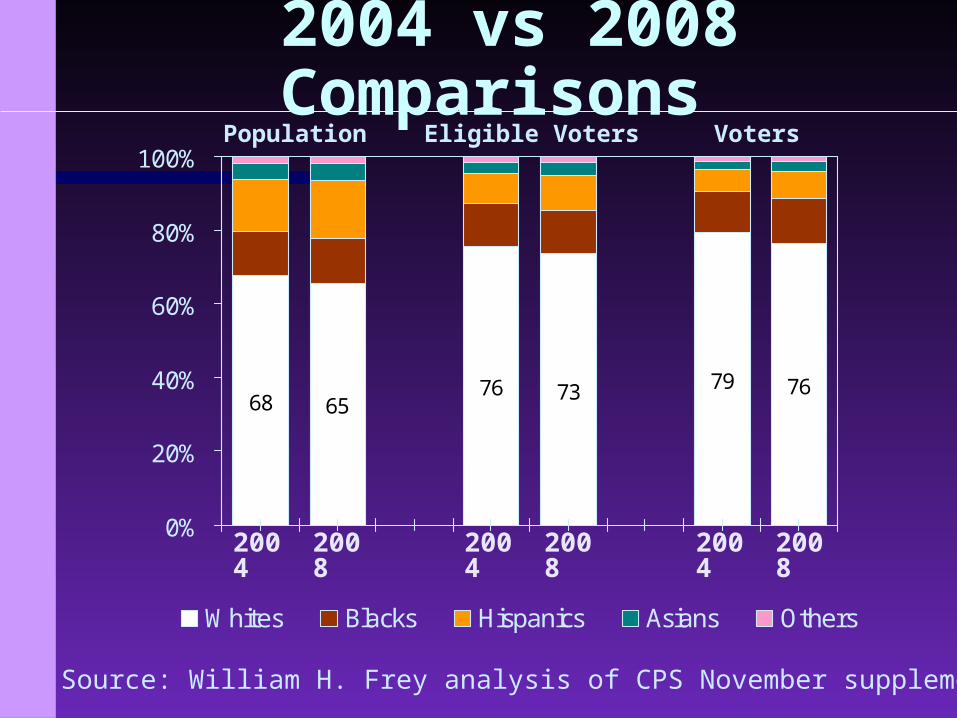
2004 vs 2008 Comparisons
68 6576 73 79 76
0%
20%
40%
60%
80%
100%
Whites Blacks Hispanics Asians Others
Population Eligible Voters Voters
2004
2008
2004
2008
2004
2008
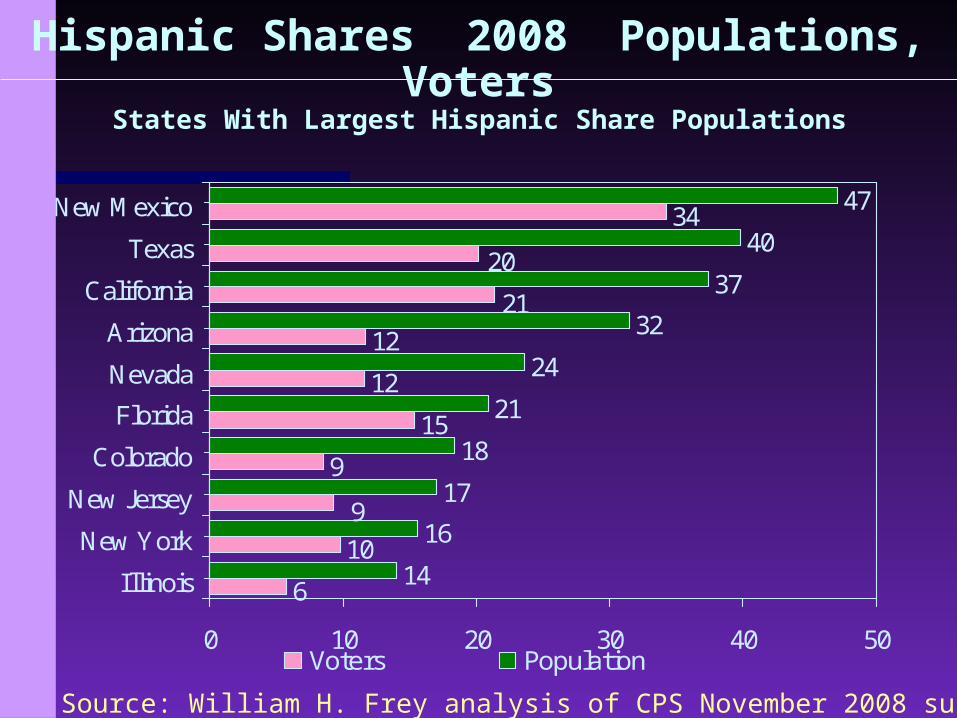
6
10
9
15
12
12
34
14
16
17
18
21
24
32
37
40
47
9
20
21
0 10 20 30 40 50
Illinois
New York
New Jersey
Colorado
Florida
Nevada
Arizona
California
Texas
New Mexico
Voters Population
Source: William H. Frey analysis of CPS November 2008 supplement
Hispanic Shares 2008 Populations, Voters
States With Largest Hispanic Share Populations
Source: William H. Frey analysis
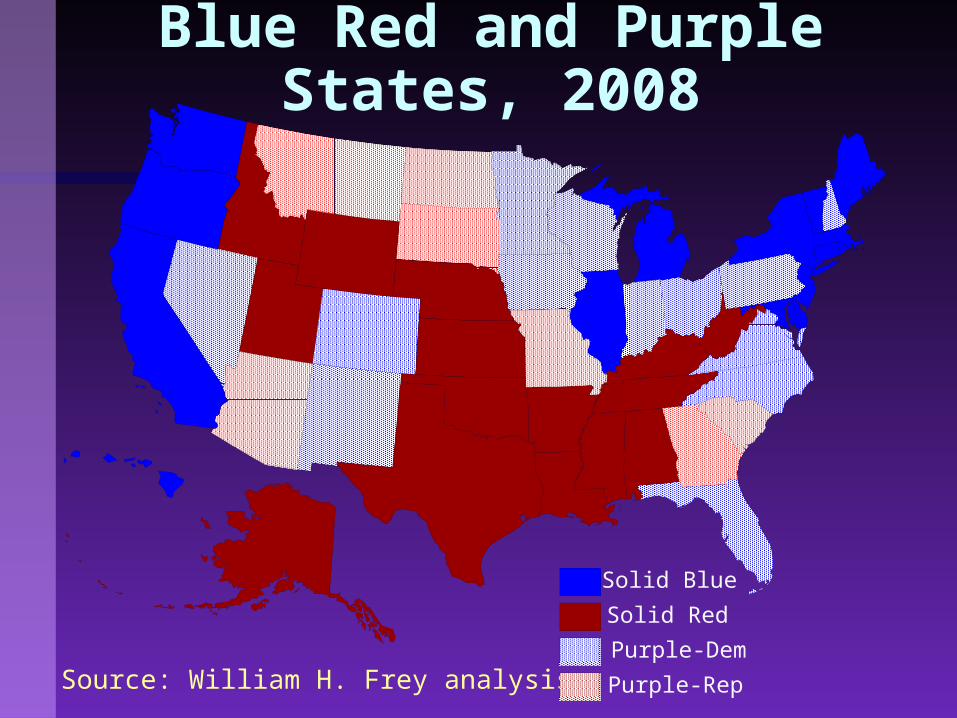
Blue Red and Purple States, 2008
Solid Blue
Solid Red
Purple-Dem
Purple-Rep
Source: William H. Frey analysis
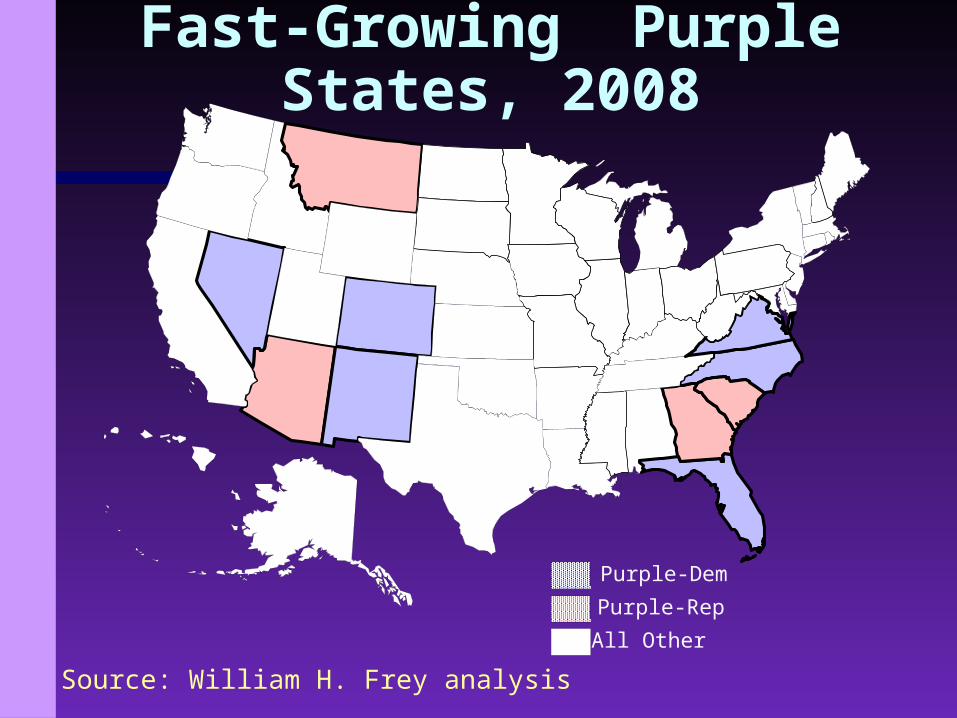
Fast-Growing Purple States, 2008
Purple-Dem
Purple-Rep
All Other
Source: William H. Frey analysis
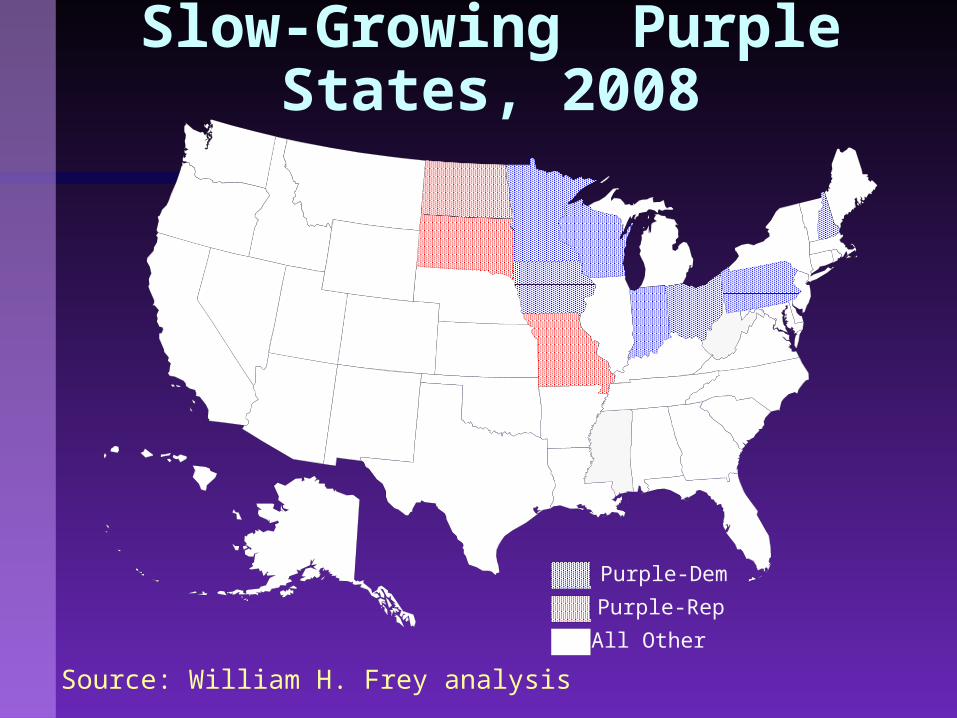
Slow-Growing Purple States, 2008
Purple-Dem
Purple-Rep
All Other
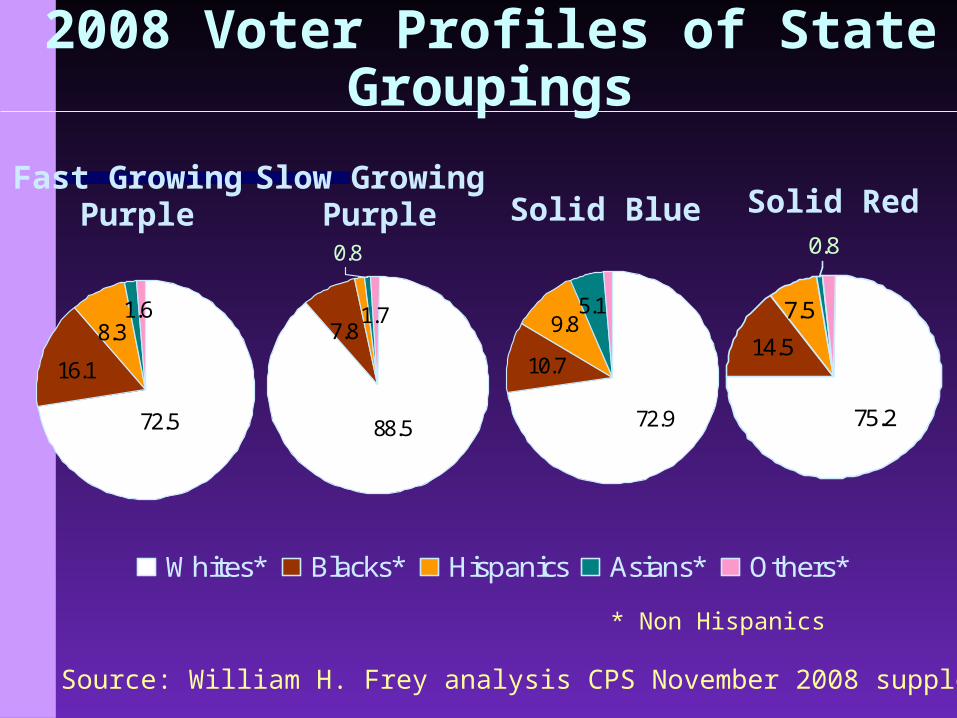
75.2
0.8
7.5
14.5
Whites* Blacks* Hispanics Asians* Others*
88.5
0.8
7.81.7
Source: William H. Frey analysis CPS November 2008 supplement
2008 Voter Profiles of State Groupings
* Non Hispanics
Fast Growing Purple Solid Red
72.5
1.68.3
16.1
72.9
5.1
10.7
9.8
Slow Growing Purple Solid Blue
Source: William H. Frey analysis of CPS November 2004, 2008 supplements
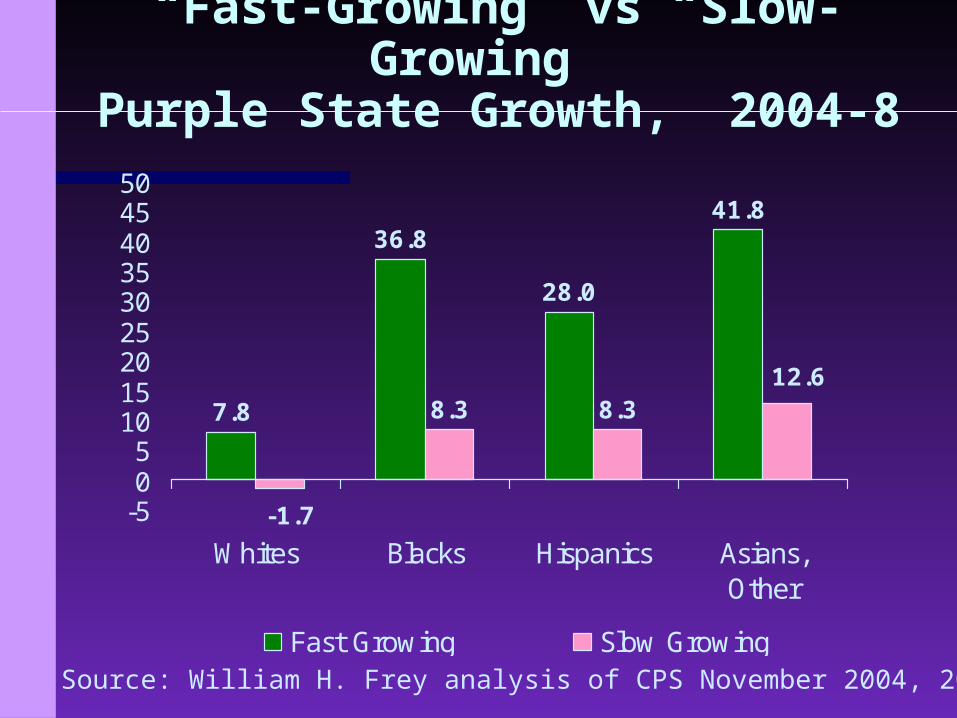
“Fast-Growing” vs “Slow-Growing”
Purple State Growth, 2004-8
7.8
36.8
28.0
41.8
8.3 8.3
-1.7
12.6
-505
101520253035404550
Whites Blacks Hispanics Asians,Other
Fast Growing Slow Growing
Source: William H. Frey analysis of CPS November Supplements
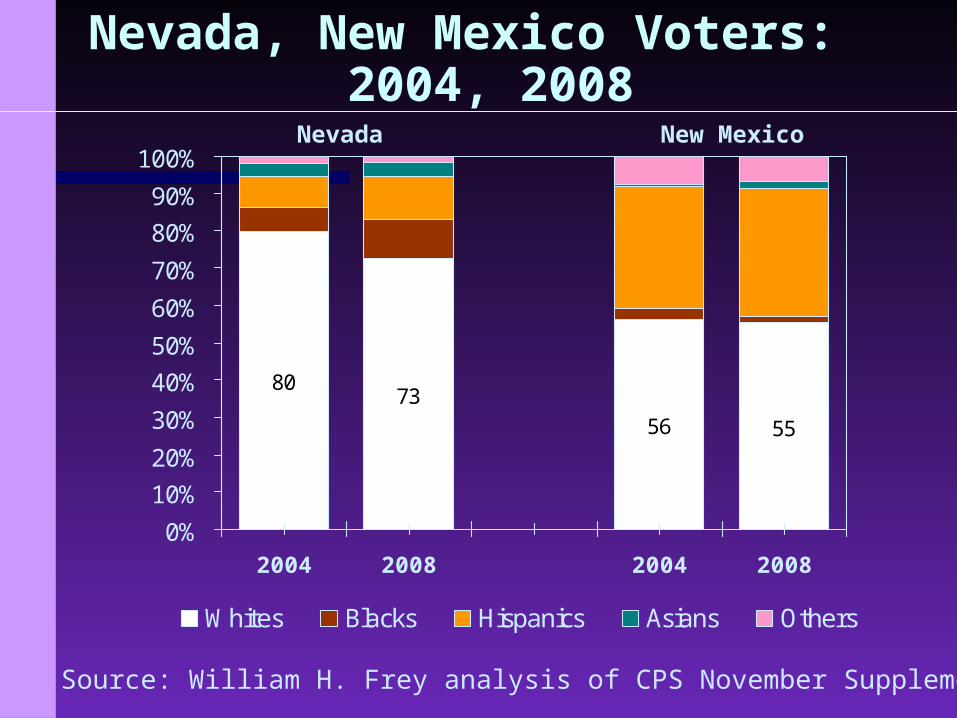
Nevada, New Mexico Voters: 2004, 2008
8073
56 55
0%
10%
20%
30%
40%
50%
60%
70%
80%
90%
100%
2004 2008 2004 2008
Whites Blacks Hispanics Asians Others
Nevada New Mexico
Source: William H. Frey analysis of National Election Poll and VNS
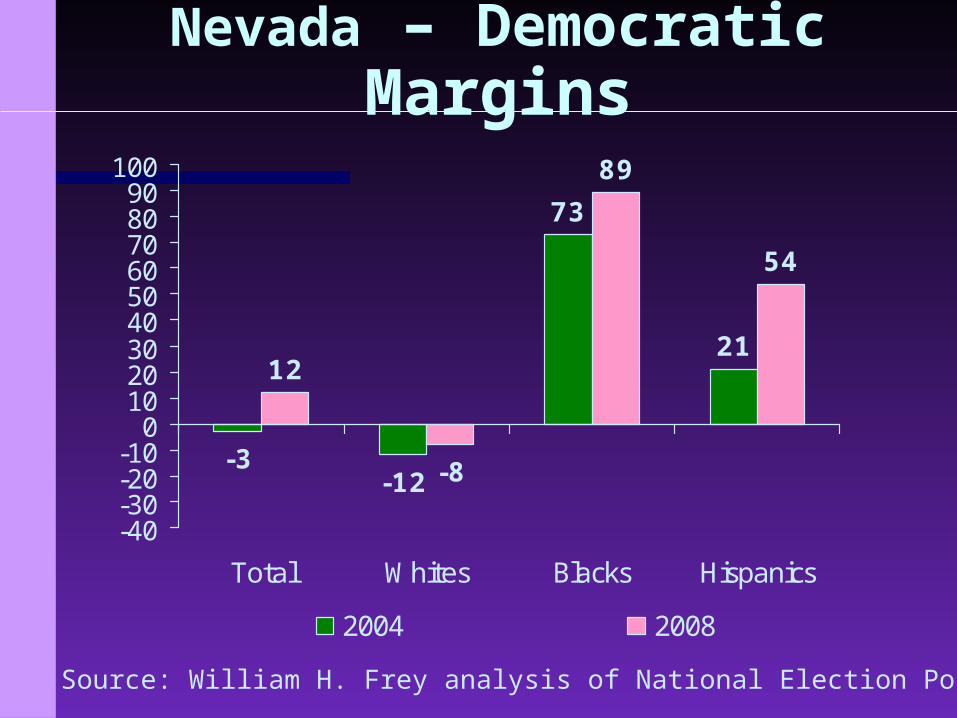
Nevada – Democratic Margins
-3-12
73
2112
-8
89
54
-40-30-20-10
0102030405060708090
100
Total Whites Blacks Hispanics
2004 2008
Source: William H. Frey analysis of National Election Poll and VNS
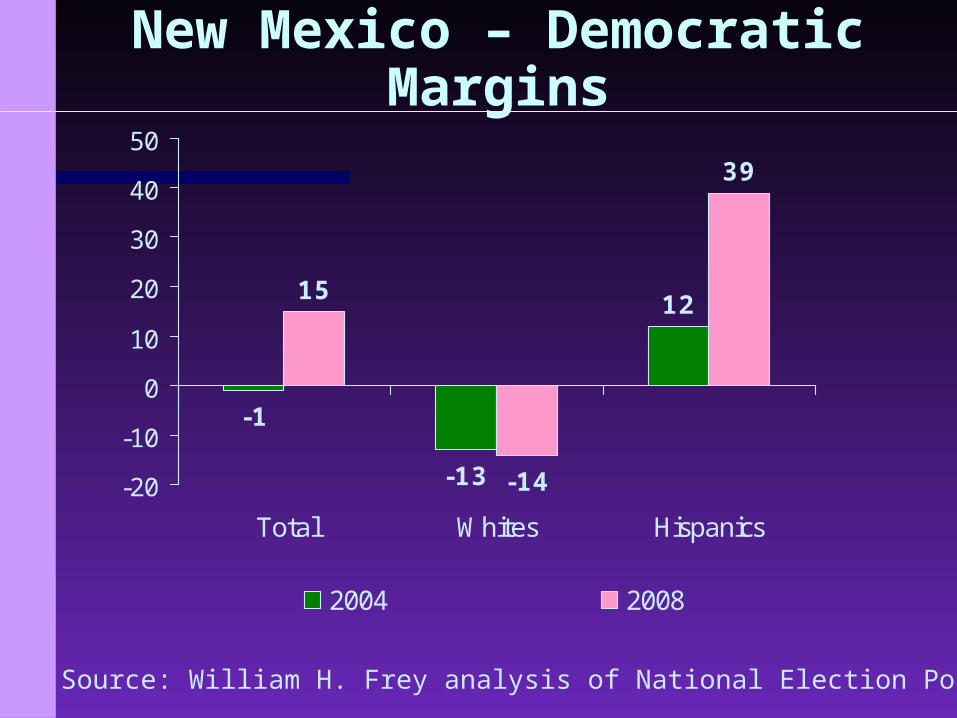
New Mexico – Democratic Margins
-1
-13
1215
-14
39
-20
-10
0
10
20
30
40
50
Total Whites Hispanics
2004 2008
Source: William H. Frey analysis of CPS November Supplements
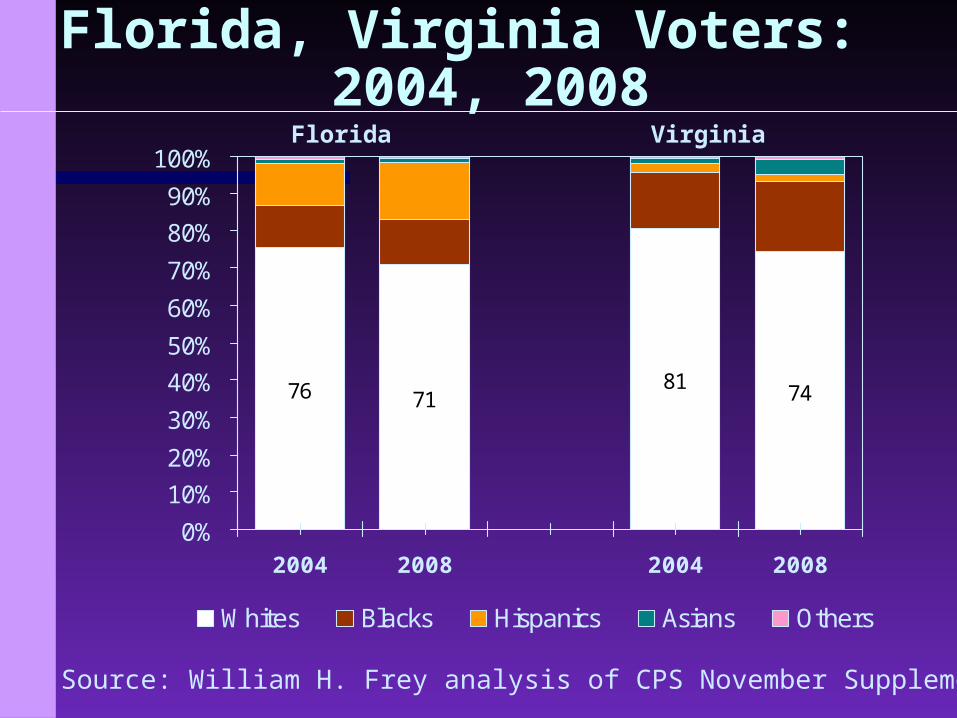
Florida, Virginia Voters: 2004, 2008
76 7181 74
0%
10%
20%
30%
40%
50%
60%
70%
80%
90%
100%
2004 2008 2004 2008
Whites Blacks Hispanics Asians Others
VirginiaFlorida
Source: William H. Frey analysis of National Election Poll and VNS
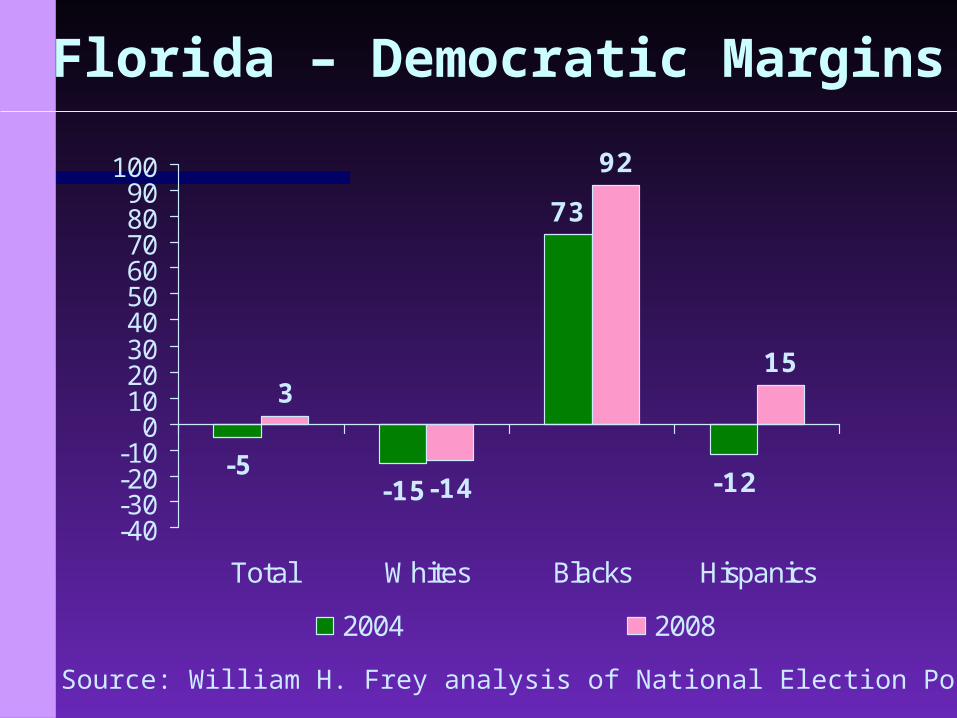
Florida – Democratic Margins
-5-15
73
-12
3
-14
92
15
-40-30-20-10
0102030405060708090
100
Total Whites Blacks Hispanics
2004 2008
Source: William H. Frey analysis of National Election Poll and VNS
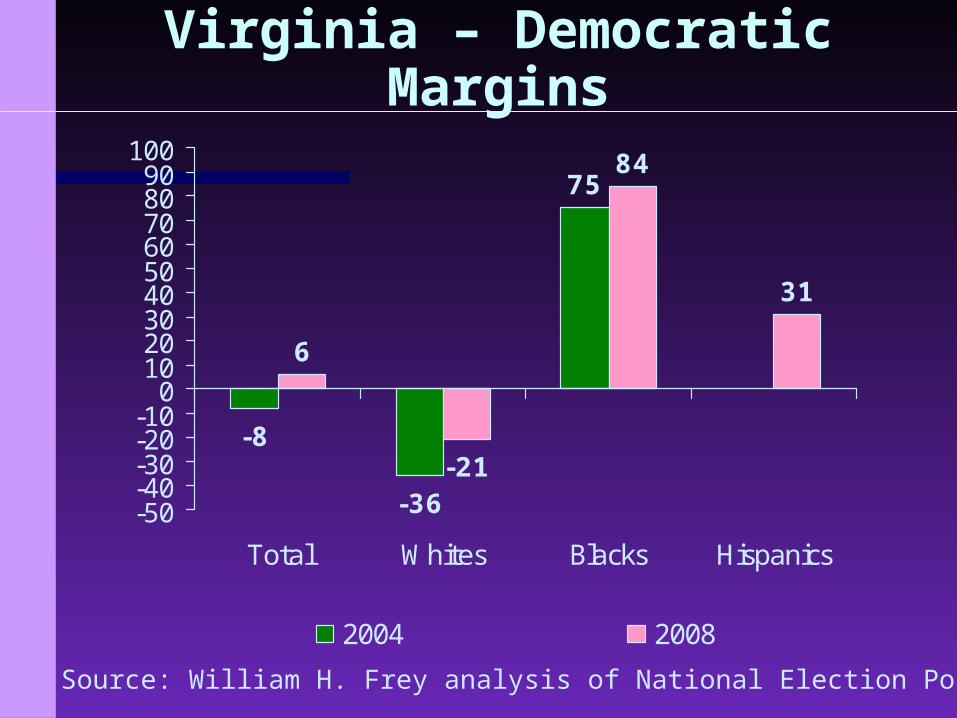
Virginia – Democratic Margins
-8
-36
75
6
-21
84
31
-50-40-30-20-10
0102030405060708090
100
Total Whites Blacks Hispanics
2004 2008
Source: William H. Frey analysis of CPS November Supplements
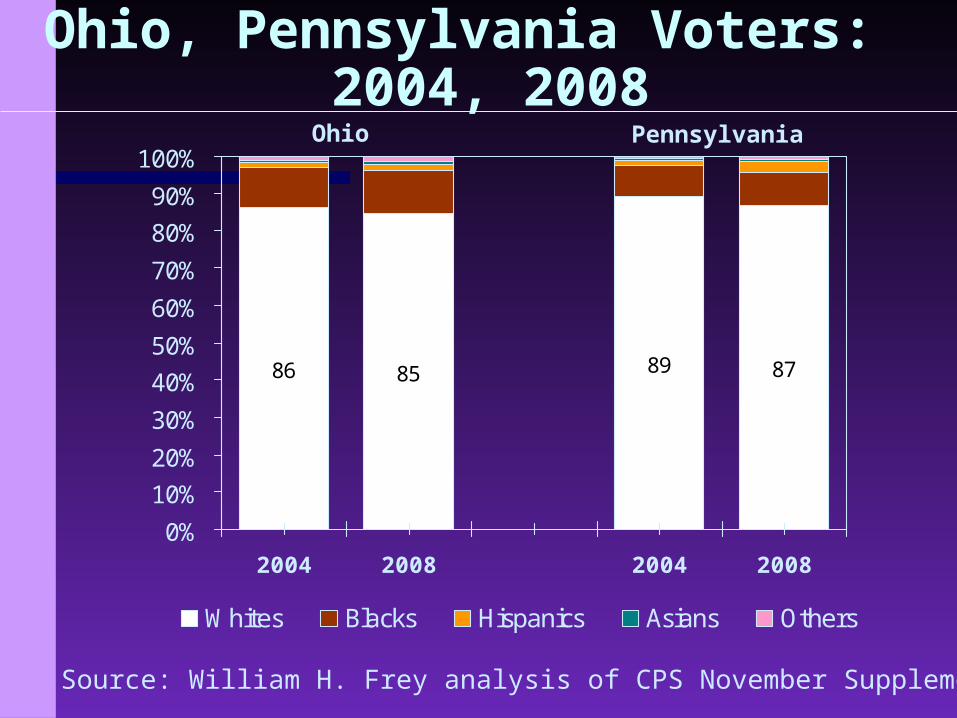
Ohio, Pennsylvania Voters: 2004, 2008
86 85 89 87
0%
10%
20%
30%
40%
50%
60%
70%
80%
90%
100%
2004 2008 2004 2008
Whites Blacks Hispanics Asians Others
PennsylvaniaOhio

Source: William H. Frey analysis of National Election Poll and VNS
Ohio – Democratic Margins
-2-12
68
5
-6
95
-20-10
0102030405060708090
100
Total Whites Blacks
2004 2008
Source: William H. Frey analysis of National Election Poll and VNS
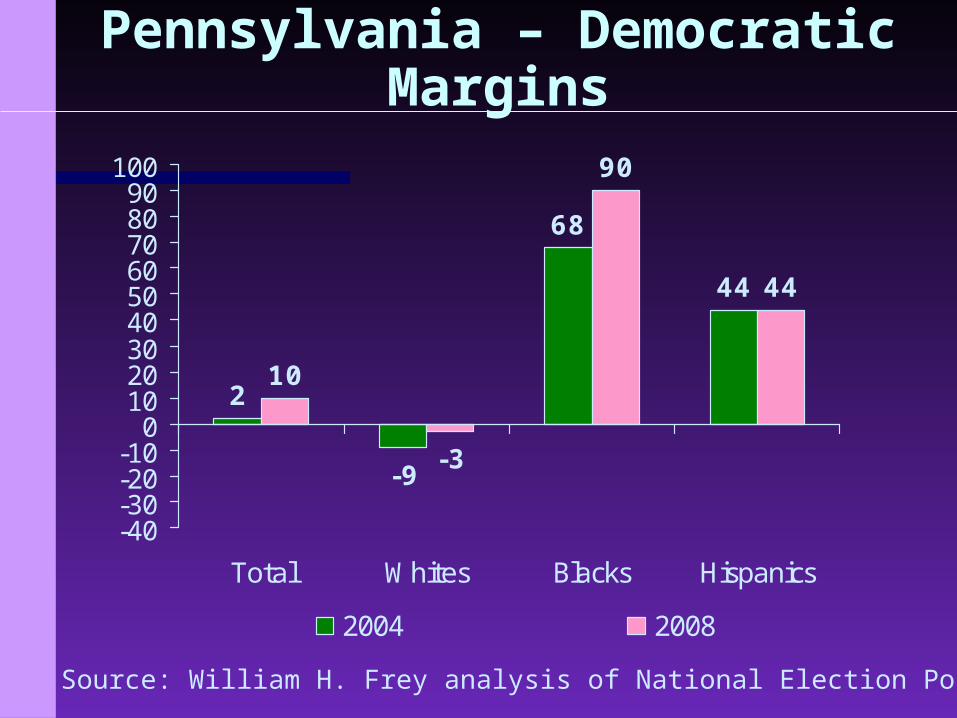
Pennsylvania – Democratic Margins
2
-9
68
44
10
-3
90
44
-40-30-20-10
0102030405060708090
100
Total Whites Blacks Hispanics
2004 2008
Source: William H. Frey
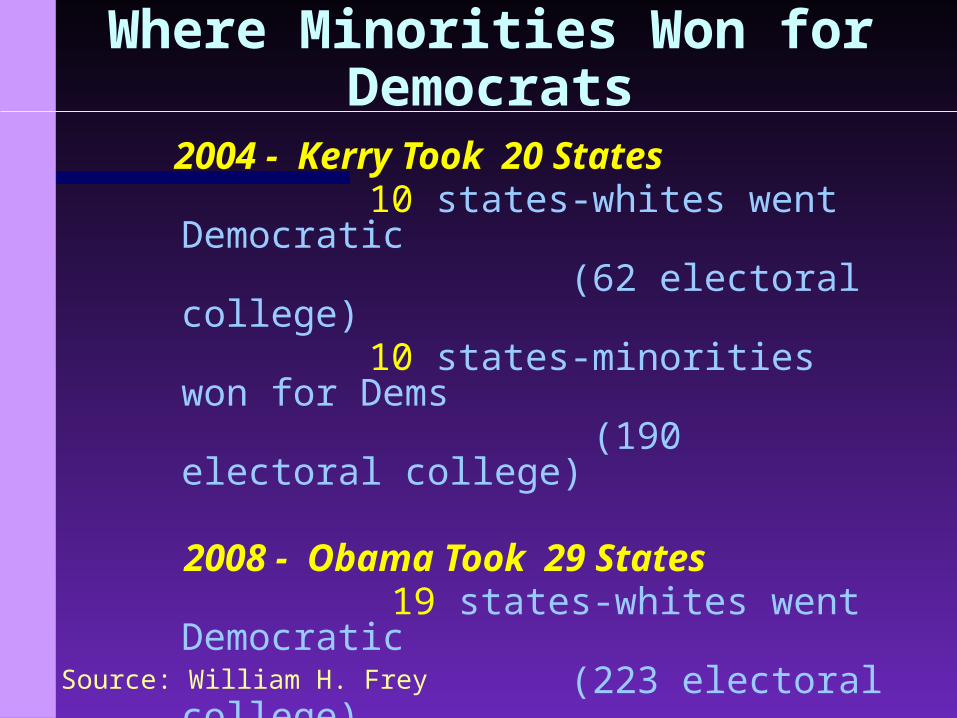
Where Minorities Won for Democrats
2004 - Kerry Took 20 States 10 states-whites went Democratic (62 electoral college) 10 states-minorities won for
Dems (190 electoral college)
2008 - Obama Took 29 States 19 states-whites went
Democratic (223 electoral college) 10 states-minorities won for
Dems (142 electoral college)
Source: William H. Frey analysis
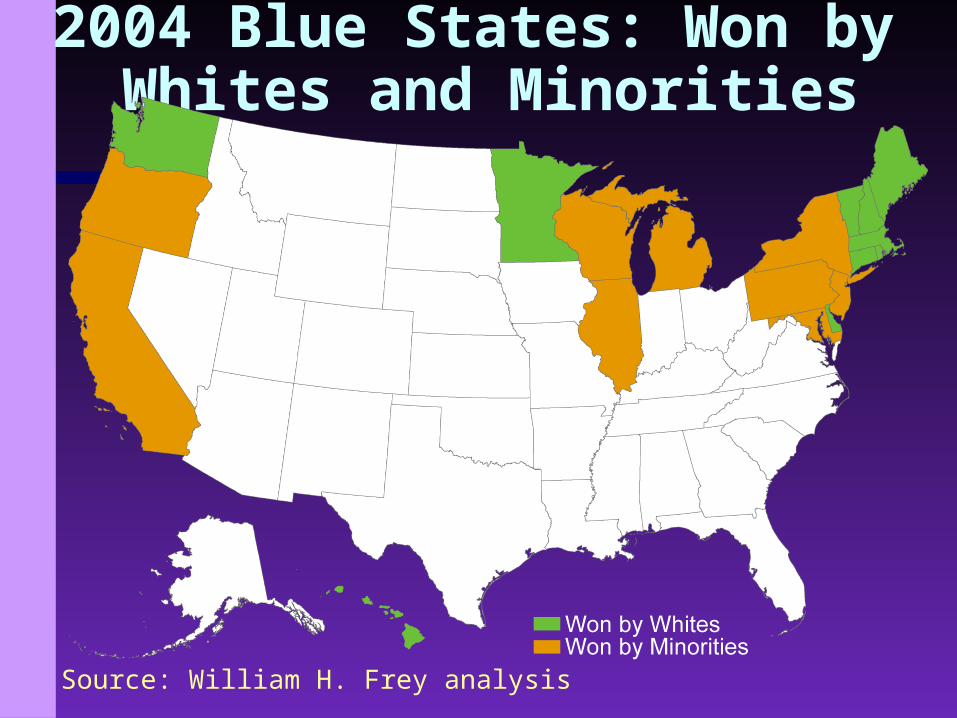
2004 Blue States: Won by Whites and Minorities
Source: William H. Frey analysis
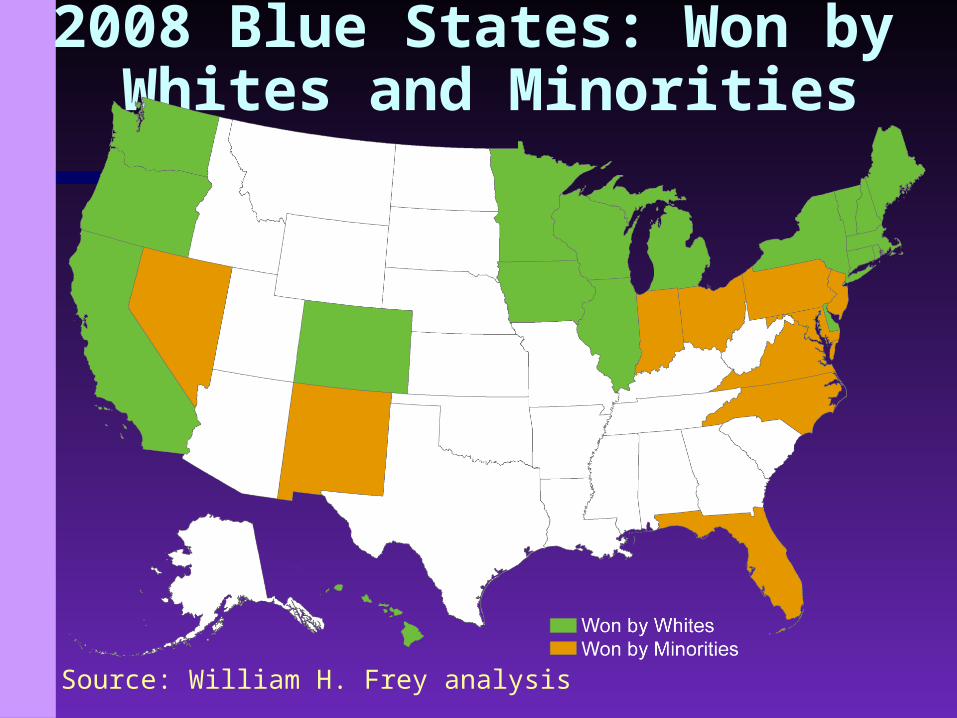
2008 Blue States: Won by Whites and Minorities
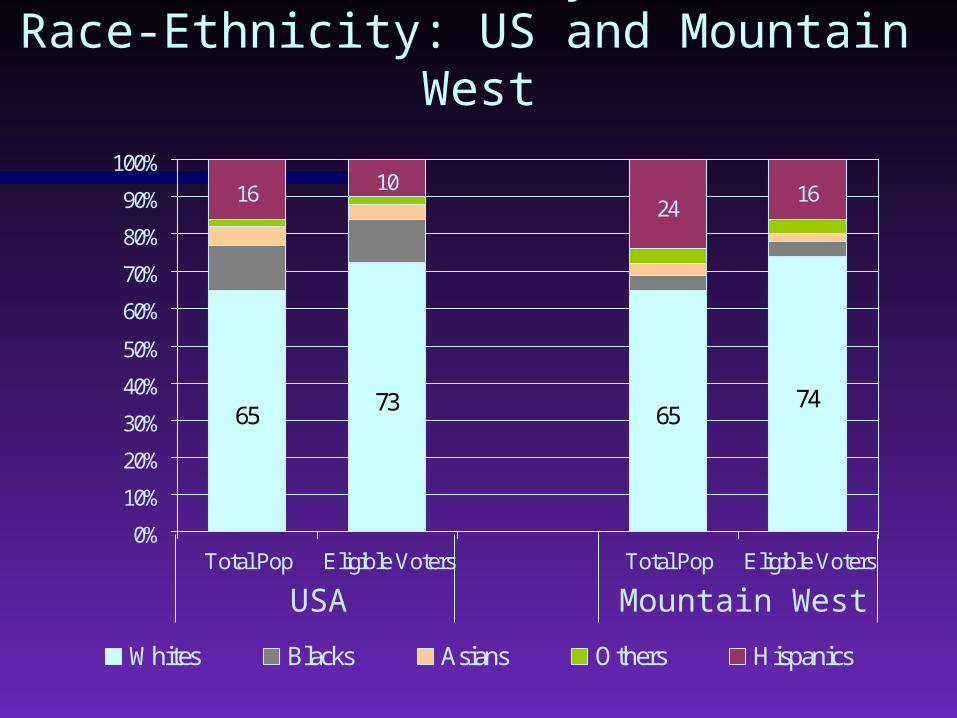
2010 Population and Eligible Voters by Race-Ethnicity: US and Mountain West
65 73 6574
16 1024
16
0%
10%
20%
30%
40%
50%
60%
70%
80%
90%
100%
Total Pop Eligible Voters Total Pop Eligible Voters
Whites Blacks Asians Others Hispanics
USA Mountain West
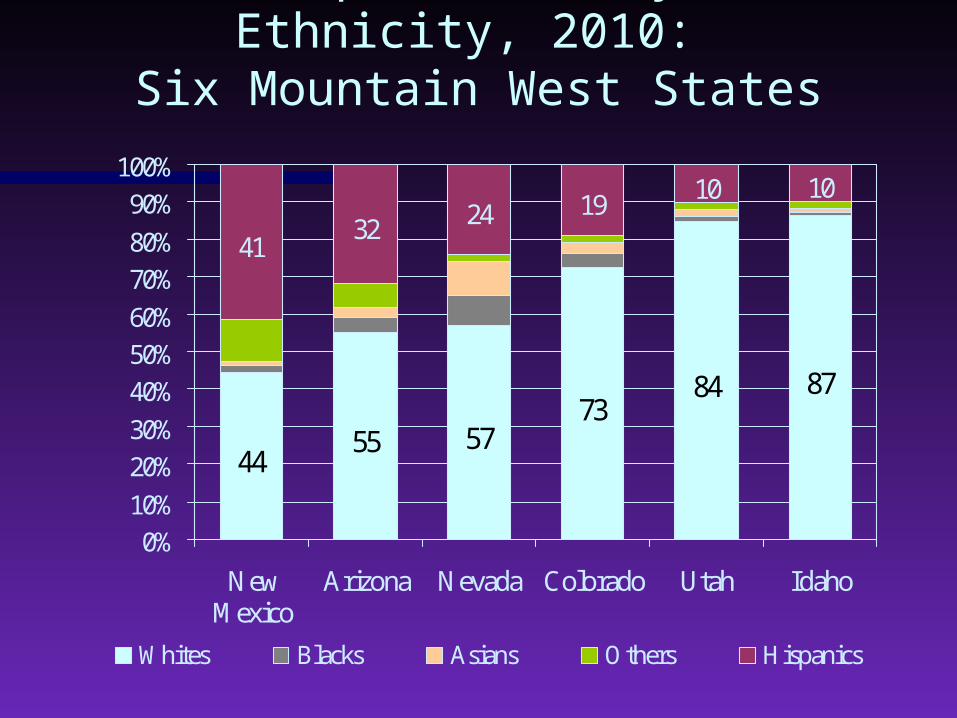
Total Population by Race-Ethnicity, 2010:
Six Mountain West States
4455 57
7384 87
4132 24 19 10 10
0%10%20%30%40%50%60%70%80%90%
100%
NewMexico
Arizona Nevada Colorado Utah Idaho
Whites Blacks Asians Others Hispanics
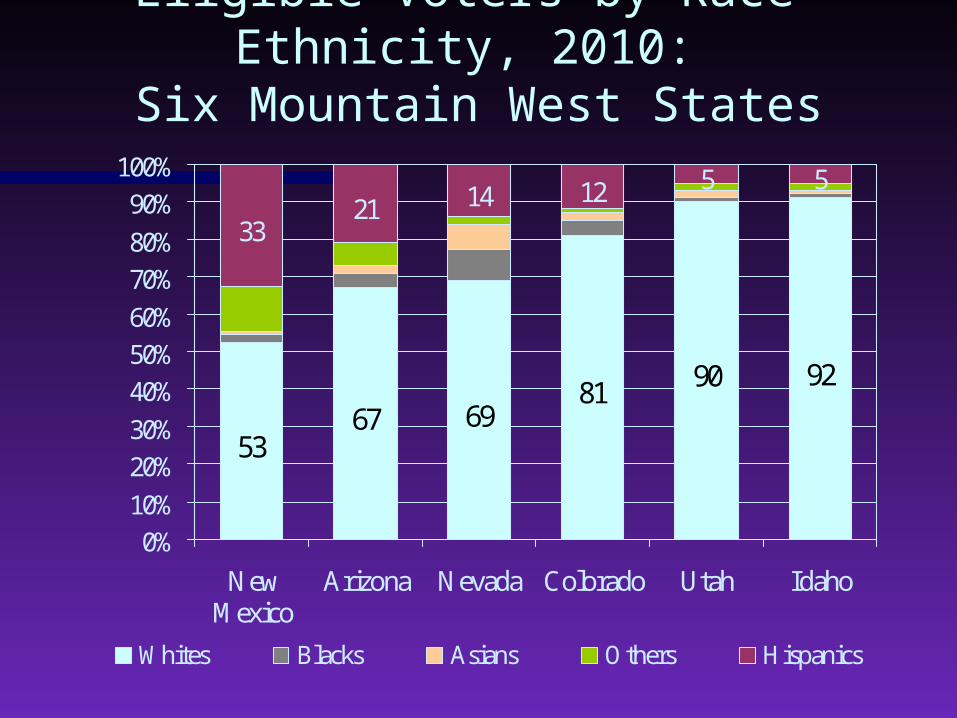
Eligible Voters by Race-Ethnicity, 2010:
Six Mountain West States
5367 69
81 90 92
3321 14 12 5 5
0%10%20%30%40%50%60%70%80%90%
100%
NewMexico
Arizona Nevada Colorado Utah Idaho
Whites Blacks Asians Others Hispanics
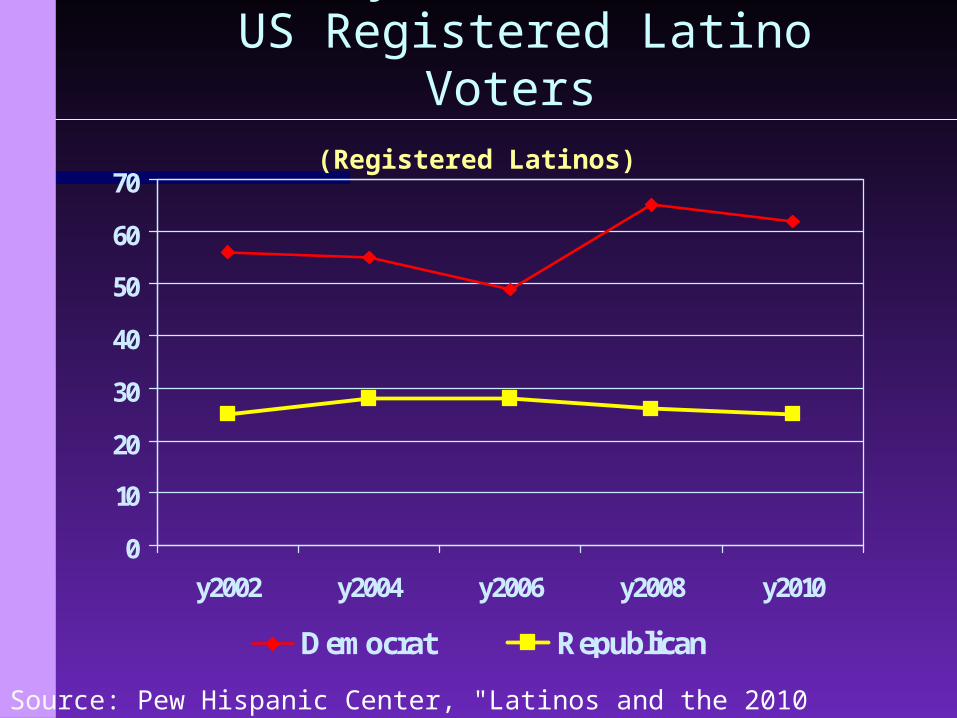
Party Affiliation: US Registered Latino Voters
0
10
20
30
40
50
60
70
y2002 y2004 y2006 y2008 y2010
Democrat Republican
Source: Pew Hispanic Center, "Latinos and the 2010 Elections" October 5, 2010
(Registered Latinos)
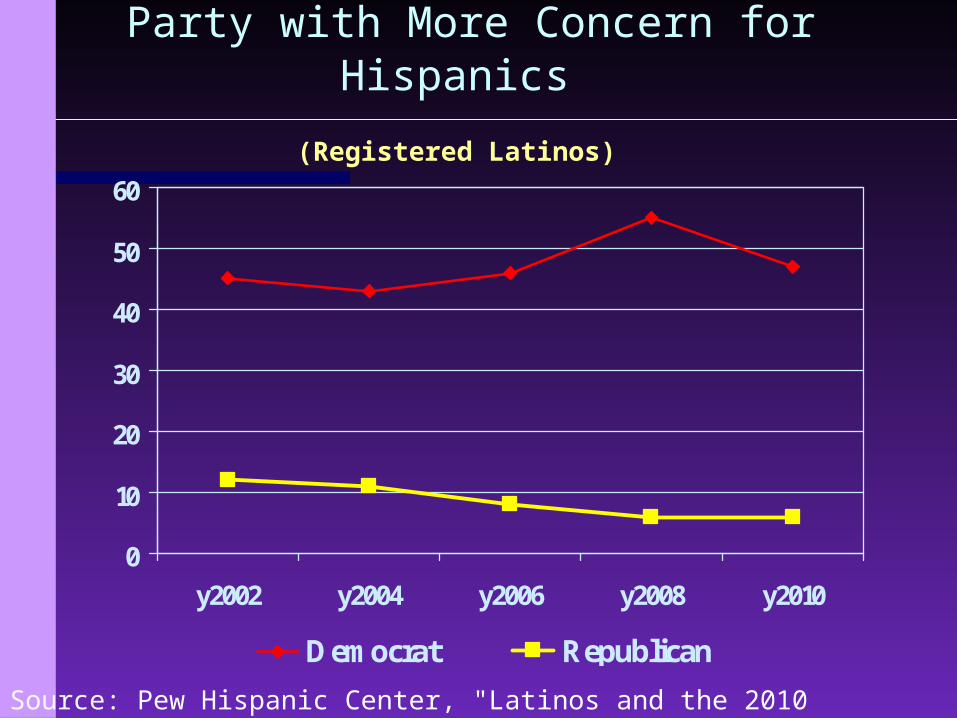
Party with More Concern for Hispanics
0
10
20
30
40
50
60
y2002 y2004 y2006 y2008 y2010
Democrat Republican
Source: Pew Hispanic Center, "Latinos and the 2010 Elections" October 5, 2010
(Registered Latinos)
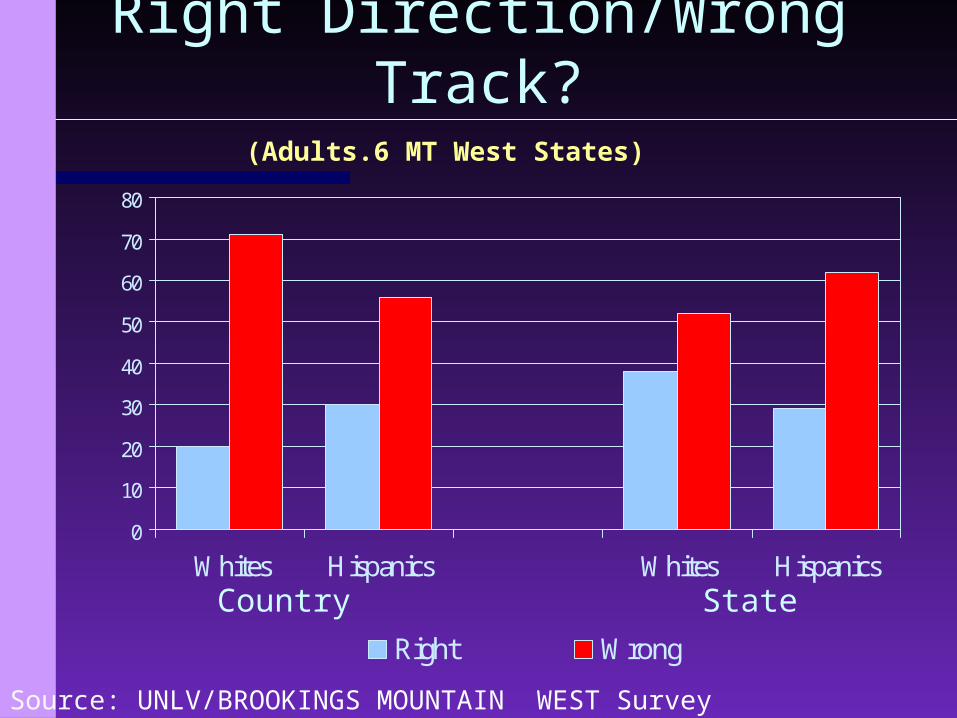
Right Direction/Wrong Track?
0
10
20
30
40
50
60
70
80
Whites Hispanics Whites Hispanics
Right Wrong
Source: UNLV/BROOKINGS MOUNTAIN WEST Survey
Country State
(Adults.6 MT West States)
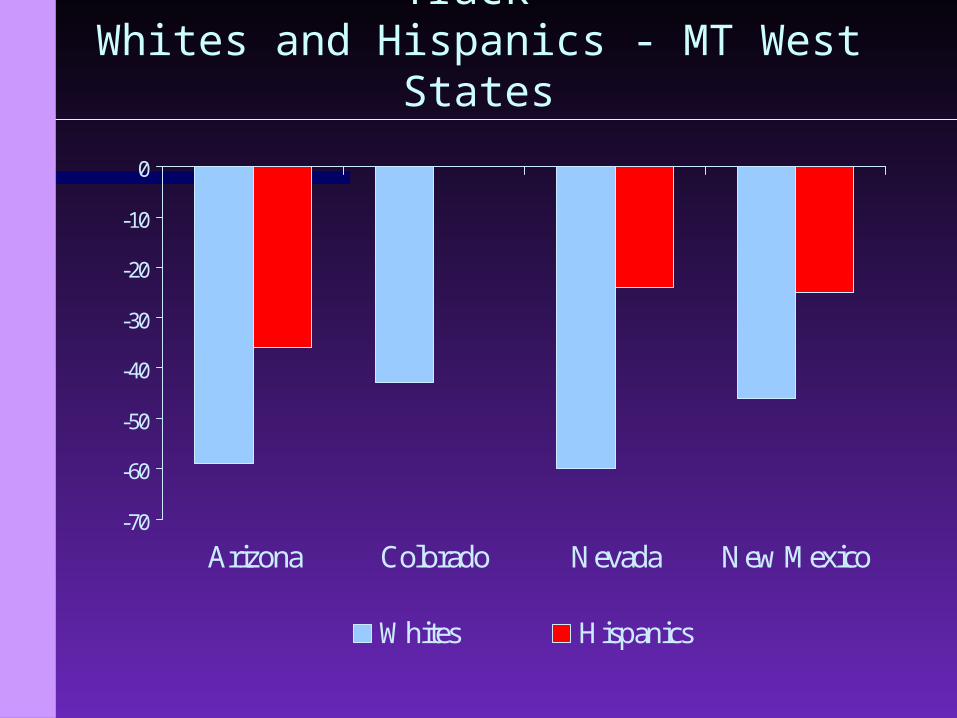
Country: Right Direction Minus Wrong Track
Whites and Hispanics - MT West States
-70
-60
-50
-40
-30
-20
-10
0
Arizona Colorado Nevada New Mexico
Whites Hispanics
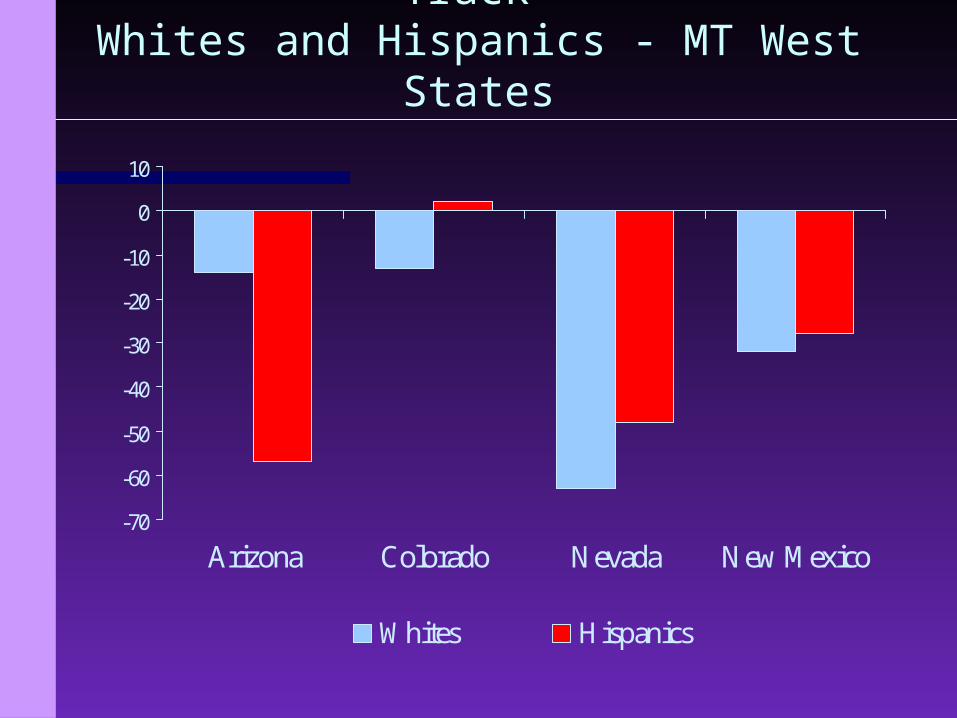
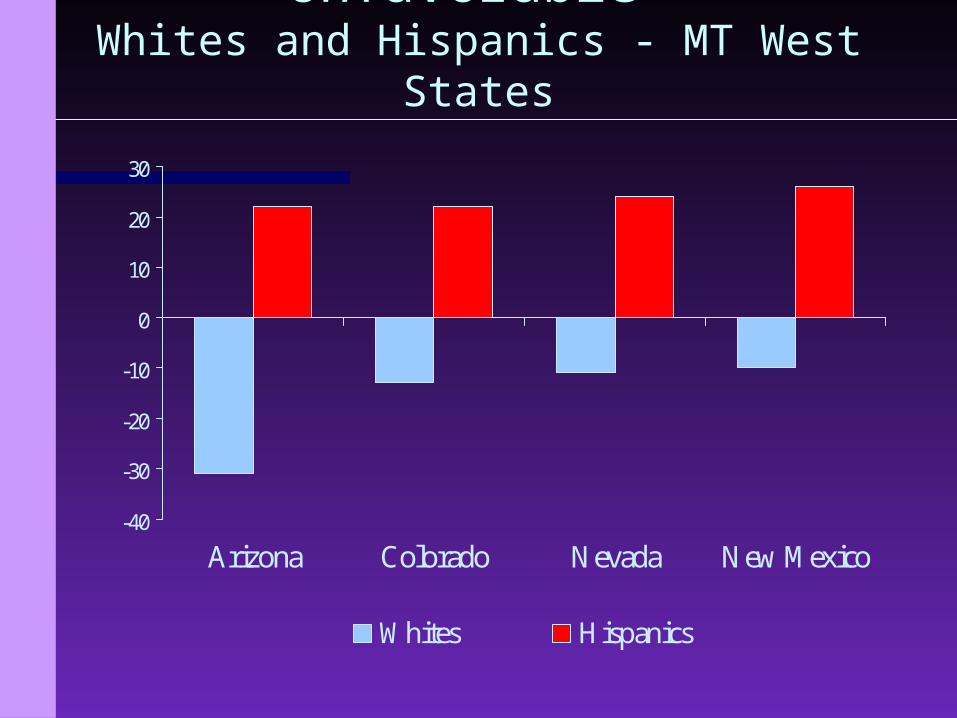
State: Right Direction Minus Wrong Track Whites and Hispanics - MT West States
-70
-60
-50
-40
-30
-20
-10
0
10
Arizona Colorado Nevada New Mexico
Whites Hispanics
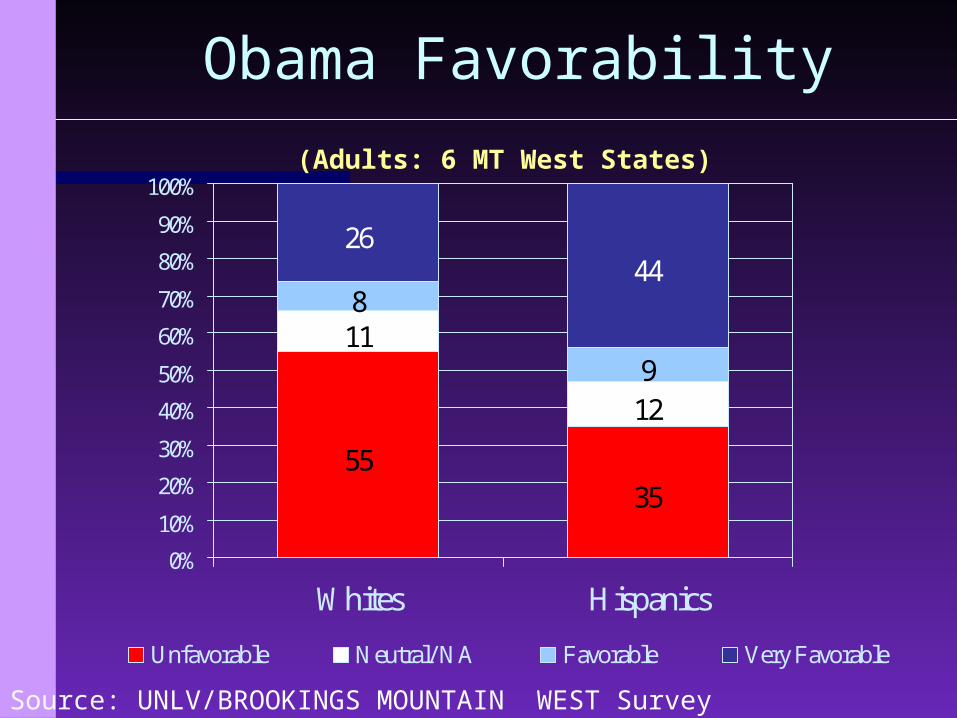
Obama Favorability
5535
11
12
8
9
2644
0%
10%
20%
30%
40%
50%
60%
70%
80%
90%
100%
Whites Hispanics
Unfavorable Neutral/ NA Favorable Very Favorable
Source: UNLV/BROOKINGS MOUNTAIN WEST Survey
(Adults: 6 MT West States)
Obama: Favorable Minus Unfavorable
Whites and Hispanics - MT West States
-40
-30
-20
-10
0
10
20
30
Arizona Colorado Nevada New Mexico
Whites Hispanics
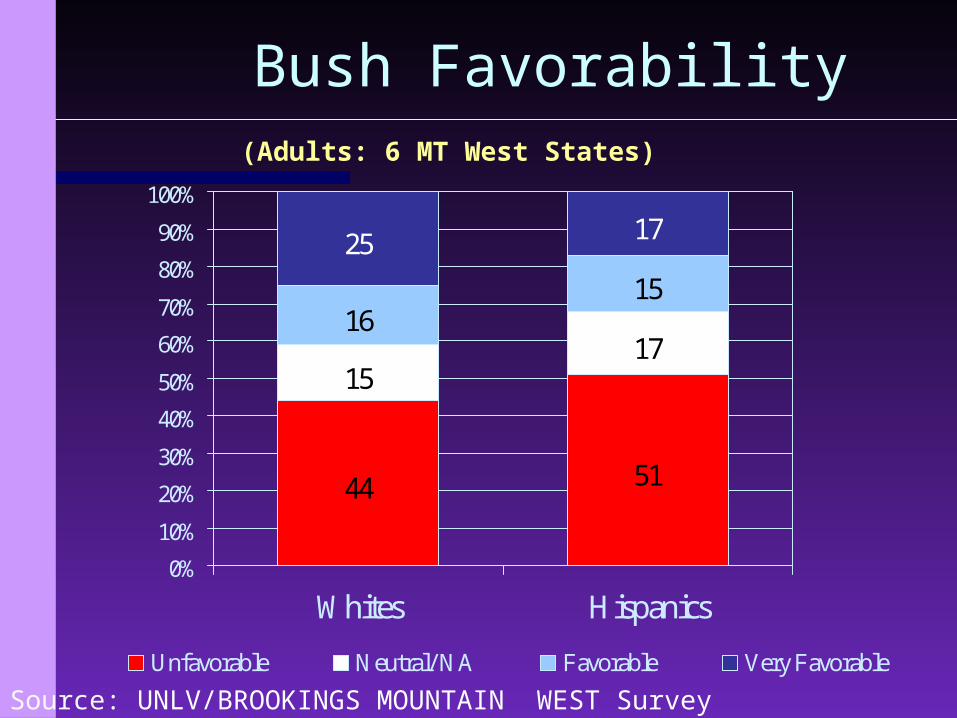
Bush Favorability
44 51
1517
1615
25 17
0%
10%
20%
30%
40%
50%
60%
70%
80%
90%
100%
Whites Hispanics
Unfavorable Neutral/ NA Favorable Very Favorable
Source: UNLV/BROOKINGS MOUNTAIN WEST Survey
(Adults: 6 MT West States)
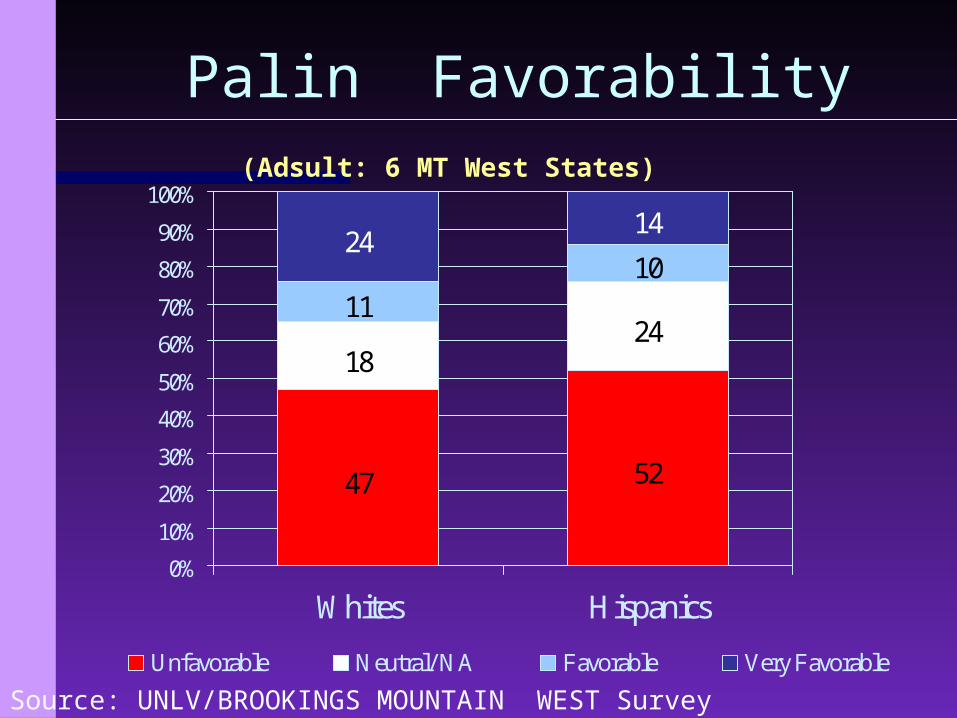
Palin Favorability
47 52
1824
1110
2414
0%
10%
20%
30%
40%
50%
60%
70%
80%
90%
100%
Whites Hispanics
Unfavorable Neutral/ NA Favorable Very Favorable
Source: UNLV/BROOKINGS MOUNTAIN WEST Survey
(Adsult: 6 MT West States)

Congressional Democrat Favorability
5737
18
23
13
17
1223
0%
10%
20%
30%
40%
50%
60%
70%
80%
90%
100%
Whites Hispanics
Unfavorable Neutral/ NA Favorable Very Favorable
Source: UNLV/BROOKINGS MOUNTAIN WEST Survey
(Adults: 6 MT West States)
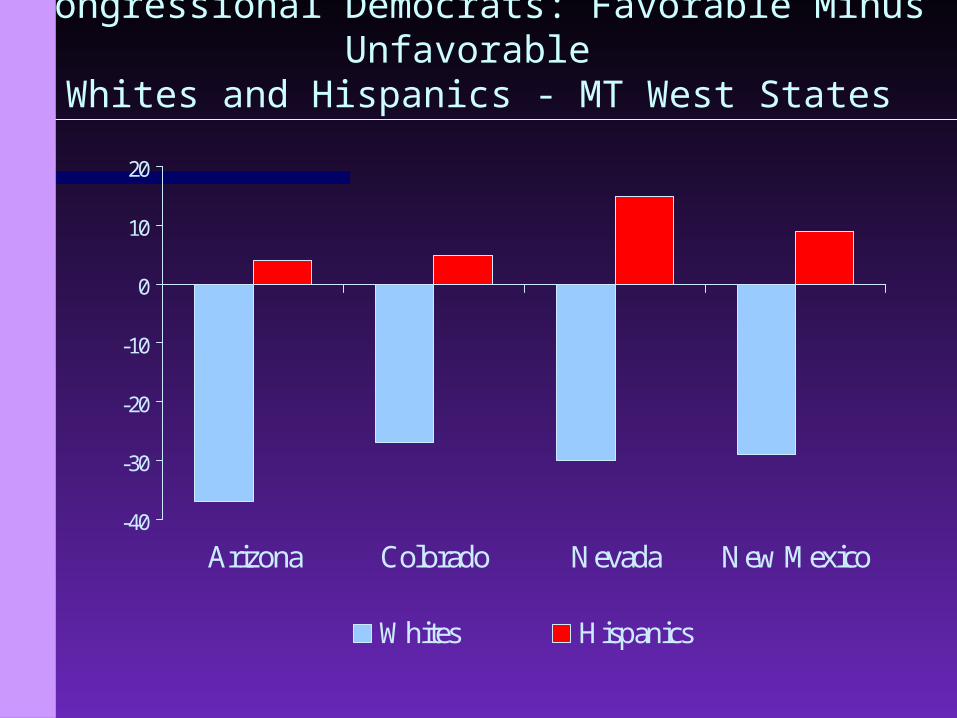
Congressional Democrats: Favorable Minus Unfavorable
Whites and Hispanics - MT West States
-40
-30
-20
-10
0
10
20
Arizona Colorado Nevada New Mexico
Whites Hispanics
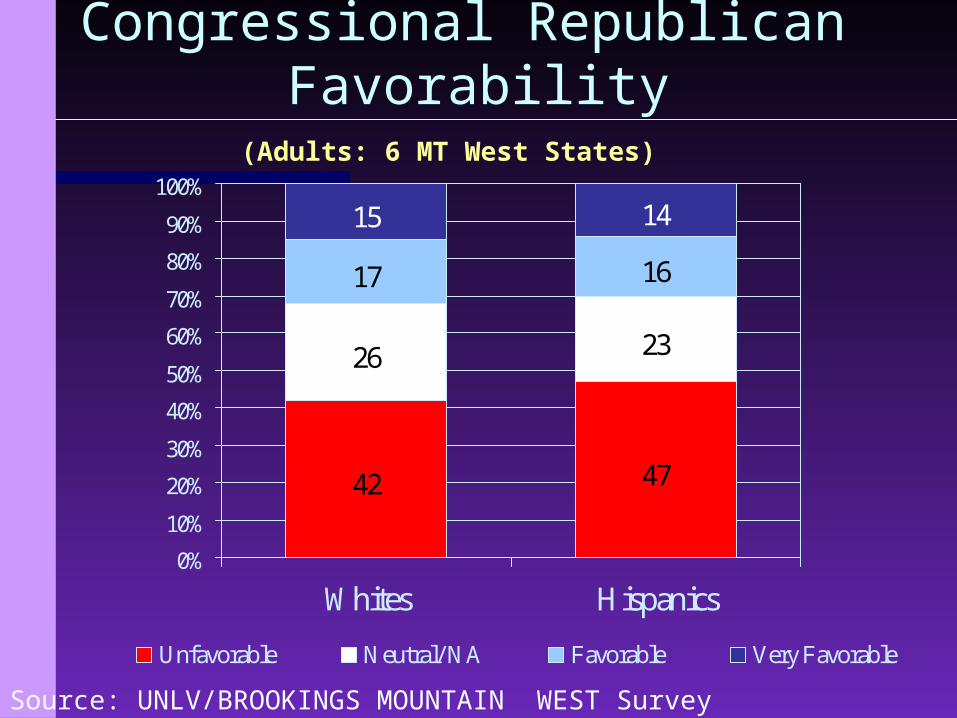
Congressional Republican Favorability
42 47
26 23
17 16
15 14
0%
10%
20%
30%
40%
50%
60%
70%
80%
90%
100%
Whites Hispanics
Unfavorable Neutral/ NA Favorable Very Favorable
Source: UNLV/BROOKINGS MOUNTAIN WEST Survey
(Adults: 6 MT West States)
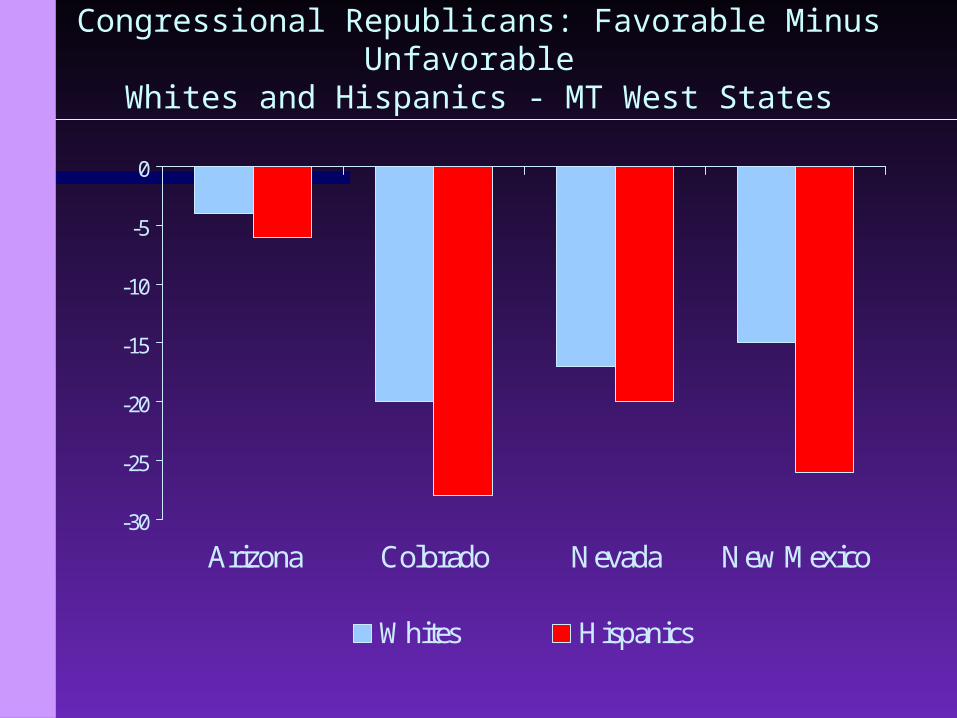
Congressional Republicans: Favorable Minus Unfavorable Whites and Hispanics - MT West States
-30
-25
-20
-15
-10
-5
0
Arizona Colorado Nevada New Mexico
Whites Hispanics
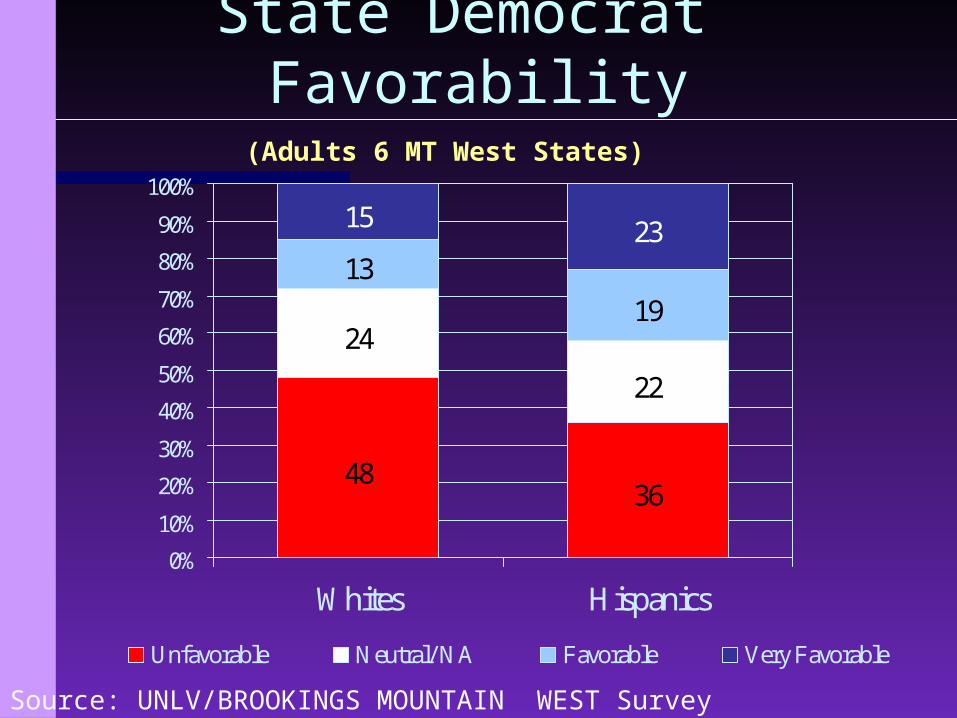
State Democrat Favorability
4836
24
22
1319
15 23
0%
10%
20%
30%
40%
50%
60%
70%
80%
90%
100%
Whites Hispanics
Unfavorable Neutral/ NA Favorable Very Favorable
Source: UNLV/BROOKINGS MOUNTAIN WEST Survey
(Adults 6 MT West States)
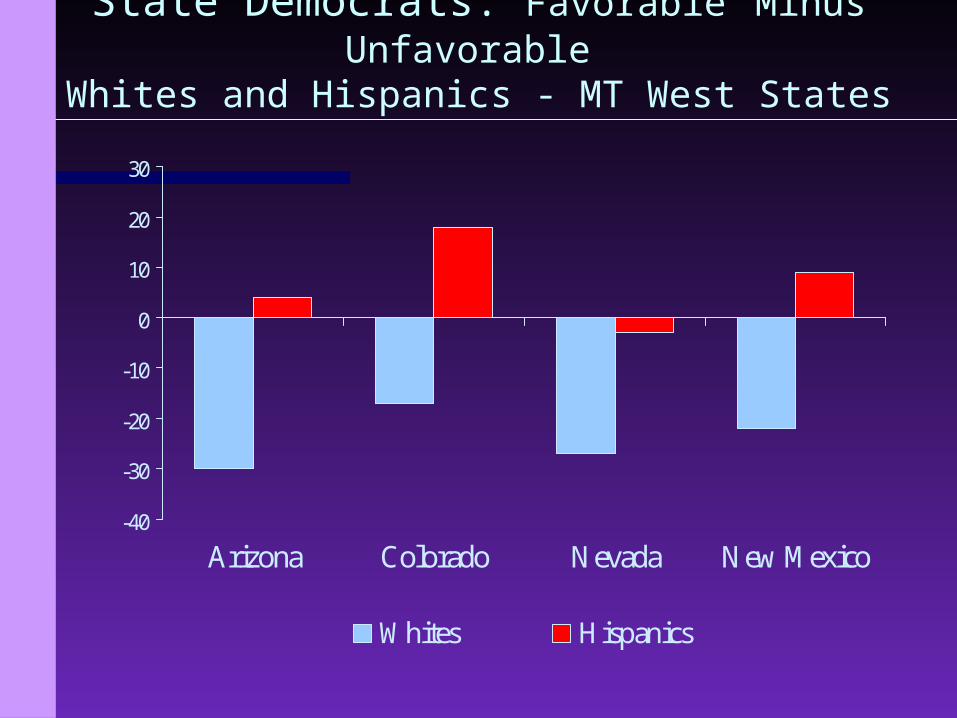
State Democrats: Favorable Minus Unfavorable
Whites and Hispanics - MT West States
-40
-30
-20
-10
0
10
20
30
Arizona Colorado Nevada New Mexico
Whites Hispanics
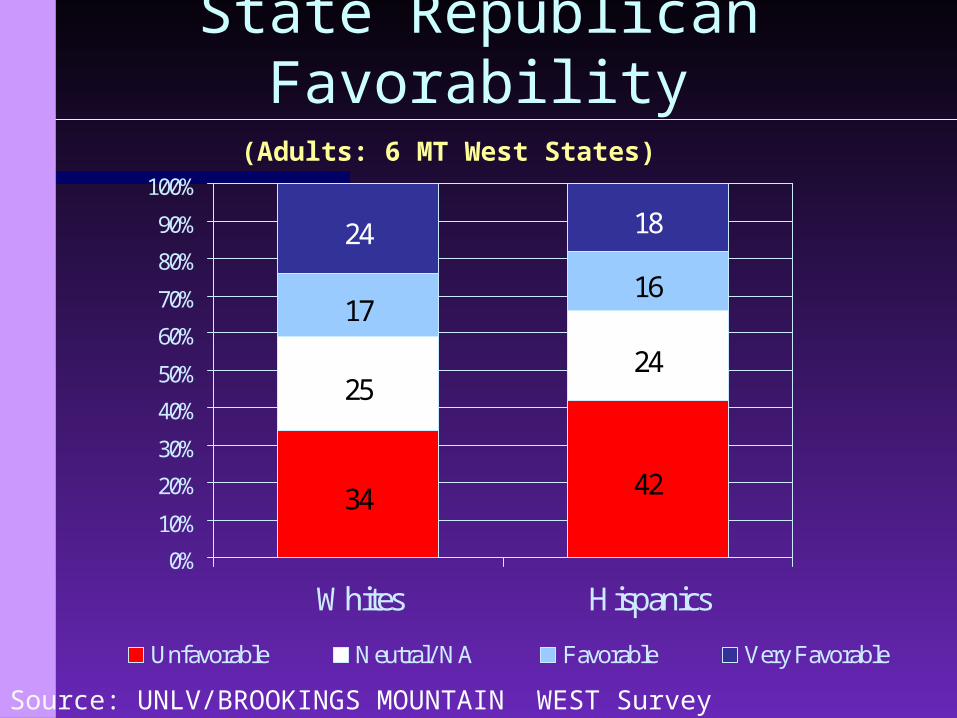
State Republican Favorability
34 42
2524
1716
24 18
0%
10%
20%
30%
40%
50%
60%
70%
80%
90%
100%
Whites Hispanics
Unfavorable Neutral/ NA Favorable Very Favorable
Source: UNLV/BROOKINGS MOUNTAIN WEST Survey
(Adults: 6 MT West States)
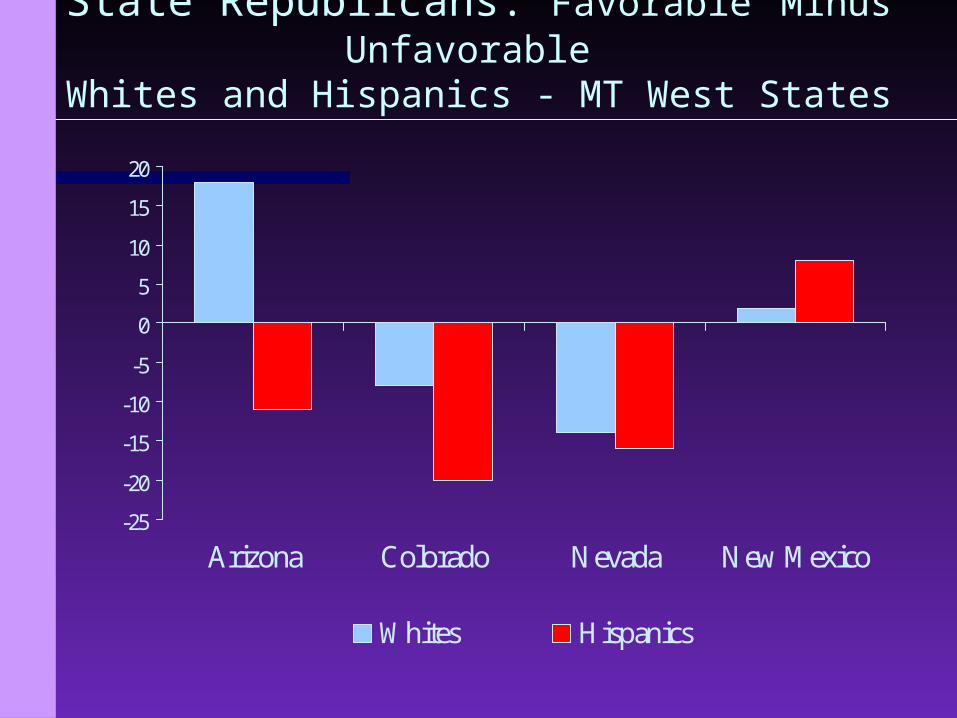
State Republicans: Favorable Minus Unfavorable
Whites and Hispanics - MT West States
-25
-20
-15
-10
-5
0
5
10
15
20
Arizona Colorado Nevada New Mexico
Whites Hispanics
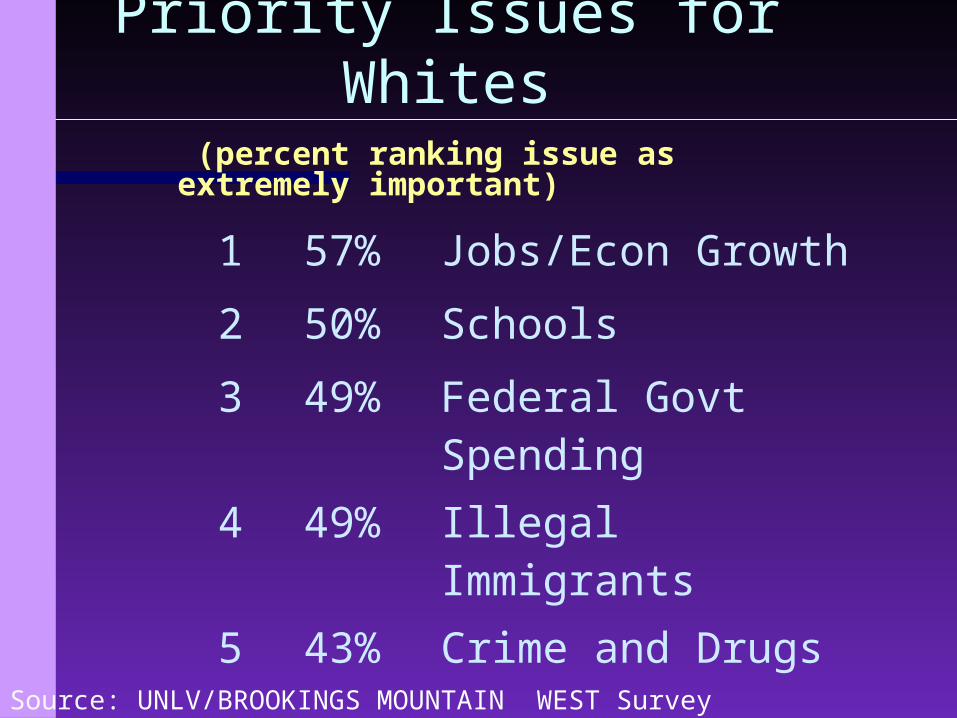
Priority Issues for Whites
Source: UNLV/BROOKINGS MOUNTAIN WEST Survey
1 57% Jobs/Econ Growth
2 50% Schools
3 49% Federal Govt Spending
4 49% Illegal Immigrants
5 43% Crime and Drugs
(percent ranking issue as extremely important)
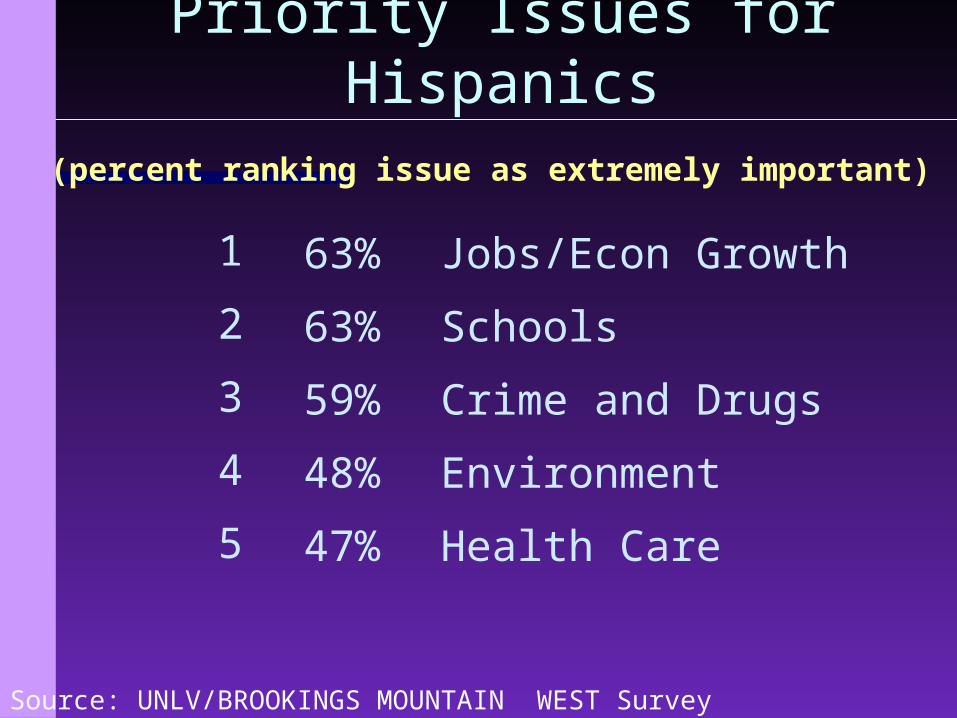
Priority Issues for Hispanics
Source: UNLV/BROOKINGS MOUNTAIN WEST Survey
1 63% Jobs/Econ Growth
2 63% Schools
3 59% Crime and Drugs
4 48% Environment
5 47% Health Care
(percent ranking issue as extremely important)
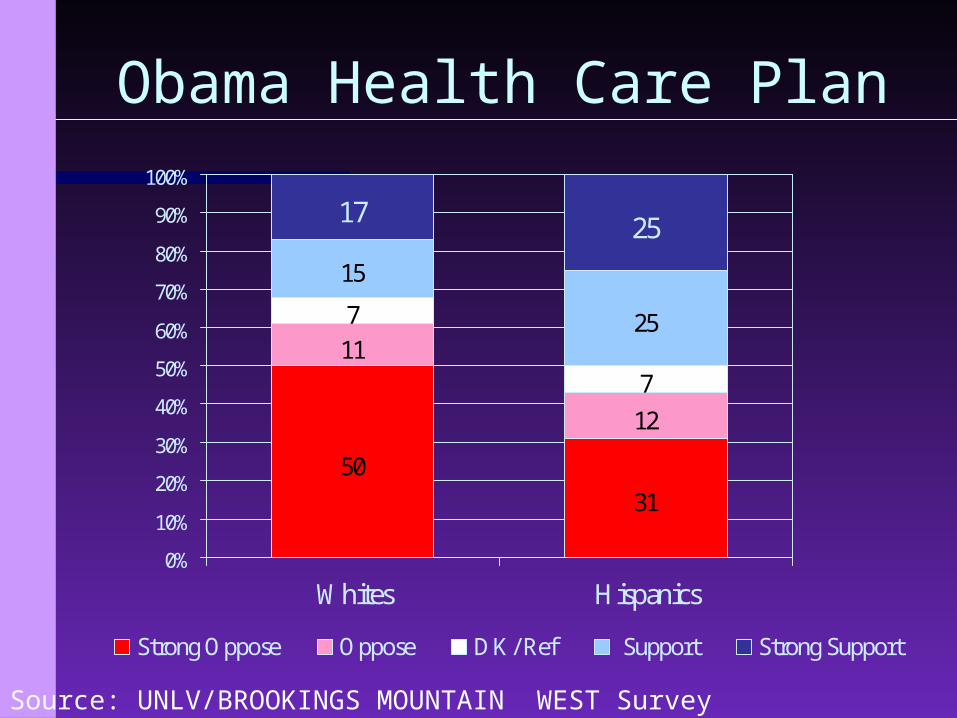
Obama Health Care Plan
5031
11
12
7
7
15
25
17 25
0%
10%
20%
30%
40%
50%
60%
70%
80%
90%
100%
Whites Hispanics
Strong Oppose Oppose DK/ Ref Support Strong Support
Source: UNLV/BROOKINGS MOUNTAIN WEST Survey
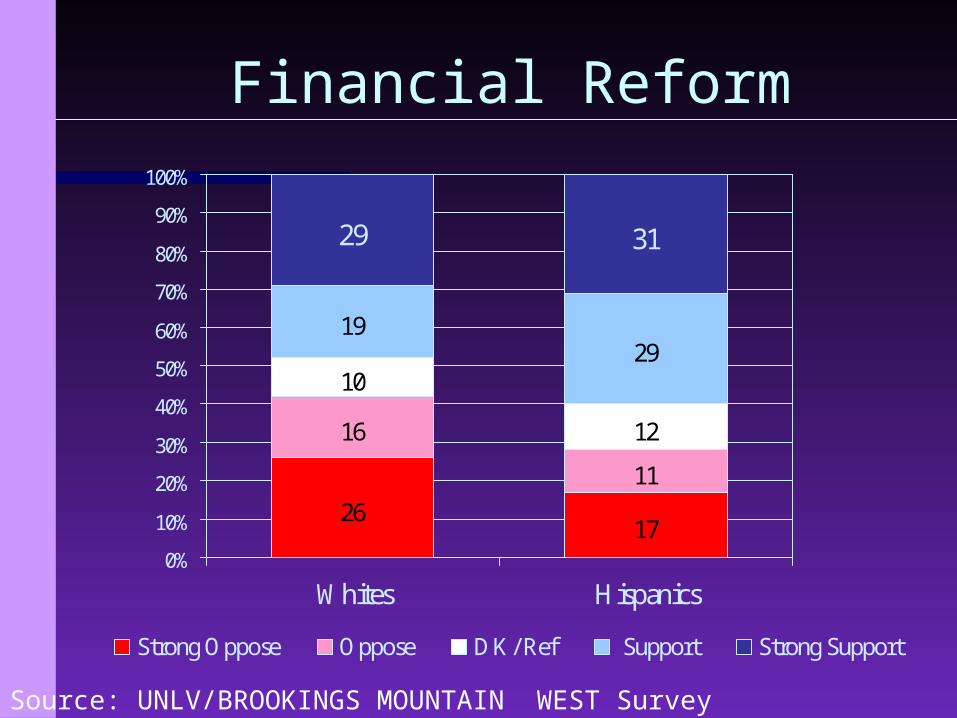
Financial Reform
2617
16
11
10
12
1929
29 31
0%
10%
20%
30%
40%
50%
60%
70%
80%
90%
100%
Whites Hispanics
Strong Oppose Oppose DK/ Ref Support Strong Support
Source: UNLV/BROOKINGS MOUNTAIN WEST Survey
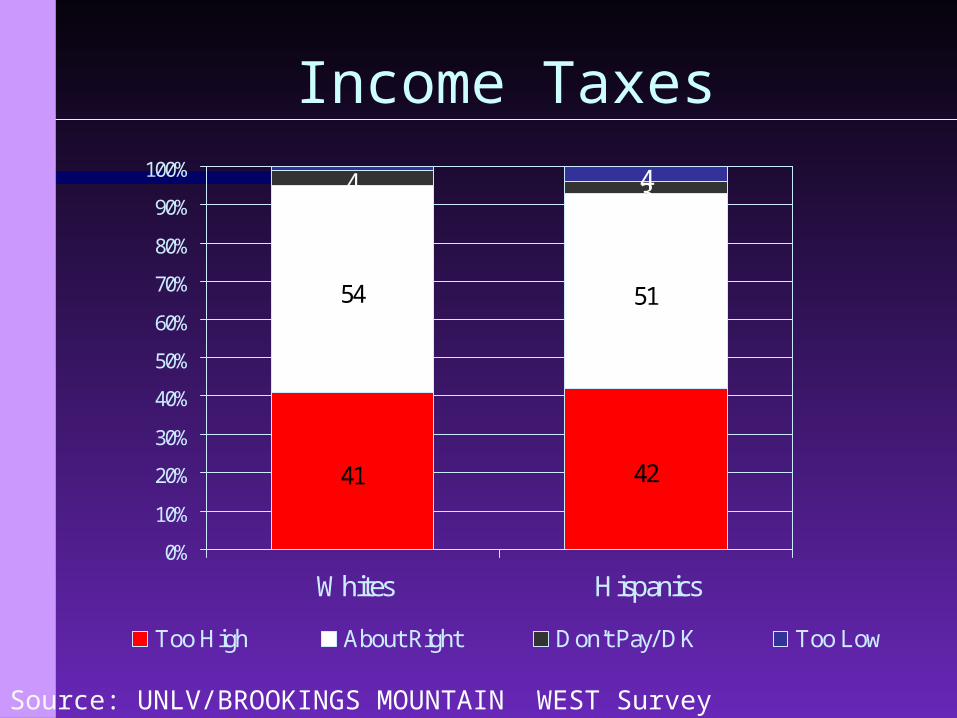
Income Taxes
41 42
54 51
4 34
0%
10%
20%
30%
40%
50%
60%
70%
80%
90%
100%
Whites Hispanics
Too High About Right Don't Pay/ DK Too Low
Source: UNLV/BROOKINGS MOUNTAIN WEST Survey
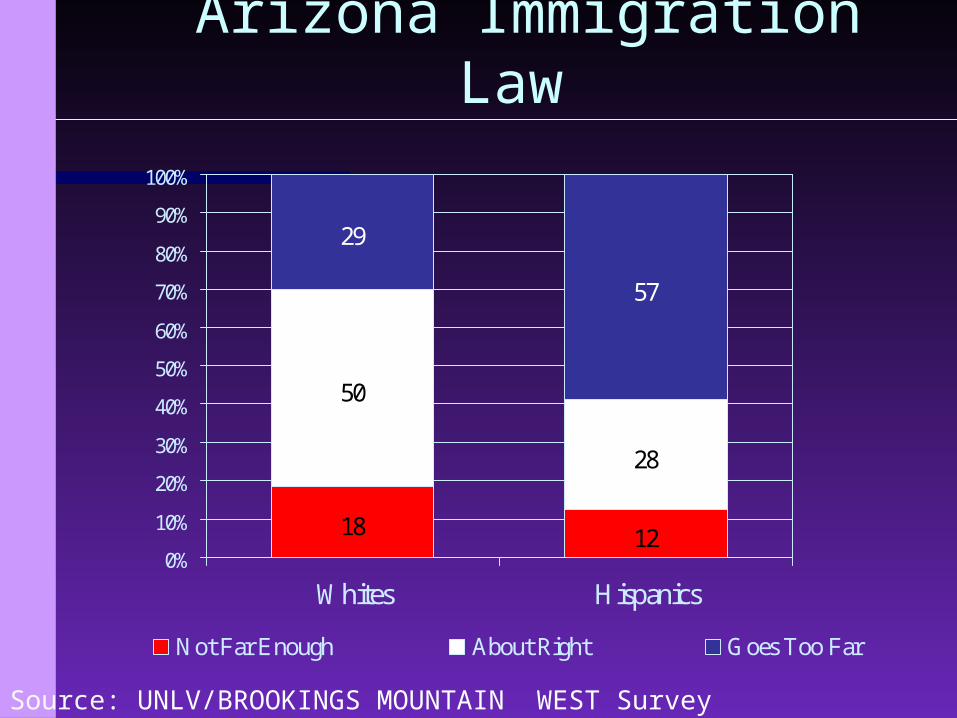
Arizona Immigration Law
18 12
50
28
29
57
0%
10%
20%
30%
40%
50%
60%
70%
80%
90%
100%
Whites Hispanics
Not Far Enough About Right Goes Too Far
Source: UNLV/BROOKINGS MOUNTAIN WEST Survey
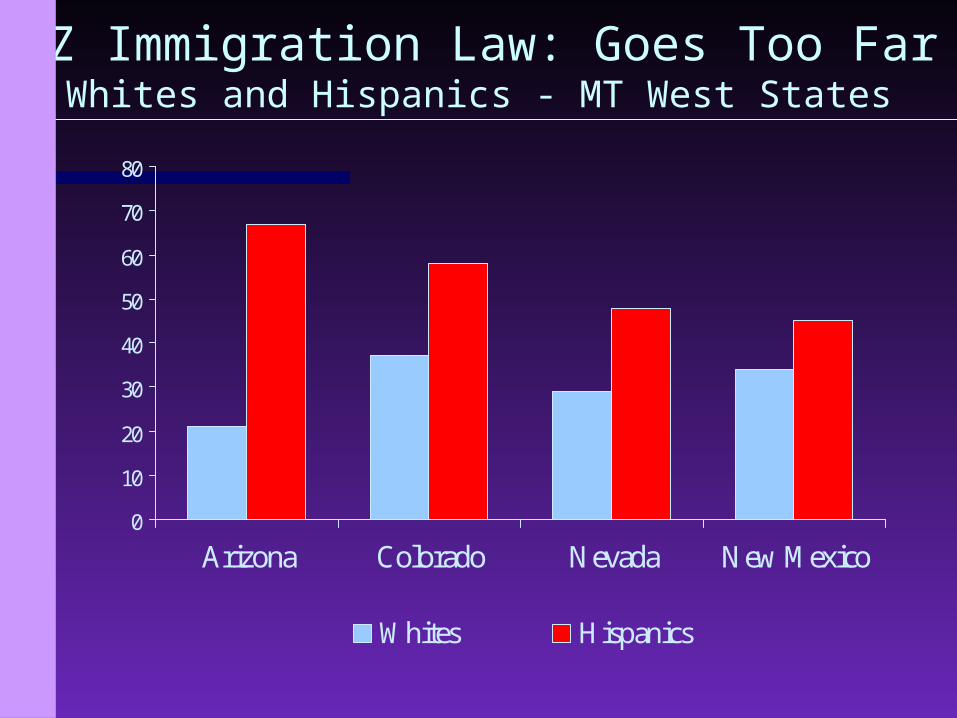
AZ Immigration Law: Goes Too FarWhites and Hispanics - MT West States
0
10
20
30
40
50
60
70
80
Arizona Colorado Nevada New Mexico
Whites Hispanics
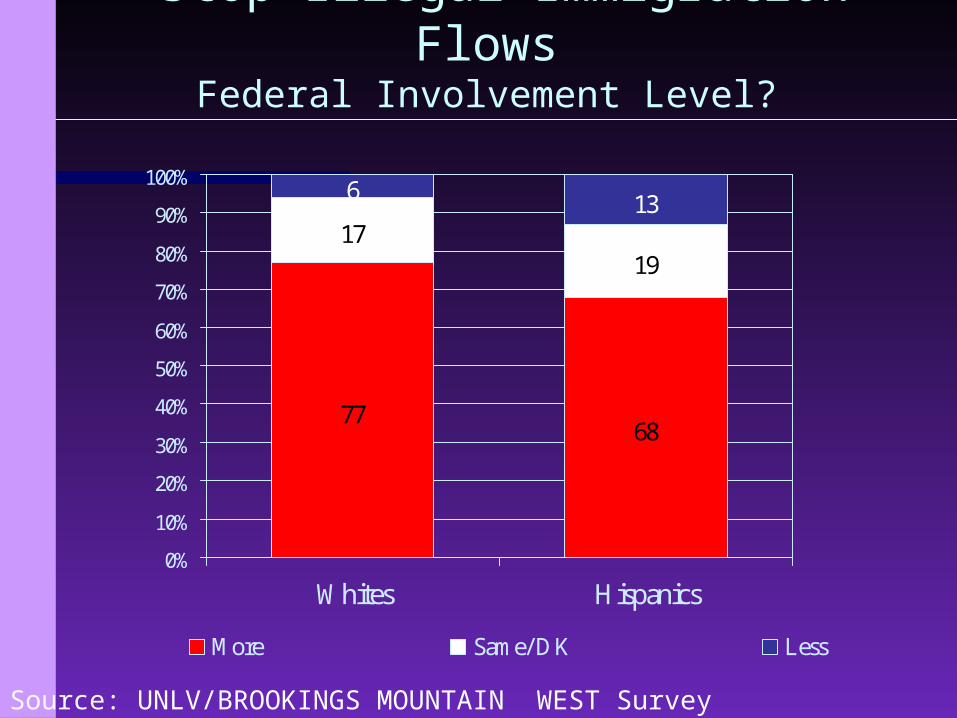
Stop Illegal Immigration FlowsFederal Involvement Level?
7768
1719
6 13
0%
10%
20%
30%
40%
50%
60%
70%
80%
90%
100%
Whites Hispanics
More Same/ DK Less
Source: UNLV/BROOKINGS MOUNTAIN WEST Survey
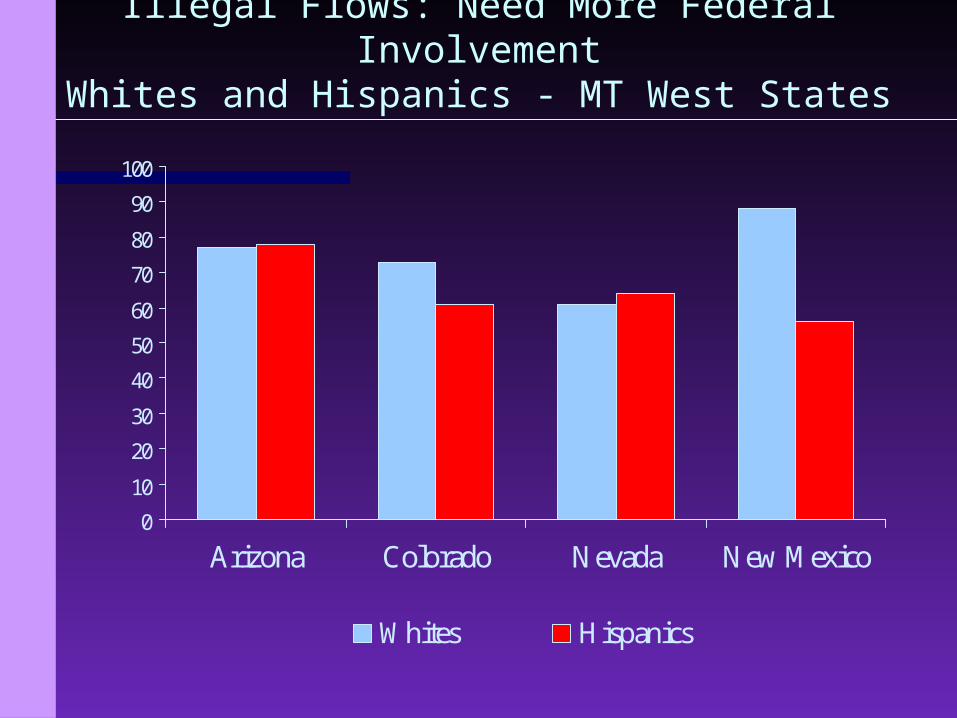
Illegal Flows: Need More Federal InvolvementWhites and Hispanics - MT West States
0
10
20
30
40
50
60
70
80
90
100
Arizona Colorado Nevada New Mexico
Whites Hispanics
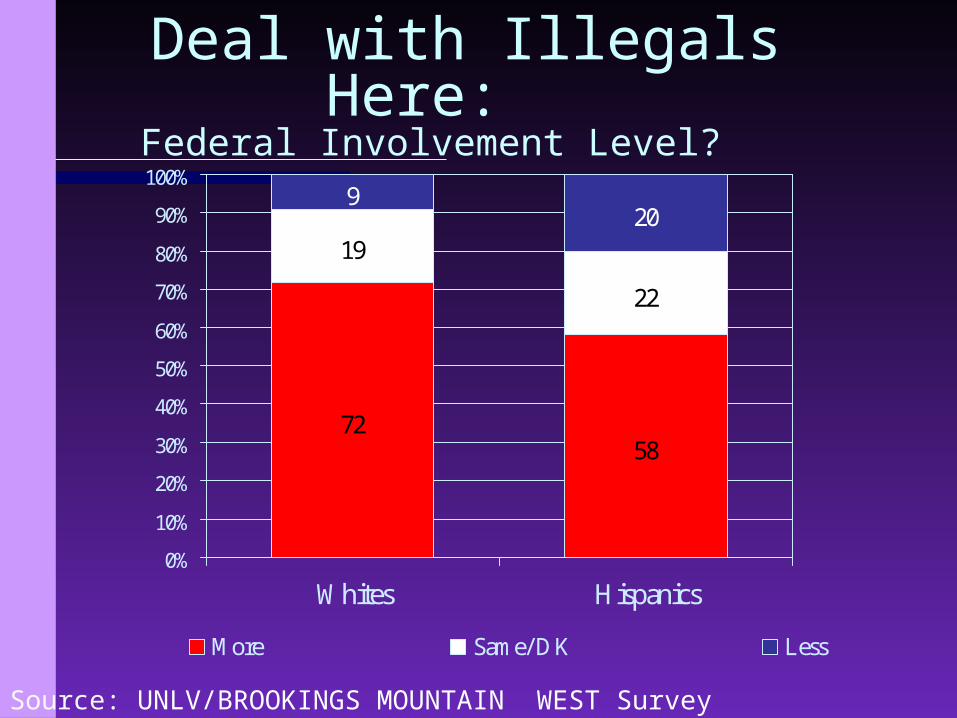
Deal with Illegals Here: Federal Involvement Level?
7258
19
22
920
0%
10%
20%
30%
40%
50%
60%
70%
80%
90%
100%
Whites Hispanics
More Same/ DK Less
Source: UNLV/BROOKINGS MOUNTAIN WEST Survey
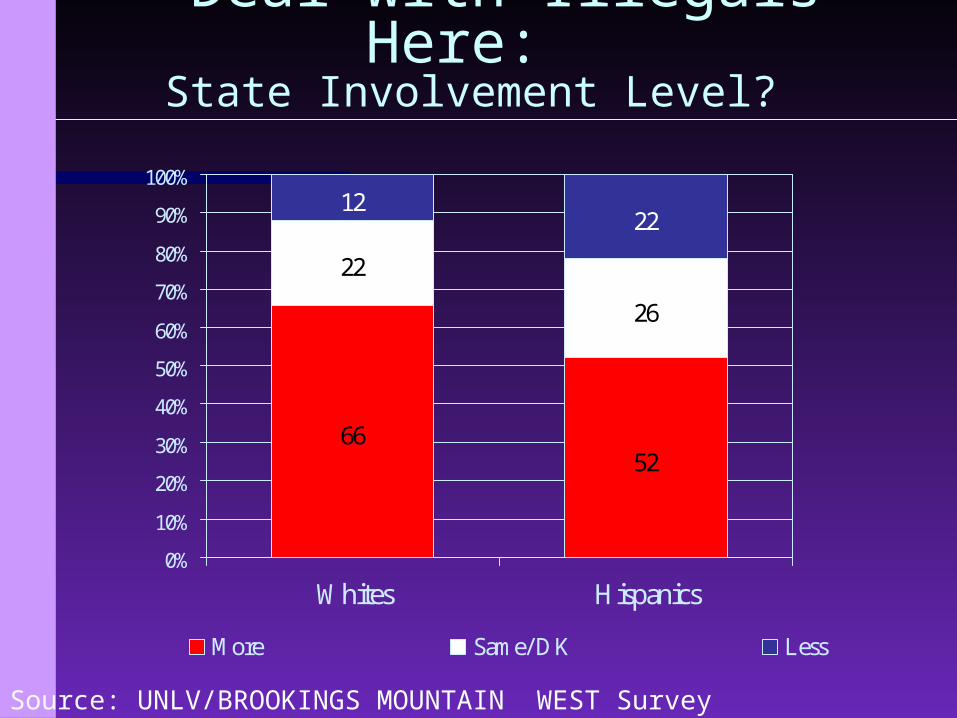
Deal with Illegals Here: State Involvement Level?
6652
22
26
1222
0%
10%
20%
30%
40%
50%
60%
70%
80%
90%
100%
Whites Hispanics
More Same/ DK Less
Source: UNLV/BROOKINGS MOUNTAIN WEST Survey
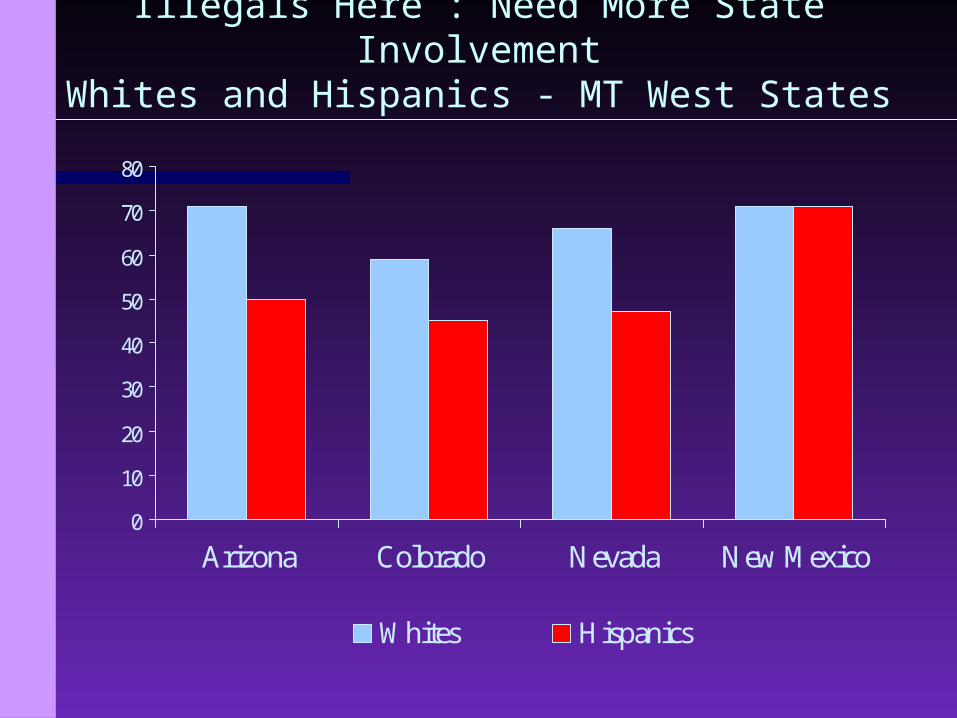
Illegals Here : Need More State InvolvementWhites and Hispanics - MT West States
0
10
20
30
40
50
60
70
80
Arizona Colorado Nevada New Mexico
Whites Hispanics
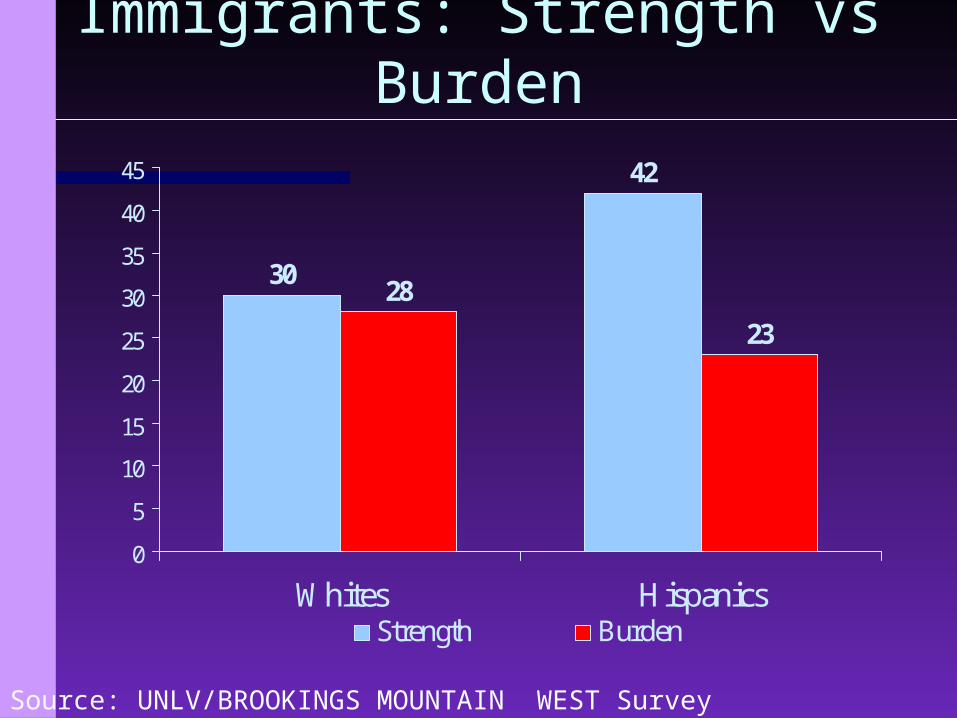
Immigrants: Strength vs Burden
30
42
28
23
0
5
10
15
20
25
30
35
40
45
Whites HispanicsStrength Burden
Source: UNLV/BROOKINGS MOUNTAIN WEST Survey
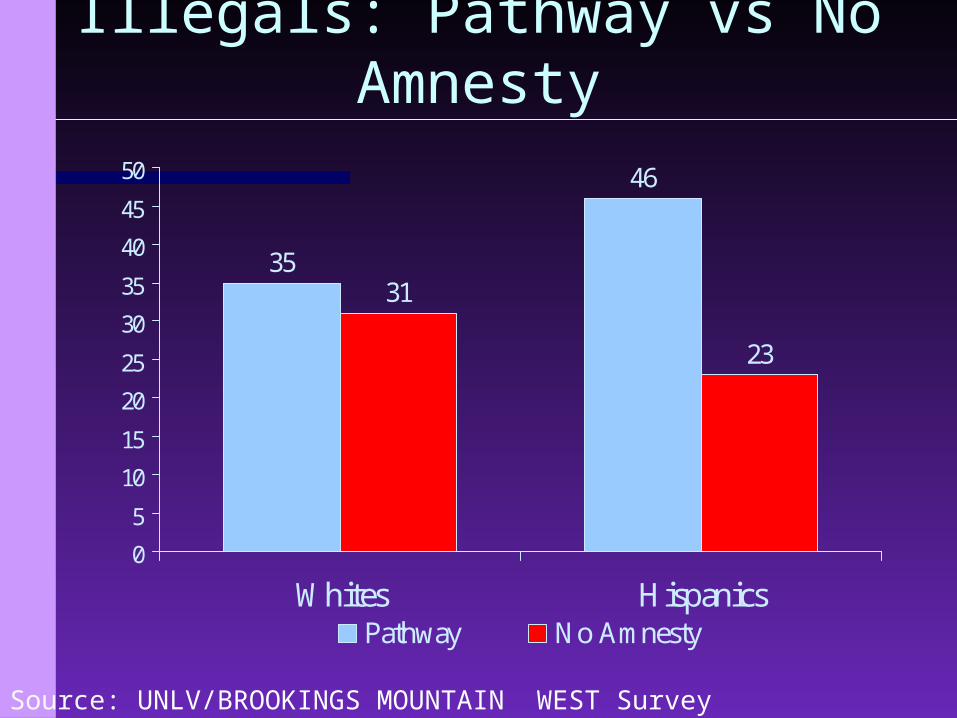
Illegals: Pathway vs No Amnesty
35
46
31
23
0
5
10
15
20
25
30
35
40
45
50
Whites HispanicsPathway No Amnesty
Source: UNLV/BROOKINGS MOUNTAIN WEST Survey

![Introductory video [click here] Black Hispanics? “Hispanics come in all colors and shapes. There are Asian Hispanics, white Hispanics, black Hispanics](https://img.pdfslide.net/doc/110x75/56649c825503460f9493a192/introductory-video-click-here-black-hispanics-hispanics-come-in-all-colors.jpg)