Embed Size (px)
Citation preview

Geographic variation of reproductive health indicators and outcomes in the United States: place matters
William M. Callaghan, MD, MPHDivision of Reproductive Health, Centers for Disease Control and Prevention, Atlanta, GA
Abstract
The social determinants of health are the circumstances in which people are born, grow up, live,
work, and age and the systems put in place to deal with illness. These circumstances, in turn, are
shaped by a wider set of forces: economics, social policies, and politics. Reproductive health
indicators and conditions that are germane to obstetricians and gynecologists vary across states
and regions in the United States as well as within regions and states. The aim of this article is to
illustrate this variation with the use of examples of gynecologic malignancies, sexually transmitted
infections, teen birth rates, preterm birth rates, and infant mortality rates. Using the example of
infant death, the difficulties in “unpacking” the construct of place will be discussed, and a special
emphasis is placed on the interaction of race, place, and disparities in shaping perinatal outcomes.
Finally, readily available and easy-to-use online data resources will be provided so that
obstetricians and gynecologists will be able to assess geographic variation in health indicators and
outcomes in their own localities.
Keywords
disparity; infant mortality rate; preterm birth; social determinant of health
The Institute of Medicine has adopted the definition of population health proposed by
Stoddart and Kindig1 as “the health outcomes of a group of individuals, including the
distribution of such outcomes within the group.” Implicit in this definition is the
understanding that health outcomes at the population level are determined by multiple
individual and societal factors. What is measured as population health outcomes is
ultimately determined by individual decisions about one’s health, interactions with health
care, and the larger social and geopolitical environment across populations. Hence, one
defining characteristic of a population is place. Because characteristics of place vary, it
stands to reason that health outcomes and indicators of populations will vary.
Geography has been defined as “the study of what is where, why there, and why care?”2 The
definition incorporates the phenomenologic “what” to include features that occur in spatial
distribution (natural and cultural); the spatial where incorporates elements of location; the
Corresponding author: William M. Callaghan, MD, MPH. [email protected].
The authors report no conflict of interest.
Presented in a different format at the annual meeting of the American Gynecological and Obstetrical Society in Chicago, IL, Sept. 19, 2013.
HHS Public AccessAuthor manuscriptAm J Obstet Gynecol. Author manuscript; available in PMC 2015 September 01.
Published in final edited form as:Am J Obstet Gynecol. 2014 September ; 211(3): 278–284. doi:10.1016/j.ajog.2014.06.043.
Author M
anuscriptA
uthor Manuscript
Author M
anuscriptA
uthor Manuscript

analytic why there encompasses processes and interrelationships, and the implicational why
care accounts for relevance. The definition is at once descriptive and conceptual and
incorporates the complex context of what we consider as place. This definition provides a
framework for those who are involved in the enterprise of caring for individuals in health
care settings to better understand the individual and the population being served.
It is not surprising that the circumstances that people grow up and live in (an aspect of what
we call geography) have implications for their health. As posited by Frieden3 who used the
construct of a 5-tiered pyramid that depicts the impact of interventions to effect change in
health outcomes, changing the socioeconomic factors and the contexts in which people grow
and live is likely to have the greatest ability to effect change. Disparities in health outcomes
have been well-described.4,5 However, quietly accepting that disparities are immutable will
guarantee only that they persist. For the obstetrician-gynecologist, understanding the
variation in women’s and perinatal health indicators and outcomes for populations is a
necessary first step in moving toward elimination of disparities, which is one of the
overarching goals of the US Department of Health and Human Services’ Healthy People
2020.6 Hence, the aim of this article is to show geographic variation in selected health
indicators and outcomes that are pertinent to the specific interests of obstetricians and
gynecologists by using readily available public data. Most important, the article will provide
interactive resources that are updated consistently so that readers can access the information
that is most important to them and the women they serve.
Examples of geographic variation in outcomes and indicators for
obstetricians and gynecologists
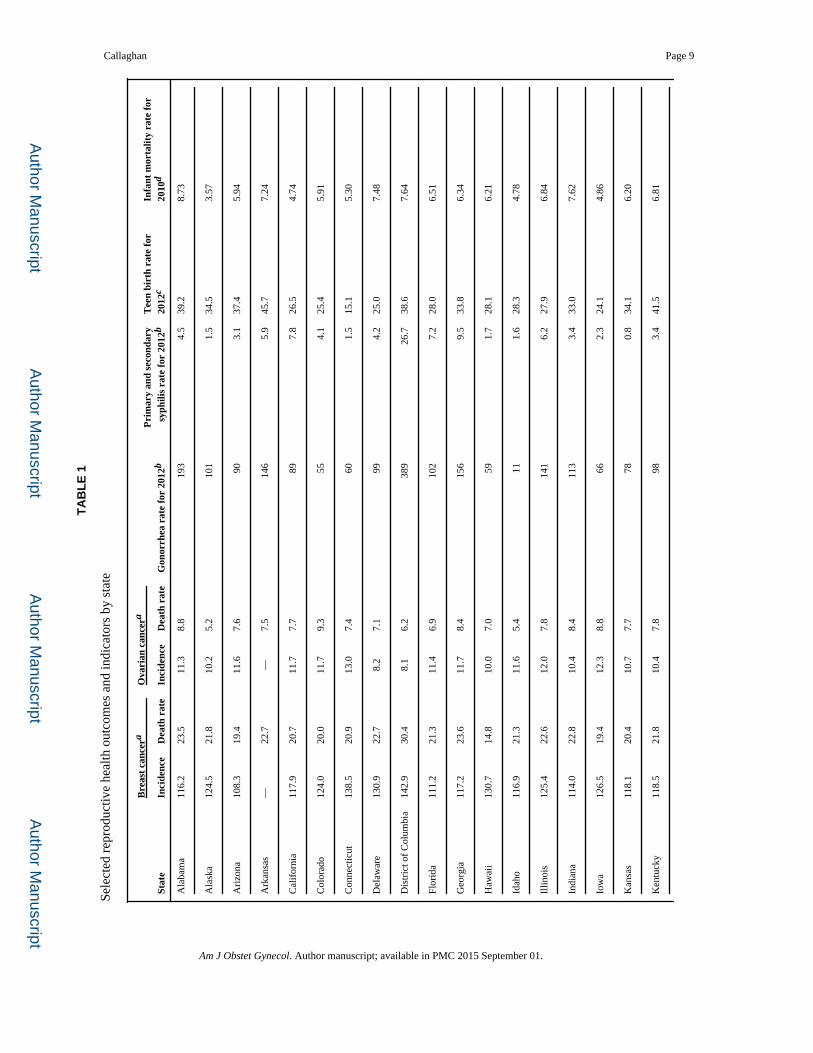
Table 1 shows examples of variation in several outcomes and indicators that are pertinent to
the work of obstetricians and gynecologists. Although there are degrees of variation among
states for different conditions and indicators, it is also important to note that health varies
even within states. For example, although almost all counties in New Mexico (a state with
high teen birth rates) have teen birth rates higher than almost all counties in New Hampshire
(a state with low teen birth rates), there is some overlap of county level rates, and in each
state, there are county pockets with low and high rates relative to other counties.7 Similarly,
states with relatively high rates of gonorrhea and/or syphilis have counties with rates as low
as the lowest overall state rates.8 States with the highest breast cancer incidences do not
necessarily have the highest death rates, as would be expected for a disease incidence highly
dependent on screening access and practices. Ovarian cancer, with its relatively high case
fatality rate, has less difference between incidence and death rates. This can be seen in a
more graphic fashion by accessing the Centers for Disease Control and Prevention’s
interactive cancer atlas.9 Such variation between and within states suggests a level of
complexity of geography and points to the importance of understanding that context on the
local level when caring for women as members of a population.
Preterm birth, infant death, and place
Perinatal health outcomes perhaps provide the starkest examples of geographic variation in
the United States and are likely most familiar to obstetricians and gynecologists. Figures 1
Callaghan Page 2
Am J Obstet Gynecol. Author manuscript; available in PMC 2015 September 01.
Author M
anuscriptA
uthor Manuscript
Author M
anuscriptA
uthor Manuscript

and 2 show the most recent state-level data that are available for preterm birth and infant
mortality rates. Infant death is tied closely to preterm birth; preterm birth is the greatest
contributor to infant death, with most preterm-related deaths occurring among infants who
were born at <32 weeks’ gestation.10 In addition, both preterm birth and infant mortality
rates exhibit long-standing and consistently documented racial and ethnic disparities, most
particularly between black and white women.11,12 Infant mortality rates and variation among
geographic locations likely represent a complex interplay that involves place, race, and
health care. Figure 3 shows infant mortality rates for black and white women for the
aggregate years 2007–2009 in 6 selected states with different population sizes, infant
mortality rates, preterm birth rates, and racial compositions. In spite of the variation, the
black:white gaps in infant mortality rates are relatively consistent, with black women about
twice as likely to have an infant die in the first year of life. Figure 4 shows gestational age-
specific mortality rates for black and white women in these same 6 states. The black:white
gap is considerably smaller and, in many instances, virtually inconsequential or even
reversed at lower gestational ages at which gestational age-specific mortality rates are high.
The black:white gap does not begin to reappear until later gestation at which time the
contribution to overall infant mortality rates becomes smaller. When taken in light of the
proportion of a state population that is black and the variation in preterm birth rates, it
becomes clearer that infant death variation in large measure can be explained by variation in
preterm birth rates; a black infant born at <32 weeks’ gestation in Mississippi (a state with
one of the country’s highest infant mortality rates) has a survival rate as good or better than
states with lower overall infant mortality rates.
Kramer and Hogue13 explored the relationships among geographic location, race/ethnicity,
and very preterm birth (<32 weeks’ gestation). They looked at the distribution of very
preterm births across metropolitan statistical areas for non-Hispanic black, non-Hispanic
white, and Hispanic women. There was little to no overlap in the distributions of very
preterm birth for non-Hispanic white and Hispanic women compared with non-Hispanic
black women; even metropolitan statistical areas with the lowest very preterm birth rates for
non-Hispanic black women had higher rates than nearly all the metropolitan statistical areas
with the highest rates for non-Hispanic white and Hispanic women. Interestingly, however,
there was less variation among metropolitan statistical areas for non-Hispanic white and
Hispanic women where the distributions were narrow and more tightly concentrated about
the means. Conversely, the distributions of very preterm birth for non-Hispanic black
women were broader and flatter, with considerable more variation about the mean. This
suggests that, at least for the outcome of very preterm birth, place may matter more for non-
Hispanic black women than it does for non-Hispanic white or Hispanic women.
Toward a deeper understanding of place
As proposed by Gritzner,2 the context of where we live and practice and where the women
we serve live is complex and has implications for health and health care, as seen by a few
brief examples here. The concept of geography extends beyond the somewhat arbitrary
physical and political boundaries of locality and, in and of itself, can be seen to embrace a
variety of social determinants of health that can be applied to populations that are served by
physicians. Thus, taking advantage of the opportunity to better understand the context
Callaghan Page 3
Am J Obstet Gynecol. Author manuscript; available in PMC 2015 September 01.
Author M
anuscriptA
uthor Manuscript
Author M
anuscriptA
uthor Manuscript
allows for an opportunity to improve the lives of the women who are our patients by
understanding their social context as well as advocating for change that can improve their
lives. Fortunately, there are tools available to explore geographic variation and a variety of
social determinants embedded in the construct of geography. The examples provided herein
are but a small sample of the available health outcomes and contextual variables available to
aid in a deeper understanding of the variation in health and health care experienced by
women across the United States. All of the examples of geographic variability in this article
came from readily accessible materials. Table 2 presents a list of web-based resources that
are readily available for use. Many are interactive and able to be customized for specific
inquiries. The resources range from state and county-level queries of vital statistics data to
more complex queries that address the socioeconomic milieu in which patients live. Clinical
care occurs in a place; knowing something about place and that all places are not equal has
the potential for clinical care and public health to become increasingly connected. Place
does matter, and geography is more than dirt.
Acknowledgments
The findings and conclusions in this report are those of the author and do not necessarily represent the official position of the Centers for Disease Control and Prevention.
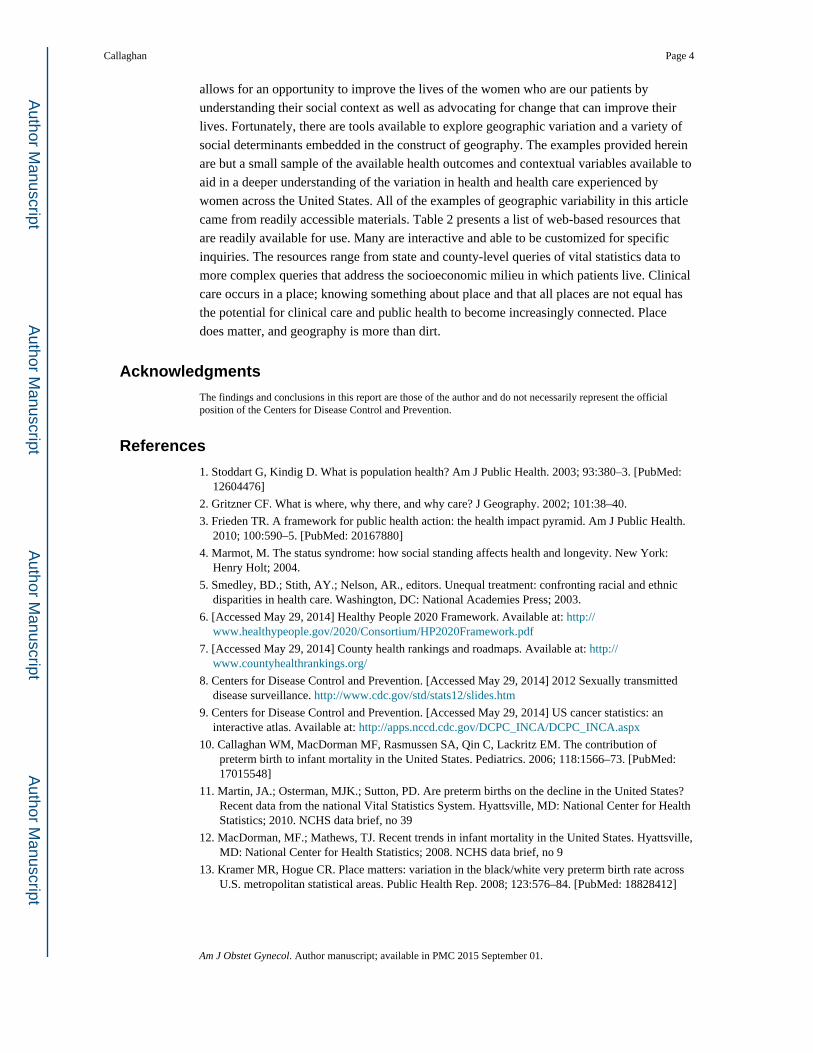
References
1. Stoddart G, Kindig D. What is population health? Am J Public Health. 2003; 93:380–3. [PubMed: 12604476]
2. Gritzner CF. What is where, why there, and why care? J Geography. 2002; 101:38–40.
3. Frieden TR. A framework for public health action: the health impact pyramid. Am J Public Health. 2010; 100:590–5. [PubMed: 20167880]
4. Marmot, M. The status syndrome: how social standing affects health and longevity. New York: Henry Holt; 2004.
5. Smedley, BD.; Stith, AY.; Nelson, AR., editors. Unequal treatment: confronting racial and ethnic disparities in health care. Washington, DC: National Academies Press; 2003.
6. [Accessed May 29, 2014] Healthy People 2020 Framework. Available at: http://www.healthypeople.gov/2020/Consortium/HP2020Framework.pdf
7. [Accessed May 29, 2014] County health rankings and roadmaps. Available at: http://www.countyhealthrankings.org/
8. Centers for Disease Control and Prevention. [Accessed May 29, 2014] 2012 Sexually transmitted disease surveillance. http://www.cdc.gov/std/stats12/slides.htm
9. Centers for Disease Control and Prevention. [Accessed May 29, 2014] US cancer statistics: an interactive atlas. Available at: http://apps.nccd.cdc.gov/DCPC_INCA/DCPC_INCA.aspx
10. Callaghan WM, MacDorman MF, Rasmussen SA, Qin C, Lackritz EM. The contribution of preterm birth to infant mortality in the United States. Pediatrics. 2006; 118:1566–73. [PubMed: 17015548]
11. Martin, JA.; Osterman, MJK.; Sutton, PD. Are preterm births on the decline in the United States? Recent data from the national Vital Statistics System. Hyattsville, MD: National Center for Health Statistics; 2010. NCHS data brief, no 39
12. MacDorman, MF.; Mathews, TJ. Recent trends in infant mortality in the United States. Hyattsville, MD: National Center for Health Statistics; 2008. NCHS data brief, no 9
13. Kramer MR, Hogue CR. Place matters: variation in the black/white very preterm birth rate across U.S. metropolitan statistical areas. Public Health Rep. 2008; 123:576–84. [PubMed: 18828412]
Callaghan Page 4
Am J Obstet Gynecol. Author manuscript; available in PMC 2015 September 01.
Author M
anuscriptA
uthor Manuscript
Author M
anuscriptA
uthor Manuscript

FIGURE 1. Infant mortality rates (deaths per 1000 live births) for the United States, each state, and the District of Columbia, 2010CDC WONDER. Available at: http://wonder.cdc.gov/lbd.html. Accessed May 27, 2014.
Callaghan Page 5
Am J Obstet Gynecol. Author manuscript; available in PMC 2015 September 01.
Author M
anuscriptA
uthor Manuscript
Author M
anuscriptA
uthor Manuscript
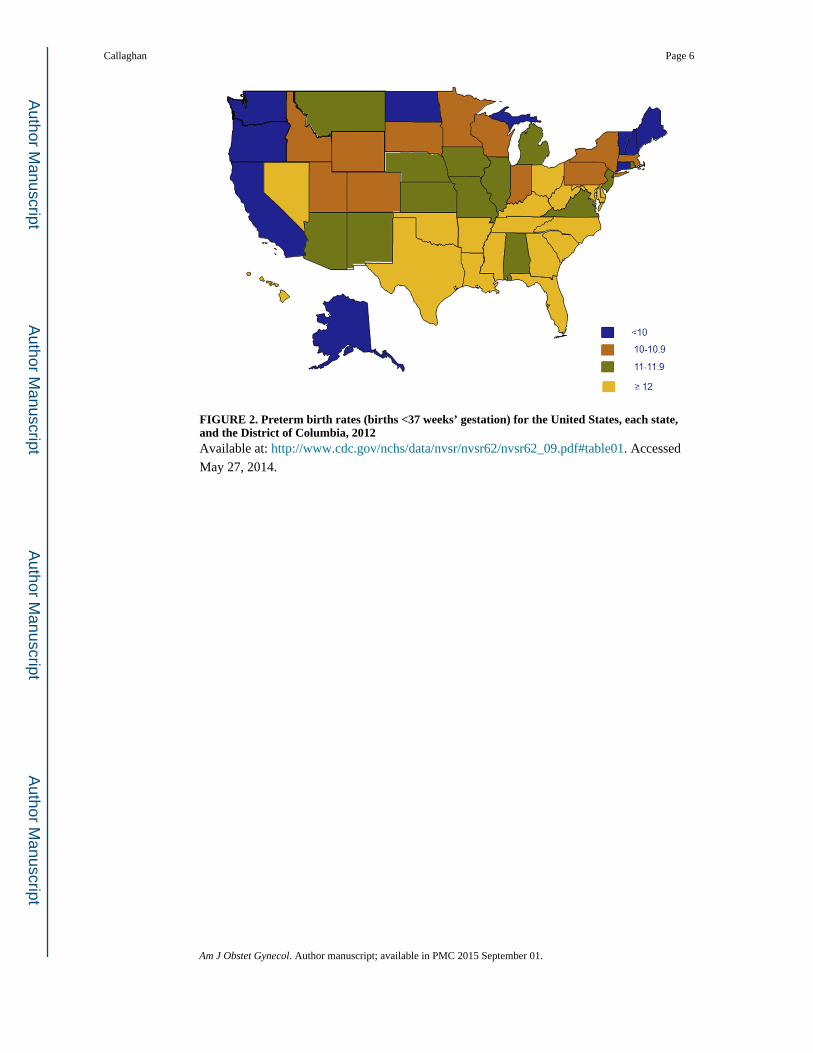
FIGURE 2. Preterm birth rates (births <37 weeks’ gestation) for the United States, each state, and the District of Columbia, 2012Available at: http://www.cdc.gov/nchs/data/nvsr/nvsr62/nvsr62_09.pdf#table01. Accessed
May 27, 2014.
Callaghan Page 6
Am J Obstet Gynecol. Author manuscript; available in PMC 2015 September 01.
Author M
anuscriptA
uthor Manuscript
Author M
anuscriptA
uthor Manuscript

FIGURE 3. Aggregated infant mortality rates (deaths per 1000 live births) for the years 2007–2010 by black and white raceThe black:white ratios are displayed across the top of the chart. (CDC WONDER; Available
at: http://wonder.cdc.gov/lbd.html. Accessed May 29, 2010.)
CA, California; GA, Georgia; MA, Massachusetts; MO, Missouri; MS, Mississippi; OH,
Ohio.
Callaghan Page 7
Am J Obstet Gynecol. Author manuscript; available in PMC 2015 September 01.
Author M
anuscriptA
uthor Manuscript
Author M
anuscriptA
uthor Manuscript

FIGURE 4. Aggregated gestational age-specific infant mortality rates (deaths per 1000 live births) for the years 2007–2010 by black and white raceA, 20–27 weeks of gestation; B, 28–31 weeks of gestation; C, 32–33 weeks of gestation
(Deaths in Massachusetts are too rare to calculate accurate rates.); D, 34–36 weeks of
gestation; E, 37–38 weeks of gestation; F, ≥39 weeks of gestation. (CDC WONDER;
Available at: http://wonder.cdc.gov/lbd.html. Accessed May 29, 2010.)
CA, California; GA, Georgia; MA, Massachusetts; MO, Missouri; MS, Mississippi; OH,
Ohio.
Callaghan Page 8
Am J Obstet Gynecol. Author manuscript; available in PMC 2015 September 01.
Author M
anuscriptA
uthor Manuscript
Author M
anuscriptA
uthor Manuscript
Author M
anuscriptA
uthor Manuscript
Author M
anuscriptA
uthor Manuscript
Callaghan Page 9
TA
BL
E 1
Sele
cted
rep
rodu
ctiv
e he
alth
out
com
es a
nd in
dica
tors
by
stat
e
Stat
e
Bre
ast
canc
era
Ova
rian
can
cera
Gon
orrh
ea r
ate
for
2012
bP
rim
ary
and
seco
ndar
y sy
phili
s ra
te f
or 2
012b
Tee
n bi
rth
rate
for
20
12c
Infa
nt m
orta
lity
rate
for
20
10d
Inci
denc
eD
eath
rat
eIn
cide
nce
Dea
th r
ate
Ala
bam
a11
6.2
23.5
11.3
8.8
193
4.5
39.2
8.73
Ala
ska
124.
521
.810
.25.
210
11.
534
.53.
57
Ari
zona
108.
319
.411
.67.
690
3.1
37.4
5.94
Ark
ansa
s—
22.7
—7.
514
65.
945
.77.
24
Cal
ifor
nia
117.
920
.711
.77.
789
7.8
26.5
4.74
Col
orad
o12
4.0
20.0
11.7
9.3
554.
125
.45.
91
Con
nect
icut
138.
520
.913
.07.
460
1.5
15.1
5.30
Del
awar
e13
0.9
22.7
8.2
7.1
994.
225
.07.
48
Dis
tric
t of
Col
umbi
a14
2.9
30.4
8.1
6.2
389
26.7
38.6
7.64
Flor
ida
111.
221
.311
.46.
910
27.
228
.06.
51
Geo
rgia
117.
223
.611
.78.
415
69.
533
.86.
34
Haw
aii
130.
714
.810
.07.
059
1.7
28.1
6.21
Idah
o11
6.9
21.3
11.6
5.4
111.
628
.34.
78
Illin
ois
125.
422
.612
.07.
814
16.
227
.96.
84
Indi
ana
114.
022
.810
.48.
411
33.
433
.07.
62
Iow
a12
6.5
19.4
12.3
8.8
662.
324
.14.
86
Kan
sas
118.
120
.410
.77.
778
0.8
34.1
6.20
Ken
tuck
y11
8.5
21.8
10.4
7.8
983.
441
.56.
81
Am J Obstet Gynecol. Author manuscript; available in PMC 2015 September 01.

Author M
anuscriptA
uthor Manuscript
Author M
anuscriptA
uthor Manuscript
Callaghan Page 10
Stat
e
Bre
ast
canc
era
Ova
rian
can
cera
Gon
orrh
ea r
ate
for
2012
bP
rim
ary
and
seco
ndar
y sy
phili
s ra
te f
or 2
012b
Tee
n bi
rth
rate
for
20
12c
Infa
nt m
orta
lity
rate
for
20
10d
Inci
denc
eD
eath
rat
eIn
cide
nce
Dea
th r
ate
Lou
isia
na12
1.6
24.6
9.5
7.0
194
7.4
43.1
7.55
Mai
ne12
5.1
20.1
10.6
9.1
341.
319
.45.
40
Mar
ylan
d12
8.7
24.1
10.0
8.2
987.
422
.16.
83
Mas
sach
uset
ts12
5.1
19.1
10.0
7.0
404.
814
.14.
39
Mic
higa
n11
5.6
23.7
12.6
8.4
127
3.0
26.3
7.12
Min
neso
ta—
20.1
—7.
958
2.2
18.5
4.55
Mis
siss
ippi
112.
924
.98.
06.
823
15.
046
.19.
62
Mis
sour
i11
7.4
23.4
10.2
7.4
146
2.6
32.2
6.58
Mon
tana
128.
021
.111
.18.
611
0.2
28.8
5.97
Neb
rask
a11
6.3
19.2
10.4
7.3
780.
426
.85.
25
Nev
ada
108.
123
.68.
57.
083
5.1
33.4
5.51
New
Ham
pshi
re12
7.8
21.7
10.3
7.7
112.
713
.83.
88
New
Jer
sey
124.
723
.213
.48.
585
2.6
16.7
4.80
New
Mex
ico
106.
322
.110
.37.
590
4.9
47.5
5.60
New
Yor
k12
3.6
21.6
12.4
7.7
116
6.3
19.7
5.08
Nor
th C
arol
ina
125.
023
.311
.07.
514
83.
631
.87.
09
Nor
th D
akot
a12
1.2
22.8
11.1
6.7
490.
626
.56.
81
Ohi
o11
2.3
24.0
10.4
8.2
143
3.7
29.8
7.72
Okl
ahom
a11
9.3
24.8
10.5
8.3
117
2.2
47.3
7.49
Ore
gon
124.
422
.911
.09.
138
5.5
23.8
4.96
Am J Obstet Gynecol. Author manuscript; available in PMC 2015 September 01.

Author M
anuscriptA
uthor Manuscript
Author M
anuscriptA
uthor Manuscript
Callaghan Page 11
Stat
e
Bre
ast
canc
era
Ova
rian
can
cera
Gon
orrh
ea r
ate
for
2012
bP
rim
ary
and
seco
ndar
y sy
phili
s ra
te f
or 2
012b
Tee
n bi
rth
rate
for
20
12c
Infa
nt m
orta
lity
rate
for
20
10d
Inci
denc
eD
eath
rat
eIn
cide
nce
Dea
th r
ate
Penn
sylv
ania
124.
723
.312
.98.
212
13.
923
.77.
23
Rho
de I
slan
d11
0.4
19.0
7.7
6.5
484.
219
.97.
16
Sout
h C
arol
ina
119.
422
.59.
48.
016
34.
836
.67.
34
Sout
h D
akot
a10
9.1
19.5
10.0
6.1
862.
233
.37.
11
Ten
ness
ee11
5.7
22.4
11.8
7.9
142
4.2
38.5
7.87
Tex
as10
9.8
20.8
10.6
7.5
127
6.3
44.4
6.15
Uta
h11
0.7
22.2
11.9
7.9
171.
523
.34.
86
Ver
mon
t13
1.9
19.1
14.2
8.9
161.
016
.34.
18
Vir
gini
a11
8.6
22.2
11.3
8.1
853.
522
.96.
83
Was
hing
ton
129.
020
.913
.38.
447
4.4
23.4
4.48
Wes
t Vir
gini
a11
1.1
20.5
12.8
7.5
490.
444
.17.
33
Wis
cons
in11
6.9
21.3
11.9
8.0
821.
621
.95.
84
Wyo
min
g10
7.4
22.3
13.1
9.3
80.
734
.76.
88
a Rat
es a
re p
er 1
00,0
00 p
erso
ns a
nd a
ge a
djus
ted
to th
e 20
00 U
S st
anda
rd p
opul
atio
n: U
S C
ance
r St
atis
tics:
an
inte
ract
ive
atla
s. A
vaila
ble
at: h
ttp://
apps
.ncc
d.cd
c.go
v/D
CPC
_IN
CA
/DC
PC_I
NC
A.a
spx.
A
cces
sed
May
27,
201
4;
b Rep
orte
d ca
ses
per
100,
000
popu
latio
n: 2
012
Sexu
ally
tran
smitt
ed d
isea
ses
surv
eilla
nce.
Ava
ilabl
e at
: http
://w
ww
.cdc
.gov
/std
/sta
ts12
/slid
es.h
tm. A
cces
sed
May
27,
201
4;
c Bir
ths
for
teen
ager
s 15
–19
year
s ol
d pe
r 10
00 e
stim
ated
fem
ale
popu
latio
n 15
–19
year
s ol
d. A
vaila
ble
at: h
ttp://
ww
w.c
dc.g
ov/n
chs/
data
/nvs
r/nv
sr62
/nvs
r62_
09.p
df#t
able
01. A
cces
sed
May
27,
201
4;
d Lin
ked
birt
h/in
fant
dea
th r
ecor
ds; d
eath
s fo
r in
fant
s <
1 ye
ar o
ld p
er 1
000
live
birt
hs. C
DC
WO
ND
ER
. Ava
ilabl
e at
: http
://w
onde
r.cd
c.go
v/lb
d.ht
ml.
Acc
esse
d M
ay 2
7, 2
014.
Am J Obstet Gynecol. Author manuscript; available in PMC 2015 September 01.

Author M
anuscriptA
uthor Manuscript
Author M
anuscriptA
uthor Manuscript
Callaghan Page 12
TABLE 2
Resource list for geographic variation and social determinants of health
The County Health Rankings & Roadmaps program is a collaboration between the Robert Wood Johnson Foundation and the University of Wisconsin Population Health Institute. State-specific county-level measures for health outcomes, health behaviors, social and economic factors are available Available at: http://www.countyhealthrankings.org/#app/massachusetts/2012/measures/factors/14/map
Measure of America is a project of the Social Science Research Council. It provides easy-to-use interactive tool tools for understanding the distribution of well-being, including health outcomes, and opportunity in the United States. Available at: www.measureofamerica.org
CDC Wide-ranging Online Data for Epidemiologic Research (WONDER) is a set of online databases that use a rich ad-hoc query system for the analysis of public health data. It is an easy-to-use, menu-driven system that makes the information resources of the Centers for Disease Control and Prevention (CDC) available to public health professionals and the public at large. The site is particularly useful for state-level birth and infant death data. Available at: http://wonder.cdc.gov/
Sortable Stats is an interactive data set comprised of behavioral risk factors and health indicators. This data set compiles state level data for the 50 states, the District of Columbia, and the US territories from various published CDC and federal sources into a format that allows users to view, sort, and analyze data at state, regional, and national levels. Available at: http://wwwn.cdc.gov/sortablestats/
Cancer Rates by State is an interactive atlas that depicts state-specific incidence and death rates for major types of cancer. Most pertinent to obstetricians and gynecologists are rates for breast, cervical, ovarian, and uterine cancers. Available at: http://apps.nccd.cdc.gov/DCPC_INCA/DCPC_INCA.aspx
Sexually Transmitted Diseases Surveillance is slide sets for US sexually transmitted disease surveillance that includes maps with state-specific rates. The most recent year available is 2012. As subsequent years become available, the “stats12” portion of the URL changes to the most recent available year (eg, when 2013 data are available, stats12 will need to be replaced by stats13). Available at: http://www.cdc.gov/std/stats12/slides.htm
The Equality of Opportunity Project presents geographic trends and variation in upward economic mobility. Available at: http://www.equality-of-opportunity.org/
CDC’s Pregnancy Risk Assessment Monitoring System (PRAMS) Online Data for Epidemiologic Research (CPONDER) is an interactive data base that indexes 195 variables by topic for selection as outcome variables. Analyses may be for a single state and year, for a single state and all available years, or for all available states and a single year. Available at: http://www.cdc.gov/prams/cponder.htm
VitalStats is a collection of vital statistics products that allow users to access prebuilt tables and reports or to build their own tables with the vital statistics data. Data are available at state, national, and large county (population > 100,000) levels. Available at: http://www.cdc.gov/nchs/VitalStats.htm
PeriStats is an interactive site that was developed by the March of Dimes Perinatal Data Center. PeriStats provides free access to maternal and infant health-related data at the United States, state, county, and city level. Available at: http://www.marchofdimes.com/peristats/Peristats.aspx
CDC Social Determinants of Health provides resources, publications, and definitions that address opportunities and barriers to promote and attain health equity. Available at: http://www.cdc.gov/socialdeterminants/Index.html
Am J Obstet Gynecol. Author manuscript; available in PMC 2015 September 01.