Embed Size (px)
Citation preview


William S. Durr Practice Groups Agribusiness Alcoholic Beverage Law Business Litigation Construction Family Law Litigation Privacy and Information Security Law Practice Concentrations Agribusiness Litigation Business Litigation Commercial Litigation Equitable Distribution

Tom Tveidt Research Economist SYNEVA Economics, LLC

Construction Industry Western North Carolina Economic
Update
Tom Tveidt
Research Economist
2014 CONSTRUCTION CONFERENCE
October 2, 2014 Asheville NC 4
Local Construction Industry
Local Building Permit Activity/Housing Market
Local Underlying Drivers
5

Western NC Construction Employment
Source: NC Department of Commerce
Construction of Buildings
Heavy & Civil Engineering Construction
Specialty Trade Contractors
0
2,000
4,000
6,000
8,000
10,000
12,000
14,000
16,000
2004 2005 2006 2007 2008 2009 2010 2011 2012 2013 2014
6

Western NC Annual Construction Employment Change
Source: NC Department of Commerce
Construction of Buildings
Heavy & Civil Engineering Construction
Specialty Trade Contractors
(3,000)
(2,500)
(2,000)
(1,500)
(1,000)
(500)
0
500
1,000
1,500
2,000
2005 2006 2007 2008 2009 2010 2011 2012 2013 2014
7

Western NC Construction Establishments
Source: NC Department of Commerce
Construction of Buildings
Heavy and Civil Engineering Construction
Specialty Trade Contractors
0
500
1,000
1,500
2,000
2,500
2004 2005 2006 2007 2008 2009 2010 2011 2012 2013 2014
8

Asheville Metro Construction Employment
Source: NC Department of Commerce
Construction of Buildings
Heavy and Civil Engineering Construction
Specialty Trade Contractors
0
1,000
2,000
3,000
4,000
5,000
6,000
7,000
2004 2005 2006 2007 2008 2009 2010 2011 2012 2013 2014
9

Asheville Metro Annual Construction Employment Change
Source: NC Department of Commerce
Construction of Buildings
Heavy and Civil Engineering Construction
Specialty Trade Contractors
(1,500)
(1,000)
(500)
0
500
1,000
1,500
2005 2006 2007 2008 2009 2010 2011 2012 2013 2014
10
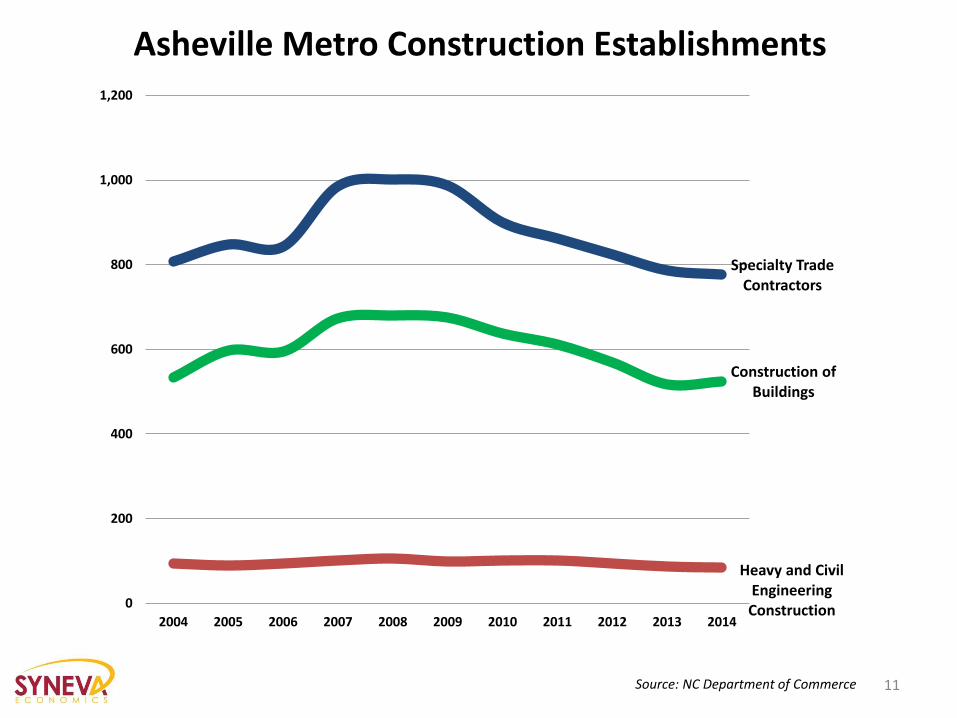
Asheville Metro Construction Establishments
Source: NC Department of Commerce
Construction of Buildings
Heavy and Civil Engineering Construction
Specialty Trade Contractors
0
200
400
600
800
1,000
1,200
2004 2005 2006 2007 2008 2009 2010 2011 2012 2013 2014
11

Asheville Metro Construction Employment by Firm Size
Source: US Census Bureau
0-19 Employees
20-49 Employees
500+ Employees
50-249 Employees
0
1,000
2,000
3,000
4,000
5,000
6,000
7,000
2003 2004 2005 2006 2007 2008 2009 2010 2011 2012 2013
12

Asheville Metro Self-Employment By Industry
Source: US Census Bureau
Construction
Retail trade
Real estate
Professional, scientific & technical services
Administrative services
Health care Arts, entertainment, and
recreation
Personal services, repair & maintenance
0
1,000
2,000
3,000
4,000
5,000
6,000
7,000
8,000
20122011201020092008200720062005200420032002
13

Asheville Metro Construction Employment By Age
Source: US Census Bureau
35-4445-5425-34
55-64
14-24
65+
0
500
1,000
1,500
2,000
2,500
3,000
2003 2004 2005 2006 2007 2008 2009 2010 2011 2012 2013
14

Asheville Metro New-Hires Percent of Employment
Source: US Census Bureau
All Industries
Construction
10%
12%
14%
16%
18%
20%
22%
24%
2003 2004 2005 2006 2007 2008 2009 2010 2011 2012 2013
15

Local Building Permit Activity/Housing Market
16

$0
$10,000
$20,000
$30,000
$40,000
$50,000
$60,000
$70,000
$80,000
$90,000
$100,000
0
100
200
300
400
500
600
1Q 2Q 3Q 4Q 1Q 2Q 3Q 4Q 1Q 2Q 3Q 4Q 1Q 2Q 3Q 4Q 1Q 2Q 3Q 4Q 1Q 2Q
2009 2010 2011 2012 2013 2014
Tota
l Val
ue
Tota
l Un
its
Single Family Units Multi Family Units Total Value ($1,000's)
Asheville Metro Residential Building Permits
Source: US Census Bureau 17
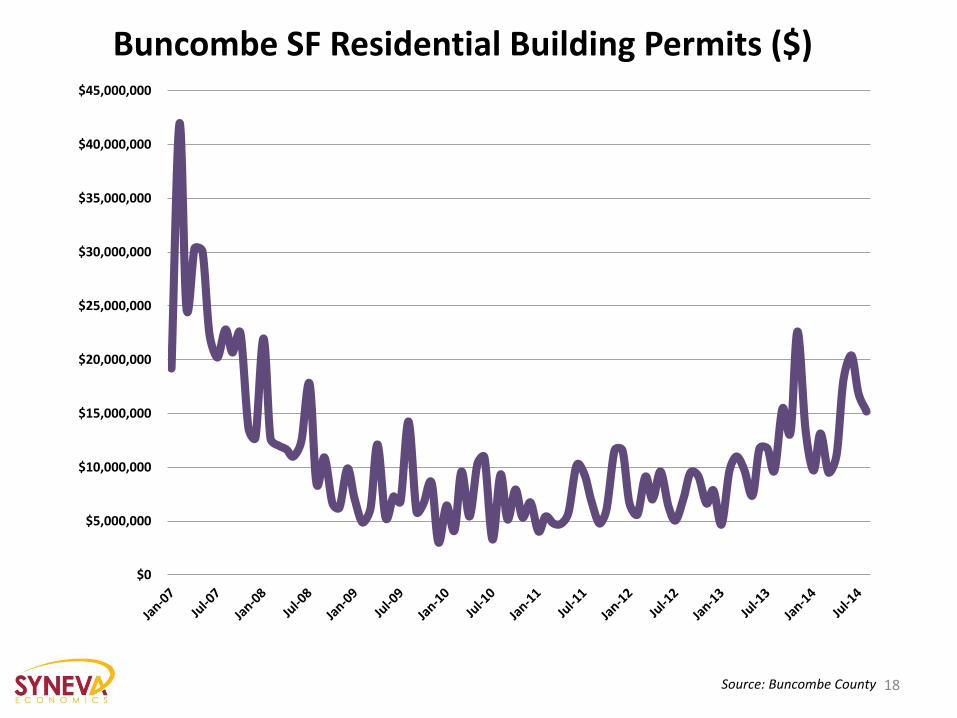
Buncombe SF Residential Building Permits ($)
Source: Buncombe County
$0
$5,000,000
$10,000,000
$15,000,000
$20,000,000
$25,000,000
$30,000,000
$35,000,000
$40,000,000
$45,000,000
18

Buncombe SF Residential Building Permits ($) 3MMA Annual Change
Source: Buncombe County
($20,000,000)
($15,000,000)
($10,000,000)
($5,000,000)
$0
$5,000,000
$10,000,000
Mar-08 Sep-08 Mar-09 Sep-09 Mar-10 Sep-10 Mar-11 Sep-11 Mar-12 Sep-12 Mar-13 Sep-13 Mar-14
19
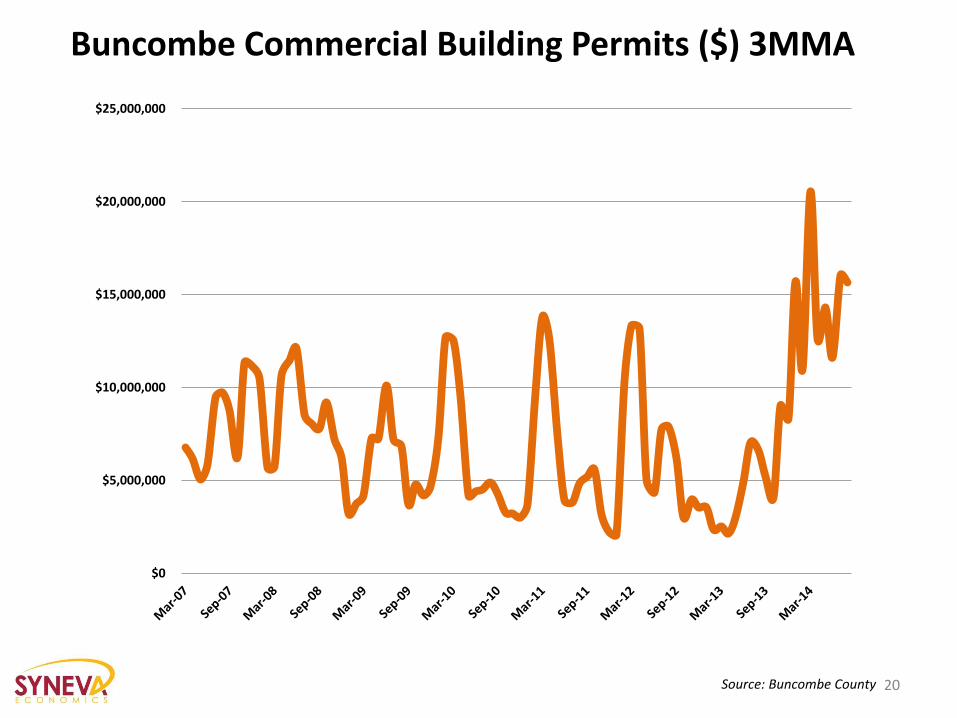
Buncombe Commercial Building Permits ($) 3MMA
Source: Buncombe County
$0
$5,000,000
$10,000,000
$15,000,000
$20,000,000
$25,000,000
20
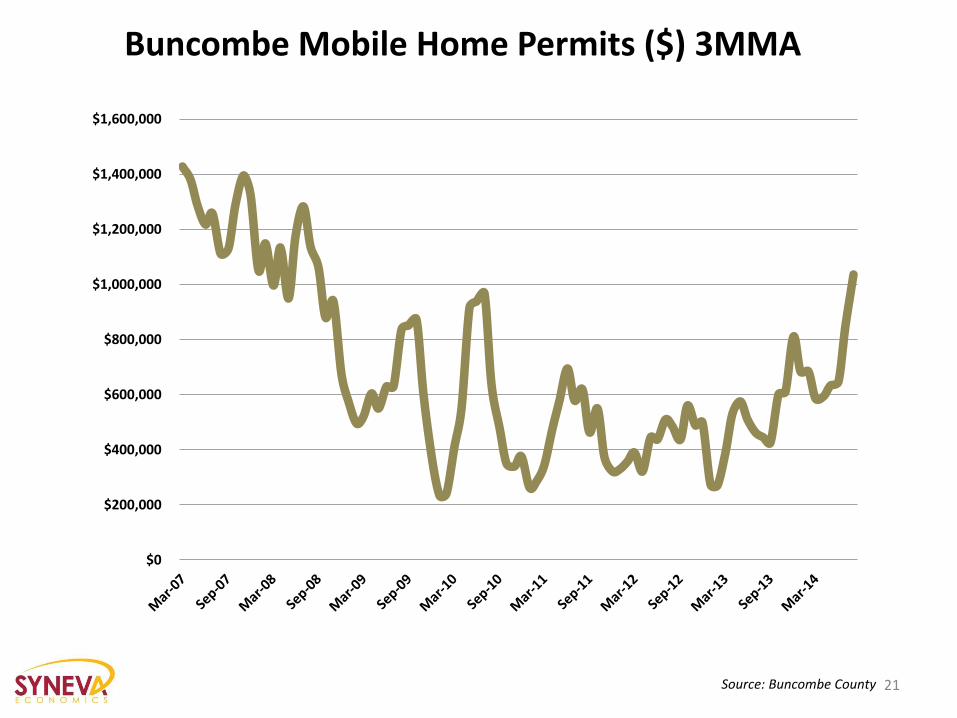
Buncombe Mobile Home Permits ($) 3MMA
Source: Buncombe County
$0
$200,000
$400,000
$600,000
$800,000
$1,000,000
$1,200,000
$1,400,000
$1,600,000
21

Asheville Area Existing Home Sales
Source: NC REALTORS
$0
$50,000
$100,000
$150,000
$200,000
$250,000
$300,000
$350,000
0
200
400
600
800
1,000
1,200
2000 2001 2002 2003 2004 2005 2006 2007 2008 2009 2010 2011 2012 2013 2014
Homes Sold Average Sales Price
22

Asheville Area Existing Home Sales Percent Change
Source: NC REALTORS
-26%
-27%
-25%
-37%
-32%-29%
0%
37%
11%
40%
-17%
-22%
-13%
26%
18%
27%
16% 15%
28% 29%27%
21%19%
-4%-4%
-7%-10%
-1%
2%
-4%
-11%
-6%
-11%
-7%
0%-1%
-6% -6% -6%-4%
4%
9%
2%
-2% -3%
2%
17%
3%
7% 7%
-50%
-40%
-30%
-20%
-10%
0%
10%
20%
30%
40%
50%
1Q 2Q 3Q 4Q 1Q 2Q 3Q 4Q 1Q 2Q 3Q 4Q 1Q 2Q 3Q 4Q 1Q 2Q 3Q 4Q 1Q 2Q 3Q 4Q 1Q 2Q
2008 2009 2010 2011 2012 2013 2014
Homes Sold Average Sales Price
23

Median Home Value-NC Urban Areas
Source: Zillow
Asheville
$50,000
$100,000
$150,000
$200,000
$250,000
$300,000
24

Median Home Value Per Sq. Ft.-NC Urban Areas
Source: Zillow
Asheville
$40
$45
$50
$55
$60
$65
$70
$75
$80
$85
$90
2011 2012 2013 2014
25

NAHB/Wells Fargo Housing Opportunity Index
Source: NAHB
Nation
Asheville
30
35
40
45
50
55
60
65
70
75
80
2004 2005 2006 2007 2008 2009 2010 2011 2012 2013 2014
26
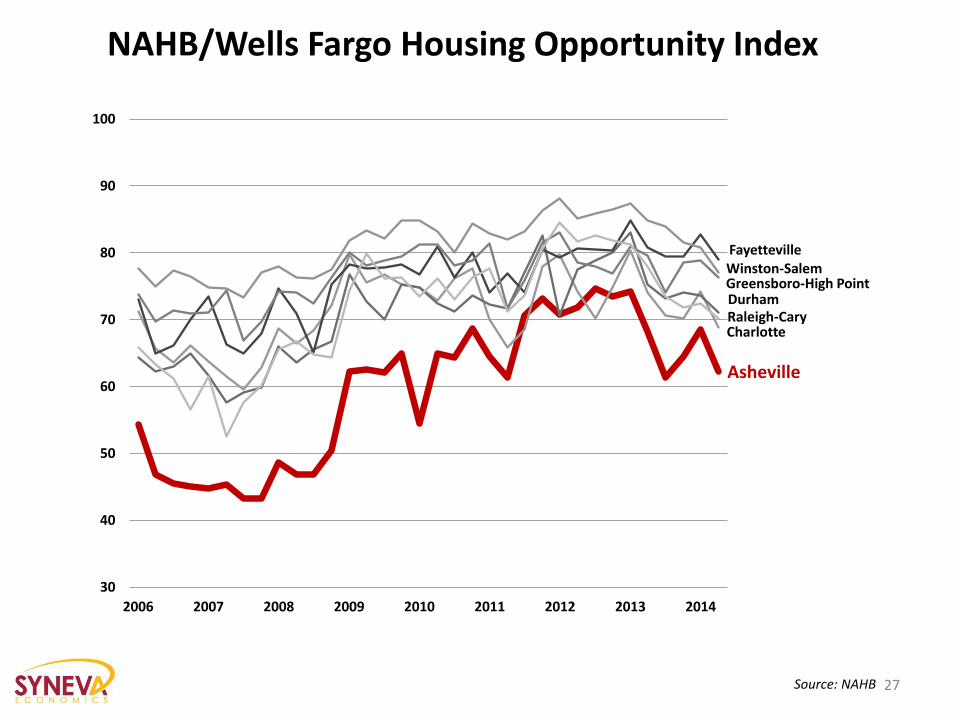
NAHB/Wells Fargo Housing Opportunity Index
Source: NAHB
Asheville
Charlotte
Durham
Fayetteville
Greensboro-High Point
Raleigh-Cary
Winston-Salem
30
40
50
60
70
80
90
100
2006 2007 2008 2009 2010 2011 2012 2013 2014
27

Asheville Metro Foreclosures
Source: NC Administrative Office of the Courts
0
500
1,000
1,500
2,000
2,500
3,000
1998 2001 2004 2007 2010 2013
Buncombe
Haywood
Henderson
Madison
28
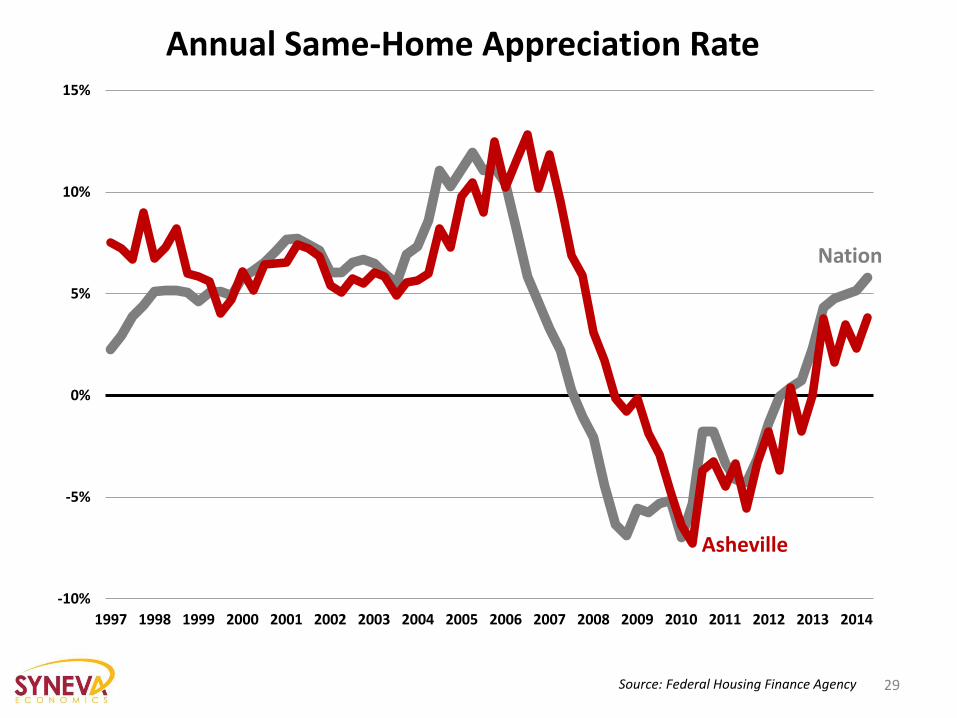
Annual Same-Home Appreciation Rate
Source: Federal Housing Finance Agency
Nation
Asheville
-10%
-5%
0%
5%
10%
15%
1997 1998 1999 2000 2001 2002 2003 2004 2005 2006 2007 2008 2009 2010 2011 2012 2013 2014
29
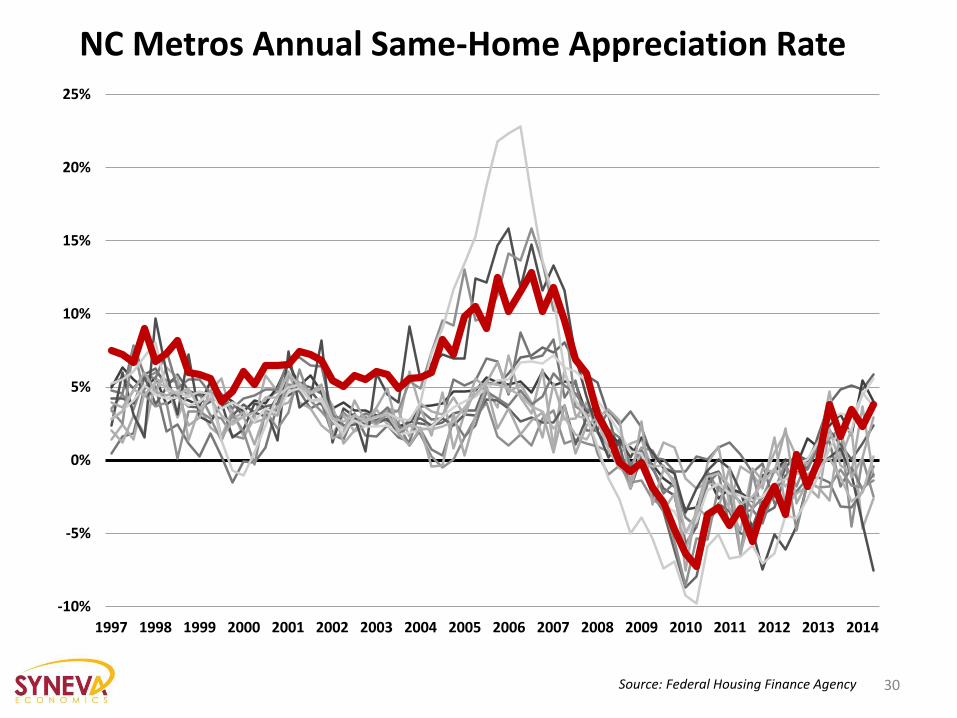
NC Metros Annual Same-Home Appreciation Rate
Source: Federal Housing Finance Agency
-10%
-5%
0%
5%
10%
15%
20%
25%
1997 1998 1999 2000 2001 2002 2003 2004 2005 2006 2007 2008 2009 2010 2011 2012 2013 2014
30

Local Underlying Drivers
31

Annual Population Growth Rate
Source: US Census Bureau
North Carolina
Nation
Asheville
0.5%
1.0%
1.5%
2.0%
2.5%
1990 1992 1994 1996 1998 2000 2002 2004 2006 2008 2010 2012
32

Asheville Metro Sources of Population Change
Source: US Census Bureau
(500)
500
1,500
2,500
3,500
4,500
5,500
6,500
7,500
2005 2006 2007 2008 2009 2011 2012
Natural International Domestic
33

NC Metros-2012-2013 Net-Domestic Population Change
Source: US Census Bureau
(3,951)
(2,122)
(2,012)
(941)
(607)
(542)
124
329
836
1,005
3,803
4,064
4,975
12,992
21,382
Jacksonville
Fayetteville
New Bern
Rocky Mount
Hickory
Goldsboro
Greenville
Burlington
Winston-Salem
Greensboro-High Point
Durham-Chapel Hill
Wilmington
Asheville
Raleigh
Charlotte
34

Monthly Percent Employment Change (Year-Year)
Source: NC Department of Commerce
-8%
-6%
-4%
-2%
0%
2%
4%
6%
2007 2008 2009 2010 2011 2012 2013 2014
Asheville
North Carolina
United States
35

Asheville Metro Industry Employment Change 2010-2014
Source: NC Department of Commerce
(3,000) (2,000) (1,000) 0 1,000 2,000 3,000 4,000 5,000
Government
Construction
Information
Financial Activities
Wholesale Trade
Retail Trade
Manufacturing
Health Services
Leisure & Hospitality Services
Professional & Business Services
36

Average Weekly Wage
Source: NC Department of Commerce
Nation
Asheville
North Carolina
$400
$500
$600
$700
$800
$900
$1,000
$1,100
2001 2002 2003 2004 2005 2006 2007 2008 2009 2010 2011 2012 2013 2014
37

Gross Domestic Product
Source: US Bureau of Economic Analysis
$36,078
$0 $10,000 $20,000 $30,000 $40,000 $50,000 $60,000 $70,000 $80,000
Durham-Chapel Hill
Charlotte
Raleigh
Greensboro-High Point
Fayetteville
Wilmington
Rocky Mount
Jacksonville
Winston-Salem
Greenville
New Bern
Asheville
Hickory
Goldsboro
Burlington Per Capita GDPNorth Carolina Metros
2013
38

Some Observations
After hard hit, construction industry shows early signs of
recovery
Uptick in permit activity, commercial & residential
Home unit sales mostly stable
Home prices, slowly recovering
Home affordability tension remains
Positive home appreciation returns
39
Some Observations
Population growth stable, strong
Domestic in-migration dominates
Steady employment growth
Wages & wage growth lags
40

41
Tom Tveidt Research Economist SYNEVA Economics [email protected] www.syneva.com
828.734.5021
Questions?

Getting Paid for Services Performed: The Lien Law and Beyond
M. Charles Cloninger Ward and Smith, P.A.
Merrill G. Jones, II Ward and Smith, P.A.
Lance P. Martin Ward and Smith, P.A.


How to Retain Key Employees
Michael L. Miller Ward and Smith, P.A.
Rendi L. Mann-Stadt Ward and Smith, P.A.

What Options Do I Have to Incentivize an Employee to Stay?
• Bonus (Money Talks!)
• Equity Interests (Restricted Stock)
• Stock Options
• Deferred Compensation (Qualified and Nonqualified)
45

Restricted Stock
• It is an outright grant of a certain amount of stock to the employee, subject to certain conditions. Most common conditions are:
– Vesting schedule (i.e. employee owns 20% in year 1, another 20% in year 2, and so on)
– Voting versus non-voting stock
– Subject to an irrevocable proxy
– Restrictions on transfer / buyback provisions
46

Tax Implications of Restricted Stock
• Employee has to pay taxes on the grant – no way around that.
• Can pay taxes on the entire amount of the stock on the date of the grant,
OR can pay taxes as stock vests. May be better to pay taxes on full grant
now, if stock expected to go up in value!
• All taxed at ordinary income, but pay it now or pay it on the amount the
stock has appreciated between the grant date and vesting date. Most
folks choose to pay now since that should be the lower amount if stock
appreciates. Good for startup companies where the only way for the
stock price to go is up.
47

Advantages to Granting Restricted Stock
• No cash outlay for the shares by the employee, except for the taxes to be paid thereon; and,
• No cash outlay for the shares by the company.
48

Disadvantages to Granting Restricted Stock
• Employee may not have the money to pay the taxes on the stock received;
• May be difficult to assess the fair market value of each share received for tax purposes;
• If voting shares are granted, the percentage owned by current shareholders would be diluted; and
• If non-voting shares are granted, there are some limited instances under North Carolina law where even non-voting shares may have certain voting rights.
49

Stock Options
• It is an option for an employee to purchase an ownership interest in the employer at a particular price that is set by the employer. Two types of stock options:
– Incentive Stock Options
– Non-Qualified Stock Options
• Analogous concept exists in LLCs, but we will stick to discussion of stock options in a corporation.
50
Incentive vs. Non-Qualified
Incentive:
• The option price must at least equal the fair market value of the stock at the time of grant;
• Generally speaking, the option is not transferable, except at death;
• $100,000 limit on the aggregate fair market value of stock which may be acquired by any employee during any calendar year. Also not taxable at exercise;
• The options must be exercised within 10 years of grant;
• The options must be exercised within three months of termination of employment (extended to one year for disability, with no time limit in the case of death); and,
• Gain or loss on the sale of the stock will be long-term capital gain or loss if held for at least 1 year from exercise and 2 years from grant. Gain or loss is the difference between the amount realized from the sale and the tax basis (i.e., the amount paid on exercise).
51

Incentive vs. Non-Qualified (cont.)
Non-Qualified:
• May be issued to anybody;
• Taxable at ordinary income upon exercise, and is subject to income and employment tax withholding. No AMT consequences; and,
• The difference between the value of the stock at exercise and the exercise price is taxed to holder as ordinary income.
52

Advantages to Issuing Stock Options
• Once exercised, the holder has an ownership interest in the company, making him/her invested in the success of the company;
• No holding or other real limitations for non-qualified stock options;
• No cash outlay at any time by the company. Builds loyalty without having to use cash to pay for it; and,
• Any amounts paid to the employee in connection with the exercise of the option are deductible by the company as an expense.
53

Disadvantages to Issuing Stock Options
• The percentage of the company owned by current shareholders is diluted and, if voting shares are issued, the control of the company by the current shareholders also is diluted;
• Non-qualified stock options have tax payments all the way through for holder – at exercise and sale, but spread on the exercise is deductible to the company;
• The holder may not have the cash to exercise the option and buy the shares or to pay the taxes associated with the purchase. Cashless exercise is an option, but not always practical;
• Possible AMT issues for incentive stock options; and,
• May be difficult to assess the fair market value of each share received for tax purposes.
54

What is Deferred Compensation?
A deferred compensation arrangement is any plan, program, or agreement under which an employer promises to pay an amount to an employee at some future date for the employee's past, present, or future services.
55
Qualified Plans
A deferred compensation plan is "qualified" if it satisfies the numerous statutory requirements of Internal Revenue Code
§401(a):
• Coverage and Discrimination
• Vesting of Benefits
• Funding of Benefits
56

Qualified Plans – Tax Treatment
• Employee – recognition of income when receive distribution from the plan.
• Employer – deduction allowed when contributions are made to the plan.
57

Nonqualified Plans – Tax Treatment
• Employee – recognition of income when receive distribution from the plan.
• Employer – deduction allowed when income is recognized by the employee.
58

Examples of Nonqualified Deferred Compensation Arrangements
• Supplemental Executive Retirement Plans • Equity Awards • Employment Agreements • Bonus Plans • Change in Control Agreements • Tax Gross-Up Payments • Expense Reimbursements • Phantom Stock Plans
59

Phantom Stock
• Phantom stock gives the holder only the economic benefits the holder would enjoy if the holder owned a certain number of shares of the company, without the company actually issuing any shares. Most often given to employees, but can be given to non-employees.
• Holder gets no stock and holds no voting rights.
• Phantom stock generally are structured to vest over time, and can be paid dividends.
60

Triggering Events for Phantom Stock
Biggest decision is when payment of the phantom stock should be triggered:
• Company Sale
• Holder Performance
• Achievement of Company Goals
• Liquidation
• Retirement
• After XX number of years with the company
• Death/Disability of Holder
61

Advantages to Phantom Stock
• Any amounts paid to holder are deductible as an ordinary expense by the company;
• No cash outlay by the company until triggering event occurs;
• No voting rights held by phantom stock holders;
• For the holder, if a dividend is paid on the company's stock or a stock split occurs, it can be structured where the employee gets such dividend or stock split on phantom shares; and,
• No initial cash outlay for the employee.
62

Disadvantages to Phantom Stock
• When the cash is paid on the phantom shares, holder is taxed at ordinary income rate; and,
• Company may not have the cash to pay immediately upon a triggering event (especially if payable upon a holder's death or disability). Can structure a payout over time if needed.
63

Phantom Stock Example
• In 2009, Company A grants an employee 100 shares of phantom stock valued at the grant date at $10 per share.
• The phantom stock vests at a rate of 20 shares per year over five years, and the employee's rights in the phantom stock terminate upon the employee's death, retirement, or termination from the company.
64

Phantom Stock Example (cont.)
In 2012, the employee retires. Employee is vested in 60 shares of phantom stock at the time of retirement. In 2012, the actual stock of Company A is worth $20 per share, and the employee receives the difference in the grant price versus the 2012 price as follows: $20 Company A stock price in 2012 -$10 Value of Company A stock at 2009 grant date $10 x 60 Number of shares vested in 2012
TOTAL $600
Owed to the employee and for which employee pays taxes.
65

Nonqualified Deferred Compensation Plans
The American Jobs Creation Act of 2004 significantly changed the rules governing nonqualified deferred compensation ("NQDC") plans by adding Section 409A to the Internal Revenue Code.
66

What are the Requirements?
• Funding Restrictions
• Election Restrictions
• Distribution Restrictions*
• Reporting Requirements
• Written Plan Requirements*
*The two requirements most likely to raise issues.
67

Distribution Restrictions
A NQDC plan that is subject to Section 409A must provide that distributions only may be made upon the occurrence of six specified events:
• Separation from service;
• Disability;
• Death;
• A specified time or pursuant to a fixed schedule;
• A change in control; or,
• An unforeseeable emergency.
68
Written Plan Requirement
• Must be in writing
• Include material terms
• Amount of deferred compensation (or formula to determine amount)
– Time and form of payment
– Conditions of deferral elections (if any)
• Must operate in compliance with the written terms and the Section 409A rules.
69

Exemptions from Section 409A
• Short-term deferrals
• Severance Arrangements
70

Short-Term Deferrals (2½ month rule)
Exemption for payments made no later than 2½ months after the end of the year in which the right to the payment vests
– Look to provisions of the agreement
71
Severance Arrangements
A severance arrangement is not subject to Section 409A, if the following conditions are met:
• Payments only can be made upon an involuntary separation from service or good reason separation.
• The payments do not exceed twice the lesser of (1) the employee's annual compensation for the year immediately preceding the year of termination; or (2) the Section 401(a)(17) compensation limit ($260,000 for 2014).
• The payments are made no later than the end of the second calendar year after the year in which the employee terminates employment.
72

Consequences for Failure to Comply (Harsh Results for the Employee)
• Immediate income inclusion
• 20% Penalty
• Interest
73
EXAMPLE
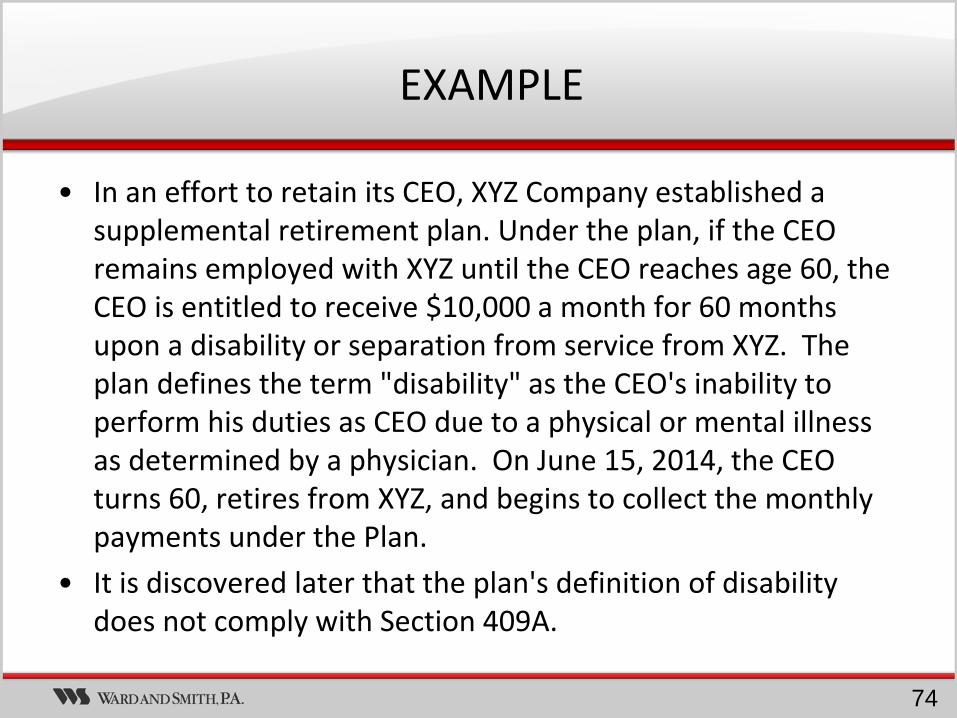
• In an effort to retain its CEO, XYZ Company established a supplemental retirement plan. Under the plan, if the CEO remains employed with XYZ until the CEO reaches age 60, the CEO is entitled to receive $10,000 a month for 60 months upon a disability or separation from service from XYZ. The plan defines the term "disability" as the CEO's inability to perform his duties as CEO due to a physical or mental illness as determined by a physician. On June 15, 2014, the CEO turns 60, retires from XYZ, and begins to collect the monthly payments under the Plan.
• It is discovered later that the plan's definition of disability does not comply with Section 409A.
74

EXAMPLE (cont.)
• Although the payments were triggered by the CEO's separation from service and not as a result of a disability, the former CEO will be subject to the "triple tax" because of the plan's noncompliant definition of "disability."
• As a result, in 2014 (the year the deferred compensation vests), the former CEO must pay (i) tax on the entire deferred amount of $600,000 ($10,000 x 60 months); (ii) an additional excise tax of $120,000 ($600,000 x 20% penalty); and (iii) interest.
75

Restrictive Covenants As An Employee Retention Tool
Types of Restrictive Covenants:
Covenants Not to Compete
Covenants of Non-Solicitation
Cost Share Agreements** (**Similar goals, but not really a restrictive covenant.)
76

Enforceability of Covenant
Is the restrictive covenant enforceable?
1. Cannot stop reasonable competition; can only limit unfair competition
2. What do you truly need to protect?
– Employees
– Customers
– Information
3. Tailor restrictions to address protection you truly need
– Janitor argument
77

Enforceable Non-Compete Provisions
A covenant not to compete prevents or bars the individual from working in a specific geographic
area for a specified period of time.
HOWEVER, LESS MAY BE MORE!
Overreaching covenants may be unenforceable.
78
Time and Distance
– Time
Rarely more than 3 years, absent
extenuating circumstances
– Geographic Scope
Be mindful of actual competitive market,
avoid the mere hopeful
Courts consider time and geographic restrictions together.
79

Top 3 Takeaways
1. Verify adequate consideration exists
a. At or near beginning of employment.
b. Benefit or money that would not otherwise be owed.
2. Don't be greedy or unreasonable.
3. Carefully craft restrictions to increase the likelihood of enforceability.
80

What is a "Cost Share"?
81

Cost Sharing
• Preset amount that an individual is required to pay in the event of a failure to keep a contractual promise.
• The amount of damages are agreed upon at the time the parties enter the contract and must be based upon a reasonable attempt by the parties to determine in advance the amount of actual damages.
82

Misclassification of Independent Contractors
News & Observer Series:
"Contract to Cheat"
83

Why it Matters
• IRS and DOL have identified misclassification as major focus and construction industry as specific target
• Will also have NCDES implications
• Congress continues to push legislation
• Significant risk of liability including payroll taxes and wage-hour violations
84

How Do You Know?
• Multi-factor tests
• Major indicators:
–Economic realities
–Control
85

If it quacks. . . . .
86

Best Practices for Working with Independent Contractors
1. Be honest with yourself.
2. Do business with entities, not individuals.
3. When possible, pay on a project basis (not hourly or salary).
4. Require invoices and pay as a vendor (not through payroll).
5. Do not provide benefits.
6. Do not provide tools, uniforms, etc.
7. Require contractor to cover own expenses/overhead.
8. Require contractor to be responsible for taxes, wage compliance, etc.
9. Give contractor control over schedule, method of performing work, etc.
10. Enter into formal agreement that confirms all of the above and includes indemnification.
87

Dave Simpson NC Government Relations and Building Division Carolinas Association of General Contractors