Embed Size (px)
Citation preview
DNV GL © 2014 09 April 2018 SAFER, SMARTER, GREENERDNV GL © 2014
09 April 2018
ENERGY
Wind Farm Blockage: Searching for Suitable Validation Data
1
James Bleeg, Mark Purcell, Renzo Ruisi, and Elizabeth Traiger
DNV GL © 2014 09 April 2018
Wind turbine interaction and energy production
2
• Fluid dynamic interaction between wind farm turbines changes the power
production at each turbine relative to what it would produce in isolation
• The effect can be large and must be accounted for in energy production
assessments (EPAs)
• The energy production change due to turbine interaction is usually called
a “wake loss” because…
DNV GL © 2014 09 April 2018
The wakes-only approach to turbine interaction
3
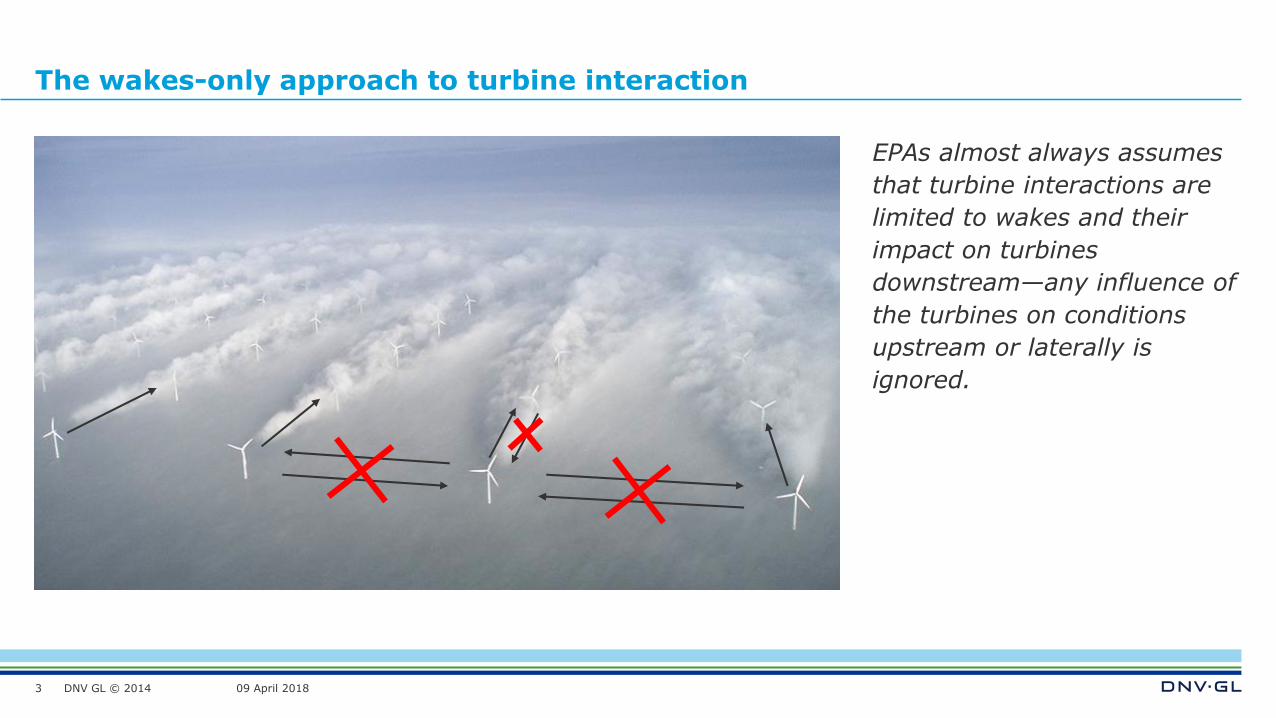
EPAs almost always assumes
that turbine interactions are
limited to wakes and their
impact on turbines
downstream—any influence of
the turbines on conditions
upstream or laterally is
ignored.
DNV GL © 2014 09 April 2018
The wakes-only approach to turbine interaction (continued)
4
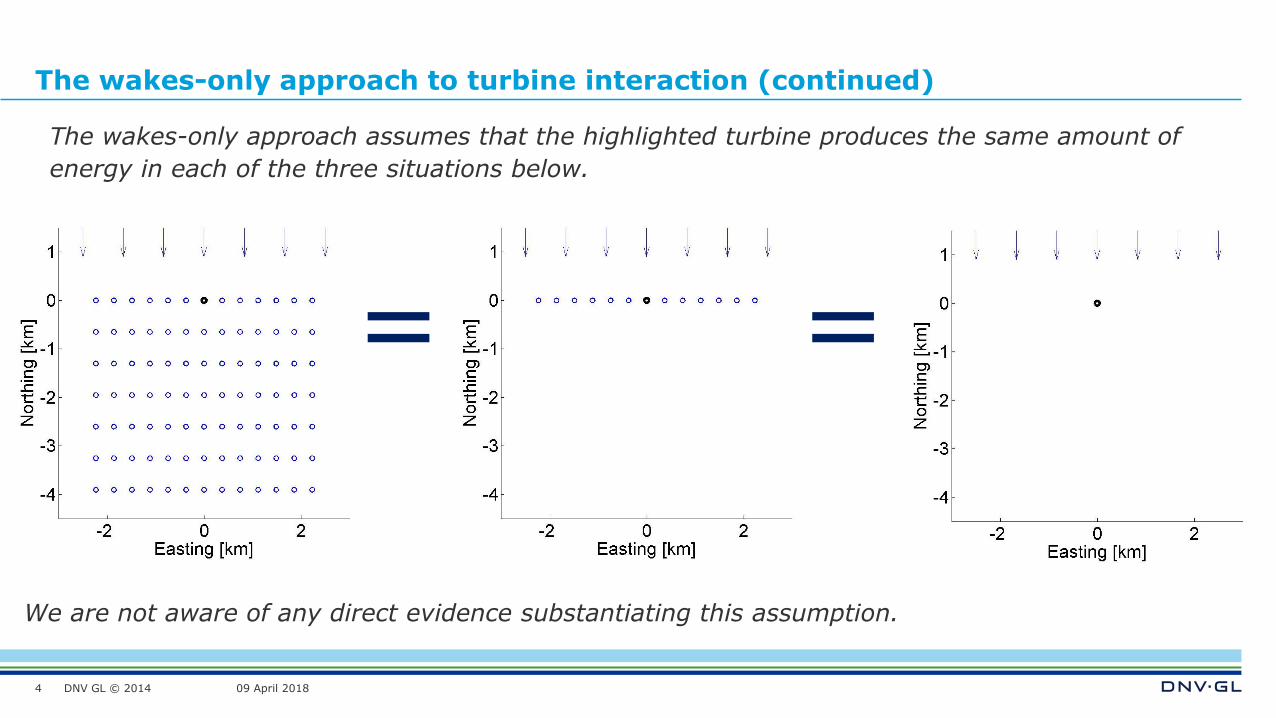
The wakes-only approach assumes that the highlighted turbine produces the same amount of
energy in each of the three situations below.
= =
We are not aware of any direct evidence substantiating this assumption.

DNV GL © 2014 09 April 2018
Method
5
DNV GL © 2014 09 April 2018
Data analysis approach
6
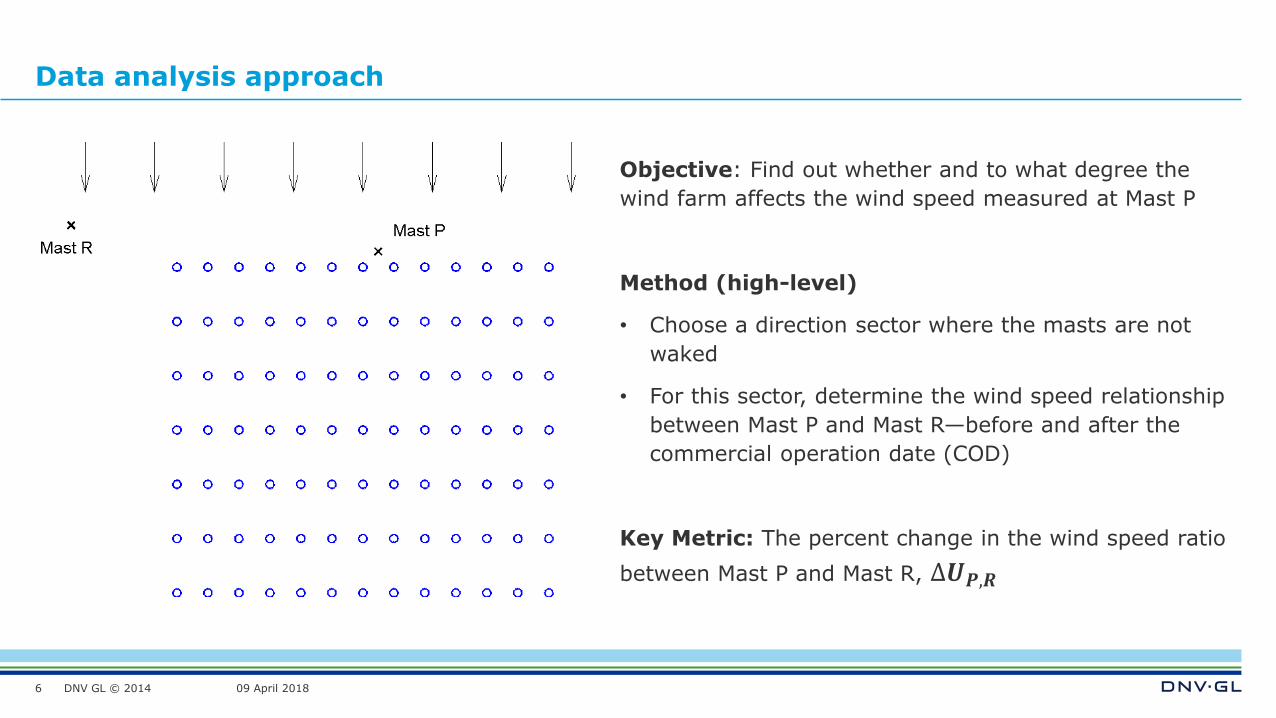
Objective: Find out whether and to what degree the
wind farm affects the wind speed measured at Mast P
Method (high-level)
• Choose a direction sector where the masts are not
waked
• For this sector, determine the wind speed relationship
between Mast P and Mast R—before and after the
commercial operation date (COD)
Key Metric: The percent change in the wind speed ratio
between Mast P and Mast R, ∆𝑼𝑷,𝑹
DNV GL © 2014 09 April 2018
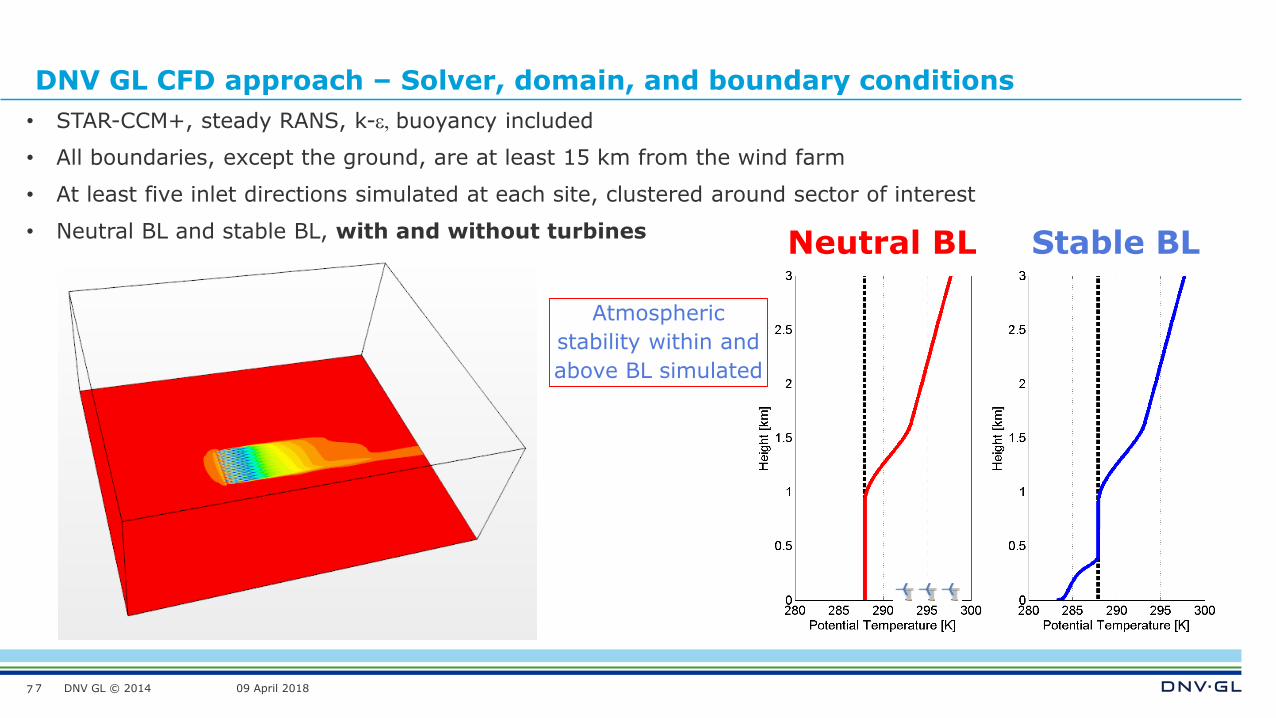
DNV GL CFD approach – Solver, domain, and boundary conditions
77
Neutral BL Stable BL
• STAR-CCM+, steady RANS, k-e, buoyancy included
• All boundaries, except the ground, are at least 15 km from the wind farm
• At least five inlet directions simulated at each site, clustered around sector of interest
• Neutral BL and stable BL, with and without turbines
Atmospheric
stability within and
above BL simulated
DNV GL © 2014 09 April 2018
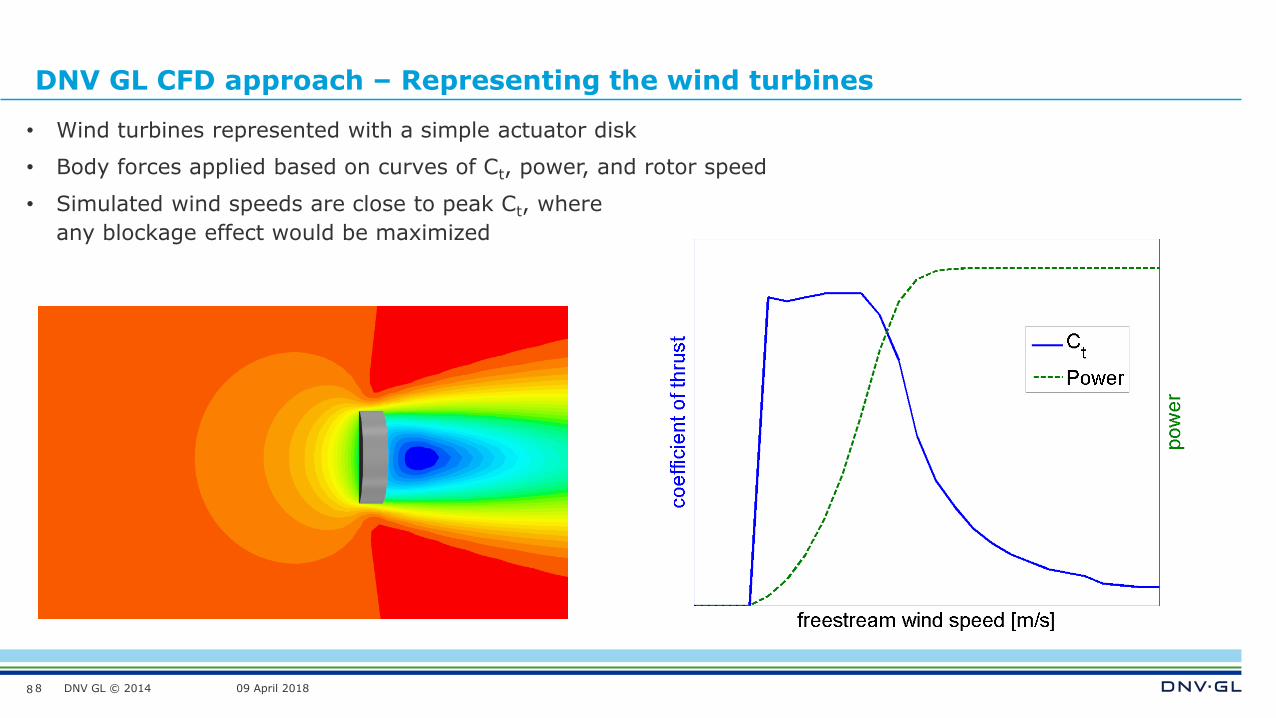
DNV GL CFD approach – Representing the wind turbines
88
• Wind turbines represented with a simple actuator disk
• Body forces applied based on curves of Ct, power, and rotor speed
• Simulated wind speeds are close to peak Ct, where
any blockage effect would be maximized

DNV GL © 2014 09 April 2018
Results
9

DNV GL © 2014 09 April 2018
Onshore Wind Farm A
10
DNV GL © 2014 09 April 2018
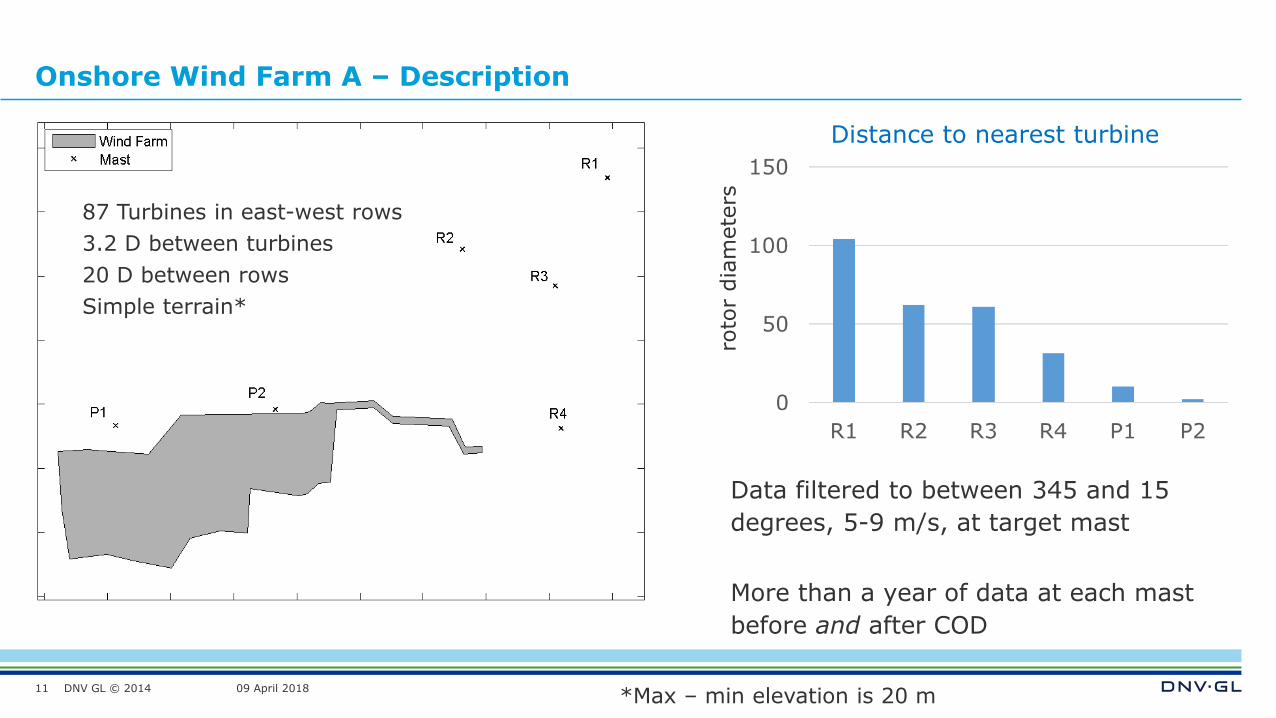
Onshore Wind Farm A – Description
11
87 Turbines in east-west rows
3.2 D between turbines
20 D between rows
Simple terrain*
Data filtered to between 345 and 15
degrees, 5-9 m/s, at target mast
More than a year of data at each mast
before and after COD
*Max – min elevation is 20 m
Distance to nearest turbine
roto
r dia
mete
rs
DNV GL © 2014 09 April 2018
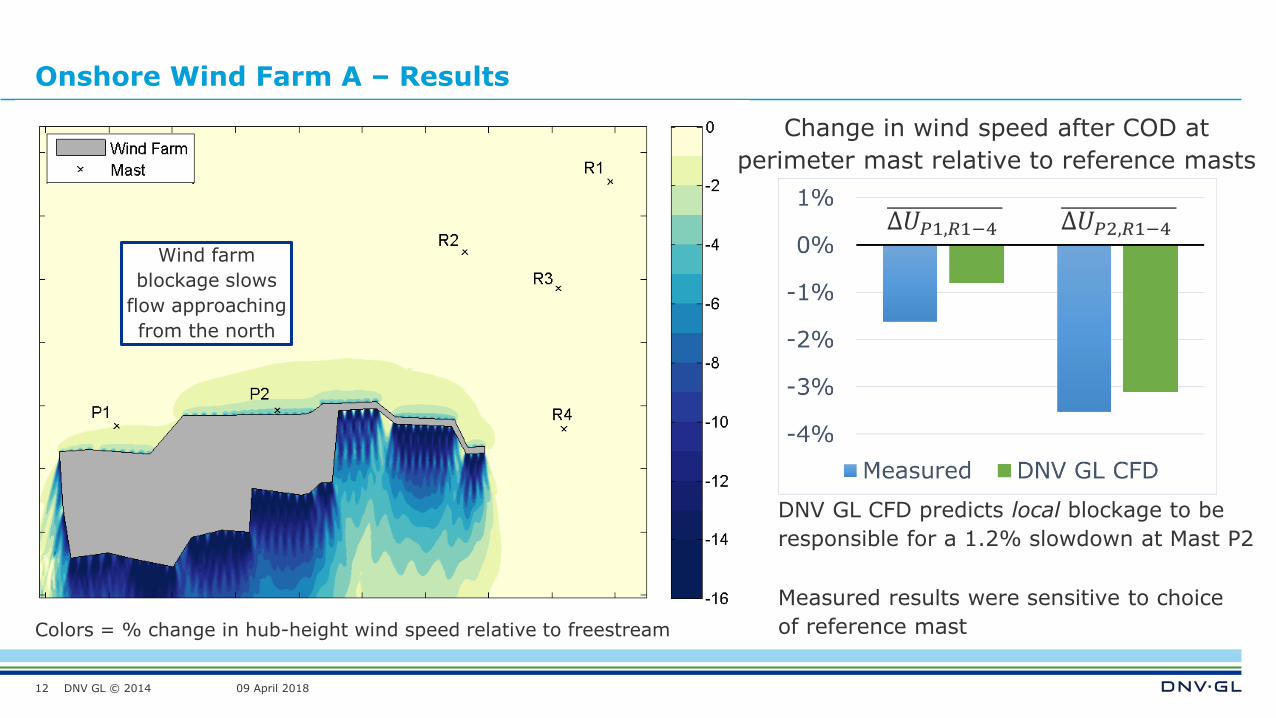
Onshore Wind Farm A – Results
12
DNV GL CFD predicts local blockage to be
responsible for a 1.2% slowdown at Mast P2
Change in wind speed after COD at
perimeter mast relative to reference masts
Measured results were sensitive to choice
of reference mast
Wind farm
blockage slows
flow approaching
from the north
∆𝑈𝑃2,𝑅1−4∆𝑈𝑃1,𝑅1−4
Colors = % change in hub-height wind speed relative to freestream
DNV GL © 2014 09 April 2018
Onshore Wind Farm C
13
DNV GL © 2014 09 April 2018
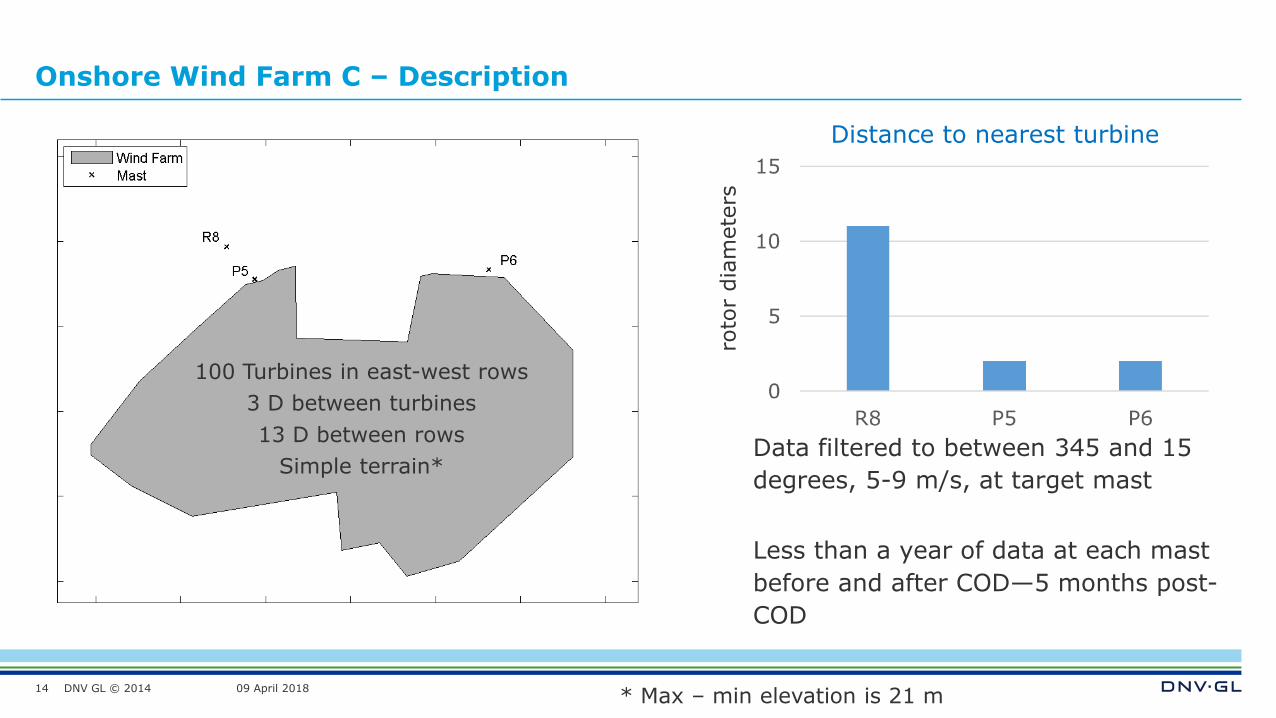
Onshore Wind Farm C – Description
14
Data filtered to between 345 and 15
degrees, 5-9 m/s, at target mast
Less than a year of data at each mast
before and after COD—5 months post-
COD
* Max – min elevation is 21 m
100 Turbines in east-west rows
3 D between turbines
13 D between rows
Simple terrain*
Distance to nearest turbine
roto
r dia
mete
rs
DNV GL © 2014 09 April 2018
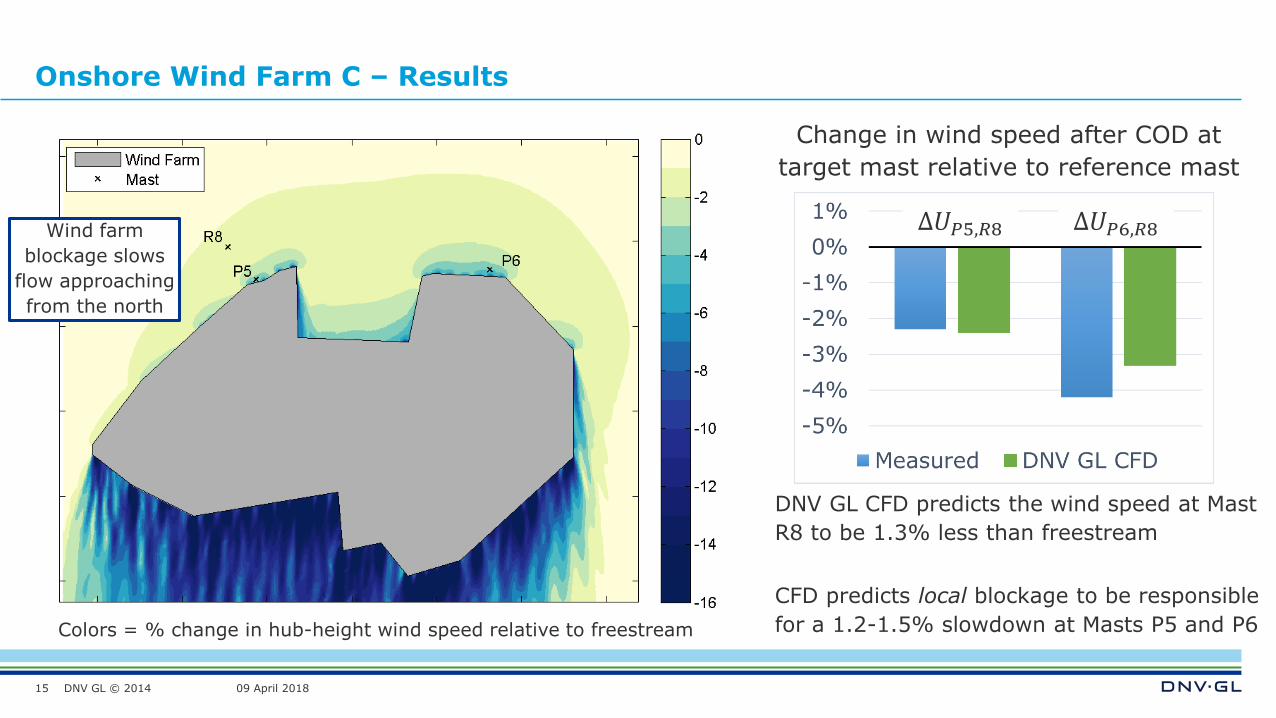
Onshore Wind Farm C – Results
15
DNV GL CFD predicts the wind speed at Mast
R8 to be 1.3% less than freestream
CFD predicts local blockage to be responsible
for a 1.2-1.5% slowdown at Masts P5 and P6
Change in wind speed after COD at
target mast relative to reference mast
∆𝑈𝑃5,𝑅8 ∆𝑈𝑃6,𝑅8
Colors = % change in hub-height wind speed relative to freestream
Wind farm
blockage slows
flow approaching
from the north
DNV GL © 2014 09 April 2018
Summary of results from the four wind farms (two not shown)
16
• Wind-farm-scale blockage is consistently evident in the CFD simulations
• Measurements point to a slowdown occurring upstream of each wind farm,
implying the presence of wind-farm-scale blockage
• Uncertainty in the ∆𝑼𝑷,𝑹 values derived from measured data is probably not
a lot smaller than the magnitude of those values; however, the sign of the
wind speed change is very consistent—i.e. negative for 18 of 19 mast pairs
• The measured slowdowns are relative to reference masts, but it is not
difficult to logically progress to the conclusion that the wind speeds also
decrease relative to freestream
DNV GL © 2014 09 April 2018
The implications of wind-farm-scale blockage
17
DNV GL © 2014 09 April 2018
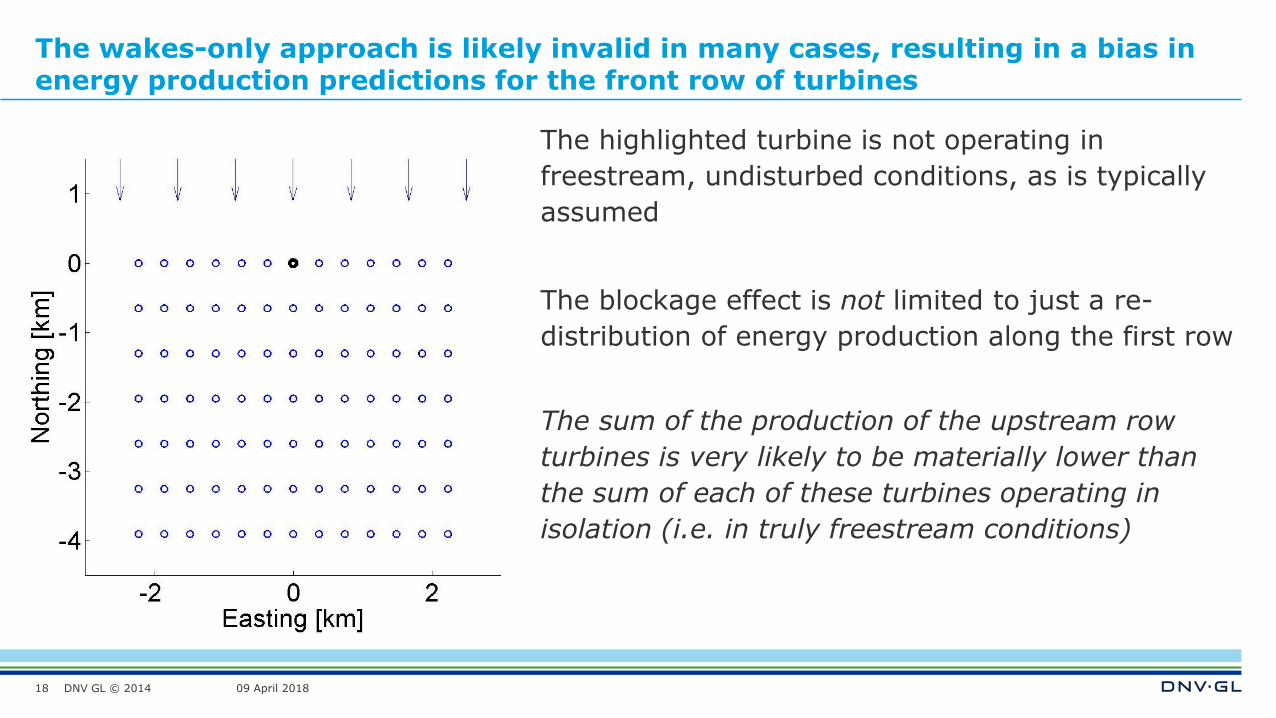
The wakes-only approach is likely invalid in many cases, resulting in a bias in energy production predictions for the front row of turbines
18
The highlighted turbine is not operating in
freestream, undisturbed conditions, as is typically
assumed
The blockage effect is not limited to just a re-
distribution of energy production along the first row
The sum of the production of the upstream row
turbines is very likely to be materially lower than
the sum of each of these turbines operating in
isolation (i.e. in truly freestream conditions)
DNV GL © 2014 09 April 2018
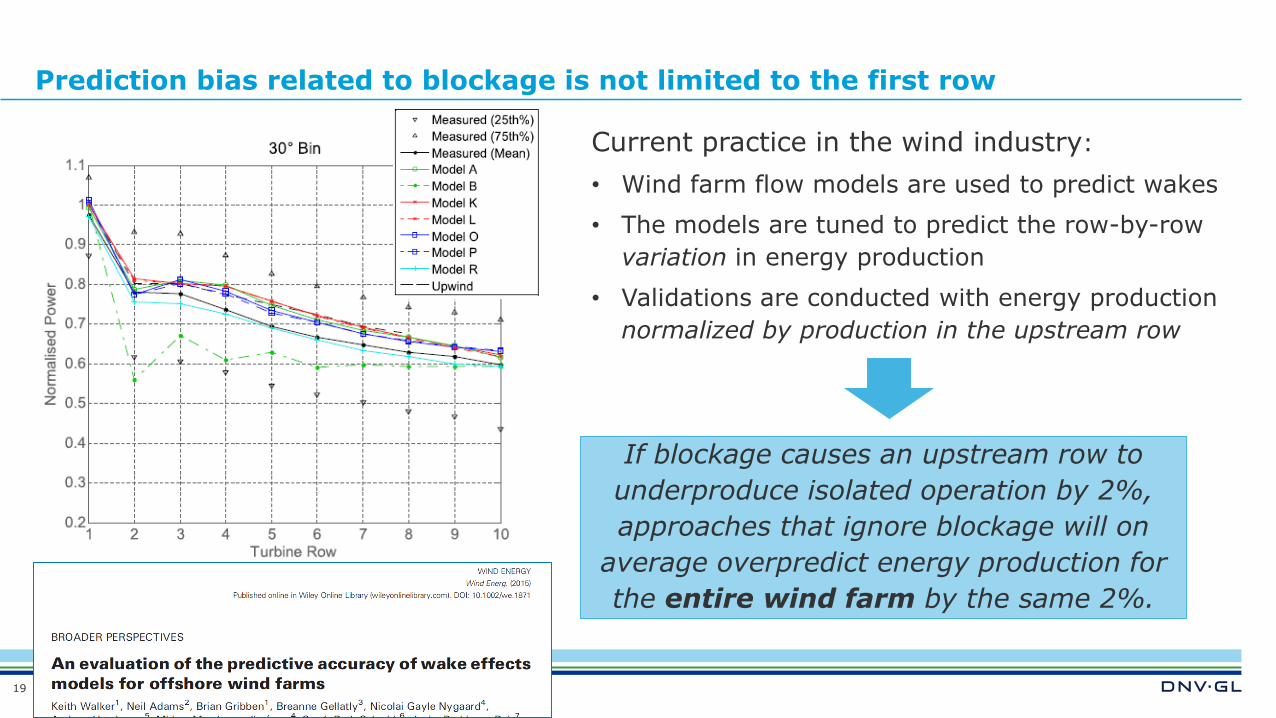
Prediction bias related to blockage is not limited to the first row
19
Current practice in the wind industry:
• Wind farm flow models are used to predict wakes
• The models are tuned to predict the row-by-row
variation in energy production
• Validations are conducted with energy production
normalized by production in the upstream row
If blockage causes an upstream row to
underproduce isolated operation by 2%,
approaches that ignore blockage will on
average overpredict energy production for
the entire wind farm by the same 2%.
DNV GL © 2014 09 April 2018
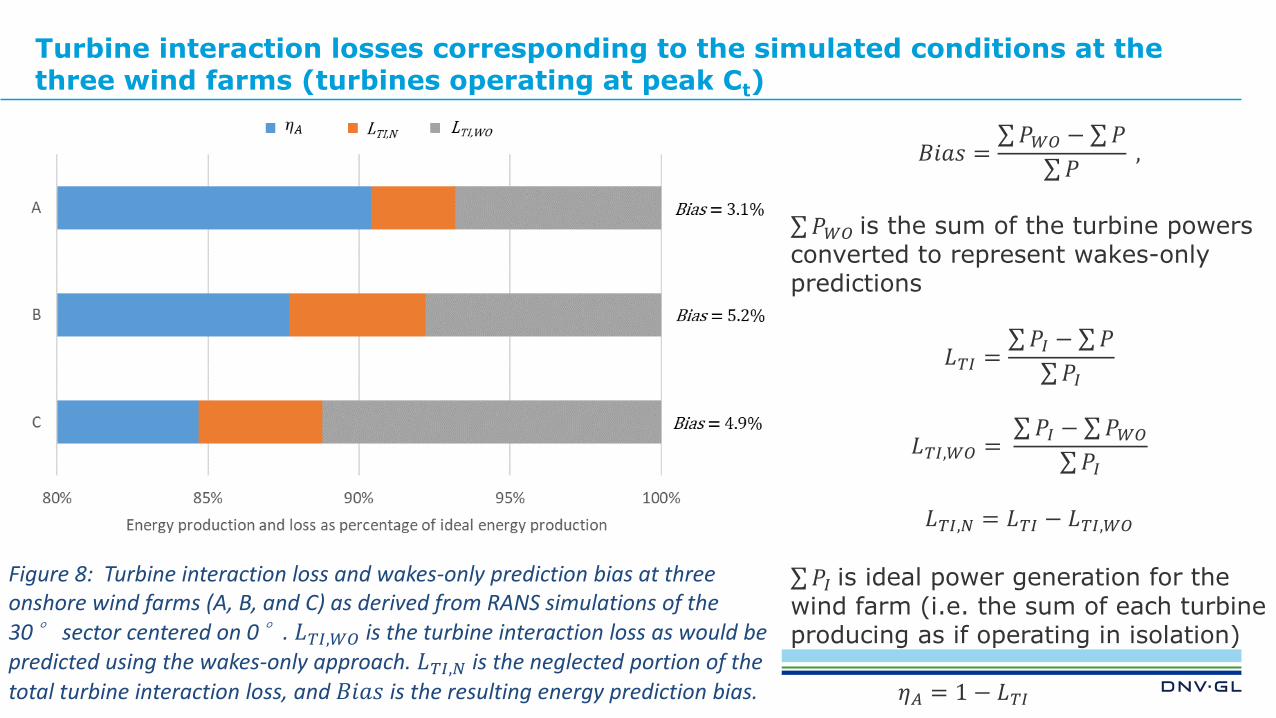
Turbine interaction losses corresponding to the simulated conditions at the three wind farms (turbines operating at peak Ct)
20
𝐵𝑖𝑎𝑠 =σ𝑃𝑊𝑂 − σ𝑃
σ𝑃,
σ𝑃𝑊𝑂 is the sum of the turbine powers converted to represent wakes-only predictions
𝐿𝑇𝐼 =σ𝑃𝐼 − σ𝑃
σ𝑃𝐼
𝐿𝑇𝐼,𝑊𝑂 =σ𝑃𝐼 − σ𝑃𝑊𝑂
σ𝑃𝐼
𝐿𝑇𝐼,𝑁 = 𝐿𝑇𝐼 − 𝐿𝑇𝐼,𝑊𝑂
σ𝑃𝐼 is ideal power generation for the wind farm (i.e. the sum of each turbine producing as if operating in isolation)
Figure 8: Turbine interaction loss and wakes-only prediction bias at three onshore wind farms (A, B, and C) as derived from RANS simulations of the 30° sector centered on 0°. 𝐿𝑇𝐼,𝑊𝑂 is the turbine interaction loss as would be predicted using the wakes-only approach. 𝐿𝑇𝐼,𝑁 is the neglected portion of the total turbine interaction loss, and 𝐵𝑖𝑎𝑠 is the resulting energy prediction bias. 𝜂𝐴 = 1 − 𝐿𝑇𝐼
DNV GL © 2014 09 April 2018
Blockage and energy impact, a summary
21
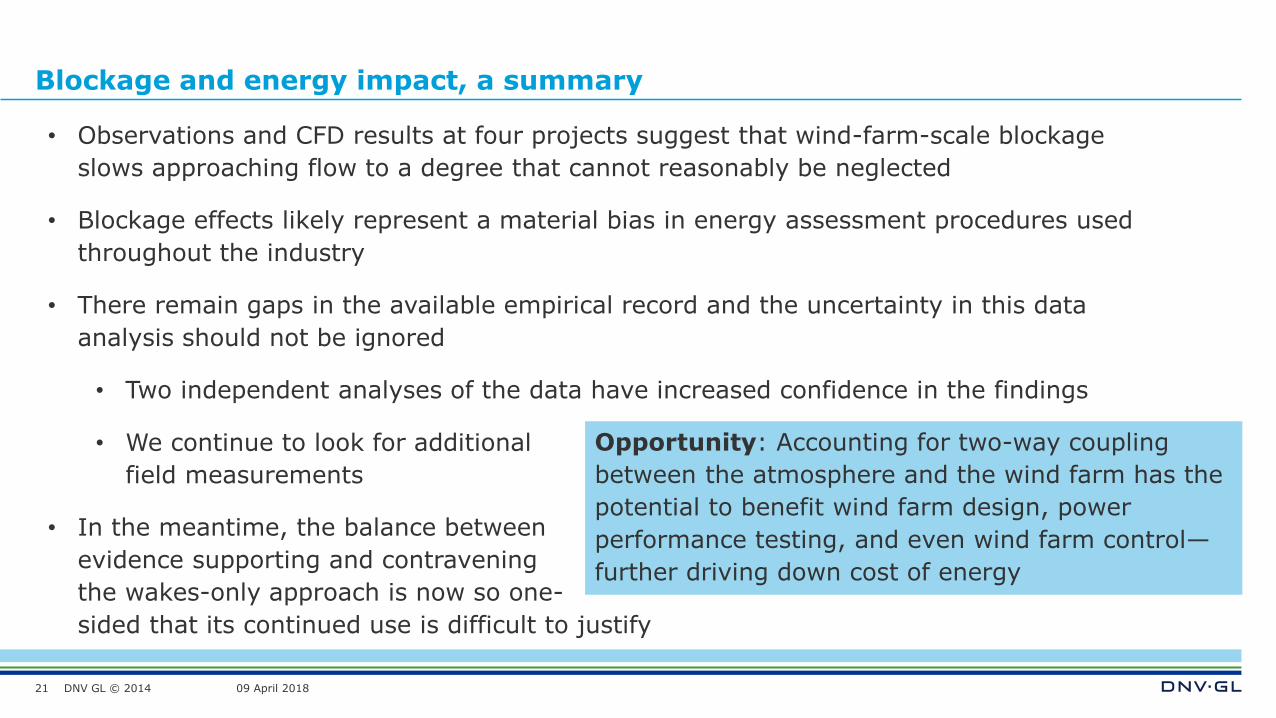
• Observations and CFD results at four projects suggest that wind-farm-scale blockage
slows approaching flow to a degree that cannot reasonably be neglected
• Blockage effects likely represent a material bias in energy assessment procedures used
throughout the industry
• There remain gaps in the available empirical record and the uncertainty in this data
analysis should not be ignored
• Two independent analyses of the data have increased confidence in the findings
• We continue to look for additional
field measurements
• In the meantime, the balance between
evidence supporting and contravening
the wakes-only approach is now so one-
sided that its continued use is difficult to justify
Opportunity: Accounting for two-way coupling
between the atmosphere and the wind farm has the
potential to benefit wind farm design, power
performance testing, and even wind farm control—
further driving down cost of energy

DNV GL © 2014 09 April 2018
Validating blockage predictions
22
DNV GL © 2014 09 April 2018
Measuring blockage effects
23
• Wind farm flow modelling and measurement campaigns focus on wakes
• All wake prediction tools used in the industry are ultimately validated against
full-scale field observations
• More completed prediction tools (i.e. those that also account for blockage) will
also require validation
• Measurements related to blockage are needed
DNV GL © 2014 09 April 2018
Measuring blockage effects
24
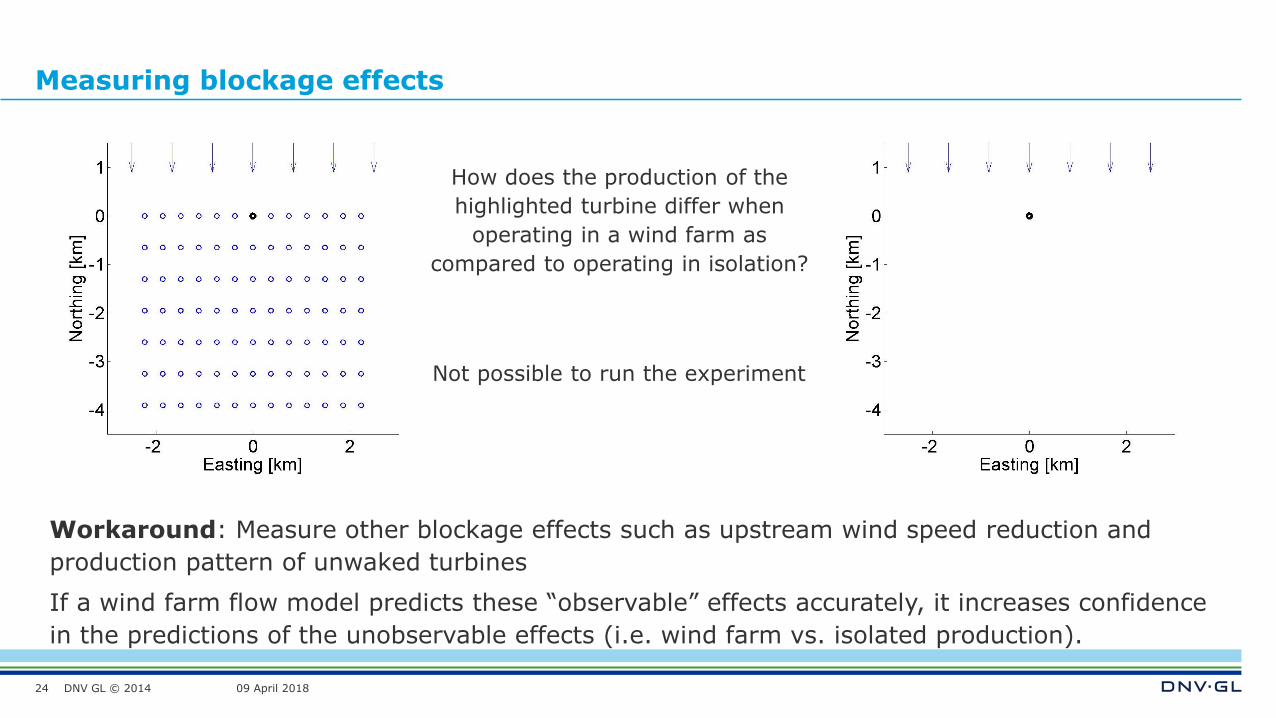
How does the production of the
highlighted turbine differ when
operating in a wind farm as
compared to operating in isolation?
Not possible to run the experiment
Workaround: Measure other blockage effects such as upstream wind speed reduction and
production pattern of unwaked turbines
If a wind farm flow model predicts these “observable” effects accurately, it increases confidence
in the predictions of the unobservable effects (i.e. wind farm vs. isolated production).
DNV GL © 2014 09 April 2018
Measuring blockage effects
25
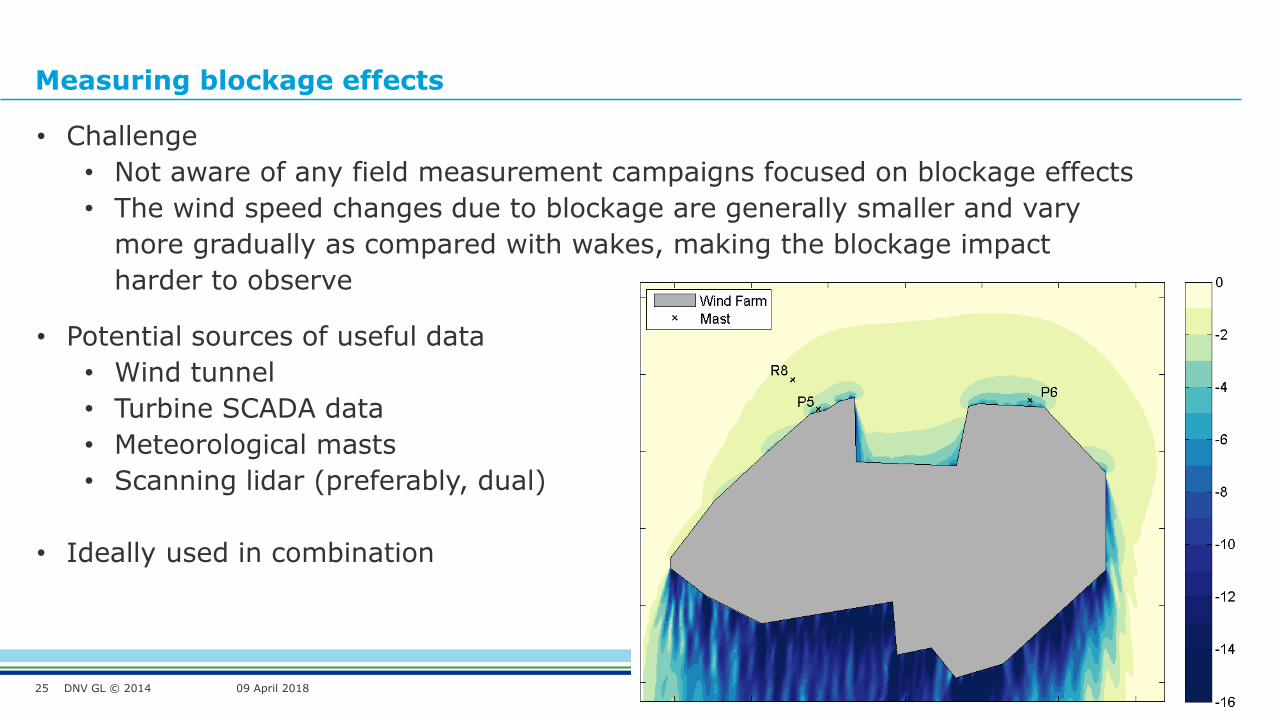
• Challenge
• Not aware of any field measurement campaigns focused on blockage effects
• The wind speed changes due to blockage are generally smaller and vary
more gradually as compared with wakes, making the blockage impact
harder to observe
• Potential sources of useful data
• Wind tunnel
• Turbine SCADA data
• Meteorological masts
• Scanning lidar (preferably, dual)
• Ideally used in combination
DNV GL © 2014 09 April 2018
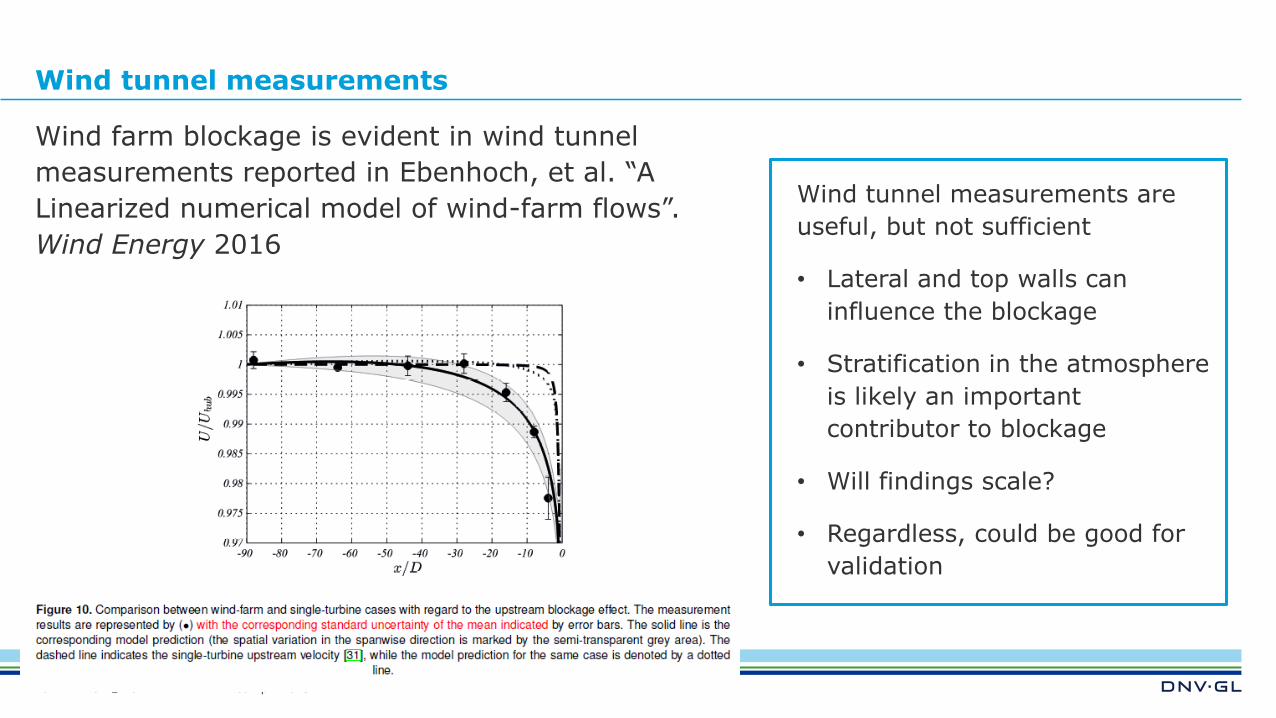
Wind tunnel measurements
26
Wind tunnel measurements are
useful, but not sufficient
• Lateral and top walls can
influence the blockage
• Stratification in the atmosphere
is likely an important
contributor to blockage
• Will findings scale?
• Regardless, could be good for
validation
Wind farm blockage is evident in wind tunnel
measurements reported in Ebenhoch, et al. “A
Linearized numerical model of wind-farm flows”.
Wind Energy 2016
DNV GL © 2014 09 April 2018
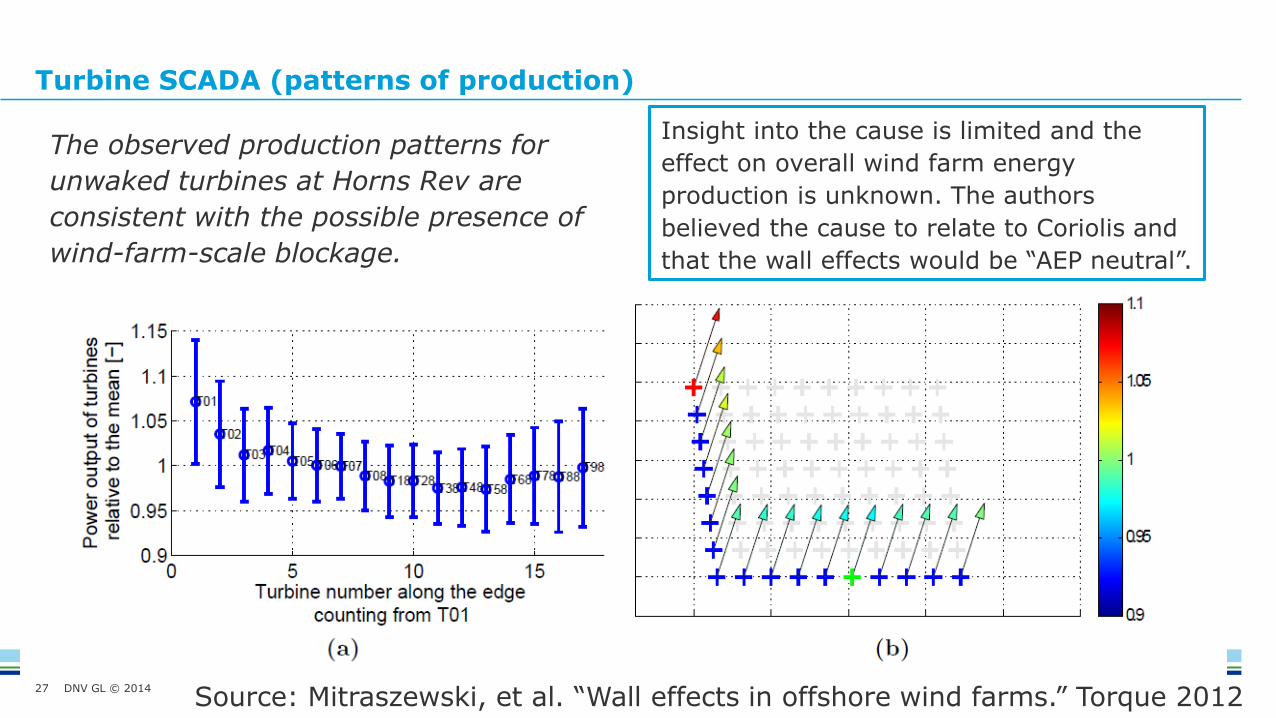
Turbine SCADA (patterns of production)
27
The observed production patterns for
unwaked turbines at Horns Rev are
consistent with the possible presence of
wind-farm-scale blockage.
Source: Mitraszewski, et al. “Wall effects in offshore wind farms.” Torque 2012
Insight into the cause is limited and the
effect on overall wind farm energy
production is unknown. The authors
believed the cause to relate to Coriolis and
that the wall effects would be “AEP neutral”.
DNV GL © 2014 09 April 2018
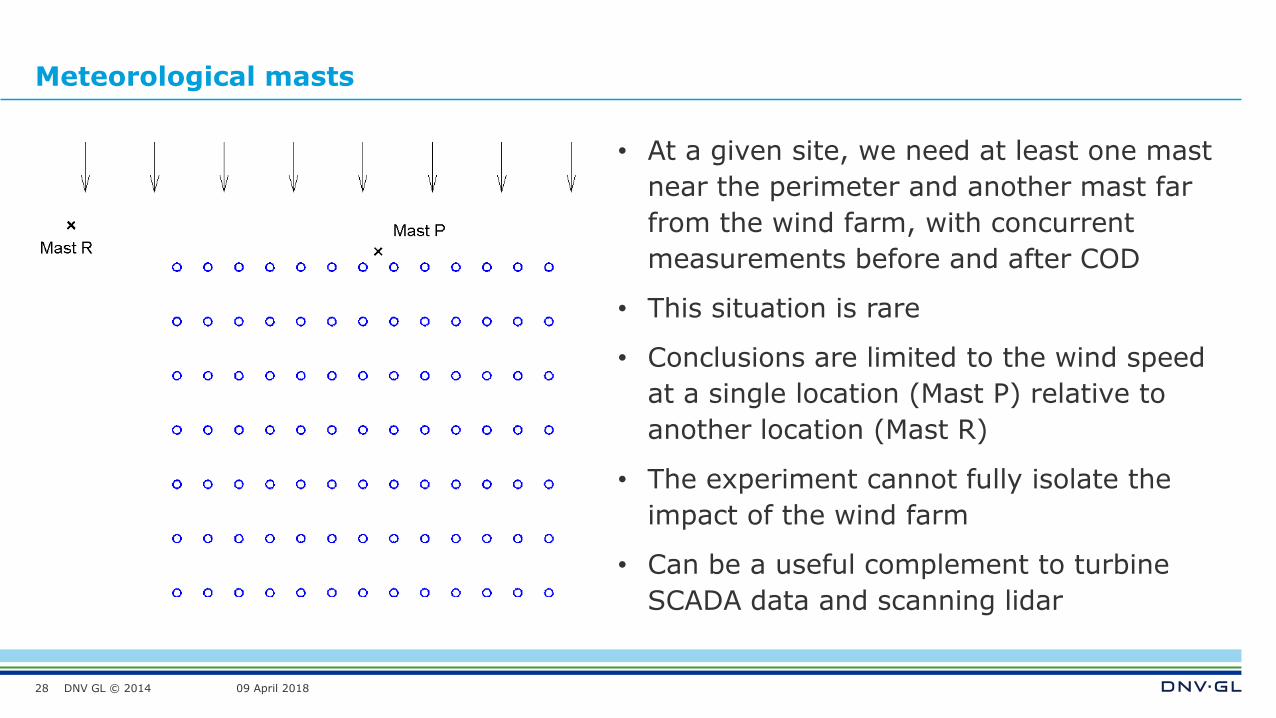
Meteorological masts
28
• At a given site, we need at least one mast
near the perimeter and another mast far
from the wind farm, with concurrent
measurements before and after COD
• This situation is rare
• Conclusions are limited to the wind speed
at a single location (Mast P) relative to
another location (Mast R)
• The experiment cannot fully isolate the
impact of the wind farm
• Can be a useful complement to turbine
SCADA data and scanning lidar
Mast AMast B
DNV GL © 2014 09 April 2018
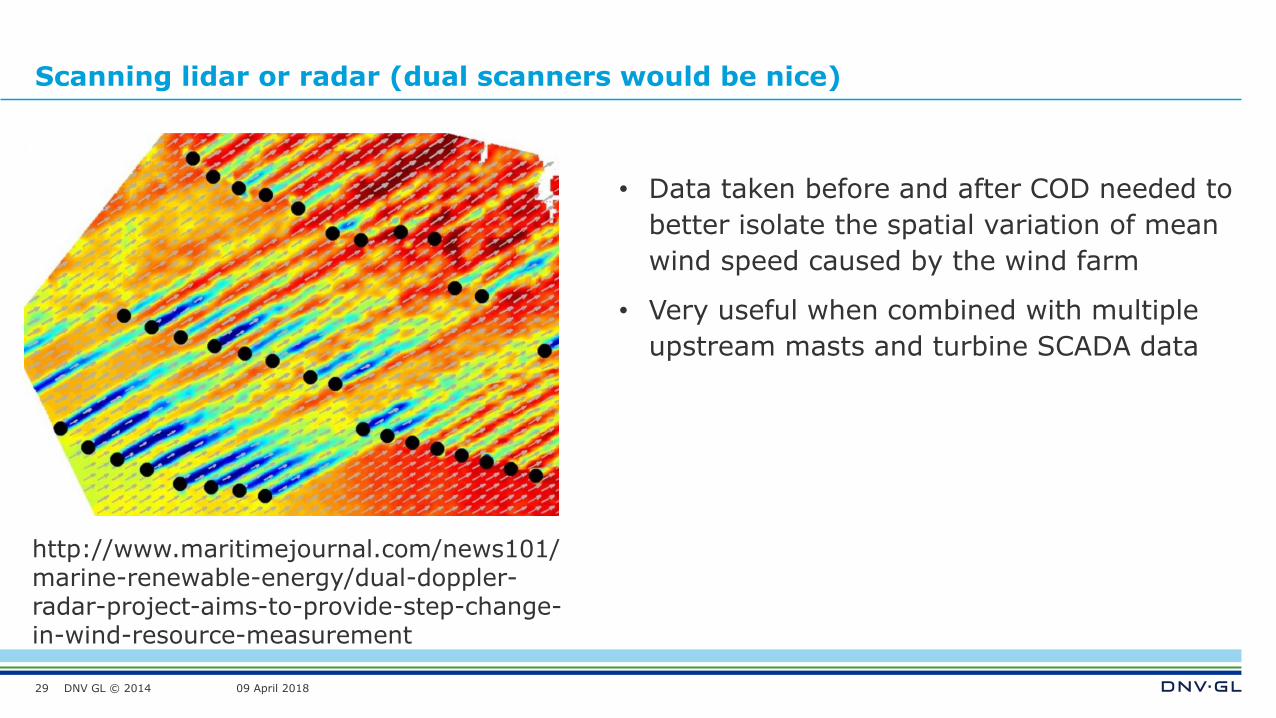
Scanning lidar or radar (dual scanners would be nice)
29
http://www.maritimejournal.com/news101/marine-renewable-energy/dual-doppler-radar-project-aims-to-provide-step-change-in-wind-resource-measurement
• Data taken before and after COD needed to
better isolate the spatial variation of mean
wind speed caused by the wind farm
• Very useful when combined with multiple
upstream masts and turbine SCADA data
DNV GL © 2014 09 April 2018
Takeaway
30
• Blockage needs to be accounted for in wind energy assessments
• To do so reliably will require measured data for model validation
• Availability of such data is currently lacking
• We need measurement campaigns that specifically target blockage effects
DNV GL © 2014 09 April 2018
SAFER, SMARTER, GREENER
www.dnvgl.com
Thank you for listening
31
James Bleeg
+44 7860 181323
Innovate UK funded a portion of this work through the
SWEPT2 project

DNV GL © 2014 09 April 2018
Onshore Wind Farm B
32
DNV GL © 2014 09 April 2018
Onshore Wind Farm B – Description
33
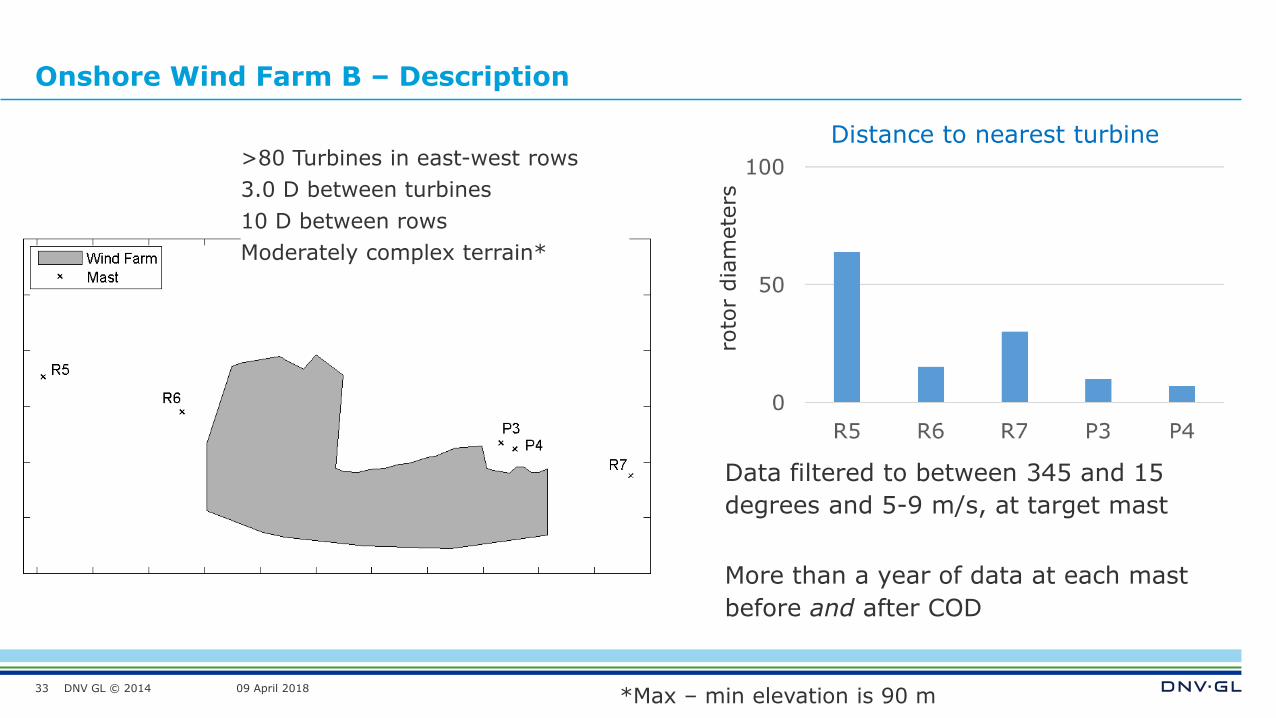
>80 Turbines in east-west rows
3.0 D between turbines
10 D between rows
Moderately complex terrain*
Data filtered to between 345 and 15
degrees and 5-9 m/s, at target mast
More than a year of data at each mast
before and after COD
*Max – min elevation is 90 m
Distance to nearest turbine
roto
r dia
mete
rs
DNV GL © 2014 09 April 2018
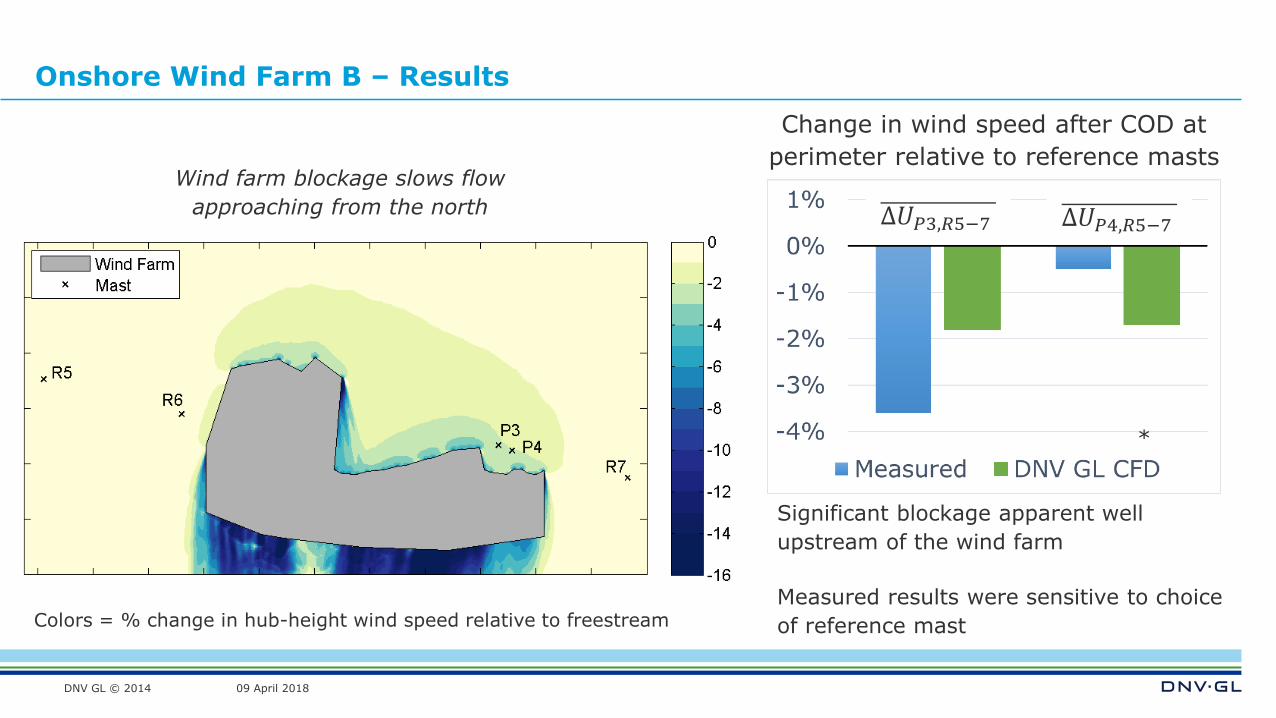
Onshore Wind Farm B – Results
Significant blockage apparent well
upstream of the wind farm
Change in wind speed after COD at
perimeter relative to reference masts
Measured results were sensitive to choice
of reference mast
∆𝑈𝑃4,𝑅5−7∆𝑈𝑃3,𝑅5−7
*
Wind farm blockage slows flow
approaching from the north
Colors = % change in hub-height wind speed relative to freestream
DNV GL © 2014 09 April 2018
Bias in power curves
35
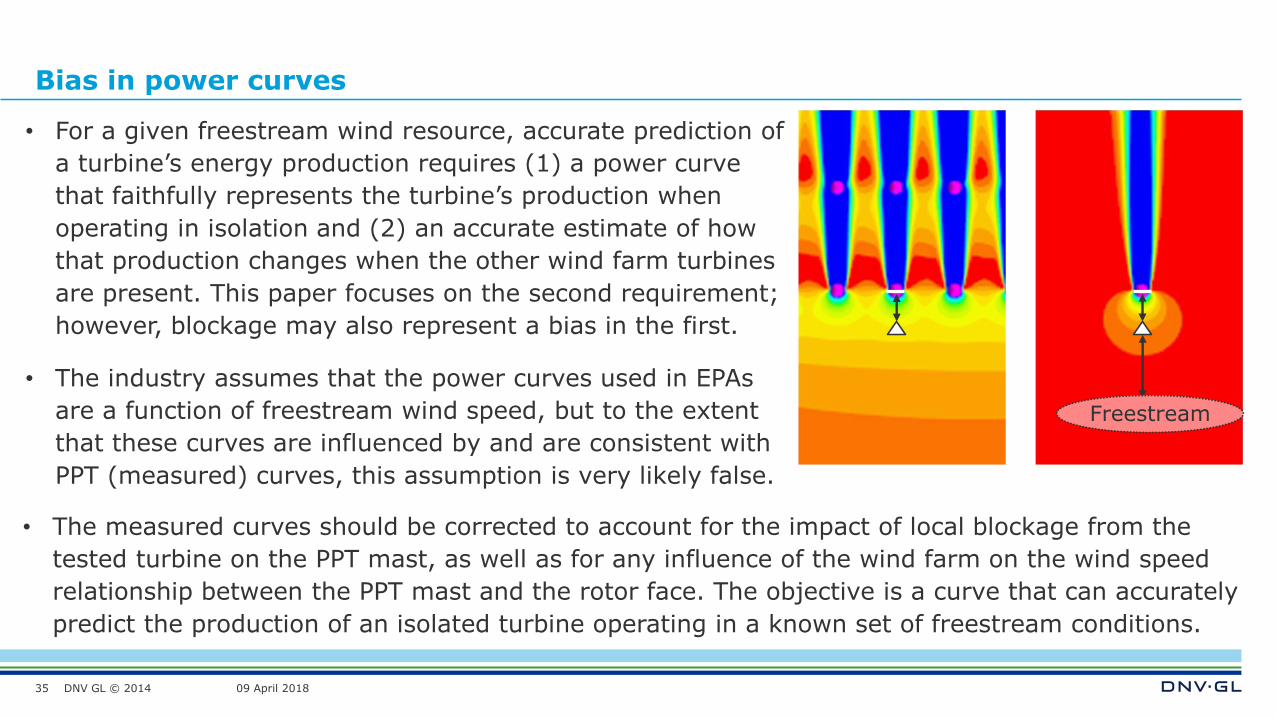
• For a given freestream wind resource, accurate prediction of
a turbine’s energy production requires (1) a power curve
that faithfully represents the turbine’s production when
operating in isolation and (2) an accurate estimate of how
that production changes when the other wind farm turbines
are present. This paper focuses on the second requirement;
however, blockage may also represent a bias in the first.
• The industry assumes that the power curves used in EPAs
are a function of freestream wind speed, but to the extent
that these curves are influenced by and are consistent with
PPT (measured) curves, this assumption is very likely false.
Freestream
• The measured curves should be corrected to account for the impact of local blockage from the
tested turbine on the PPT mast, as well as for any influence of the wind farm on the wind speed
relationship between the PPT mast and the rotor face. The objective is a curve that can accurately
predict the production of an isolated turbine operating in a known set of freestream conditions.