Embed Size (px)
Citation preview

NREL is a national laboratory of the U.S. Department of Energy, Office of Energy Efficiency & Renewable Energy, operated by the Alliance for Sustainable Energy, LLC.
Contract No. DE-AC36-08GO28308
Wind Power Opportunities in St. Thomas, USVI: A Site-Specific Evaluation and Analysis E. Lantz, A. Warren, J.O. Roberts, and V. Gevorgian
Technical Report NREL/TP-7A20-55415 September 2012

NREL is a national laboratory of the U.S. Department of Energy, Office of Energy Efficiency & Renewable Energy, operated by the Alliance for Sustainable Energy, LLC.
National Renewable Energy Laboratory 15013 Denver West Parkway Golden, Colorado 80401 303-275-3000 • www.nrel.gov
Contract No. DE-AC36-08GO28308
Wind Power Opportunities in St. Thomas, USVI: A Site-Specific Evaluation and Analysis
E. Lantz, A. Warren, J.O. Roberts, and V. Gevorgian
Prepared under Task No. IDVI.1020
Technical Report NREL/TP-7A20-55415 September 2012

NOTICE
This report was prepared as an account of work sponsored by an agency of the United States government. Neither the United States government nor any agency thereof, nor any of their employees, makes any warranty, express or implied, or assumes any legal liability or responsibility for the accuracy, completeness, or usefulness of any information, apparatus, product, or process disclosed, or represents that its use would not infringe privately owned rights. Reference herein to any specific commercial product, process, or service by trade name, trademark, manufacturer, or otherwise does not necessarily constitute or imply its endorsement, recommendation, or favoring by the United States government or any agency thereof. The views and opinions of authors expressed herein do not necessarily state or reflect those of the United States government or any agency thereof.
Available electronically at http://www.osti.gov/bridge
Available for a processing fee to U.S. Department of Energy and its contractors, in paper, from:
U.S. Department of Energy Office of Scientific and Technical Information P.O. Box 62 Oak Ridge, TN 37831-0062 phone: 865.576.8401 fax: 865.576.5728 email: mailto:[email protected]
Available for sale to the public, in paper, from:
U.S. Department of Commerce National Technical Information Service 5285 Port Royal Road Springfield, VA 22161 phone: 800.553.6847 fax: 703.605.6900 email: [email protected] online ordering: http://www.ntis.gov/help/ordermethods.aspx
Cover Photos: (left to right) PIX 16416, PIX 17423, PIX 16560, PIX 17613, PIX 17436, PIX 17721
Printed on paper containing at least 50% wastepaper, including 10% post consumer waste.

iii
Acknowledgments
The authors would like to acknowledge the U.S. Department of Energy and specifically Steve Lindenberg for funding of the Energy Development in Island Nations U.S. Virgin Islands (EDIN-USVI) project and this report. We would also like to thank the Virgin Islands Energy Office (VIEO), including Director Karl Knight, for input and assistance during the development of this work and for reviewing a previous version of the manuscript. In addition we would like to thank Ian Baring-Gould (NREL), Charles Newcomb (NREL), Bob Springer (NREL), and Efrain O’Neill-Carrillo (University of Puerto Rico-Mayaguez) for their review of previous versions of this report. Of course, any remaining errors or omissions are the sole responsibility of the authors.

iv
List of Acronyms
ARRA American Recovery and Reinvestment Act of 2010 ATA Aruba Tourism Authority AWEA American Wind Energy Association BNEF Bloomberg New Energy Finance BVI British Virgin Islands CapEx Capital Expenditures CREST Cost of Renewable Energy Spreadsheet Tool DOE U.S. Department of Energy DOI U.S. Department of Interior DPNR Department of Planning and Natural Resources EDIN Energy Development in Island Nations EPA Environmental Protection Agency FAA Federal Aviation Administration FWS Fish and Wildlife Service GWEC Global Wind Energy Council HCEI Hawaii Clean Energy Initiative HECO Hawaiian Electric Company HFO heavy fuel oil HNEI Hawaii Natural Energy Institute IEC International Electro-technical Commission IPP independent power producer JPS Jamaica Public Service Company KEA Kodiak Electric Association KWH kilowatt-hour LBNL Lawrence Berkeley National Laboratory LCOE levelized cost of energy MW megawatt MWH megawatt-hour NEPA National Environmental Policy Act NGO nongovernmental organization NMFS National Marine Fisheries Service NREL National Renewable Energy Laboratory NWCC National Wind Coordinating Committee O&M operations and maintenance OEM original equipment manufacturer PPA power purchase agreement PREPA Puerto Rico Electric Power Authority PTC Production Tax Credit PV photovoltaic SCC short circuit current SODAR sonic detection and ranging SSMI special sensor microwave/imager UFLS under-frequency load shedding USVI U.S. Virgin Islands

v
VIEO Virgin Islands Energy Office VIPA Virgin Islands Port Authority VIWMA Virgin Islands Waste Management Authority VMM Virtual Meteorological Mast WAPA [Virgin Islands] Water and Power Authority

vi
Executive Summary
The U.S. Virgin Islands (USVI) is heavily dependent on imported oil. Through work with the Energy Development in Island Nations U.S. Virgin Islands (EDIN-USVI) team—a consortium of the territorial government and the Virgin Islands Water and Power Authority (WAPA), the U.S. Department of Energy (DOE), and the U.S. Department of the Interior (DOI)—the USVI has developed a strategy for achieving its goal of reducing fossil energy consumption 60% by 2025. In the electricity sector, deployment of new renewable energy capacity is expected to be critical for the USVI to meet its targeted fossil fuel reductions.
Among renewable energy technologies, utility-scale wind power represents one of the lowest-cost sources of new electric generation. Moreover, wind power is increasingly recognized as a valuable generation asset in island communities throughout the Caribbean and in other parts of the world.
Despite relatively low costs and an increasing level of successful island wind installations, developing a successful wind power project requires an array of interdependent variables to be in place. This report utilizes a development framework originated by NREL and known by the acronym SROPTTC™ to assist the territory in identifying and understanding concrete opportunities for wind power development in the territory. The report covers each of the seven components of the SROPTTC framework: Site, Resource, Off-take, Permitting, Technology, Team, and Capital as they apply to wind power in the USVI and specifically to a site in Bovoni, St. Thomas.
Site A preliminary screening based on wind resource maps, local stakeholder input, and existing land use suggested wind power projects could be viable on the islands of St. Croix and St. Thomas. Among an array of possible sites, the favorable wind resource and relatively high land-use compatibility of the Bovoni peninsula on the southeast coast of St. Thomas indicated that it could be a viable first candidate for utility-scale wind power. Sites on St. Thomas were also generally preferred due to its higher overall (and peak) demand for electricity. Greater demand suggests that adding a variable generation resource such as wind might be more manageable as a result of the larger system and the inherently greater number of existing resources to draw on to balance variable generation. Having developed a consensus among the EDIN-USVI team that the Bovoni site could serve as a first site for wind development in the USVI, this report applied the SROPTTC process directly to the Bovoni site. Sites on St. Croix may ultimately offer comparable potential, but to narrow the scope of this analysis, these sites are not considered in detail.
Resource By combining virtual meteorological mast data acquired from AWS Truepower, standard industry losses, and four hypothetical turbine types that might be applicable for a site with hurricane risk, net wind energy production at Bovoni is estimated to range from 7,000 megawatt-hours (MWh)/year to 29,000 MWh/year. The wide range of potential energy generation represented by these estimates is a function of the total installed plant size, which is in turn limited by the number turbines that can be placed on Bovoni point,

vii
and varying levels of productivity associated with specific turbine designs. Typical utility-scale turbines designed for sites with lower wind speeds generally offer the most energy production, but alternative designs tailored to the risks of the Caribbean (e.g., difficult construction logistics and hurricanes) may be easier to finance and insure.
The levelized cost of wind energy (LCOE) at the St. Thomas site is estimated to be between $0.07/kilowatt-hour (kWh) and $0.30/kWh. However, data from recently installed projects in Aruba and Jamaica suggest that this range may be narrower—e.g., between $0.10/kWh and$0.20/kWh.
In spite of the broad range of potential costs, wind power appears to offer lower energy costs than many competing alternatives in the USVI. Assuming current federal incentives apply and the logistics, integration, and hurricane risks can be resolved for multi-megawatt turbines at a capital cost that is in line with those observed for recent wind installations in Jamaica and Aruba, costs will likely be comparable to or below the current avoided cost of the local utility.
Off-take The Virgin Islands Water and Power Authority (WAPA) is the sole utility operating in the USVI. WAPA may, in principle, choose to own and operate utility-scale wind generation in the USVI or provide the off-take for a third-party power producer. Assuming WAPA follows a similar model as it has adopted for the generation of utility-scale solar PV generation, the development of a utility-scale wind power project on Bovoni point would be contingent upon an off-take agreement or power purchase agreement (PPA) between the third-party independent power producer and WAPA.
At present, WAPA is mandated by USVI Act 7075 to acquire 30% of its peak generation capacity from renewable resources by 2025 (VI Senate 2009). As WAPA is a regulated public utility, a PPA with the utility would provide security for a project. However, even with a PPA in place, curtailment risk remains due to the small system size of the St. Thomas/St. John grid and the need to maintain grid voltage and frequency.
Permitting For a typical wind power project, a number of federal permits must be obtained. At the territorial level, additional regulatory measures must be adhered to. Potential fatal flaws could include the presence of threatened or endangered species or significant cultural or historical features, or a hazard determination by the FAA. Assuming no fatal flaws are present, project success may be contingent on the local permitting process. To engage local policymakers and the public in the process of wind power development, this report includes basic visual impacts analysis. Figure ES-1 represents zones of visual impacts assessment for a typical utility-scale turbine with an 80-m tower. This image is generated from potential nacelle heights, as well as data on the terrain in and around St. Thomas. Such an analysis, which is based on line of site for typical eye levels, can be used to determine where the turbines are likely to be visible on the islands and, to a degree, how significant a visual impact they are likely to have. (Red represents the highest visual impact with 5 or more hubs visible, while green represents lesser impact; no visibility is indicated by the absence overlay shading.) Notably these calculations do not take

viii
vegetation height or presence of buildings or other structures into account and as such, the extent of visual impacts on St. Thomas is expected to be less than is shown in Figure ES-1. Smaller turbines would have a less extensive visual impact in terms of the total area from which they can be seen but might also result in a perceived increase in landscape clutter for those areas that are in full view of the turbines, regardless of total height.
Figure ES-1. Likely areas on Bovoni peninsula where turbine hubs would be visible assuming an 80-m (295-ft) hub height
Note: Number of turbine hubs visible is denoted by the respective colors below:
0 1 2 3 4 5
To supplement the zones of visual impacts analysis, photo visualizations were also developed from a number of vantage points around St. Thomas. Figure ES-2 is one example of the photo visualizations generated for this report.

ix
Figure ES-2. Photo visualization of a multi-megawatt turbine with an approximately 420-ft tip height
Sound is potentially another key concern for residents living in close proximity to the Bovoni peninsula. Turbines in the continental United States are often placed at a distance of approximately 1,500 ft from nonparticipating neighboring dwellings to comply with local sound ordinances. Figure ES-3 takes hypothetical locations of multi-megawatt turbines with 100-m rotors and places a 1,500-ft buffer around each turbine to illustrate setback distances comparable to those often employed in the continental United States. With the possible exception of one or two turbines (assuming multi-megawatt turbines) on the northern end of the peninsula, initial desktop review suggests that the expected distances are well beyond those typically required to mitigate for potential sound issues.

x
Figure ES-3. Possible areas affected by wind turbine sound based on the potential sites chosen for multi-megawatt turbines utilizing 100-m rotors and typical setbacks in the
continental United States.
Shadow flicker is also sometimes raised by project neighbors as an issue of concern; however, it tends to be adequately addressed by requisite sound setbacks. Accordingly, shadow flicker is not expected to be a major issue at the Bovoni site but detailed analysis after a more formal turbine layout is established would offer a more definitive determination. The significant distance from the individual turbines to local residences observed above is also expected to reduce the impact of obstruction lighting on the local population, but again detailed analysis pending a formal turbine layout could provide a more definitive assessment.
Technology Choosing the appropriate turbine technology for a site is always critical. In an island environment, there are additional factors to be considered that limit the number and type of turbine models that are applicable. In the context of the Caribbean, this includes conditions resulting from hurricanes and tropical storms. On St. Thomas specifically, additional critical variables include a more challenging logistics environment, challenging topography, and limited land availability. With these factors in mind, a limited number of utility-scale turbines employing anti-cyclonic technology and smaller technologies designed for simplified assembly, installation, and routine raising and lowering could be considered potential candidates. The increased probability of hurricanes occurring in the USVI can be reasonably anticipated to have an incremental

xi
cost impact resulting from the need for more robust equipment and the increased risks borne by insurers and financiers.
One must also consider the impacts of the technology on the grid system and its operations. Some integration aspects are specific to a given turbine’s technology and design characteristics. Modern variable-speed machines with full power conversion are capable of providing a great deal more grid support and grid services relative to constant-speed turbines with induction generators or even variable-speed machines with partial power conversion. Even with the most advanced turbine power electronics, however, high levels of variable renewable generation may also require significant changes in a utility’s operational practices.
Team Given the absence of significant experience developing and operating wind power plants in the USVI, it is likely that the most efficient means of completing a project will involve some level of external expertise from a company already engaged in wind power development in the United States or elsewhere. However, local leadership is also fundamentally important to project success, particularly in small isolated localities or in areas where there is no existing wind development.
Many things can be done today to start assembling the team or group of individuals that is likely to be needed to push forward a wind power project in the USVI. Collaboration with DPNR and WAPA, engagement of local landowners and residents proximate to the Bovoni site, and more detailed assessment of the feasibility of specific access points to the Bovoni peninsula are all elements that could facilitate the process of developing and constructing utility-scale wind on St. Thomas. Collecting and coordinating the key local stakeholders is a process that cannot begin too soon.
Capital Utility-scale wind projects in the continental United States are estimated to cost from $1,500/kW to $2,400/kW. Island locales often expect significantly higher installed costs. Applying costs in line with past experience in the Caribbean, the installed cost of a 5- to 13-MW project (the size range deemed feasible on the Bovoni peninsula with current technology) is anticipated to be on the order of $12 million to $36 million. Incorporating ownership models that are able to monetize the available tax credits and potential renewable energy credits further complicates the capital component of the project development process. WAPA may choose to pursue a utility-owned project or rely on an independent power producer (IPP). The former would result in an additional new generation asset for WAPA’s balance sheet and may allow for low-cost public financing to be utilized. However, utility ownership would also entail greater operational risk for WAPA and would likely preclude access to potential tax credit or other incentives available to private companies.

xii
Summary and Conclusions The USVI has established an aggressive goal in its efforts to reduce fossil fuel consumption. Achieving this goal will require new investments across various sectors, including new sources of power generation. Assuming installations in the USVI can be generally comparable to the recent utility-scale wind projects installed in Jamaica and Aruba in terms of technology and installed cost, the LCOE of wind in Bovoni, St. Thomas is estimated to range from roughly $0.10/kWh to $0.20/kWh.
The Bovoni peninsula appears to be a strong candidate for utility-scale wind generation in the territory. It represents a reasonable compromise in terms of wind resource, distance from residences, and developable terrain. Hurricane risk and variable terrain on the peninsula and on potential equipment transport routes add technical and logistical challenges but do not appear to represent insurmountable barriers. In addition, integration of wind power into the St. Thomas power system will present certain operational challenges, but based on experience in other islanded power systems, integration is expected to be manageable.
Although technically feasible, developing a project will not be simple. Having the right mix of local leadership and expertise will be critical to realizing a cost-effective wind power project on Bovoni point. Nevertheless, completing such an initial project could provide invaluable experience, learning, and technological familiarity for WAPA, local residents, business owners, and tourists. These experiences could provide meaningful insight into future wind and renewable power investments needed in the USVI to achieve the 60%-by-2025 goal.

xiii
Table of Contents Acknowledgments ........................................................................................................................... iii List of Acronyms .............................................................................................................................. iv Executive Summary ......................................................................................................................... vi
Site ............................................................................................................................................... vi Resource ...................................................................................................................................... vi Off-take ....................................................................................................................................... vii Permitting ................................................................................................................................... vii Technology ................................................................................................................................... x Team ............................................................................................................................................ xi Capital .......................................................................................................................................... xi Summary and Conclusions ......................................................................................................... xii
Table of Contents .......................................................................................................................... xiii List of Figures ................................................................................................................................. xiv List of Tables .................................................................................................................................. xiv 1 Introduction ............................................................................................................................. 1
1.1 Why Wind? ...................................................................................................................... 2 1.2 Other Islanded Systems with Wind ................................................................................. 3
1.2.1 Hawaii ...................................................................................................................... 3 1.2.2 Kodiak Island ............................................................................................................ 5 1.2.3 Aruba ....................................................................................................................... 6 1.2.4 Jamaica .................................................................................................................... 7
1.3 The SROPTTC Model ........................................................................................................ 8 2 (S)ROPTTC—Siting Wind Power in the USVI .......................................................................... 11
2.1 Background on Bovoni ................................................................................................... 14 3 S(R)OPTTC—Wind Resource in the USVI ............................................................................... 16
3.1 Wind Resource Characteristics ...................................................................................... 18 3.2 Estimated Power Production and Cost of Energy from a Potential Wind Facility on Bovoni Point .............................................................................................................................. 23
4 SR(O)PTTC—Off-Take Opportunities and Considerations ..................................................... 28 5 SRO(P)TTC—Permitting Utility-Scale Wind in the USVI ......................................................... 30
5.1 Overview of the Permitting Environment ..................................................................... 30 A Closer Look at Wildlife Impacts from Wind Power ................................................................ 31 5.2 Aesthetic and Public Acceptance Considerations ......................................................... 32
6 SROP(T)TC—Technology Options in the USVI ....................................................................... 38 6.1 Hurricane Considerations .............................................................................................. 39 6.2 Turbine Options for Hurricane-Prone Locales ............................................................... 41 6.3 Logistical Challenges and Considerations ...................................................................... 45
6.3.1 Site Access and Transport Considerations ............................................................ 46 6.3.2 Construction Logistics and Sequence .................................................................... 50
6.4 Grid Integration ............................................................................................................. 52 6.4.1 USVI-PR Interconnection Overview ....................................................................... 53 6.4.2 Renewable Energy Grid Integration ...................................................................... 55 6.4.3 Wind Turbine Grid Services Capabilities ............................................................... 56
7 SROPT(T)C— Assembling the Requisite Team ...................................................................... 58 8 SROPTT(C)—Capital, Financing, and Ownership Models ...................................................... 60 9 Summary and Conclusions .................................................................................................... 62

xiv
References ..................................................................................................................................... 64 Appendix A: Anemometry ............................................................................................................. 69 Appendix B: Cost of Energy Modeling Inputs and Supplementary Estimates ............................... 73 Appendix C: Supplementary Photo Visualizations ........................................................................ 75 List of Figures Figure ES-1. Likely areas on Bovoni peninsula where turbine hubs would be visible assuming an
80-m (295-ft) hub height .................................................................................................. viii Figure ES-2. Photo visualization of a multi-megawatt turbine with an approximately 420-ft tip
height .................................................................................................................................. ix Figure ES-3. Possible areas affected by wind turbine sound based on the potential sites chosen
for multi-megawatt turbines utilizing 100-m rotors and typical setbacks in the continental United States. ................................................................................................... x
Figure 1. Oahu’s Kahuku wind power plant .................................................................................... 4 Figure 2. Meteorological modeling of the wind resource in the USVI .......................................... 13 Figure 3. St. Thomas feeder map .................................................................................................. 15 Figure 4. Planned locations for meteorological towers and SODAR on Bovoni point and St.Croix
.......................................................................................................................................... 17 Figure 5. Predominant wind direction at Bovoni point, St. Thomas ............................................. 19 Figure 6. Frequency of wind speeds at Bovoni point on St. Thomas over the long term ............. 19 Figure 7. VMM monthly wind speed profile.................................................................................. 20 Figure 8. Empirical and satellite (SSMI) monthly wind speed profile ........................................... 21 Figure 9. Long-term modeled diurnal wind speed profile ............................................................. 22 Figure 10. Empirical diurnal wind patterns in the USVI ................................................................ 22 Figure 11. Potential turbine locations on Bovoni point, assuming a turbine with an approximately
100-m rotor ...................................................................................................................... 24 Figure 12. Estimated cost of energy from a hypothetical wind project at Bovoni point, including
current U.S. federal incentives (e.g., Production Tax Credit and accelerated depreciation). Note: Detailed input assumptions are summarized in Appendix B. ......... 26
Figure 13. Likely areas where turbine hubs would be visible assuming a 80-m (295-ft) hub height .......................................................................................................................................... 34
Figure 14. Points from which photo visualizations were conducted ............................................ 35 Figure 15. Photo visualization of a multi-megawatt turbine with an approximately 420-ft tip
height (taken from point E in Figure 14) .......................................................................... 35 Figure 16. Possible areas affected by turbine sound based on the potential sites chosen for
multi-megawatt turbines utilizing 100-m rotors and typical setbacks in the continental United States. ................................................................................................................... 36
Figure 17. Evolution in wind turbine technology over time .......................................................... 38 Figure 18. Trends in the levelized cost of wind energy over time ................................................ 39 Figure 19. Tropical storm and hurricane paths, 2000–2012 ......................................................... 40 Figure 20. Vergnet MP C turbine ................................................................................................... 43 Figure 21. Vergnet HP turbine ....................................................................................................... 44 Figure 22. Areas of variable slope designations on St. Thomas .................................................... 45 Figure 23. Possible equipment drop points and overland transport routes, including likely
problem turns ................................................................................................................... 47 Figure 24. Bathymetry in and around Bovoni point ...................................................................... 48

xv
Figure 25. Modular causeway system used by the U.S. Army ...................................................... 48 Figure 26. Possible overland equipment transport route from Red Hook Bay ............................. 49 Figure 27. Possible crane assembly area ....................................................................................... 51 Figure 28. Existing site road profile ............................................................................................... 52 Figure 29. Conceptual illustration of the proposed interconnection to PREPA studied by Siemens
(2011) ............................................................................................................................... 54 Figure A1. Proposed wind resource data collection points on St. Thomas ................................... 70 Figure A2. Proposed wind resource data collection points on St. Croix ....................................... 70 Figure B1. Estimated cost of energy from a wind power facility on Bovoni point St. Thomas
across a range of installed costs with current federal incentives .................................... 74 Figure B2. Estimated cost of energy from a wind power facility on Bovoni point St. Thomas
across a range of installed costs without current federal incentives ............................... 74 Figure C1. Zones of visual impacts for the Vergnet MP C 275 (60-m hub height) ........................ 75 Figure C2. Zones of visual impacts for the Vergnet HP 1.0-MW (70-m hub height) ..................... 76 Figure C3. Zones of visual impacts for the Vestas V100 (80-m hub height) .................................. 76 Figure C4. Photo visualization vantage points .............................................................................. 77 Figure C5. Vestas V100 visualization from point A ........................................................................ 77 Figure C6. Vestas V100 visualization from point B. Note the yellow line denotes expected blade
tip height from this vantage point. .................................................................................. 78 Figure C7. Vestas V100 visualization from point C ........................................................................ 78 Figure C8. Vestas V100 visualization from point D........................................................................ 78 Figure C9. Vestas V100 visualization from point E ........................................................................ 79 Figure C10. Vestas V100 visualization from point F ...................................................................... 79 Figure C11. Vestas V100 visualization from point G ..................................................................... 80 Figure C12. Vestas V100 visualization from point H ..................................................................... 80 Figure C13. Vestas V100 visualization from point I ....................................................................... 81 Figure C14. Vestas V100 visualization from point J ....................................................................... 81 Figure C15. Vestas V100 visualization from point L ...................................................................... 82 Figure C16. Vestas V100 visualization from point M ..................................................................... 82 Figure C17. Vergnet HP visualization from point E ....................................................................... 83 Figure C18. Vergnet HP visualization from point F ........................................................................ 83 Figure C19. Vergnet HP visualization from point H ....................................................................... 84 Figure C20. Vergnet HP visualization from point I ........................................................................ 84
List of Tables Table 1. Estimated Plant Size and Productivity for Wind Power Project Concepts on Bovoni
Point ................................................................................................................................. 25 Table 2. Estimated Bovoni Point Extreme Wind Speeds and Period of Return ............................ 40 Table 3. Renewable Energy Penetration Scenarios Considered in the Siemens Interconnection
Feasibility Study ................................................................................................................ 55 Table A1. Equipment Installation Sites, St. Thomas and St. Croix ................................................. 69 Table A2. 60-m Tower Instrumentation Descriptions ................................................................... 71 Table B1. Bovoni Point Cost of Energy Modeling Inputs ............................................................... 73

1
Introduction Island communities face significant energy challenges. Few conventional indigenous energy resources (coal, natural gas, oil), relatively small power systems, and remote locations often drive heavy dependence on imported petroleum for electricity generation and transport (Weisser 2004). However, this dependence is not without justification. In many respects, oil is an ideal fuel for small, remote, “islanded” power systems. It is relatively accessible as a global commodity, and oil-based power generation technologies offer relatively responsive generation, a key attribute in the smaller and more variable power systems that are common to islands and in land-based power systems that are isolated from the conventional power grid. Nevertheless, recent history has demonstrated that oil-based energy systems on islands may be unsustainable. Oil price volatility, which also directly affects electricity and transport fuel prices, creates a challenging economic environment on islands around the world. Rapid increases in oil prices often result in recessions and extreme debt burdens (Munasinghe & Mayer 1993).
As the impacts of price volatility have taken an increasing toll on island communities, more and more islands have begun to take steps to reduce their dependence on imported oil (see Section 1.2). The U.S. Virgin Islands (USVI), like many island nations and territories, is heavily dependent on imported oil. As of May 2012, residential retail electricity customers pay about $0.44/kWh for electricity. However, the USVI has also emerged as a leader among islands seeking greater energy independence. The USVI has committed to reducing its dependence on imported oil 60% by 2025 (DOE 2010). Through its work with the Energy Development in Island Nations U.S. Virgin Islands (EDIN-USVI) team—a consortium of the territorial government and public utility the Virgin Islands Water and Power Authority (WAPA), the U.S. Department of Energy (DOE), and the U.S. Department of the Interior (DOI)—the USVI has developed a strategy for achieving the 60%-by-2025 goal, which is outlined in detail in the U.S. Virgin Islands Energy Road Map: Analysis (Lantz, Olis, & Warren 2011). Per the road map analysis, in the electricity sector, investments that boost the operational efficiency of the existing power generation and transmission infrastructure, increases in end-user efficiency, and deployment of new renewable energy capacity are all expected to be critical for the USVI to meet its target.
Given the current cost of power in the USVI and the availability of good wind resources, wind power will be a cost-effective power source in the territory. Among renewable energy technologies, utility-scale wind power represents one of the lowest-cost sources of new electric generation. When excluding incentives and subsidies, estimates for the levelized cost of wind energy often range from roughly $0.05/kWh to $0.25/kWh (Edenhofer et al. 2011; Lantz, Olis, & Warren 2011; BNEF 2012a). Considering the wind resource in the USVI and the costs of other recent utility-scale projects in the Caribbean, costs in the USVI are expected to be on the order of $0.20/kWh, although costs could in fact be lower, depending on the availability of federal incentives, or higher should logistics preclude the use of megawatt (MW)-scale wind turbines (for additional detail on wind power costs in the USVI see Section 3.0 and Appendix B). Given its position as a lower-cost renewable resource, wind power figures prominently into the future energy plans for the USVI. An estimated 12–33 MW of wind power are theoretically installed

2
across three possible scenarios outlined in the road map analysis, which examined various paths for achieving the USVI 60%-by-2025 goal.1 At present, however, there are no utility-scale wind power facilities in the USVI.
This report represents a follow on to the initial U.S. Virgin Islands Energy Road Map and is intended to assist the territory in identifying and understanding actual development opportunities for wind power. After providing some initial background on wind power generally and in other islanded systems, it identifies potential opportunities, assesses the current status of utility-scale wind power development in the USVI, and highlights what remains to be completed before a wind power plant can be built on St. Thomas.
The report also articulates a process that can be employed by the USVI and other island communities to identify, screen, and analyze potential wind power sites. Such a process can help island communities prepare for wind power development. The process outlines the pieces that must be addressed to move a publicly owned project forward or demonstrate a significant commitment to external developers who may be hesitant to invest in island localities due to relatively high development costs and small project sizes, both of which increase developer risk.
1.1 Why Wind? Wind power became a commercial-scale industry more than 30 years ago. Over that time, wind power has moved from the fringes of the electric power sector to a mainstream resource responsible for 35% of new U.S. power capacity from 2007 through 2011— second only to new natural gas power capacity (AWEA 2012). In the best resource areas or localities with exceptionally high electricity costs, wind power can be cost effective even in the absence of direct financial incentives or subsidies. Recent technological improvements (Wiser et al. 2012) and falling turbine prices (Bolinger and Wiser 2011, BNEF 2012b) are expected to maintain wind’s economically competitive position for the foreseeable future (BNEF 2012a). Initial investment costs for wind power are relatively high compared to natural gas or diesel generation (DOE 2008); however, with zero fuel costs and relatively fixed modest annual operations expenditures, wind-generated electricity is often a favorable generation resource over the long term. In addition, there are no significant technical barriers to increased deployment of wind power (Edenhofer et al. 2011).
As a result of its favorable economics, wind power has been the primary source of non-hydro renewable electricity around the world (REN21 2011). Through 2011, global wind power capacity was estimated at approximately 240 gigawatts (GW); annual investment in 2011 was roughly $68 billion (GWEC 2012). Technical potential for wind power is specific to local geography and meteorology, but many regions of the world, including the Caribbean―which has an estimated 124 MW of installed wind power capacity—have observed significant wind power growth (GWEC 2012). As an indicator of wind’s widespread applicability, since 2010 more wind power has been installed in developing
1 The analysis outlined in the U.S. Virgin Islands Energy Road Map represented a joint effort completed by DOE, DOI, and stakeholders in the USVI.

3
countries and emerging economies than in the traditional markets of Europe and North America (GWEC 2012).
In contrast to its onshore or land-based counterpart, offshore wind power remains in its infancy. The vast majority of offshore wind installations to date are in northern Europe, where at year-end 2011 there was a total of roughly 3,800 MW installed (EWEA 2012). The only non-European countries with offshore wind power in operation at year-end 2011 were China and Japan, with a combined capacity of roughly 285 MW (GWEC 2012). Many countries, including the United Kingdom and China, have ambitious plans for offshore wind power (GWEC 2012). There is also substantial development activity for offshore wind in the continental United States, where through 2010 there were about 2,300 MW in relatively advanced stages of development (Wiser and Bolinger 2011). Nevertheless, offshore wind power is relatively immature, and it remains substantially higher in cost than its land-based counterpart. Estimated costs for typical projects in the United States are in excess of $0.20/kWh excluding federal incentives, as compared to typical costs of $0.07/kWh for onshore wind excluding federal incentives (Tegen et al. 2012).
There is potential for offshore wind research funding and installations in the USVI. Research and demonstration projects by nature do not demand the returns of commercial projects, and the USVI, with its relatively constant trade winds, underwater topology, and access to industrial ports, may offer some unique attributes as a location for testing, research, and development of emerging offshore wind technology. However, because of the relatively high cost anticipated for offshore wind and the incremental additional cost likely to be incurred from placing a small project with limited economies of scale in a remote location such as the USVI, this report has not considered offshore wind as a viable near-term commercial technology for the USVI.
1.2 Other Islanded Systems with Wind Wind power’s position as a relatively low-cost, mature source of utility-scale renewable power suggests it is likely to be a useful resource in the USVI. However, when wind is introduced into the electric power system, an incremental amount of variability is also added as a result of the variable nature of the wind resource. Across an array of studies focused on relatively large power systems, capacity penetrations of 20%–40% have been shown to be manageable with incremental integration costs on the order of $0.005/kWh–$0.01/kWh (Wiser and Bolinger 2011). Integration costs are likely to be higher on a small, islanded grid; nevertheless, successful wind power installations on remote or isolated grids are indicative of the viability of the technology for such applications. Four islanded power systems that rely on wind energy are highlighted here in order to illustrate the potential for wind power in locales comparable to the USVI.
1.2.1 Hawaii A substantial share of Hawaii’s total energy consumption–greater than 90%–is met with imported oil. In 2008 it was estimated that the state imported about 43 million barrels of fuel at a cost of approximately $8.4 billion (HNEI 2011). About one-third of oil imports are procured for electric power generation; the majority of the balance serves the transportation sector, including air and marine transport (HECO 2012).

4
Despite its continued dependence on imported oil, Hawaii has taken a number of steps to incrementally reduce oil consumption in the power sector. Today about 9% of the electricity consumed by customers of the Hawaiian Electric Company (HECO) and its subsidiaries (which excludes the island of Kauai) comes from renewables, with a little more than 2.5% represented by wind (HECO 2012). Wind power has been a part of the Hawaiian energy portfolio since the 1980s, and today there are several utility-scale wind power plants operating on the islands of Maui, Oahu (e.g., Figure 1), and Hawaii (i.e., the Big Island), with plans to continue wind development.
Figure 1. Oahu’s Kahuku wind power plant
Photo by Adam Warren, NREL
At year-end 2011, total installed wind power capacity in the Hawaiian Islands was estimated at 92 MW (AWEA 2012). The 20-turbine, 30-MW Kaheawa wind farm has been operating on Maui since 2006 (First Wind 2012); 2010 total wind generation in the Maui Electric Company (a subsidiary of HECO) portfolio is about 10% (HECO 2012). New wind power under development on Maui is expected to add an additional 51 MW of installed capacity (First Wind 2012). The 12-turbine, 30-MW Kahuku wind farm has been generating power on Oahu since 2011 (First Wind 2012). This particular project is paired with 15 MW of battery energy storage, which is used to reduce the ramp rates resulting from the variable wind resource and to provide power quality enhancements and voltage support (First Wind 2012). Moreover, this plant’s position at the end of a long radial line increases the benefits received from battery storage. In February 2012, ground was broken on Oahu’s North Shore as construction commenced for Hawaii’s largest wind farm. The Kawailoa wind farm will be 69 MW and is projected to meet 5%–10% of

5
Oahu’s electricity demand (First Wind 2012). In 2006, the 10.5-MW Hawi wind farm started operation on the island of Hawaii. The 20.5-MW Pakini Nui wind project, also on the island of Hawaii, was dedicated in 2007. Wind power constitutes nearly 12% of total electricity consumption on the island of Hawaii (HECO 2012).
To further reduce the state’s susceptibility to oil price spikes and potential supply shortages, the Hawaii Clean Energy Initiative (HCEI) was established in 2008 as a consortium of DOE, the state of Hawaii, and Hawaiian Electric Utilities (Hawaiian Electric Company, Hawaiian Electric Light Company, Maui Electric Company, and Kauai Island Electric Cooperative) (HNEI 2011). This initiative was developed to assist in the implementation of the state’s goal to acquire 40% of its electricity from renewable energy sources by 2030 (HNEI 2011). One element of the HCEI strategy is to develop an additional 400 MW of wind power on the islands of Lanai and Molokai. Sometimes referred to as the “Big Wind Project,” this new renewable electricity generation would be interconnected to the island of Oahu and the load centers located there via undersea transmission cable (HNEI 2011). To scope the feasibility of this plan, DOE commissioned the Hawaii Natural Energy Institute (HNEI 2011) and others (e.g., Woodford 2011) to study technical integration issues associated with the proposal. The results of this series of studies (e.g., HNEI 2011, Woodford 2011) indicated that integrating 400 MW of wind power and 100 MW of solar photovoltaics (PV) into the Oahu power system, which has a peak capacity of about 1 GW, is technically feasible and would provide about 25% of Oahu’s total electricity consumption. An initial assessment of the overall project economics of this 400-MW facility and associated undersea cabling also suggests that the business case for this project is compelling enough to drive continued investment in the project (Springer 2012).
Hawaii’s experience and ongoing study of large-scale penetration of wind power have raised a number of challenges but also offered potential solutions. Integrating 400 MW of new wind into the Oahu power system is feasible but will likely require the use of state-of-the-art wind power forecasting in unit commitment scheduling and an increase in HECO’s up-reserve requirement in order to better manage subhourly wind variability and forecast uncertainties (HNEI 2011). Reducing thermal unit minimum loading and reconsidering down-reserve requirements will also likely facilitate high-penetration wind, as it is only HECO’s peaking units that are fast-start combustion generators. The ability to leverage quick-response generation assets and controllable loads is also expected to play a role (HNEI 2011).
Hawaii’s recent experiences and future plans indicate that high-penetration renewables scenarios are feasible, even in remote island power systems. In cases like the Big Wind Project, operational and equipment modifications may be necessary, but they are not insurmountable obstacles to the deployment of wind power in Hawaii.
1.2.2 Kodiak Island Kodiak is an isolated island community of roughly 15,000 residents off the south coast of Alaska (U.S. Census 2012). The Kodiak Electric Association (KEA) operates the island’s power system with a peak load of around 25 MW and a minimum load of about 11 MW (Hieb 2011). KEA has a stated goal of meeting 95% of its generation needs from

6
renewable hydropower and wind by 2020 (KEA 2012). Remarkably, KEA met nearly 90% of its electricity generation needs in 2011 with renewable energy (KEA 2012).
Kodiak’s primary power source comes from two hydroelectric generators at nearby Terror Lake (Heib 2011). The combined hydro capacity is 11.25 MW (Heib 2011). Nearly 80% of Kodiak’s electricity needs are met with these two hydro units (KEA 2012). The remaining electricity needs are met with wind and diesel generation. Diesel generation is a combination of three reciprocating engines and a single diesel-fired combined cycle unit (KEA 2012). In 2009, three 1.5-MW General Electric wind turbines were installed on Pillar Mountain, constituting about 20% of peak demand. This facility has reduced the yearly diesel electricity production from 20% to 11%; wind generation now accounts for about 9% of annual generation (KEA 2012). The new wind power plant is estimated to be saving about 900,000 gallons of diesel fuel annually (KEA 2012). As a result of the success of the first three turbines installed on Kodiak Island, KEA is planning to expand the existing wind plant from 4.5 MW to 9 MW (Xtreme Power 2012). Adding a third hydro unit is also under consideration (Heib 2011).
To facilitate integration of wind on Kodiak, the Terror Lake hydro plant was given a governor replacement, which improved response rates and frequency regulation capability. However, frequency regulation has persisted as a concern and the current system operates near its technical limits (Heib 2011). Expanding to wind capacity 9 MW is expected to stress the existing system further and detailed study is under way to better understand the system impacts of the planned expansion and to find technical solutions. In April 2012, Xtreme Power announced that it would be installing a 3-MW battery system to provide real and reactive power to the KEA system instantaneously to maintain grid stability as the system moves from about 20% wind power as a share of peak capacity where it is today to more than 35% wind power as a share of peak capacity as is anticipated with the additional 4.5 MW of planned new capacity (Xtreme Power 2012).
1.2.3 Aruba Aruba is a Dutch island territory in the South Caribbean with population of about 110,000 people (World Bank 2012a). Excluding cruise ship visits, just under 1 million tourists travel to the island annually (ATA 2009). W.E.B. Aruba N.V. is the local utility responsible for both power generation and freshwater production (W.E.B. Aruba 2012). The island of Aruba does not have natural sources of freshwater, so desalinization of seawater is the primary source of potable water on the island. N.V. Elmar is the local electricity distributor and retailer (N.V. Elmar 2012).
The total conventional installed generating capacity in Aruba is 290 MW. This fleet includes fuel oil powered steam units and fuel oil powered reciprocating power units, a diesel-fueled gas turbine, and 30 MW of wind generation (W.E.B. Aruba 2012). Peak load in Aruba is about 130 MW; minimum load is roughly 85 MW (Geerman and Croes 2010). The bulk of electrical generation is derived from steam turbines. The diesel turbine is used primarily for emergencies and black starts, and sometimes as a peaking plant (Geerman and Croes 2010). The primary fuel utilized by W.E.B. Aruba is No.6 heavy fuel oil (HFO) (W.E.B. Aruba 2012). Various projects are under way to reduce Aruba’s dependence on imported oil—for example, by increasing existing generator and

7
water production efficiency, expanding wind power assets, and potentially transitioning its oil-fired generation to natural gas (Thiel and Boekhoudt 2010).
Interest in developing a wind power plant at Vader Piet in Aruba emerged in 2004 (W.E.B. Aruba 2012). In 2009 a 10-turbine, 30-MW wind power plant was completed at an estimated cost of roughly $85 million, plus an additional $8 million in interconnection costs (Theil and Boekhoudt 2010). The Vader Piet project uses Vestas V90 3-MW wind turbines and is one of the largest wind facilities in the Caribbean region. It has been estimated that the plant meets, on average, approximately 18% of daily load (Geerman and Croes 2010). At minimum load, instantaneous penetrations of 30%–35% can be observed (Geerman and Croes 2010).
The W.E.B. Aruba power system has demonstrated an ability to successfully integrate wind power. However, it has suffered some reductions in the efficiency of its fossil units, which has incrementally reduced the anticipated fuel savings from adding wind generation to its portfolio. Nevertheless, the net fuel savings remains substantial, and various operational strategies have been proposed to improve the efficiency of the existing fossil generation fleet with wind on the system (Geerman and Croes 2010). The estimated breakeven point for wind power in Aruba has been an estimated HFO cost of about $55 per barrel (Theil and Boekhoudt 2010).
W.E.B. Aruba’s reciprocating engines have facilitated wind integration by providing rapid-response up and down regulation and quick starts that assist in addressing wind power variability on subhourly time scales. This stands in contrast to the utility’s steam units, which have much slower (up to seven hours) cold start times (Geerman and Croes 2010). W.E.B. has also implemented a wind power forecasting system that produces wind power production forecasts for up to seven days in advance. The forecast system does involve some level of forecast error and uncertainties; however, it has proven to be a useful tool for steam unit commitment and dispatch (Geerman and Croes 2010).
1.2.4 Jamaica Another Caribbean nation utilizing wind power is Jamaica. Jamaica has a population of about 2.7 million (World Bank 2012b), and, like many other islands, is heavily dependent on imported oil. Jamaica’s power generation fleet consists of diesel oil based generation capacity, several small hydropower plants, and wind power. Jamaica’s total installed generation capacity is estimated at about 820 MW with a peak demand of roughly 650 MW (JPS 2009). Jamaica’s peak load has been projected to grow to 1.5 GW by 2028 (Nexant 2010).
Following a 225-kW installation at Munro College in 1996, utility-scale wind power was introduced in the Jamaican energy mix in a significant way in the mid 2000s with the commissioning of the Wigton I wind farm, a 20.7-MW facility (Chin Lenn 2011). The Wigton I project, which utilized 23 900-kW NEG/Micon NM 52/900 turbines, was placed in service in 2004 (Wigton Wind Farm 2012). In 2010, an expansion of the plant added nine 2-MW Vestas V80 turbines, increasing the total capacity to 38.7 MW at a cost of approximately $47.5 million. The annual capacity factor for the Wigton wind projects is estimated at 30% (Wigton Wind Farm 2012). Another 3-MW wind farm in Jamaica is

8
located at Munro, and consists of four 750-kW wind turbines (Chin Lenn 2011). The estimated average cost of power from Jamaica’s wind projects is roughly $0.12/kWh (Chin Lenn 2011).
One of the challenges to wind development in Jamaica is its geographical location in hurricane and earthquake zones. This condition imposes additional requirements on wind turbine designs to withstand hurricane-grade winds. Strategies suggested by Vestas for such sites in the Caribbean include the use of International Electro-technical Commission (IEC) Class I wind turbines (i.e., those machines designed for the most extreme wind conditions) and possibly lower hub heights and reinforced towers (Vestas 2011). In addition, a backup diesel generator is sometimes required for projects to provide the power needed to keep the turbine rotors faced into the wind and positioned to shed loads should a line loss or power outage occur during an extreme wind event (Vestas 2011; see also Section 6). Similar issues are common for wind power development in all hurricane-prone island nations and territories around the world.
Wind power is being increasingly recognized as a valuable generation asset in island communities throughout the Caribbean and in other parts of the world. The experiences of Hawaii, Kodiak, Aruba, and Jamaica offer significant insights that the USVI can build upon in developing its own wind power potential. Chief among these are: 1) islanded grids can incorporate wind power as a significant share of their electric sector capacity—upwards of 30% and in some cases even greater penetration, 2) integration of wind power is facilitated by the optimization of existing operations strategies and control schemes as well as an ability to incorporate wind forecasting into dispatch planning, and 3) hurricane and typhoon risk can be appropriately mitigated with proper turbine and plant design and engineering.
1.3 The SROPTTC Model Recognizing the potential and viability of wind power at a conceptual level is, however, only one step in the process of successfully adopting and transitioning to renewable power sources like wind. Wind power projects represent significant new infrastructure and substantial investments of new capital. Actually developing a successful wind power project requires an array of interdependent variables to be in place before construction and delivery of power can occur. In detailing the concrete opportunities for wind power in the USVI and the steps that must be taken to realize a wind power project, this report utilizes a development framework originated by NREL and known by the acronym SROPTTC™ (SROPTTC is a trademark of the Alliance for Sustainable Energy LLC, the operator of the National Renewable Energy Laboratory).
The SROPTTC framework for project development was developed by Robert Springer at NREL using common principles of the project development discipline. In the forthcoming paper A Framework for Project Development in the Renewable Energy Sector, Springer notes that the objective of the project developer is to reduce the uncertainty associated with each aspect of the proposed project as quickly as possible. This involves an iterative approach in which the developer analyzes each piece of a project’s SROPTTC elements at finer and finer levels, all the time looking for “fatal flaws” that might make a proposed project no longer feasible.

9
The purpose of this report is to make a high-level pass through the SROPTTC process for a potential wind project on St. Thomas, USVI. A related application of the SROPTTC framework specific to Hawaii can be found in the report Initial Economic Analysis of Utility-Scale Wind Integration in Hawaii (Springer 2012).
The process is designed so that all the requisite variables are considered at the appropriate level throughout the development process. There are seven critical components that make up the SROPTTC framework:
• Site—Any project requires a suitable site. For utility-scale wind projects, a site must have access to the existing transmission grid as well as the ability to interconnect and move power on the grid. Wind power also requires a site where the impacts to both human and wildlife populations are within the requisite permitting standards, where legal access to the land can be obtained, and where local zoning laws allow for wind power development.
• Resource—A viable project depends on the cost-effective delivery of power; this requires that the resource at a given site is adequate to produce power that is competitive with the existing utility generation portfolio. In the continental United States, this often means a site with average annual wind speeds on the order of 6– 8 m/s. However, as a result of the high cost of electricity observed in the USVI and many other island locales, sites with wind speeds of only 5–6 m/s may be sufficient for cost-effective wind power. The emergence of turbines designed particularly for low-wind-speed areas is also increasing the viability of many sites that were previously considered undevelopable.
• Off-take―Successful utility-scale projects require a power purchaser. The power purchaser may be a utility for projects developed by an independent power producer (IPP) or the end consumer if the project is owned and operated by the utility. For capital-intensive wind projects, a long-term contract from a creditworthy entity is typically required so that the project developer can recover initial investment costs.
• Permitting—Land use is often highly regulated. Moreover, projects must abide by all existing environmental and local siting regulations. Three tiers of permits may be required: local, state or territorial, and federal. All relevant permits at each of these levels must be identified and evaluated to determine what agencies must be coordinated with and what studies may be required to comply with the applicable permitting standards.
• Technology―Utility-scale wind projects represent multi-million-dollar investments. Applicable technology must be insurable and financeable while also remaining economically viable. Technology choice is critical in the USVI as a result of increased hurricane risk and challenging logistics.
• Team—Assembling the appropriate set of project champions and stakeholders is fundamental to project success. Wind power in the USVI is likely to require

10
significant local mobilization and effort, whether or not the project is ultimately developed by local stakeholders or an independent third party. In addition, developing a wind project requires a diverse array of skills and expertise, so identifying the right individuals to address specific barriers and challenges along the way is critical to project success.
• Capital―Determining viable ownership structures and establishing the framework that allows a project to successfully pass investor due diligence reviews are also necessary steps. Applicable incentives and alternative sources of revenue (e.g., Renewable Energy Credits) must be identified, monetized, and allocated appropriately within the ownership structure.
Although each element of the SROPTTC process deserves attention, the core elements are Site, Resource, and Off-take. Together they create the value that promotes further investment in the other components of the framework. Securing these three elements under contract is a significant milestone for a project developer.
The balance of this report will examine each of the seven SROPTCC elements in detail with regard to a St. Thomas wind power plant on the Bovoni peninsula. The paper analyzes the current best-available wind resource data at the identified site to estimate the levelized cost of energy (LCOE) from a conceptual wind power project there. Discussions of technology and logistical considerations, permitting and off-take requirements, and grid integration considerations are included. Analyses of the potential visual impacts of a project are presented to help engage local stakeholders and demonstrate the potential scale and extent of such impacts. Issues such as sound and shadow flicker are addressed. An overview of the various entities likely to be involved in different aspects of development is also presented, along with financing models.
The information that has been garnered to inform this report has been collected primarily via desktop research and semi-structured interviews with local stakeholders, government officials, and utility officials. It has also relied on wind industry data sources (e.g., wind resource data purchased from AWS Truepower).

11
2 (S)ROPTTC—Siting Wind Power in the USVI
Ideal sites for wind power projects represent an optimization of multiple variables. At the highest level, a site must have a viable wind resource; an ability to interconnect and move power on the existing grid system; a buyer or consumer; and the ability to satisfy all requisite local ordinances, permitting criteria, and environmental considerations. In addition, a given site must be logistically feasible in terms of getting the wind turbine equipment to the site as well as the ability to actually assemble and install wind turbines. A given site must also be publicly acceptable and politically feasible.
In order to remain politically and publicly viable, wind power projects must maintain certain setbacks from occupied buildings, roads, and other features. Often such setbacks are regulated by explicit standards for the issues of concern (e.g., sound). Distances that generally meet the minimum requirements for potential nuisance issues, including sound and shadow flicker for turbines in other parts of the world, are often on the order of 1,500 ft from occupied residences. To comply with typical safety standards, turbines are usually located 1 to 1.5 times the maximum turbine height from all structures, nonparticipating property lines, roads, high-voltage transmission lines, and other potential fall hazards. Slope of the terrain is often limited to less than a 20% grade. Projects typically cannot be sited in wetlands and must be set back from underground gas or utility lines as well as communications towers and pathways. Environmental regulations often emphasize wildlife such as birds and bats and habitat for protected species. When endangered species, migratory birds, eagles, or other protected wildlife are encountered on a particular site, impacts must be demonstrated to be below the requisite thresholds such that the relevant take permit(s) can be acquired to account for any incidental taking. If protected habitat is affected, impacts below the requisite thresholds must also be demonstrated. Sites must be able to avoid or mitigate any impacts to significant cultural or historical resources.
A high-level preliminary screening based on wind resource maps, local stakeholder input, and existing land use suggested the potential for wind power projects on the islands of St. Croix and St. Thomas. Meteorological modeling (Figure 2, Elliot 2008) indicates that best wind resource areas on St. Croix are on the various ridges and the southern shore of the island. As one moves south and east from Christiansted, there is a series of elevated landscape features that are estimated to have average annual wind speeds of 7–7.5 m/s at 70 meters above the ground. Such wind speeds are generally sufficient for successful deployment of utility-scale wind power, and with current technology, even lower average annual wind speeds can be viable (see also Section 6). These elevated areas are relatively free of residential populations; however, their development will be more logistically challenging than the flat agricultural lands on the south shore, where wind speeds at certain locations, again at 70 m above the ground, are roughly 6-7 m/s. Sites east of the former HOVENSA refinery are promising, as they avoid the airport and are located in an already industrialized area of the territory. Initial discussions with local residents and government officials indicate that locating wind turbines in relative proximity to the refinery site and the Renaissance industrial park will facilitate the development of public support for the first wind development on St. Croix. Some initial discussions have suggested that historical or culturally sensitive sites may affect parts of the south shore of

12
St. Croix. Should they exist, such sites would need to be properly identified, avoided, or mitigated for.
On St. Thomas, meteorological modeling indicated the best wind resource areas were located on the elevated areas that make up the west-central portions of the island. These localities are a part of Crown Mountain and lie directly north of the Cyril E. King Airport. However, these sites entail significant residential populations and terrain that is too steep for wind turbine installations (i.e., slopes in excess of 20%). Potentially viable wind resource areas were also identified in the central portion of the island east of Charlotte Amalie and west of Anna’s Retreat. Again, however, these sites were unable to pass a preliminary screening due to slope restrictions and the presence of residential populations.
St. John was rejected as a site for industrial wind turbines due to its small power demand and the presence of a large national park on the island. It is very unlikely that utility-scale development would be seen as acceptable in this environ.
Having reviewed the sites noted above, NREL analyzed sites that had a viable wind resource as well as more compatible land use and geographic (e.g., slope) features. Bovoni, located on a peninsula on the southeast coast of St. Thomas, was observed to have estimated average annual wind speeds of 6–7 m/s (Figure 2) and was determined to have the best mix of wind resource and compatible land use. This site is an industrialized area and currently houses, on a portion of the point, the St. Thomas landfill. In addition, the peninsula proper has no residential presence south of the Route 30 corridor, and no known environmental or wildlife issues were raised in initial discussions with local stakeholders.

13
Figure 2. Meteorological modeling of the wind resource in the USVI
Illustration by NREL
Note: Capacity factors shown in the graphic are based on an IEC Class II wind turbine. Depending on site-specific resource characteristics, wind shear, and turbine-specific production actual capacity factors could be higher or lower for each respective wind speed value shown here.
In addition to favorable wind resource and land use compatibility, the Bovoni site on St. Thomas has a handful of other attributes that make it a favorable location for utility-scale wind power in the USVI. The higher overall demand for energy and higher peak capacity of the St. Thomas/St. John power system suggest that adding variability to that system might be more manageable than on the smaller St. Croix power system. In addition, the potential for interconnection with Puerto Rico (see Section 6) could significantly reduce the challenge of balancing variable-output wind power in the St. Thomas power system and may ultimately offer a second off-taker for a wind facility on St. Thomas.
For these reasons, the consensus among the EDIN-USVI team is that the Bovoni site could likely serve as a first site for wind development in the USVI. The balance of this

14
paper analyzes the Bovoni site in detail to better identify the opportunities, challenges, and remaining barriers to adding a utility-scale wind power facility there. The emphasis that this paper places on Bovoni is not to suggest that utility-scale wind power is less likely on St. Croix. In fact, there are various attributes of the south shore of St. Croix, including its relatively flat topography and the presence of industrial ports that could simplify site access and construction logistics as well as other aspects of project development.
2.1 Background on Bovoni Bovoni, or Long Point, is bordered to the east by Jersey Bay and to the west by Bovoni, Bolongo, and Stalley bays. The land that makes up Bovoni is currently used for a variety of public and private purposes. As noted above, a portion of the peninsula includes the St. Thomas landfill. The peninsula also houses a firing range, wastewater treatment facility, asphalt plant, fire department training area, and communications tower. Private landowners control a significant portion of the land that makes up Bovoni. However, there are no known residential structures on the peninsula proper. There are some residences on the south side of Route 30, which passes directly north of the peninsula, and immediately west where the peninsula joins the mainland of the island.
At present, Bovoni Landfill is noncompliant with U.S. Environmental Protection Agency (EPA) regulations and is under orders to close. In March 2012, Virgin Islands Waste Management Authority contracted Island Roads Corporation of St. Thomas to begin constructing a landfill methane collection and power generation facility on the peninsula. When complete, this facility has the potential to be the largest renewable energy generator in the territory to date.
Input from local sources indicates that no other near-term or long-term changes in use are anticipated for the peninsula. This suggests, at least preliminarily, that the future development of wind power is not likely to conflict with other potential uses. At least one landowner has expressed interest in seeing wind development occur at the site and has provided access for the placement of wind resource assessment equipment on the site.
Access to Bovoni is expected to be challenging. However, two potential options have been identified for moving wind turbine equipment, cranes, and other heavy equipment to the site. These routes are discussed in detail in Section 6.
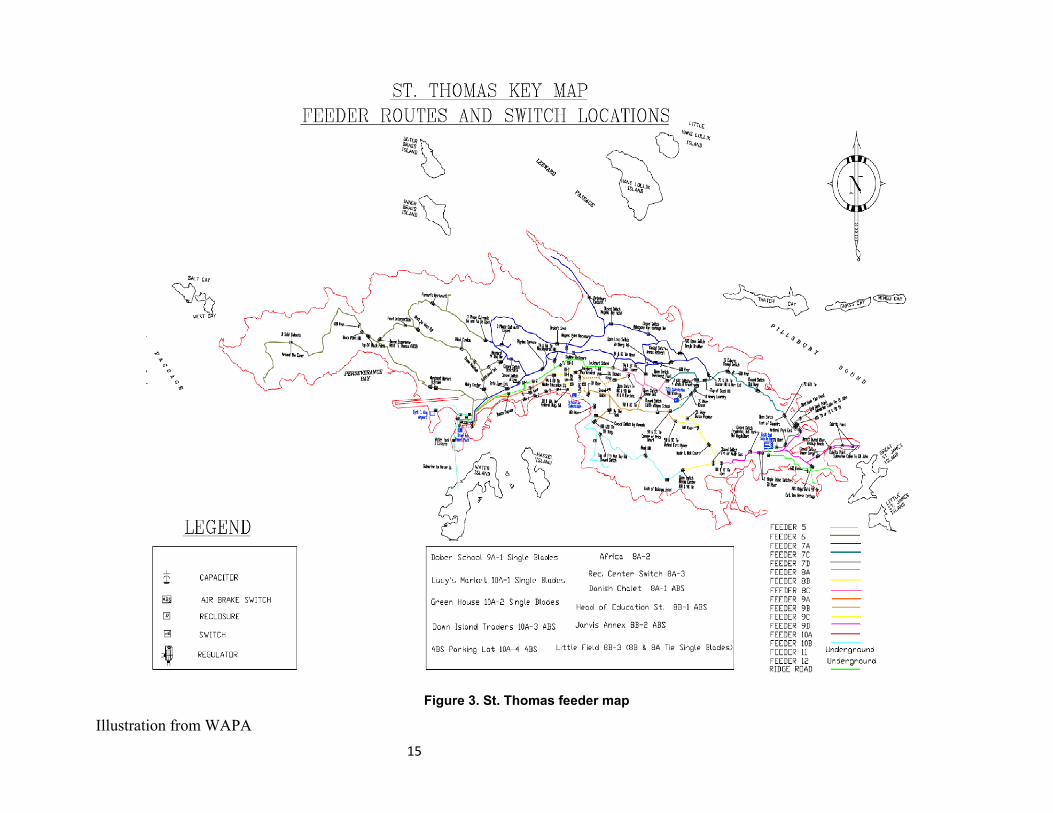
Figure 3 provides an overview of the St. Thomas grid system. There is a single 13.8-kV feeder line serving the peninsula. As this line serves loads to the east with generation from the west, adding wind generation at this location is likely to result in the movement of wind energy also to the loads in the east and potentially, during periods of low demand and high wind production, to loads to the west. An interconnection to this line is expected to require significant system upgrades. The closest substation is the East End Substation, approximately two miles east of the peninsula. Interconnection to this existing substation is expected to require new feed-in capabilities and transformers, even with the advanced grid services capabilities of most modern wind turbine generators. Section 6 provides a more detailed overview of the operational requirements to successfully integrate wind power into the St. Thomas/St. John power system.
15
Figure 3. St. Thomas feeder map
Illustration from WAPA

16
3 S(R)OPTTC—Wind Resource in the USVI
Preliminary site screening requires a high-level analysis of the wind resource. Such analysis allows one to identify probable locations where viable wind resources exist. The NREL wind map in Figure 2 suggests wind speeds of between 5.5 and 6.5 m/s at 70 m above ground level at Bovoni. Such wind speeds are on the lower end of the viable range relative to projects in the continental United States; however, the emergence of low-wind-speed turbines that rely on ever-increasing hub heights and rotor diameters (e.g., Wiser et al. 2012), suggests that such a site is in fact a viable candidate for utility-scale wind generation. And given the substantially higher cost of electricity that results from the territory’s reliance on imported oil, average annual wind speeds on the order of 6 m/s would potentially be cost-competitive even without newer low-wind-speed technology.
Although the data in the NREL wind resource map are encouraging, obtaining commercial financing for a multi-million-dollar wind power project requires site-specific wind resource and meteorological data. Site-specific resource data acquisition generally occurs in two phases. In the first phase, utilities or developers analyze “virtual” meteorological data from weather models to carry out site-specific desktop analysis of the wind resource. The second phase entails the provision of actual meteorological towers onsite collecting wind speed measurements at multiple heights above the ground for a period of at least one year. These empirical measurements are used to generate increased confidence in the site-specific wind resource conditions and to confirm or validate long-term modeled forecasts. Although a great deal can be learned from desktop analysis of modeled virtual data, meteorological tower data collected over at least a year is necessary to obtain commercial financing for large-scale wind power projects.
For this report, NREL analysts conducted the desktop research and analysis that is typical of the first phase of the site-specific wind resource analysis efforts noted above, using modeled data. In addition, NREL and DOE have been working with VIEO on the placement of meteorological towers and Sonic Detection and Ranging (SODAR) wind speed assessment capabilities on St. Thomas and St. Croix. Two meteorological towers and a SODAR unit will be located on Bovoni and will be used to complete the second phase of the site-specific resource analysis (Figure 4). These units are expected to be installed this year and will be critical to the continued development of wind power at Bovoni. However, as there are no data available from this latter effort at the time of this writing, the following results are based strictly on desktop analysis of modeled wind resource data. Additional information on planned anemometry in the USVI is included in Appendix A.

17
Figure 4. Planned locations for meteorological towers and SODAR on Bovoni point and St.Croix
NREL acquired Virtual Meteorological Mast (VMM) data from AWS Truepower. These data represent modeled hourly data for the Bovoni site for the past 14 years. The data are developed from global atmospheric models (e.g., the National Center for Atmospheric Research’s ReAnalysis Model), surface observations, satellite observations, and weather balloon data. These models allow a recreation of the historical weather patterns in the upper atmosphere. The upper atmospheric conditions are used as inputs into micro-scale simulations that recreate what occurs as the atmosphere meets the earth’s surface. Micro-scale modeling results are then aligned with actual surface observations. These efforts allow one to generate historical hourly wind speed estimates, taking into account specific terrain features, general topography, and surface roughness, among other factors (AWS Truepower 2010).
The VMM data indicate that the long-term (14-year) average annual wind speed in the center of the Bovoni peninsula is 6.3 m/s at 80 m above ground level. As one moves closer to the east coast of the peninsula, the average annual wind speeds increase; as one moves west, the average annual wind speeds decline due to increased surface roughness. Moving north on the peninsula toward the center of St. Thomas also decreases the estimated average annual wind speeds, again as a result of increased surface roughness and terrain interference.

18
The wind shear value describes the rate at which wind speed changes with height above ground level. Low shear, and therefore less significant change in wind speed with height above ground, is expected over smooth surfaces like oceans and open plains. Higher shear values are expected in terrain regimes with increased surface roughness or irregularities like forests and mountains. In these localities, wind speed varies more significantly with height above ground. The VMM modeling suggests that the shear value on Bovoni point is approximately 0.2, slightly above the typical standard estimate of 0.143, which is reasonable given the terrain and exposure to predominant winds. However, there may be large shifts in the seasonal wind shear due to the complex terrain on the peninsula and the predominant wind direction. Accordingly, this shear value remains relatively uncertain.
The quoted uncertainty from AWS Truepower in the VMM data at Bovoni is ±0.8 m/s. The largest uncertainty in this modeled data set is the absence of any direct measurements or empirical wind speed data above 30 m, which significantly increases the uncertainty of the shear values. Verifying the shear values and wind speeds at typical turbine hub heights of 60–100 m will require empirical data measured by the planned meteorological towers and SODAR unit. The former will rely on anemometers to measure up to 60 m, and the latter relies upon movement of sound waves to measure up to 200 m. These additional empirical data collection efforts are also anticipated to significantly enhance the understanding of the wind resource variability across the Bovoni peninsula.
3.1 Wind Resource Characteristics The VMM results provide significant additional insights regarding the wind resource at Bovoni. Figure 5 is a wind rose indicating the directionality of the wind resource at Bovoni point. The blue area of the figure plots the total wind energy from a given direction. As can be seen from the concentrated blue section, the most energetic winds come from the east, which is expected as a result of the presence of trade winds in this part of the Caribbean The relatively unidirectional nature of the wind resource suggests that turbines may be placed closer together in a row along the peninsula without the risk of a significant amount of interference between the turbines caused by one turbine being in the wake of an upwind turbine. This will allow the overall footprint of the wind farm to be smaller than would be possible in other sites with more variable wind directions.
In addition, the wind resource is relatively constant, as shown with the probability distribution function in Figure 6. Although the wind resource varies from 0 m/s to more than 10 m/s, wind speeds exceed 5.0 m/s roughly 70% of the time. Again, this phenomenon is consistent with the presence of trade winds and is anticipated to facilitate wind integration relative to sites with more variable wind speeds.

19
Figure 5. Predominant wind direction at Bovoni point, St. Thomas
Illustration by NREL
Figure 6. Frequency of wind speeds at Bovoni point on St. Thomas over the long term
Illustration by NREL
0 5 10 15 20 250
3
6
9
12
Freq
uenc
y (%
)
Probability Distribution Function
Spd 80m (m/s)Actual data Best-fit Weibull distribution (k=3.35, c=6.99 m/s)

20
Turbulence is predicted by the VMM model to be relatively low. Such an estimate is anticipated based on the limited surface roughness of the ocean. Of course, until meteorological tower data are available, the modeled turbulence estimates should be treated with some uncertainty.
VMM monthly wind speed results (Figure 7) correlate well with the actual monthly wind speed variability observed in long-term data sets collected at the Cyril E. King Airport on St. Thomas and elsewhere in the region, as well as satellite data (Special Sensor Microwave/Imager, or SSMI, techniques are often used to assess scalar near-surface wind speeds) for the region (Figure 8). Differences in the reported average annual wind speeds from each of these sources are primarily a function of variability in the height above ground of the measurements and their exposure to local topography and surface roughness.
Figure 7. VMM monthly wind speed profile
Illustration by NREL

21
Figure 8. Empirical and satellite (SSMI) monthly wind speed profile
Illustration by NREL
Consistency among the empirical, satellite, and modeled data are not surprising given the high likelihood that the empirical data shown here are incorporated into the VMM data modeling, simply because there are a limited number of long-term empirical data sets in this region. Nevertheless, consistency among all sources of wind resource data suggests a reasonable level of robustness and precision in the VMM data set. In addition, experience suggests that in a site such as Bovoni, with relatively good exposure to the predominant easterly winds, the VMM data are generally of high quality.
Figures 7 and 8 also indicate that the strongest winds occur from June to July and from November to February. Such variability is not expected to have a significant impact on the economic viability of wind power on St. Thomas but does suggest a need for awareness and planning on the part of WAPA when coordinating generator downtime (both for conventional and wind generators) to carry out maintenance and servicing needs.
The diurnal variability of the wind resource at the Bovoni site (Figure 9) does not correlate as strongly with the empirical data collected on St. Thomas and St. John (Figure 10) as the monthly variability data. This is not altogether unexpected, as the greatest diurnal variability is observed at sites with measurements occurring at relatively low elevations or in locations with complex terrain (i.e., sites that are not directly comparable to Bovoni). When considering the VMM data and the sites more likely to reflect the wind conditions on Bovoni point, there are no strong diurnal trends. This attribute of the wind resource on Bovoni point is likely to facilitate integration of wind power into the St.

22
Thomas power system by reducing both the average magnitude and frequency of daily ramping events resulting from changes in wind speed.
Figure 9. Long-term modeled diurnal wind speed profile
Illustration by NREL
Figure 10. Empirical diurnal wind patterns in the USVI
Illustration by NREL

23
While the diurnal trends are not dramatic, Figure 9 and Figure 10 illustrate that the strongest winds occur early in the morning and into early afternoon. As a result of the design of modern wind turbines, these changes in average wind speed are somewhat amplified when taking into account actual turbine output. The long-term average model data suggests roughly 20%–25% more energy is generated from midnight to noon compared to noon to midnight. As peak demand on St. Thomas occurs in the afternoon and evening hours, WAPA can expect some integration challenges (albeit significantly less than if the diurnal profile had stronger trends) when adding wind at Bovoni point to their system. Such challenges result from the possibility for a combination of decreasing wind generation and increasing system load. Further investigation into the likely variability of power output by time of day would be beneficial in determining the incremental spinning reserve or storage requirements associated with developing new wind power capacity on Bovoni point. More detail regarding renewable energy integration on St. Thomas can be found in Section 6.2.
3.2 Estimated Power Production and Cost of Energy from a Potential Wind Facility on Bovoni Point
There are four key elements that are necessary to estimate power production from a wind facility:
1. Wind resource potential
2. Project size or capacity (in MW)
3. The respective wind turbine power curve, a function that demonstrates the energy produced at a given wind speed by a wind turbine
4. Estimated losses likely associated with a given project
The VMM data discussed above provides 14 years of hourly wind resource potential data. NREL internal documentation provides standard power curves for four different turbine types that may be suitable for Bovoni. The two Vergnet turbines and two Vestas turbines shown in Table 1 were selected based on the fact that these manufacturers are currently operating equipment in the Caribbean (Vergnet 2012a, Vestas 2011). Moreover, they are convenient examples of the medium to large turbines available on the market. Similar turbines, such as the Vestas V112 3.0 MW, GE 1.6xle and 1.6-100, Siemens 2.3-82 or 2.3-101, Gamesa G80 2.0 MW, and G97 2.0 MW, among others, could be expected to produce comparable results to the two large multi-megawatt machines shown in Table 1. Section 6 provides greater detail on applicable turbine types and considerations given the USVI geographic location in a hurricane-prone region of the world.
Based on these turbine designs, installed capacity ranges from 5.5 MW to 13 MW, depending on the specific turbines in use and the ability to place each of these individual turbine types in as many sites as potentially feasible (Table 1; Figure 11).

24
Figure 11. Potential turbine locations on Bovoni point, assuming a turbine with an approximately 100-m rotor
By applying these data and a standard industry total losses2 estimate of 12%, net energy production ranges from 7,000 MWh/year to 29,000 MWh/year (Table 1). The vast breadth of energy generation represented by these estimates is a function of the total installed plant size, which is in turn limited by the number turbines that can be placed on Bovoni point. The range is also the result of varying levels of productivity associated with a given turbine design. The larger Vestas turbines in particular are designed for lower wind speed sites, and hence their performance is significantly better than the Vergnet turbines in the Bovoni point wind regime. The Vergnet turbines are designed for more extreme wind regimes, simplified logistics, and the ability to quickly dismantle the turbines when hurricane or cyclone conditions are imminent (see also Section 6). Energy production estimates are based on inputs of wind resource potential derived from the VMM data, turbine-specific power curves extracted from manufacturer data by NREL, and estimated losses into Windographer, one of the various wind resource assessment software packages.3 Energy production estimates were then used to estimate the average capacity factor for the respective hypothetical facilities noted in Table 1, assuming they would not be subjected to operationally imposed curtailment.
2 Total losses are a reflection of system-wide losses resulting from inefficiencies in the turbine drive train and generator, blade soiling losses resulting from the buildup of dirt and dust on the turbine blades, array losses, and turbine downtime resulting from planned and unplanned maintenance, among other factors.
3 For additional information go to http://www.windographer.com/.
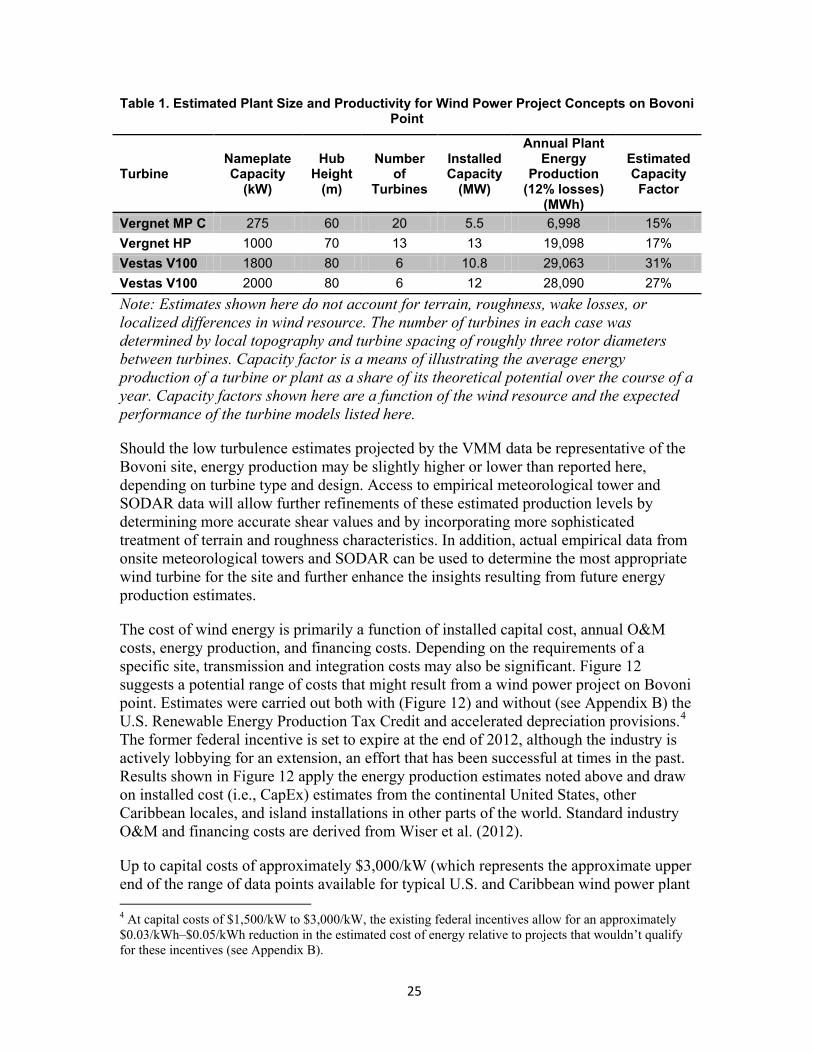
25
Table 1. Estimated Plant Size and Productivity for Wind Power Project Concepts on Bovoni Point
Turbine Nameplate Capacity
(kW)
Hub Height
(m)
Number of
Turbines
Installed Capacity
(MW)
Annual Plant Energy
Production (12% losses)
(MWh)
Estimated Capacity
Factor
Vergnet MP C 275 60 20 5.5 6,998 15% Vergnet HP 1000 70 13 13 19,098 17% Vestas V100 1800 80 6 10.8 29,063 31% Vestas V100 2000 80 6 12 28,090 27% Note: Estimates shown here do not account for terrain, roughness, wake losses, or localized differences in wind resource. The number of turbines in each case was determined by local topography and turbine spacing of roughly three rotor diameters between turbines. Capacity factor is a means of illustrating the average energy production of a turbine or plant as a share of its theoretical potential over the course of a year. Capacity factors shown here are a function of the wind resource and the expected performance of the turbine models listed here.
Should the low turbulence estimates projected by the VMM data be representative of the Bovoni site, energy production may be slightly higher or lower than reported here, depending on turbine type and design. Access to empirical meteorological tower and SODAR data will allow further refinements of these estimated production levels by determining more accurate shear values and by incorporating more sophisticated treatment of terrain and roughness characteristics. In addition, actual empirical data from onsite meteorological towers and SODAR can be used to determine the most appropriate wind turbine for the site and further enhance the insights resulting from future energy production estimates.
The cost of wind energy is primarily a function of installed capital cost, annual O&M costs, energy production, and financing costs. Depending on the requirements of a specific site, transmission and integration costs may also be significant. Figure 12 suggests a potential range of costs that might result from a wind power project on Bovoni point. Estimates were carried out both with (Figure 12) and without (see Appendix B) the U.S. Renewable Energy Production Tax Credit and accelerated depreciation provisions.4 The former federal incentive is set to expire at the end of 2012, although the industry is actively lobbying for an extension, an effort that has been successful at times in the past. Results shown in Figure 12 apply the energy production estimates noted above and draw on installed cost (i.e., CapEx) estimates from the continental United States, other Caribbean locales, and island installations in other parts of the world. Standard industry O&M and financing costs are derived from Wiser et al. (2012).
Up to capital costs of approximately $3,000/kW (which represents the approximate upper end of the range of data points available for typical U.S. and Caribbean wind power plant 4 At capital costs of $1,500/kW to $3,000/kW, the existing federal incentives allow for an approximately $0.03/kWh–$0.05/kWh reduction in the estimated cost of energy relative to projects that wouldn’t qualify for these incentives (see Appendix B).

26
installations), the LCOE of wind could range from $0.07/kWh to $0.30/kWh. If the hypothetical project in Bovoni is similar to the projects in Aruba and Jamaica noted in Section 1.2, both in terms of capital cost and turbine type, this range may be narrowed to $0.10/kWh to $0.20/kWh. For the same installed cost, the higher-productivity Vestas machines result in lower costs per unit of generated electricity. However, installed capital costs are often sensitive to an array of variables, including turbine prices, current global demand for wind power construction skills and equipment (e.g., cranes), the logistical challenges associated with getting to and working on a specific site, transportation costs, and financing costs, among other factors. More realistically, the Vergnet machines can likely be installed at a lower capital cost per unit of installed capacity than the Vestas machines because of simplified logistics. They may also allow for lower financing rates as a result of lower hurricane risk (see also Section 6). Accordingly, a comparison across these four turbine models at a fixed capital cost estimate is likely inappropriate. In addition, the Vestas V100 2.0 MW platform provides enhanced grid services capabilities (see Section 6.4.3). The ability to minimize integration costs with this machine may offset the added cost per unit of generated electricity relative to the Vestas V100 1.8 MW machine.
The wide range in the cost of wind turbines is driven by many factors. The Kodiak project consists of only three 1.5-MW turbines, so the economics of scale drive the cost per megawatt up. The Aruban and Jamaican projects were approximately 30 MW apiece. The Kodiak project also involved significant road improvement and logistical costs, such as shipping in a crane from the mainland United States. The other projects were logistically easier and hence cheaper to build.
Figure 12. Estimated cost of energy from a hypothetical wind project at Bovoni point, including current U.S. federal incentives (e.g., Production Tax Credit and accelerated
depreciation). Note: Detailed input assumptions are summarized in Appendix B.
Estimates shown in Figure 12 were calculated using NREL’s publicly available Cost of Renewable Energy Spreadsheet Tool (CREST). CREST is a simplified discounted cash

27
flow model that calculates the approximate cost of energy based on varying levels of input data.5 Additional details on the modeling inputs, including assumed operations expenditures, financing rates, and other inputs, can be found in Appendix B. These estimates do not reflect potential integration costs. Estimating integration costs requires a detailed system-specific analysis that was beyond the scope of this report. However, installed costs on the upper end of the range would implicitly assume localized transmission system upgrades, substantial island logistics costs, and potentially capital expenditures including storage that could facilitate integration of wind power into the existing system.
In spite of the broad range of potential costs, wind power appears to offer lower energy costs than many competing alternatives in the USVI under most circumstances. With current federal incentives and assuming the logistics, integration, and hurricane hurdles can be resolved for multi-megawatt turbines at a capital cost that is in line with those observed for recent wind installations in Jamaica and Aruba, costs will likely be comparable to or below WAPA’s avoided cost. Utility avoided cost, which is highly sensitive to oil price volatility, was estimated to be $0.15/kWh to $0.17/kWh by RW Beck in 2011 but has increased in the last year as oil prices have trended upward. Assuming that avoided costs continue to increase over time while the cost of wind power is relatively fixed suggests even greater economic value from increased utilization of wind power into the future.
5 For additional information on CREST, go to https://financere.nrel.gov/finance/content/crest-cost-energy-models).

28
4 SR(O)PTTC—Off-Take Opportunities and Considerations
All power generation projects require a purchaser and consumers of the electricity that results from their operations. Power purchasers, also known as off-takers, are often utilities. In the larger power systems of the continental United States, projects may have many possible off-takers that can be courted while a project is in development. With respect to utility-scale power generation in the USVI, however, there are only two potential purchasers of utility-scale wholesale power, WAPA and the University of the Virgin Islands. For a utility-scale wind project, WAPA will likely be the only viable off-taker. In those instances where the WAPA is the project owner, no formal off-taker or intermediary power purchaser is required, as the generation is sold directly to the end consumer as part of the utility’s portfolio of generation assets.
As discussed in Section 8, WAPA has a choice of whether to own and operate utility- scale wind generation in the USVI or provide the off-take for a third-party power producer. Assuming WAPA follows a similar model as it has adopted for the generation of utility-scale solar PV generation, the development of a utility-scale wind power project on Bovoni point would be contingent upon an off-take agreement or power sales contract or power purchase agreement (PPA) between the third-party independent power producer and WAPA.
At present, WAPA is mandated by USVI Act 7075 to acquire 30% percent of its peak generation capacity from renewable resources by 2025 (VI Senate 2009). The favorable cost of wind power suggests that wind is likely to be one of the lower-cost sources of renewable power generation in the territory, and therefore WAPA could be reasonably expected to solicit wind generation at some point in the future.
With a PPA in place, project developers can be assured that there will be a buyer for their products. Securing a PPA from a creditworthy off-taker is often a requirement for project financing and late-stage development activities. As WAPA is a regulated public utility, a PPA with the utility would be a significant security for a project, as the risk that WAPA would be unable to meet the obligations of its PPA is relatively low.
Even with a PPA in place, however, curtailment risk is still present. Curtailment occurs when a utility places a limit on the amount of power that can be generated from a plant and that limit is below what the plant could actually generate at that same time. Curtailment may result under a variety of potential operational conditions, including, for example, grid congestion or minimum generation requirements in the thermal fleet (a threshold that could occur under low-demand conditions such as at night). Curtailment is often used to maintain the requisite voltage, frequency, and stability of the grid system. The potential for curtailment on a small power system such as the St. Thomas/St. John grid is a real possibility. Assuming a given PPA is in terms of megawatt-hours, reducing potential output from a plant will impact the IPP’s revenues. Consideration for the expected level of curtailment that might occur will likely need to be a part of the technical design of the wind project and subsequent PPA negotiations.

29
Although WAPA is currently the only viable off-taker for utility-scale wind on St. Thomas, the proposed interconnection (See section 6) with the Puerto Rico Electric Power Authority (PREPA) and the utility in the British Virgin Islands (BVI) could provide additional opportunities for secondary and tertiary off-takers in the region. As the timeline for the proposed interconnection (should it occur at all) is quite long, it is unlikely that either PREPA or the BVI electric utility will be a realistic off-taker in the near future.

30
5 SRO(P)TTC—Permitting Utility-Scale Wind in the USVI
A utility-scale wind power project represents significant new infrastructure. Realizing a successful wind plant requires an array of federal, territorial, and potentially local permits. Permits typically cover a vast scope, including everything from demonstrated compliance with the Endangered Species Act to local construction and building permits. This section provides insights into the range of permits anticipated and introduces some of the federal and territorial agencies that require engagement to successfully permit a project. It is not intended to be comprehensive; nor does it intend to capture all relevant legal considerations.
Future efforts to develop wind power projects are advised to seek additional legal and expert consultation. It is generally recommended to engage the requisite federal and territorial agencies early in order to identify potential areas of conflict as soon as possible. This section also includes a discussion of the relevant aesthetic, noise, and shadow flicker considerations relevant to the Bovoni site.
5.1 Overview of the Permitting Environment For a typical wind power project, there are a number of federal permits or considerations that must be adequately addressed. All structures higher than 200 feet or within 20,000 feet of a public airport are required to issue notice to the Federal Aviation Administration (FAA). After the project layout has been finalized, FAA reviews the locations for potential aviation, airspace, and navigation conflicts and offers other agencies (e.g., the U.S. Department of Defense) an opportunity to evaluate potential hazards as well. Before construction, a determination of no hazard must be obtained from the FAA.
Projects must also demonstrate compliance with the Clean Water Act, including controls of sediment discharge from the project site and impacts to wetlands. Such compliance could require the completion of a wetlands delineation and engagement with local environmental regulators, the U.S. Army Corps of Engineers, the Council on Environmental Quality, and other federal authorities. EPA also heavily regulates potential spills and their requisite containment strategies. In the USVI, new development activity at ports or in the water bodies surrounding the Bovoni peninsula will also trigger review by the appropriate federal agencies, possibly including the U.S. Coast Guard, the Army Corps of Engineers, and others.
Compliance with the National Environmental Policy Act (NEPA) may also necessary. Various actions may trigger the need the need to comply with NEPA, including but not limited to use of federal funds, impacts to federal lands, and the need for federal permits. The NEPA process typically entails the development of an Environmental Assessment or Environmental Impact Statement and requires review at both the territorial and federal levels, both of which extend the development timeline and add significant cost for developers.
Impacts to wildlife are closely monitored by the Endangered Species Act, the Migratory Bird Treaty Act, the Marine Mammal Protection Act, the Bald and Golden Eagle Protection Act, and potentially other federal or territorial legislation. To maintain

31
compliance with a diverse suite of wildlife protection measures throughout the development process, regular interaction and engagement with the U.S. Fish and Wildlife Service (FWS) and in some cases the National Marine Fisheries Service (NMFS), among other federal and territorial agencies, is often critical. Demonstrated compliance with the full breadth of wildlife regulations often requires an extensive list of biological studies including avian, bat, raptor, and in some cases aquatic, habitat, and botanical studies.
Impacts to significant cultural resources are regulated via the National Historic Preservation Act and in some cases state or territorial legal protections of significant cultural or historical resources. Consultation with the relevant historic preservation office can help to identify any potential issues at a given site. Where culturally significant activities are expected, a cultural resources survey coupled with appropriate mitigation efforts is often necessary.
At the territorial level, there are additional regulatory measures that must be adhered to. The Virgin Islands Coastal Zone Management Act is the body of law that regulates development and management of coastal resources as well as resources inland from the coast. Environmental permitting in the USVI is largely the domain of the Virgin Islands Department of Planning and Natural Resources (DPNR). The Environmental Protection Division, and specifically the Water Pollution Control Program within DPNR, is often involved in the administration of environmental permits specific to the territory. Environmental reviews are informed by the Guidelines for Earth Change Plan/ Environmental Assessment. The presence of a mangrove forest east of the Bovoni peninsula is a potential environmental concern, and determining whether this particular area presents any environmental or wildlife flaws to a project in this location is likely to require engagement with DPNR and potentially other federal agencies.
The Virgin Islands Zoning and Subdivision Law regulates local zoning and land use designations and permitting. These activities are also administered by the DPNR in accord with all relevant local and territorial provisions. Various construction, transportation, and use permits may also be required and are available through DPNR. Explicit rules and regulations for utility-scale wind turbines in the USVI have not been developed or promulgated.
A Closer Look at Wildlife Impacts from Wind Power Historically, wildlife concerns around wind power have emphasized avian and raptor populations. More recently impacts to bats as well as habitat fragmentation and species displacement have also emerged as issues. A substantial body of literature has been amassed that specifically examines the impacts of wind power on avian and bat populations. Federal agencies, including the FWS and nongovernmental organizations such as the National Wind Coordinating Committee, the Bats and Wind Energy Cooperative, and the American Wind and Wildlife Institute, have addressed the issue. Past work in the space has resulted in significant learning, as well as changes in the technology (e.g., moving from lattice to tubular towers) and the electrical infrastructure that accompanies a plant (NWCC 2010).

32
The most significant wildlife concern is direct mortality resulting from blade or tower strikes. Data compiled by Western EcoSystems Technology Inc. from 40 site studies indicate that avian fatalities range from 1 per MW per year to 14 per MW per year. Based on data compiled from 25 site studies, raptor fatalities have been estimated to range from roughly 0 per MW per year to 0.9 per MW per year. Bat fatalities have been estimated to range from 0 per MW per year to as many as 40 per MW per year based on data compiled from more than 40 site studies (NWCC 2010). When compared with data compiled from studies examining other sources of avian fatalities, the impacts from wind turbines (at the present scale of the industry) have been shown to be multiple orders of magnitude lower than the impacts of other leading human causes of bird fatalities (Erickson, Johnson, & Young, 2005; NWCC 2010).
Although the impacts of wind power have been shown to vary widely among different projects and regions of the country, the direct fatality risks have largely been determined to be risks to individuals rather than species. The vast majority of birds that are killed are songbirds (NWCC 2010). Significant migratory bat fatality events have primarily affected migratory tree-roosting bats. These latter events have triggered some concerns around individual bat species, even though the species affected are not yet listed as threatened or endangered. Concerns over bat impacts have been heightened due to their relatively low reproduction rates and other unrelated stressors in the environment, including white-nose syndrome.
Despite impacts that have not significantly affected population levels, the industry continues to seek enhanced understanding of wind turbine wildlife dynamics as well as strategies to minimize impacts. Greatly increased care in preconstruction site evaluation and micro-siting of turbines has become common practice, and practices such as curtailing project operations or shutting down turbines during periods of high risk (e.g., when conditions are ripe for migrations to occur) have been explored with promising initial results. Technological deterrents and postconstruction monitoring have also emerged as mechanisms to reduce wildlife impacts and better understand the interactions of wildlife and wind power. Continued efforts are expected to further assist in minimizing the impacts of wind power on wildlife populations.
5.2 Aesthetic and Public Acceptance Considerations To a large extent, environmental and land-use permitting are manageable challenges. A skilled consultant or legal counsel can go a long way toward ensuring that all relevant permits are in order. Assuming critical fatal flaws such as the presence of threatened or endangered species, significant cultural or historical features, or a hazard determination by the FAA are not present, project success is often dependent on the local permitting process. The general public—including residents in the USVI—are relatively supportive of renewable energy projects, including wind power, assuming there are no zoning or other conflicting land use issues. Nevertheless, local opposition to projects sometimes emerges specifically in relation to aesthetics, shadow flicker, and sound levels. Given the value of tourism to the USVI economy, considerations such as aesthetics and sound are likely to receive significant scrutiny from the local population.

33
Wind turbines are industrial infrastructure that can exceed 400 feet in height. However, perceptions of wind turbines are highly subjective. Some individuals see wind turbines as a detriment to the landscape while others see them as an elegant sign of technological advancement and achievement. The perception of wind power in the USVI is unique given the islands’ use of wind power since the time of the Dutch colonialists. Considering the variety of wind technology options relevant to the USVI (see Section 6), the number and total height of wind turbines placed on Bovoni point will vary substantially depending on the final technology choice. Reliance on multi-MW machines is expected to result in the siting of about six utility-scale turbines on the Bovoni peninsula (Figure 11). Alternatively, the Vergnet HP 1 MW could result in 12 machines on the peninsula, and the machines on the scale of the Vergnet MP C 275kW could result in 20 machines on the site.
Figure 13 represents zones of visual impacts assessment for a typical utility-scale turbine with an 80 m tower. Based on the anticipated nacelle height, as well as data of the terrain in and around St. Thomas, computer modeling can be used to project where the turbines are likely to be seen and whether this represents a full view of the turbine or simply the blade tip passing just above the horizon. Such an analysis, which is based on line of site for typical eye levels, can be used to determine where the turbines are likely to be visible on the islands and, to a degree, how significant a visual impact they are likely to have (red represents the highest visual impact with 5 or more hubs visible, while green represents lesser impact; no visibility is indicated by the absence overlay shading). These calculations do not take vegetation height or presence of buildings or other structures into account and as such, the extent of visual impacts on St. Thomas is expected to be less than is shown in Figure 13. Of course, smaller turbines would have a less extensive visual impact in terms of the total area from which they can be seen (see Appendix C). However, the increased number of machines introduces additional clutter to the landscape for those areas that are in full view of the turbines, regardless of total height.

34
Figure 13. Likely areas where turbine hubs would be visible assuming a 80-m (295-ft) hub height
Note: Number of turbine hubs visible is denoted by the respective colors below:
0 1 2 3 4 5
Zones of visual impacts are useful in communicating the anticipated scope of aesthetic impacts. However, as can be seen, they do not depict the actual appearance of a wind turbine from particular vantage points. Nevertheless, using the zones of visual impacts assessment for the multi-MW turbines (e.g., Figure 13), a number of locations were identified as points of interest for further evaluation. Photos were taken at these specific points (Figure 14), and WindPro software6 was used to create photo visualizations of the turbines from each of these vantage points. Figure 15 illustrates one of these photo visualizations; additional images from other vantage points and displaying technology comparable to the Vergent HP turbine are included in Appendix C.
6 For more information on this software, go to http://www.emd.dk/WindPRO/Frontpage.

35
Figure 14. Points from which photo visualizations were conducted
Figure 15. Photo visualization of a multi-megawatt turbine with an approximately 420-ft tip height (taken from point E in Figure 14)

36
There are aesthetic tradeoffs associated with the various technology types, in addition to the energy production and logistics differences. The largest turbines are visible from a greater number of locations. In some cases, though, they are only just visible with the blade tips extending above the horizon. Regardless, all turbines types considered in this report will be visible from some key locations, including Bovoni Bay.
Sound is potentially another key concern for residents living in close proximity to the Bovoni peninsula. Sound regulations often apply to the property lines of nonparticipating project neighbors or neighbors who have not entered a formal waiver or other agreement with the project owner. In the immediate vicinity of the nacelle of a wind turbine, sound pressure levels for the turbines considered in Section 4 range from 100 A-weighted decibels (dBA) to 105 dBA at maximum nameplate capacity (Vergnet 2012b, Vestas 2012a). However, such levels are attenuated quite rapidly as a function of distance, topography, vegetation, and other factors. Turbines in the continental United States are often placed at a distances of approximately 1,500 ft from nonparticipating neighboring dwellings to comply with local sound ordinances; however, in some cases turbines can be placed much closer (e.g., 1,000–1,200 ft), depending on the local ordinances and landscape features. Figure 16 takes the hypothetical multi-megawatt turbine locations shown in Figure 11 and places a 1,500-ft buffer around each turbine to illustrate setback distances comparable to those often employed in the continental United States.
Figure 16. Possible areas affected by turbine sound based on the potential sites chosen for multi-megawatt turbines utilizing 100-m rotors and typical setbacks in the continental
United States.

37
The vast majority of the Bovoni site is located far from any residential areas. With the possible exception of one or two turbines (assuming multi-megawatt turbines) on the northern end of the peninsula, desktop review of the site and surrounding area suggests that the expected distances are well beyond those required to mitigate for potential sound issues (Figure 16). Moreover, the significantly greater vegetative cover present in the USVI suggests that sound emissions, even from those turbines that have been preliminarily sited at the northernmost end of the peninsula, will likely be attenuated quite rapidly. Nevertheless, a more quantitative assessment of expected sound levels of the surrounding property lines could be gained with the completion of a noise or sound propagation study. Many localities require these types of studies as a condition of local permitting, and it is likely that such an analysis would provide important insights for those who live and work at the northern end of the Bovoni peninsula. However, such an analysis should not be completed until a more definitive layout has been proposed.
Shadow flicker is another concern sometimes raised by project neighbors. Shadow flicker results from the rotation of the blades at times when the sun is low enough on the horizon for a shadow to be cast by a wind turbine. Shadow flicker tends to be a problem at extreme latitudes where the sun spends more time in a position that is low enough on the horizon to result in turbine shadows. It also tends to be a non-issue where sound ordinances are in place, as the distances required to satisfy sound regulations are often large enough to resolve flicker problems as well. At the Bovoni site, again, the majority of the potential multi-megawatt turbine sites are far enough from residential structures that shadow flicker is not likely to be a concern. With respect to the northernmost one or two turbines, a flicker analysis could be conducted to determine whether shadow flicker is likely to be present at any of the proximate structures and at what magnitude (i.e., hours per year) it might affect the project’s neighbors. Again, however, it is not recommended that such work be conducted until a more definitive turbine layout has been determined.
The final concern that arises in discussions with local stakeholders is obstruction lighting. Because all utility-scale turbines exceed the 200-ft FAA height trigger, any utility-scale turbine installed at the Bovoni site will require obstruction lighting. While the significant distance from the individual turbines noted above should reduce the impact of obstruction lighting, these lights are often visible from a distance. Steps can be taken to minimize the impacts of obstruction lighting should it become an issue. Reflective lenses that are able to reduce the amount of light projected downward may help mitigate any concerns. Radar proximity technologies that are able to turn the lights on and off depending on the level of obstruction risk may also be an option but add cost and have not yet been approved by the FAA.

38
6 SROP(T)TC—Technology Options in the USVI
Wind turbine technology has been a part of commercial power markets around the world for decades. The technology has evolved dramatically in terms of scale and cost (Figure 17 and Figure 18). Today, turbines are frequently placed on 80-m and 100-m towers and consist of rotor diameters ranging from 70 m to more than 120 m. Growth in turbine size and scale has resulted in significant cost-of-energy improvements and greatly reduced the number of turbines that must be installed for a desired plant capacity. Taller towers provide access to better wind resources as a function of wind shear at higher levels above the ground. Larger rotors allow the machines to capture a greater fraction of the energy that passes by. Economies of scale in turbine size (turbine components such as controls and power electronics do not increase proportionally with size), project size (resulting in reduced project infrastructure, including roads and underground electrical collection systems), and manufacturing processes have helped drive sizable cost-of-energy reductions.
Figure 17. Evolution in wind turbine technology over time
Illustration by NREL

39
Figure 18. Trends in the levelized cost of wind energy over time
Illustration by NREL (Lantz, Wiser, & Hand 2012)
Today’s technology is typically designed to meet IEC standards, specifically IEC 64000-1. There are three primary classes of turbines (I, II, III), with additional standards that apply for turbulence. The standards have been developed to capture the range of loads a given machine is likely to experience, including high turbulence events and extreme gust conditions. The reference or typical average annual wind speeds for the design standards are 10 m/s, 8.5 m/s, and 7.5 m/s, respectively. Sites that are within the normal operating conditions associated with IEC standards are common on the larger continental regions of the world, where the vast majority of wind power has been installed to date. Modern wind turbines also have the ability to provide an array of grid services. These capabilities have become increasingly important as a means of providing power system support and maintaining system reliability at high penetrations of wind power or on small or weak grids. Specific grid services offered by wind turbines are discussed in further detail in Section 6.4.3.
In an island environment, there are additional factors to be considered that limit the number and type of turbine models that are applicable. In the context of the Caribbean, this includes conditions resulting from hurricanes and tropical storms. In the USVI, additional critical variables include a more challenging logistics environment due to relatively limited port and quay facilities as well as challenging topography and limited land availability. With these factors in mind, a limited number of utility-scale turbines and smaller technologies designed for simplified assembly, installation, and routine raising and lowering might be considered potential candidates.
6.1 Hurricane Considerations Hurricanes and tropical storms are prominent features of the Caribbean. Figure 19 illustrates the frequency and pathway of these storms from 2000 through the present. As can be seen, Bovoni point may be slightly more exposed to storms, as the general approach of tropical storms into the Caribbean appears to be from the south and east. Estimates of hurricane wind speeds for Bovoni point, as reported by the Pan American

40
Health Organization (Vickery and Wadhera no date), are summarized in Table 2 and range from 130 mph to 143 mph at 50- and 100-year return periods respectively.
Figure 19. Tropical storm and hurricane paths, 2000–2012
Data Source: National Hurricane Center
Table 2. Estimated Bovoni Point Extreme Wind Speeds and Period of Return
Return Period
Extreme Wind Speed (mph)
50 130 100 143 700 167 1700 176
Source: Vickery and Wadhera (no date)
Note: Data are modeled and apply to latitude 18.3 –longitude 64.93
Hurricane and tropical storm conditions are not considered in the IEC standards referenced above. The decision to site, warranty, finance, and insure a wind turbine on Bovoni point is expected to depend on the individual design standards of specific original equipment manufacturers (OEMs) and the risk appetite of the potential financier and

41
insurer. In terms of siting and warranting, it is the individual OEMs who are most familiar with the design capabilities of their equipment. Accordingly, the decision to sell and warranty machines in a hurricane-prone area varies among OEMs. Insurance and financing is more a function of the perceived risk and the amount of damage that can be reasonably anticipated in the event that a project is impacted by a hurricane or tropical storm. As is the case with OEMs, some insurance companies may choose not to issue policies for infrastructure in hurricane-prone areas while others may be more willing to insure a given project at the right price. Financiers and insurance companies may require additional protection provisions, such as the Vestas Yaw Power Backup system before engaging a project (Vestas 2012b; Vestas 2011).
The increased probability of hurricanes occurring in the USVI can be reasonably anticipated to have an incremental cost impact resulting from the need for more robust equipment and the increased risks borne by insurers and financiers. However, these hurdles may not preclude wind development in the USVI. As highlighted in Section 1.2, there are other wind projects in operation in the Caribbean, and in advanced development throughout the region that face similar risks.
6.2 Turbine Options for Hurricane-Prone Locales Some turbine suppliers currently sell and warranty their turbines in hurricane-prone parts of the world. Typically these suppliers provide IEC Class I wind turbines, i.e., those machines designed for the most extreme wind conditions. These OEMs are keenly aware of the capabilities and limitations of their machines based on years of operational experience as well as knowledge of their own internal design standards. However, the financial and insurance communities prefer to see empirical evidence and additional protective measures in place, particularly as wind projects have become larger in size and require more capital than may have been the case in the past.
There are at least two manufacturers with a proven track record in hurricane-prone regions of the world. Vestas and Vergnet both offer “anti-cyclonic” technical enhancements for the explicit purpose of allowing their machines to be sited, insured, and financed in areas that are subject to extreme wind events comparable to those associated with a hurricane or typhoon. Note that other turbine manufacturers offer turbines that may meet the requirements of hurricane-prone areas; Vestas and Vergnet are merely two examples.
Here we conduct a coarse evaluation of two currently commercially available options. The Vestas system was highlighted earlier in the description of the Wigton Wind Farm in Jamaica. This system works by providing nacelle yaw and blade pitch control at wind speeds well above the speeds at which a wind turbine would typically shut down (Vestas 2012b, Vestas 2011). This strategy allows the Vestas machines to be optimally oriented into the extreme winds in order to minimize the loads experienced by the machines. In practice, this means that the turbine rotor maintains its position into the wind with one of the blades placed in front of the tower. The Vestas system is designed to continue to provide pitch and yaw control at wind speeds up to 70 m/s, about 155 mph, above both the anticipated 50- and 100-year high-wind events. It can be outfitted on various turbines in Vestas’ fleet (Vestas 2012b, Vestas 2011). The system can also be designed to rely on

42
a small diesel-powered generator or battery located along the collection system or at the base of the turbine, which will power the yaw and pitch drives and instrumentation of the turbines should there be a loss of power from the grid. The provision of onsite power backup offers the assurance that the system will operate as expected, minimizing loads on the turbine in all but the most extreme weather events. Vestas also suggests the possibility of using reinforced towers in regions such as the Caribbean; however, actual tower characteristics are expected to be a function of a given site and its potential risks (Vestas 2011). These additional technological capabilities available from Vestas align directly with the learning that emerged from prior experiences with wind plants and wind turbines that were struck by extreme typhoon events in India in 1998 and China in 2006 (Jargstorf 2010).
Vergnet takes a wholly different approach to managing extreme wind events associated with hurricanes and typhoons. Vergnet offers two turbines at various hub heights that reduce the loads on the turbine by either lowering the turbine to the ground or removing the rotor from the machine altogether (Vergnet 2012a, Vergnet 2012b). When high wind loads are anticipated, the Vergnet MP C 275kW turbine (Figure 20) can be fully lowered and fixed to the ground. The Vergnet MP C turbine has a design survival wind speed of 85 m/s (190 mph) in the lowered configuration (Vergnet 2012a). This approach has allowed these turbines to survive high winds resulting from hurricane Dean, a category I storm that affected the islands of Guadalupe and Martinique in 2007 (Vergnet 2012a). The MP C turbines have also survived direct hits with hurricane conditions up to category IV on the Isle de la Juventud, Cuba (Vergnet 2012c).
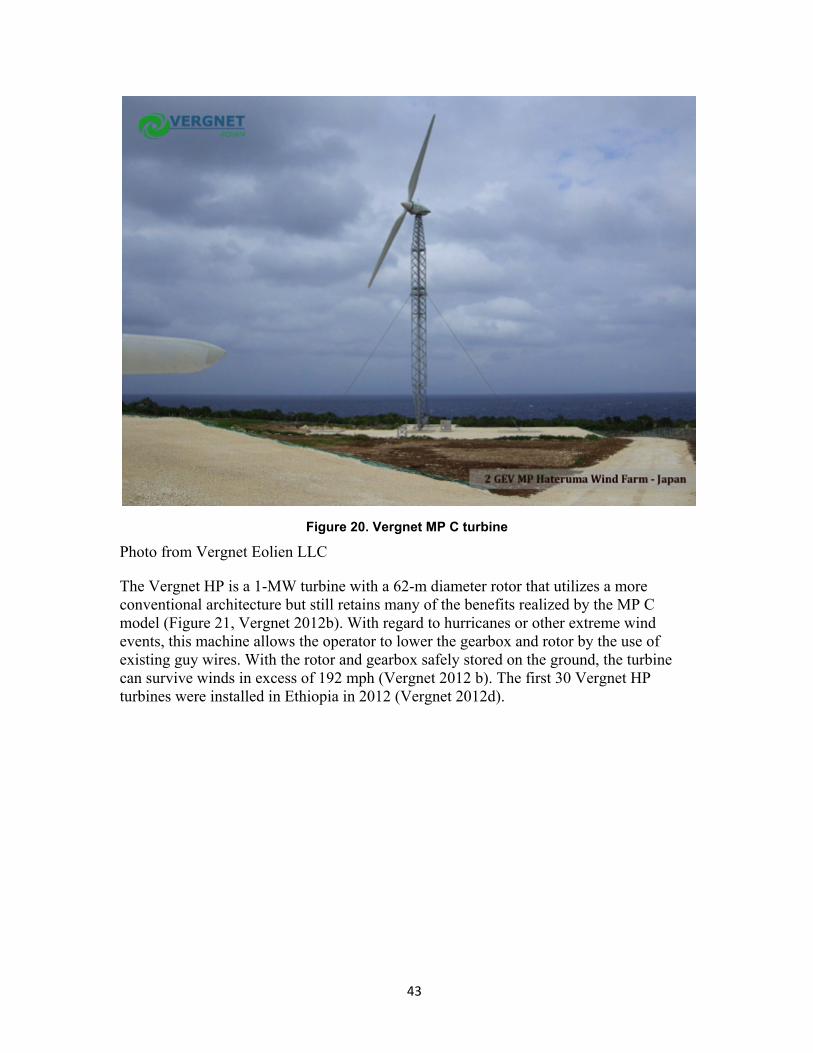
43
Figure 20. Vergnet MP C turbine
Photo from Vergnet Eolien LLC
The Vergnet HP is a 1-MW turbine with a 62-m diameter rotor that utilizes a more conventional architecture but still retains many of the benefits realized by the MP C model (Figure 21, Vergnet 2012b). With regard to hurricanes or other extreme wind events, this machine allows the operator to lower the gearbox and rotor by the use of existing guy wires. With the rotor and gearbox safely stored on the ground, the turbine can survive winds in excess of 192 mph (Vergnet 2012 b). The first 30 Vergnet HP turbines were installed in Ethiopia in 2012 (Vergnet 2012d).

44
Figure 21. Vergnet HP turbine
Photo from Vergnet Eolien LLC
Both Vergnet turbines utilize guyed towers to minimize the amount of concrete required as well as to facilitate the anti-cyclonic systems and minimize the crane size needed to install these turbines. This architecture also minimizes the installation costs and heavy equipment requirements of the turbines; however, the available land area needed for these guy lines can be significant.
As the wind industry continues to grow and mature globally, it is highly likely that additional OEMs will provide the technical solutions such as those presented above that are generally necessary to provide turbine warranties, project financing, and insurance in hurricane-prone regions of the world. The continued development of the offshore wind industry is anticipated to result in new innovations that will further increase the resiliency of wind turbines in hurricane-prone regions. However, for the time being, any procurement strategy is likely to be greatly facilitated by proactive discussion with OEMs, insurance companies, and financiers to increase the likelihood that the preferred technology can be sited, warranted, and financed in the USVI. Of course, technology such as that offered by Vestas and Vergnet provides immediate solutions to the challenges of hurricanes in the USVI.

45
6.3 Logistical Challenges and Considerations Large utility-scale turbines have heavy and long components that will present challenges to local infrastructure, depending on where the turbines are offloaded. The topography of St. Thomas, including the Bovoni point site, is also challenging. Variable and steep terrain (Figure 22) coupled with narrow roads, few open spaces, and shallow ports all contribute to a more a complex logistics environment. However, these challenges are not unique to the USVI. Other island locales, including some that have installed wind turbines, have faced comparable logistical hurdles.
Figure 22. Areas of variable slope designations on St. Thomas
The difficulty of moving and assembling large wind turbine components suggests that shorter and lighter turbines would be advantageous. Smaller machines allow the use of smaller, more accessible cranes. The Vergnet wind turbines discussed above virtually eliminate the need for a crane. Smaller components (blades, towers) are easier to move along narrow steep roads and require less space for staging. However, smaller machines on shorter towers also require a greater number of individual machines to achieve an equivalent level of power production from a given site. More machines suggest proportionally more labor, materials, and earth movement. In actuality, the Bovoni site also constrains the total number of turbines that can be installed. For all practical purposes, it may be impossible to design a wind plant with a machine such as the Vergnet MP C 275kW that can produce the same amount of energy as the larger multi-megawatt machines that also rely on taller towers and larger rotors. Table 1 shows that with the Vergnet machines, a total installed capacity of 5.5–12 MW is reasonable; this compares to 10–12 MW for the larger machines. In addition, the lower anticipated hub heights and

46
smaller rotors of the Vergnet machines results in less energy production per MW relative to the larger taller Vestas machines (Table 1). Assuming the hurricane risks can be mitigated and that the additional logistics costs associated with transporting and assembling the larger turbines do not dramatically alter the project economics, the large turbines designed more for low-wind-speed sites are likely preferable.
6.3.1 Site Access and Transport Considerations At first glance, the most likely offloading point for wind turbine equipment is Crown Bay Cargo Port, located just west of Long Bay and north of Water Island. Large ships can dock here with drafts (the minimum water depth in which a boat can safely operate) up to 30 ft (VIPA 2012). Large container roll-on, roll-off ships dock consistently at this port (VIPA 2012), and desktop analysis indicates that there is a potential laydown area for the storage of components on the east side of the port. However, the port does not appear to have large cranes capable of lifting turbine components. Offloading wind turbine components here would likely require a ship with capable ships gear. Alternatively, turbine components could be placed directly on trailers that are loaded onto a barge. This would make it possible to drive the components off the barge directly onto the pier.
In addition to off-loading considerations, the local infrastructure, such as bridges and roads, must be considered. Considerations should be made for the overall weight, height, width, and length of the components. Particularly critical in the USVI are road slope or grade and turning radius. The technical shipping specifications for critical components, including blade length, shipping weights, and other features, are available in the respective turbine brochures (i.e., Vergnet 2012a; Vergney 2012b; Vestas 2012a). However, generally speaking, components for the Vestas V100 1.8 and 2.0 considered in Table 1 will be much larger than the components for the two Vergnet machines considered. The longest Vestas tower section is roughly 26 m, while the hubs, nacelles, and towers are a maximum of 4.2 m wide and 5 m high, depending on trailer configuration. Many overhead power lines may need to be shut down or insulated and raised for safe passage of the components under the lines. The maximum weight of a single component is 70 metric tons for the nacelle, but the trailer configuration can be adjusted to increase the number of axles in order to spread the weight of the nacelle over a larger area. Bridges and culverts will need to be assessed for their structural integrity, and some may need additional reinforcement—for example, in the form of artificial or temporary bridges constructed over them. The proposed roadways will more than likely need to be shut down to traffic in both directions due to the size of the components. Coordination with local residents and government will be required for the duration of the component deliveries.
From the Crown Bay Cargo Port, there are two primary overland routes that allow access to Bovoni point. These routes are defined in this report as Crown Bay North (CB-N) and Crown Bay South (CB-S). The CB-S alternative travels east along the south shore of St. Thomas around Crown Bay along Route 30. It continues along Route 30 past Frenchman Bay and Bolongo Bay before arriving at Bovoni point (Figure 23). The total distance traveled is approximately six miles with a nearly 400-ft elevation gain and loss along the route. As can be seen in Figure 22 and Figure 23, this alternative is highly unlikely as a viable transport route. There are multiple slopes in excess of 20% grade and at least eight

47
turns that desktop review suggest could potentially prohibit the passage of blades and tower sections longer than 30 m. The other primary option from Crown Bay Cargo Point CB-N is also highlighted in Figure 23. CB-N travels along the south shore on Route 30 but turns northeast on Route 313 and then east again on Route 38 before heading South on Route 32 and back west on Route 30 to arrive at Bovoni point from the east. This route is a little over six miles with a comparable 400-ft elevation gain and loss along the route. CB-N also has multiple slopes in excess of a 20% grade and at least six turns that are likely to prohibit movement of blades and tower sections in excess of 30 m.
Figure 23. Possible equipment drop points and overland transport routes, including likely
problem turns
As a result, of the impracticalities associated with approaching the Bovoni site over land from Crown Bay alternative drop points must be considered. From the various equipment drop alternatives and associated overland transport routes, two viable alternatives have been identified. The first alternative is a beach-side drop point, likely in the vicinity of Bovoni Bay. This drop point would involve bringing a barge or freight ship as close to shore as possible and then lifting the equipment with a vessel-mounted crane to shore, or in the case of a barge, potentially driving it off onto a temporary pier. From desktop bathymetry evaluation (Figure 24), it appears that water depths of 10 ft to 20 ft can be found in relative close proximity to the shore. The proposed Bovoni Bay site maximizes the depth of the water and also minimizes the slope of the potential roadway that would need to be constructed to move the equipment from the seaside to the project site. One option for creating a temporary pier would be a modular causeway system comparable to those in use by the U.S. Army (Figure 25). Such systems have been used in place of piers successfully in the past.

48
Figure 24. Bathymetry in and around Bovoni point
Figure 25. Modular causeway system used by the U.S. Army
Photo from the U.S. Antarctic Photo Program Library

49
A second potential access point for turbine and other heavy equipment begins with a drop point in Red Hook Bay (see Figure 26). Red Hook is a much smaller port than Crown Bay but does have the capability of roll-on, roll-off cargo (VIPA 2012). Some modifications to the immediate area are likely to be necessary due to equipment and potentially storage requirements. The depth of this port has not been definitively determined in this desktop analysis, but the VI Port Authority does have limited information available regarding the technical specifications of the Red Hook Marine Facility (VIPA 2012). The absence of an immediate site for storage of components is likely to complicate the scheduled road closings that are expected for the delivery of the components to site. Some staging of the components could be accomplished with barges that could be docked at Crown Bay and then moved to Red Hook when their equipment is ready to be moved to the Bovoni point site. However, barges accessible to Red Hook Marine Facility would likely have very constrained size limitations, effectively requiring a large number of
Overland, the Red Hook (RH) route is envisioned to follow Route 32 from Red Hook Bay to Route 30 (Figure 26). There are significantly fewer steep grades along the RH route than the two Crown Bay alternatives. Nevertheless there do appear to be localized slopes in excess of 20%.7 There are also two problematic corners. However, both of these corners appear to have the potential to be widened or improved to accept components up to 50 m in length.
Figure 26. Possible overland equipment transport route from Red Hook Bay
7 The actual grade of questionable slopes along the RH route would likely need to be confirmed with an on-site evaluation due to limited reliability of the GIS data used in this desktop analysis.

50
At present it is not clear whether the Red Hook approach or the beach-side drop in Bovoni Bay would be the most viable solution for moving turbine components to the Bovoni point site. Accessing the site from Red Hook may require the use of a large number of smaller barges as well as significant coordination with current ferry operations. Road closures would also require a significant coordination. In addition, the two turns noted above are quite likely to require improvements. Current trailer technologies should be able to facilitate the RH route; specialized trailers such as those manufactured by Goldhofer8 offer unique additional technical solutions such as steerable rear axles and articulated suspensions should they be necessary. The alternative modular causeway system would have little to no impact on local infrastructure but would require additional road building on Bovoni point, and potentially dredging. Such efforts are not insignificant and are contingent on the ability to gain access to a portion of the waterfront property as well as the ability to acquire rights of way. Further study into the specific constraints that exist on the RH route will need to be undertaken by transportation experts. A similarly detailed feasibility study of the beach-side drop point in Bovoni Bay is also recommended. Access to the site remains a potential fatal flaw for a project if shipping costs and coordination become too expensive, particularly for the larger Vestas-type machines.
6.3.2 Construction Logistics and Sequence Another logistics hurdle exists in the challenges associated with assembling and constructing the turbines. In this case, challenges exist both for the Vergnet technologies and the larger Vestas machines. For the larger Vestas machines, the primary site challenges would be the timing and availability of the large crane that these machines require. Such a crane will require an area 100–120 m long that is relatively flat for assembly of the crane. Figure 27 identifies some existing areas on the Bovoni peninsula that may meet these criteria. The roads to and from the assembly area and each specific turbine site would also need to be widened to a minimum of 30 ft and possibly up to 40 ft, depending on the model of crane selected. There are cranes that are only 16 ft wide that may be applicable if the site constraints require this feature. Typical crawler cranes that could be used would require between 19 and 35 semi trailers to move all sections of the crane to site. However, it is anticipated that these components could come through either Red Hook or Crown Bay, as the majority of the crane components are less than 50 ft long (Manitowoc Cranes 2012). An additional smaller crane is expected to be necessary to assist in the building of the large main crane as well as to lift tower sections and turbine rotors.
8 Goldhofer is one of a handful of trailer manufacturers that specialize in the transport of large or otherwise difficult or cumbersome loads. For more information go to http://www.goldhofer.de/gh-en/semitrailers/semitrailers.php.

51
Figure 27. Possible crane assembly area
In terms of staging components for construction and assembly, the most likely scenario will have some components stored on trailers until all components can be moved directly to the prepared turbine pads. Offloading of the turbine components would require a minimum of one small mobile crane. Offloading nacelles would likely require the use of a large crane comparable to that which will assemble the turbine, or potentially two small cranes, depending on the manufacturer’s requirements. Storing some components on trailers will allow a much smaller area to be cleared and leveled at the turbine pad but could present some logistical constraints in terms of hauling each component to the crane when it is ready to lift.
Single-blade erection should be assumed, as the area of laydown at the likely turbine sites is minimal. It is possible that the main erection crane will have to assemble each turbine without moving from an individual turbine site. This would require all components to be ready or staged to complete a full turbine in order (base, mid, top, nacelle, hub, three blades). Another option may be to have the crane assemble bases and midsections first, allowing the grout that joins the turbine tower to the concrete foundation to dry and harden, and then return to all turbines to complete the erection process. This will require twice as much crane movement but may be advantageous in terms of staging or delivery of components. The site roads shown in Figure 28 indicate some steep grades in combination with turns. Crawler cranes are typically capable of traveling longitudinally

52
up or down 20° slopes, but any turns that have to be made while negotiating these steep grades are extremely dangerous. The side slope for crane travel also must be minimal, as cranes are not designed to be laterally stable (instead they are designed with longitudinal stability in mind). Ultimately, the construction logistics and crane details will be contingent on the technology that is chosen and the availability of the required equipment. Further consultation with industry experts is recommended as decisions about specific turbine technology alternatives are considered.
Figure 28. Existing site road profile
Should site access or hurricane conditions necessitate the use of smaller Vergnet turbines, on-site crane logistics become simpler. The Vergnet MP C turbine is a self-erecting turbine (although erection of this machine could be facilitated with a small crane or lift). The Vergnet HP only requires an approximately 50-ton rubber-tire crane to lift the first tower section. From there, the HP relies on a tower-mounted crane to assemble the other pieces of the turbine. However, the Vergnet turbines tend to require more on-the-ground assembly, which requires some increase in the amount of cleared area proximal to the turbine pad. They also utilize significant guying, which results in a slightly larger turbine footprint. More turbines (resulting from fewer kilowatts per turbine), also means more roadway development at the site. Component storage remains a challenge for both the MP C and the HP, although the generally smaller components could reduce the difficulty of storing and staging equipment.
6.4 Grid Integration While the primary technology considerations are around the cost, performance, and reliability of a specific machine, one must also consider the impacts of the technology on

53
the grid system and its operations. Some integration aspects are specific to a given turbine’s technology and design characteristics. Modern variable-speed machines with full power conversion are capable of providing a great deal more grid support and grid services relative to constant speed turbines with induction generators or even variable- speed machines with partial power conversion. Even with the most advanced turbine power electronics, however, high levels of variable renewable generation may also require significant changes in a utility’s operational practices. Improving conventional generation flexibility by adding faster-response combustion turbine units and reducing minimum load limits on steam turbines is one potential solution. Additional methods may include incorporating wind and PV power forecasting into the utility’s day-ahead planning process. Other means of absorbing renewables’ variability, such as demand response and energy storage, can also be used.
In interconnected power systems, including two or more islands, there are additional opportunities for sharing regulation resources, which helps lower the integration costs of variable-output renewable generation. For example, in the case of the USVI, an increase in net load ramp rates due to wind and solar variability could likely be met more cost effectively by Puerto Rico’s power system. Also, larger interconnected systems allow the advantages of geographical diversity and consequent smoothing effects on aggregate wind or PV generation output. The infrastructure investment required to interconnect the USVI into a larger power system, however, would likely need to be justified on grounds independent of its potential benefits for wind and solar integration. Without additional benefits such as significantly lower-cost power, the incremental wind and solar integration cost savings would not be enough to offset the substantial capital cost required to interconnect, for example, St. Thomas and Puerto Rico.
6.4.1 USVI-PR Interconnection Overview Because an interconnected island power grid is expected to offer the potential for reduced cost of energy for the USVI, increased WAPA system reliability, reduced WAPA spinning reserve requirements, and increased potential for high-penetration renewable energy in the USVI (Siemens 2011), efforts have already been initiated to explore the potential for an interconnection of the Puerto Rico Electric Power Authority (PREPA), WAPA, and British Virgin Islands Electricity Corporation grids. The existing power system in Puerto Rico has an installed capacity of approximately 5.8 GW and a peak power load of about 3.3 GW, whereas the existing power system on St. Thomas has an installed capacity of 190 MW and a peak load of 88 MW, and the existing power system on St. Croix has an installed capacity of 105 MW and a peak load of 55 MW (Siemens 2011).
The first step in this process was to perform a feasibility study. In this instance, the study was funded under DOE award DE-OE0000111, and the contract was awarded to Siemens PTI (Siemens 2011). The initial work was completed in mid-2011, with follow-on work completed in late 2011 (e.g., Siemens 2011). A map with the studied transmission options is shown in Figure 29.

54
Figure 29. Conceptual illustration of the proposed interconnection to PREPA studied by Siemens (2011)
Illustration by NREL
The initial feasibility study estimated interconnection capital costs for different AC and DC options and identified the necessary AC power system reinforcements on St. Thomas and St. Croix, as well as at the points of interconnection with the PREPA and BVI systems for a horizon year of 2025. The study also investigated the impact of adding renewable generation to the USVI power system and considered how the interconnections could help achieve renewable energy goals (Siemens 2011). The table below shows renewable penetration scenarios included in the study; percentages are based on system peak load.
The study did not evaluate potential system impacts to PREPA or the potential implications of interconnection on stakeholders in Puerto Rico or BVI. The technical nature of the study precluded any consideration of public support (or lack thereof) for the potential interconnection of USVI, Puerto Rico, and British Virgin Islands in any of the three localities considered.

55
Table 3. Renewable Energy Penetration Scenarios Considered in the Siemens Interconnection Feasibility Study
Penetration 10% 20% 30% 40%
Resource Wind PV Wind PV Wind PV Wind PV
St. Thomas 8 MW 3 MW 16 MW 6 MW 25 MW 8 MW 32 MW 12 MW
ST. Croix 5 MW 2 MW 10 MW 4 MW 15 MW 6 MW 20 MW 8 MW
Source: Siemens 2011
6.4.2 Renewable Energy Grid Integration The Siemens Interconnection Feasibility Study – Final Report (2011) study noted above included a high level power system analysis for a stand-alone and PREPA-interconnected system for each of the renewable scenarios included in Table 3. The steady-state and short-circuit analysis did not reveal major issues that would prevent incorporating wind and PV into the St. Thomas grid. Some thermal loading and low voltage issues suggested minor system reinforcements would be needed in parts of the St. Thomas system (Siemens 2011).
In addition, the Siemens study (Siemens 2011), concluded that spinning reserve requirements for a system without interconnection with PREPA at light loads (i.e., during the night) on both St. Thomas and St. Croix could be much higher than during peak loads. This initial assessment suggests that the current system’s spinning reserve requirements will limit wind and PV penetration to levels below 30% on St. Thomas and 20% on St. Croix. The operating costs of the system also increase substantially with the level of penetration due to high spinning reserve requirements. Large amounts of spinning reserve are needed because the governors of thermal units are unable to respond fast enough to changes in demand. However, in the scenarios considered by Siemens, wind and PV generation did not provide any frequency response and were set to operate at maximum available power. In addition, high resolution USVI wind and PV resource data were unavailable at the time of the analysis. These two conditions are limitations of the study, as inverter technology available in both wind turbines and PV generation can actually provide frequency response and an accurate model of system impacts cannot be fully characterized without local robust high resolution renewable energy resource data (see Section 6.2.3).
The analysis for an interconnected system, however, does suggest that the St. Thomas and St. Croix systems could both handle more than 40% of renewable generation without under-frequency load shedding (UFLS). In fact, a 100% renewable case was analyzed for an interconnected system. The results indicated that WAPA could accommodate very high levels of renewable generation as long as it is able to rely on PREPA to provide frequency regulation.

56
Despite its limitations, the Siemens (2011) study indicates that it becomes increasingly difficult and costly to integrate wind into the current St. Thomas power system as one approaches 30% penetration of wind (as a share of peak capacity). Such findings are consistent with the experiences of Kodiak Island (Alaska) and Aruba. Notably however, in the former instance the incorporation of storage and other system upgrades is anticipated to allow Kodiak to move beyond the 20% penetration (as a share of peak capacity) limit that existed previously. In addition, the Oahu Wind Integration Study (HNEI 2011) reported analysis of variable wind and solar penetrations up to 55%. As such, 30% penetration should not be seen as a limit of the system but merely the limits given current operational practices and fleet characteristics. In fact, the Siemens feasibility study illustrates some technologies that could enhance the ability of the USVI power system to accept larger amounts of variable renewable generation in the absence of an interconnection with PREPA. For example, the use of energy storage devices and the application of wind turbines with inertial and primary frequency capabilities could address at least in part frequency control concerns. These strategies are already being adopted in power systems in Hawaii and on Kodiak Island. Additionally, the development of international grid codes for renewable generation would allow WAPA to have better knowledge of the capabilities of the interconnected renewable generation so the system can be operated efficiently and reliably.
The minimum loads of the St. Thomas power system are reported to be between 50 and 55 MW. Even considering the challenges that accrue as a grid approaches 30% wind penetration, the size of a facility that could be reasonably sited on Bovoni point (Table 1) would be expected to result in a maximum penetration of 20%–25%. Moreover, wind plants typically reach rated power at about 11–13 m/s. The VMM wind resource data suggest that periods when the plant is operating at its maximum rated capacity will be quite rare—less than 3% of the year. These two elements suggest that, as conceived here, the facility on Bovoni point should be manageable in the current St. Thomas power system. Nevertheless, the high-resolution empirical wind data set to be collected on the Bovoni point site will provide significant additional insights into the periods when WAPA’s spinning reserve capacity is in short supply. More refined and continued study of the integration hurdles, as is currently under way will also shed light on the challenges and solutions of integrating variable generation sources in the USVI power grids.9 Experience gained through new PV facilities should also begin to provide significant new insights for WAPA.
6.4.3 Wind Turbine Grid Services Capabilities As suggested above, one means of facilitating grid integration is for wind turbines to provide inertial and primary frequency control. In addition, modern wind turbines are often capable of providing low-voltage ride-through, reactive power, and up and down regulation. The potential to provide these ancillary services has emerged as a result of today’s variable-frequency power converters, which generally allow instantaneous control of turbine electrical power. However, not all turbines contain such power conversion capabilities. The low-voltage ride-through, zero-voltage ride-through, and
9 WAPA has commissioned KEMA to conduct and detailed renewable energy integration study for both the St. Thomas and St. Croix power systems.

57
high-voltage ride-through characteristics of wind turbines will depend on a specific turbine’s electrical topology. Nevertheless, for those turbines that incorporate advanced power electronics and full power conversion, an additional benefit is the ability to control the reactive power independently of active power, or voltage support. Power converters on today’s modern variable-speed machines can deliver reactive power even during times of no wind when no active power is generated. This feature might be especially beneficial for weaker island grids.
The provision of some grid services, such as up-and-down regulation, also offers some potential promise, but requires wind plants to be operated below their maximum potential at a given time. This results in an economic penalty or reduced revenues for the plant operator because they are generating fewer MWh—contracts are typically designed to pay in $/MWh produced. Without appropriate compensation for grid services, there is little or no incentive for wind plant operators to provide them. In the USVI, however, the value of grid services may allow for reduced spinning reserve and lower net fossil fuel consumption. Such opportunities should be explored in further detail, and potential contracts should take into account the potential system-wide value of grid services as well as mechanisms that offer agreeable terms of compensation for both the generator and the system operator.
Another important aspect of a wind power plant impact on the grid is the short circuit current (SCC) contribution of the plant into the transmission network under various fault conditions. The SCC level resulting from wind power may present additional requirements to the switchgear and protection system at the point of common coupling. The level of SCC contribution of a wind power plant depends on electrical topologies of individual wind turbines, electrical distance between wind farm terminals and location of the fault in the grid, substation transformer configuration, and type of fault (symmetrical vs. asymmetrical, line-to-line vs. line-to-ground, etc). Constant-speed wind turbines with induction generators directly connected to the grid will have the most SCC contribution among other topologies due to their physical characteristics (Gevorgian and Muljadi 2010). Variable-speed wind turbines with full power converters will have very low SCC impact due to the control capability introduced by power electronics. Variable-speed turbines with partial converters (double-fed induction generator topology) can limit their SCC by deploying built-in crow-bar circuits during voltage fault events.

58
7 SROPT(T)C— Assembling the Requisite Team
Developing a utility-scale wind power project is a significant endeavor. A vast breadth of technical knowledge, permitting and environmental expertise, financing capability, legal insights, and construction and logistics expertise are generally required. Often an array of individuals from various companies and consultancies are involved in any given project. In addition, the local residents living in the host community where a project is to be sited, the landowners whose property will be used for the project, the government officials and regulators who provide the appropriate permissions and permitting for a project, local nongovernmental organizations (NGOs), and the utility or power purchaser are all part of the extended network that must work together to bring a wind power project to fruition.
As there are no utility-scale wind power projects currently in operation in the USVI, it is likely that the most efficient means of completing a wind power project will involve some level of external expertise from a company already engaged in wind power development in the United States or elsewhere in the world. Leveraging the experience of a developer who has worked in other island locales may bring additional relevant capability to the project team.
The relatively small size of the wind power project anticipated on Bovoni point and the somewhat remote location of the islands also suggests that significant local leadership and actions will be required. In fact, a great deal of local work prior to actual involvement from the technical and financial experts in the wind industry may be necessary to attract the interests of project developers. Such a locally driven development model is not unprecedented. Historically, the efforts of a few local clean energy champions have been fundamental to bringing about successful projects, particularly in localities that have yet to see wind energy development in their region.
The expected importance of local leadership suggests that many things can be done today to start assembling the team or group of individuals that would be necessary to push forward a wind power project in the USVI. The leadership of VIEO in setting up meteorological towers and beginning empirical data collection efforts is a critical first step. However, continued collaboration with DPNR and WAPA, engagement of local landowners and residents proximate to the Bovoni peninsula, and more detailed assessment of the feasibility of specific access points to the Bovoni peninsula are all elements that could facilitate the process of developing and deploying utility-scale wind on St. Thomas. The EDIN-USVI working groups could also be leveraged to help push forward a wind power project. The open and transparent framework of the EDIN-USVI working groups could provide a unique forum for engaging the various stakeholders, from local government officials in the positions of authority over siting and permitting, to WAPA employees and business owners, to landowners and local residents. By working through these existing institutions or more organically at the grassroots level, local stakeholders in the USVI can do a great deal to minimize risks and uncertainty for potential project developers who are likely to engage in the actual development, financing, and operation of a wind power plant on St. Thomas.

59
Collecting and coordinating the key local stakeholders is a process that cannot begin too soon if wind power is desired in the USVI. At present, the permitting process lacks clarity, and there are significant unknowns in terms of landowner interest, potential land use conflicts on the Bovoni peninsula, and even the presence of local opposition to a project. Eliciting the help of local resources, such as the VI Energy Office, in resolving the existing uncertainties and unknowns will assist in generating interest from the rest of the global wind power industry. Moreover, by preemptively engaging all the requisite stakeholders, and not just the project champions and required government officials, the project can be better tailored to the desires and interests of the local community and the community can reach out for the requisite technical expertise as needed. Experience from Puerto Rico demonstrates the value of early stakeholder engagement that goes well beyond the key decision makers and project advocates (O’Neill-Carrillo et al. 2010).

60
8 SROPTT(C)—Capital, Financing, and Ownership Models
Utility-scale wind projects in the continental United States are estimated to cost from $1,500/kW to $2,400/kW (Wiser and Bolinger 2011). Island locales often expect significantly higher installed costs; Jamaica’s Phase II Wigton Wind Farm project was estimated at $2,600/kW (Chin Lenn 2011), while Aruba’s wind project was estimated at $2,800/kW (Theil and Boekhoudt 2010). Given these ranges, the installed cost of a 5- to 13-MW project is anticipated to be on the order of $12 million to $36 million. Raising this level of capital is no small task. Incorporating ownership models that are able to monetize the available tax credits and potential renewable energy credits further complicates the capital component of the project development process.
One option for WAPA, as a public utility, to raise the necessary capital to build a wind power project would be issuing bonds designated for development and construction of a wind power plant. Under this ownership structure, WAPA would be the sole owner of the facility and take on the responsibility of development and operations of the plant. WAPA could utilize external contractors both during development and for operations and maintenance, although the project would be an asset of WAPA. However, WAPA’s current debts and liabilities, as well as the challenges of developing, approving, and successfully achieving a new bond issuance for millions in additional capital, suggest that this is not likely to be the most viable path forward. In addition, WAPA’s status as a tax-free public entity would automatically disqualify it for any potential tax credits (territorial or federal) for which the owner of a wind project might otherwise qualify.
Alternatively, WAPA could decide to pursue a long-term PPA with an IPP. Under this structure, a third party would assume the responsibility of developing, owning, and operating the wind power plant. The IPP would also typically be responsible for the cost of bringing the power to the grid and interconnecting with the existing grid system, including any interconnection studies that might be necessary. In addition, the IPP would take on all development and operations risk. WAPA, in turn, would agree to purchase power from the facility at an agreed-upon price for an extended period and to provide a point of interconnection for the facility. The selection of an IPP would likely involve a solicitation for proposals and a competitive review process prior to the signing of the long-term PPA. It is this ownership model that WAPA has leveraged in seeking to bring on new waste-to-energy generation as well as new solar PV generation. Given the recent past, it is likely that new wind generation will also be acquired from an IPP. In the continental United States about 85% of wind power projects are third-party owned, selling either directly to a utility through a PPA or into wholesale power markets (Wiser and Bolinger 2011).
One advantage of the IPP ownership model is that it could allow the IPP to assemble an ownership structure that would facilitate capture of applicable territorial or federal tax credits. Current evidence suggests that under such an arrangement a U.S.-based limited liability corporation could qualify for federal tax credits, including the Renewable Energy Production Tax Credit. However, the authors of this report are not aware of any formal Internal Revenue Service guidance on this topic, and it is recommended that developers consult with appropriate legal counsel before assuming that any federal tax credits,

61
accelerated depreciation, or other incentives would be applicable to a project located in the USVI.
Although the IPP model reduces the risks for WAPA, PPAs are typically treated as a liability on a utility’s balance sheet. Taking on additional liabilities may impact WAPA’s credit rating, affecting any future efforts to raise capital either for new generation or infrastructure improvements. In addition, cost of capital—particularly for a small island project in a hurricane-prone region of the world—for an IPP is likely to be substantially higher than for a public utility with the capability to request rate changes to recover costs resulting from low-probability events, should they occur. Notwithstanding the potential opportunity associated with federal tax credits and incentives noted above, power procured from an IPP could be incrementally higher in cost than it might be were other utility-owned financing mechanisms feasible.
Whether WAPA chooses to pursue a utility-owned project or rely on an IPP, stakeholders in the USVI should ensure that they realize the benefits from any additional third-party sources of revenue associated with the environmental attributes of the project. Under the IPP ownership model, control of the environmental attributes of wind power may be a point of negotiation. Transferring ownership of the environmental attributes to WAPA would likely result in a slightly higher PPA price, but then give WAPA the ability to either claim the credits itself or sell them to another party, potentially at a profit. Were WAPA to own the project directly, it would be responsible for marketing and selling the environmental attributes of the project should it desire to monetize this additional revenue stream.

62
9 Summary and Conclusions
The USVI has established an aggressive goal in its efforts to reduce fossil fuel consumption 60% by 2025. Achieving this goal will require new investments across various sectors, including new sources of power generation. Wind power is among the lowest-cost sources of renewable energy generation available to the USVI. Depending on the specific technology chosen, actual installed costs (including potentially required grid upgrades and support infrastructure), and the availability of current federal incentives, the LCOE is estimated to range from roughly $0.07/kWh to $0.30/kWh. Assuming installations in the USVI can be generally comparable to the recent utility-scale wind projects installed in Jamaica and Aruba in terms of technology and installed cost, the LCOE is estimated to range from roughly $0.10/kWh to $0.20/kWh. Wind power is not new in island settings or in the Caribbean, and the USVI can learn a great deal from existing island facilities in the region and around the world.
Although there are better wind resource areas in St. Thomas and St. John, the Bovoni peninsula has been identified as a prime candidate for utility-scale wind generation in the northern islands of USVI. It represents a reasonable compromise in terms of wind resource, distance from residences, and developable terrain. The fact that the site already contains industrial development (i.e., a landfill and water treatment facility) also contributes to its viability as a potential location for new utility-scale wind power generation. Hurricane risk and variable terrain on the peninsula and on potential equipment transport routes add technical and logistical challenges but do not appear to represent insurmountable obstacles. Grid integration of wind power into the St. Thomas power system will present operational challenges. Final conclusions on the integration impacts of renewables at the scale likely on the Bovoni point site will not be available until further study of the St. Thomas power system and higher-resolution wind resource data are available. Nevertheless, the experience of other islanded systems of comparable scale suggests that a single wind facility on Bovoni point will be viable but may require some adjustments to system operations as well as technological upgrades. Ultimately, the integration challenges are expected to be manageable for the system and allow for a reduction in net power generation costs to the USVI rate payers.
This paper has focused on the development of utility-scale wind in St. Thomas; however, this does not imply that St. Croix is not a viable place to deploy wind in the USVI. In fact, St. Croix's geography and access to trade winds may in some respects make it a better place to for a wind project. The relatively flat topography and access to industrial ports offered by the south shore of St. Croix suggest that site access and logistics could be significantly more straightforward there. Ultimately, the southern shore of the island and selected ridges may also be prime locations to harness cost-competitive wind power in the USVI.
Whether development occurs on the Bovoni peninsula or on St. Croix, assembling a team of local stakeholders to assist in navigating the complex permitting process is likely to be a critical element of a successful wind project in the USVI. At present, actual permitting requirements for a wind power site are unclear, increasing the risk to developers who might otherwise be interested in moving forward with a project. Such a team could also

63
play a critical role in developing public support for the conceptual project before significant investment is made. The value of investing not only in resource assessment and planning but also in early stakeholder engagement has been demonstrated in other Caribbean contexts and repeatedly in other parts of the world, including the principle markets of Germany and the continental United States.
Initial desktop reviews of the Bovoni site suggest that apart from some visual impacts that might generate opposition, the public acceptance considerations of a project on Bovoni point are likely to be relatively low due to the distance between occupied structures and the majority of the likely turbine sites. As the exclusive near-term utility-scale generation off-taker in the territory, WAPA must also be engaged and involved in potential efforts to move a wind projects forward. Without direct WAPA investment or willingness to enter a PPA, no utility-scale wind power will be built in the near term.
Significant work remains before a utility-scale wind project can be commissioned on St. Thomas and in the USVI; however, the opportunity appears to offer promise. Successfully developing a project will not be simple, but with the right mix of local leadership and expertise, a cost-effective wind power project could likely be realized on Bovoni point. Completing such an initial project could also provide invaluable experience, learning, and technological familiarity for WAPA, local residents, business owners, and tourists. These experiences could provide meaningful insight into future wind and renewable power investments needed to achieve the USVI 60%-by-2025 goal.

64
References
American Wind Energy Association (AWEA) (2012). Year End 2011 Market Report. Washington DC: AWEA.
Aruba Tourism Authority (ATA) (2009). 6.88% Increase in Stay Over Arrivals in 2008. ATA Press Release, March 20, 2009. Accessed May 4, 2012: http://www.aruba.com/news/general-news/688-increase-in-stay-over-arrivals-in-2008/.
AWS Truepower (2010). WindNavigator: Methods and Validation. Albany, NY: AWS Truepower LLC Information Services.
Bloomberg New Energy Finance (BNEF) (2012a). Q2 2012 Levelized Cost of Electricity Update. Energy Research Note: April 4, 2012.
BNEF (2012b). Wind Turbine Price Index Issue VI: Margins at Risk. Wind Research Note: February 8, 2012.
Chin Lenn, M. (2011). “Wind Energy – Small Wind Focus.” Presented at PCJ Energy Seminar, March 3, 2011. Accessed May 4, 2012: http://www.pcj.com/dnn/Portals/0/Documents/Small%20wind%20presentation%20-%20March%203%202011.pdf.
Edenhofer, O.; Pichs-Madruga, R.; Sokona, Y.; Seyboth, K.; Matschoss, P.; Kadner, S.; Zwickel, T.; Eickemeier, P.; Hansen, G.; Schlömer, S.; Stechow, C.V., eds. (2011) Special Report on Renewable Energy Sources and Climate Change Mitigation. Cambridge, UK: Cambridge University Press. Accessed May 4, 2012: http://www.ipcc-wg3.de/publications/special-reports/srren.
Elliot, D. (2008). “U.S. Virgin Islands Wind Resources.” Presented at the 2008 U.S. Virgin Islands Wind Workshop, St. Thomas, USVI. Accessed May 4, 2012: http://www.vienergy.org/menubar/USVI%20Wind%20Resources%20-%20Dennis%20Elliott.ppt.
Erickson, W.P.; Johnson, G.D.; Young D.P. Jr. (2005). A Summary and Comparison of Bird Mortality from Anthropogenic Causes with an Emphasis on Collisions. Gen. Tech. Rep. PSW-GTR-191. Washington, DC: U.S. Department of Agriculture Forest Service.
European Wind Energy Association (EWEA). (2012). The European Offshore Wind Industry Key 2011 Trends and Statistics. Brussels, Belgium: EWEA.
First Wind (2012). Projects. Accessed May 4, 2012: http://www.firstwind.com/projects.
Geerman J.E.; Croes, D.R. (2010). “The Business Impact of the Wind Energy on the Economic Management of the W.E.B. ARUBA N.V.” Presented at the 2010 CARILEC Engineering Conference, July 25–28. St. Maarten.

65
Gevorgian, V.; Muljadi, E. (2010). Wind Power Plant Short Circuit Current Contribution for Different Fault and Wind Turbine Topologies. NREL/CP-5500-49113. Golden, CO: National Renewable Energy Laboratory.
Global Wind Energy Council (GWEC) (2012). Global Wind Report: Annual Market Update 2011. Brussels, Belgium: GWEC.
Hawaii Natural Energy Institute (HNEI) (2011). Oahu Wind Integration Study: Final Report. Honolulu, Hawaii: University of Hawaii for the U.S. Department of Energy Office of Electricity Delivery and Energy Reliability under Award No. DE-FC26-06NT42847.
Hawaiian Electric Company (HECO). Renewable Energy Basics. Accessed May 4, 2012: http://www.heco.com/portal/site/heco/menuitem.8e4610c1e23714340b4c0610c510b1ca/?vgnextoid=deeaf2b154da9010VgnVCM10000053011bacRCRD&vgnextfmt=default.
Heib, J. (2011). “Experiences with Wind Plants and Stability Studies in Isolated Systems.” Presented at the International Wind Diesel Conference, March 9, 2011, Girdwood, AK. http://www.uaf.edu/acep/alaska-wind-diesel-applic/international-wind-diesel/presentations/Wed_310_Hieb_winddiesel.pdf
Jamaica Public Service Company (JPS) (2012). JPS Power Plants. Accessed May 4, 2012: http://www.myjpsco.com/about_us/power_plants.php.
Jargstorf, B. (2011). “Are Hurricanes a Constraint to Wind Development in the Caribbean?” Factor 4 Energy Projects GmbH for Caribbean Renewable Energy Development Project. Presented at the Caribbean Environmental Forum, June 21–25, Montego Bay, Jamaica.
Kodiak Electric Association (KEA). (2012). Accessed May 4, 2012: http://www.kodiakelectric.com/.
Lantz, E.; Olis, D.; Warren, A. (2011). U.S. Virgin Islands Energy Road Map: Analysis. NREL/TP-6A20-52360. Golden, CO: National Renewable Energy Laboratory.
Lantz, E.; Wiser, R.; Hand, M. (2012). IEA Wind Task 26: The Past and Future Cost of Wind Energy. Paris, France: International Energy Agency Wind Implementing Agreement.
Manitowoc Cranes (2012). Accessed May 4, 2012: http://www.manitowoccranes.com/site/EN/Default.aspx.
Munasinghe, M.; Mayer, P. (1993). Energy Policy Analysis and Modeling. New York, NY: Cambridge University Press.
National Wind Coordinating Collaborative (NWCC). (2010). Wind Turbine Interactions with Birds, Bats, and Their Habitats: A Summary of Research Results and Priority

66
Questions. Accessed June 3, 2012: https://www.nationalwind.org/assets/publications/Birds_and_Bats_Fact_Sheet_.pdf
Nexant (2010).Caribbean Region Electricity Generation, Interconnection, and Fuels Supply Strategy. Prepared by Nexant for the World Bank: January 2010.
N.V. Elmar (2012). Accessed May 4, 2012: http://www.elmar.aw/info/content/wp_elmar_home.jsp.
O’Neill-Carrillo, E.; Ortiz-García, C.; Pérez, M.; Baigés, I.; Minos, S. (2010). “Experiences with Stakeholder Engagement in Transitioning to an Increased Use of Renewable Energy Systems,” Proceedings of the IEEE International Symposium on Sustainable Systems and Technology, Washington, D.C., May 2010.
Renewable Energy Policy Network for the 21st Century (REN21) (2011). Renewables 2011 Global Status Report. Paris, France: REN21 Secretariat.
RW Beck (2011). Avoided Energy and Capacity Cost Study 2011. Christiansted, USVI: WAPA.
Siemens (2011). Interconnection Feasibility Study – Final Report. Report R59-11. Prepared for the Virgin Islands Water & Power Authority.
Springer, B. (2012). Initial Economic Analysis of Utility-Scale Wind Integration in Hawaii. NREL/TP-7A20-54248. Golden, CO: National Renewable Energy Laboratory.
Tegen, S.; Hand, M.; Maples, B.; Lantz, E.; Schwabe, P.; Smith, A. (2012). 2010 Cost of Wind Energy Review. NREL TP-5000-52920. Golden, CO: National Renewable Energy Laboratory.
Theil, F.S.; Boekhoudt, O.J. (2010). “The Impact of Wind Energy on the Economic Management of W.E.B. Aruba N.V.” Presented at the 2010 CARILEC CEO Conference, May 26, 2010.
U.S. Census Bureau (2012). State and County Quick Facts. Washington D.C.: U.S. Department of Commerce, Economics and Statistics Administration. Accessed May 4, 2012: http://quickfacts.census.gov/qfd/states/02/02150.html.
U.S. Department of Energy (DOE) (2010). Memorandum of Understanding Between the U.S. Virgin Islands, the U.S. Department of Energy, and the U.S. Department of the Interior, February 16, 2010.
U.S. Department of Energy (DOE) (2008). 20% Wind Energy by 2030: Increasing Wind Energy's Contribution to U.S. Electricity Supply. DOE/GO-102008-2567. Washington, DC: DOE. http://www.nrel.gov/docs/fy08osti/41869.pdf.

67
U.S. Virgin Islands Senate (VI Senate). (2009). The Virgin Islands Renewable and Alternative Energy Act of 2009. Act 7075. Regular Session (May 22, 2009): Bill No. 28-0009.
Vergnet (2012a). GEV MP 275 kW. Vergnet Eolien Turbine brochure. Accessed May 4, 2012: http://www.vergnet.com/pdf/gev-mpc-en.pdf.
Vergnet (2012b). GEV HP 1 MW. Vergnet Eolien Turbine brochure. Accessed May 4, 2012: http://www.vergnet.com/pdf/gev-mpc-en.pdf.
Vergnet (2012c). Vergnet Caribbean: Isle de la Juventud. Accessed May 4, 2012: http://www.vergnet.com/en/centrale-jeunesse.php.
Vergnet (2012d). Vergnet Ashegoda. Accessed May 4, 2012: http://www.vergnet.com/en/centrale-ashegoda.php.
Vestas (2011). “Vestas in the Caribbean.” Presented at the 2011 CARILEC Renewable Energy Forum, September 2011, St. Thomas, USVI.
Vestas (2012a). 2.0 MW Turbine Brochure. Accessed May 4, 2012: http://nozebra.ipapercms.dk/Vestas/Communication/Productbrochure/2MWTurbineBrochure/V80V90V100/.
Vestas (2012b). Yaw Power Back-up. Accessed May 4, 2012: http://www.vestas.com/Files/Filer/EN/Brochures/10842_Option_YawPower_UK_PROOF1.pdf.
Vickery, P.J.; Wadhera, D. (No Date). Development of Design Wind Speed Maps for the Caribbean for Application with the Wind Load Provisions of ASCE 7. Applied Research Associations for the Pan American Health Organization and the Office of Foreign Disaster Assistance of the United States Agency for International Development.
Virgin Islands Port Authority (VIPA) (2012). Seaports and Marine Facilities. Accessed May 4, 2012: http://www.viport.com/seaports.html.
W.E.B. Aruba (2012). Accessed May 4, 2012: http://www.webaruba.com
Weisser, D. (2004). “On the Economics of Electricity Consumption in Small Island Developing States: A Role for Renewable Energy Technologies?” Energy Policy (32); pp. 127–140.
Wiser, R.; Bolinger, M. (2011). 2010 Wind Technologies Market Report. DOE/GO-102011-3322. Washington DC: U.S. Department of Energy Office of Energy Efficiency and Renewable Energy.
Wiser, R.; Lantz, E.; Bolinger, M.; Hand, M. (2012). Recent Developments in the Levelized Cost of Energy from U.S. Wind Power Projects. Berkeley, CA: Lawrence

68
Berkeley National Laboratory presentation. Accessed May 4, 2012: http://eetd.lbl.gov/ea/ems/reports/wind-energy-costs-2-2012.pdf.
Woodford, D. (2011). Oahu Wind Integration and Transmission Study (OWITS): Hawaiian Islands Transmission Interconnection Project. NREL SR-5500-50411. Golden, CO: National Renewable Energy Laboratory.
World Bank (2012a). Data: Aruba. Accessed May 4, 2012: http://data.worldbank.org/country/aruba.
World Bank (2012b). Jamaica at a Glance. Accessed May 4, 2012: http://devdata.worldbank.org/AAG/jam_aag.pdf.
Xtreme Power (2012). Xtreme Power Chosen for Alaska’s First Utility-Scale Wind Farm. Xtreme Power Press Release, April 10, 2012. Accessed May 4, 2012: http://www.xtremepower.com/downloads/pressreleases/Project-Bear-Release_FINAL-2.pdf.

69
Appendix A: Anemometry
VIEO received American Recovery and Reinvestment Act (ARRA) funding through the State Energy Program to proceed with a wind resource assessment on the islands of St. Thomas and St. Croix. Once erected, the towers are anticipated to be in place for no less than 12 months and no more than 24 months. Anemometry includes erection of instrumented 60-m meteorological towers and deployment of Sonic Detection and Ranging (SODAR) units. NREL plans to regularly collect and perform quality assurance on the data. Assuming funding is available, the data will be processed for public release.
Preliminary equipment type and locations are shown in Table A1, Figure A1, and Figure A2.
Table A1. Equipment Installation Sites, St. Thomas and St. Croix
Island Site Name Latitude Longitude Equipment Type
Land ownership 60 m
tower SODAR
St. Thomas Bovoni 1 (Tower 1) 18.309°N 64.888°W 1 private
St. Thomas Bovoni 2 (Tower 2) 18.305°N 64.876°W 1 GVI*
St. Thomas Bovoni 3 (SODAR) 18.305°N 64.876°W 1 GVI*
St. Croix Robin Bay (SODAR) 17.743°N 64.636°W 1 private
St. Croix Estate
Longford (Tower)
17.708°N 64.693°W 1 private
* Government of the Virgin Islands **Data were unavailable at the time of publication

70
Figure A1. Proposed wind resource data collection points on St. Thomas
Figure A2. Proposed wind resource data collection points on St. Croix

71
Meteorological towers will be instrumented as described in Table A2. Towers will be guyed, tilt-up, tubular type towers. The two SODAR units will be Second Wind Triton SODARs.
Table A2. 60-m Tower Instrumentation Descriptions
Height Equipment Installation Description
58 m Anemometers on booms with min. length to tower diameter ratio of 12, 2 ea.
Booms mounted orthogonally at 45 and 135 degrees from true north
53 m Wind vane on boom with minimum length to tower diameter ratio of 12, 1 ea.
Boom mounted at 90 degrees from true north
47.5 m Anemometers on booms with min. length to tower diameter ratio of 12, 2 ea.
Booms mounted orthogonally at 45 and 135 degrees from true north
34 m Wind vane on boom with minimum length to tower diameter ratio of 12, 1 ea.
Boom mounted at 90 degrees from true north
32 m Anemometers on booms with min. length to tower diameter ratio of 12, 2 ea.
Booms mounted orthogonally at 45 and 135 degrees from true north
~2 m Electrical enclosure, weather tight
Houses/holds DAQ, communication equipment, temperature sensor, and batteries, PV panel
~2 m PV panel(s) Quantity and orientation shall provide year-around power to battery system
3 m Temperature sensor, 1 ea. Mounted directly on tower
3 m Barom. pressure sensor, 1 ea. Mounted directly on tower
2 m Pyranometer, 1 ea. Mounted on separate post, 30 ft south of tower
60 m Lightning rod with earth ground
All towers will be provided with a cellular communication modem. The SODAR units will have a Globalstar satellite modem. All data will be sample at single-second intervals with wind data recorded on 10-minute intervals and solar resource data on 1-minute intervals. Data download frequency requirements are a minimum of once per day.

72
Tower instrumentation specifications are below:
• Speed sensor (must be calibrated): SWI C3C (982), NRG 40C, or equivalent • Direction vane: SWI PV-1 (983), NRG 200P, or equivalent • Temperature sensor: NRG 110S (sensor and shield assembly) • SWI thermistor 395 with radiation shield 144, or equivalent • Pressure sensor (barometric): SWI SETRA model 276, NRG BP20, or equivalent • Pyranometer: SWI Licor LI-200 SZ, NRG Licor LI-200SA (item#1948) plus
required accessories for connection to data logger

73
Appendix B: Cost of Energy Modeling Inputs and Supplementary Estimates
Calculating the cost of energy requires estimates of installed capital cost, annual O&M cost, expected annual energy production, and an the cost of financing. Expected annual energy production data are drawn from the VMM data and turbine-specific power curves associated with the four turbine types profiled for this study, based on their current use in the Caribbean region. A summary of the turbine characteristics and other assumptions used to estimate the cost of energy are shown in Table B1.
Table B1. Bovoni Point Cost of Energy Modeling Inputs
Characteristics Vergnet MP C Vergnet HP Vestas V100 Vestas V100
Nameplate capacity 275 kW 1.0 MW 2.0 MW 1.8 MW
Hub height 60 m 70 m 80 m 80 m
Rotor diameter 32 m 62 m 100 m 100 m
Expected capacity factor 15% 17% 27% 31%
Operating costs $60/kW-year $60/kW-year $60/kW-year $60/kW-year
Total plant losses (availability, array, other)
12% 12% 12% 12%
Financing cost/ discount rate (nominal; 100%equity financing assumed)
10.5% 10.5% 10.5% 10.5%
Due to significant uncertainty in terms of installed capital costs, the estimated cost of energy is shown as a function of installed cost. Figures B1 and Figure B2 illustrate the anticipated cost of energy with and without the U.S. Federal Production Tax Credit and accelerated depreciation provisions, as there is some uncertainty regarding whether these two financial incentives will apply to a project built on St. Thomas and if in fact the production tax credit will be in effect should a potential wind power plant on St. Thomas become a reality (the credit is currently slated to expire at year-end 2012).
As a point of reference, recent projects in the continental United States have installed costs that range from approximately $1,500/kW to $2,200/kW (Wiser and Bolinger 2011), other projects in the Caribbean (e.g., Jamaica’s Wigton Wind Farm Phase II and Aruba’s Vader Piet project) have been estimated to have installed capital costs on the order of $2,600/kW to $2,850/kW. Extensive road-building and complex routing as well as the remote location and limited construction window resulted in Kodiak Island’s Pillar

74
Mountain Wind Farm exceeding $5,000/kW; however, costs at that level are rare.
Figure B1. Estimated cost of energy from a wind power facility on Bovoni point St. Thomas across a range of installed costs with current federal incentives
Figure B2. Estimated cost of energy from a wind power facility on Bovoni point St. Thomas across a range of installed costs without current federal incentives

75
Appendix C: Supplementary Photo Visualizations
This report considered turbines with three different hub heights and three different rotor diameters. In addition, these machines ranged from 275 kW up to 2.0 MW. Accordingly, they have varying visual impacts. Figures C1, C2, and C3 each demonstrates the zones of visual impacts expected for the different hub heights of the turbine technology highlighted here. Visual impact zones are based on the turbine hubs. Additional sites may be able to see blade tips from certain vantage points. The number of hubs visible from a given site in the following figures is captured by the color scheme below:
0 1 2 3 4 5
Figure C1. Zones of visual impacts for the Vergnet MP C 275 (60-m hub height)

76
Figure C2. Zones of visual impacts for the Vergnet HP 1.0-MW (70-m hub height)
Figure C3. Zones of visual impacts for the Vestas V100 (80-m hub height)
A series of photo visualizations centered on the megawatt-plus wind turbines highlighted in this report has also been conducted. Photo vantage points were informed by the zones of visual impacts maps shown in the figures above and are highlighted in Figure C4. Figures C5 through C12 represent visualizations of the Vestas V100 turbines on an 80-m tower. Figures C13 to C15 represent visualizations of the Vergnet HP 1.0 MW. Visualizations of the Vergnet HP are included for only a few select images to illustrate the contrast of the two technology types.

77
Figure C4. Photo visualization vantage points
Figure C5. Vestas V100 visualization from point A

78
Figure C6. Vestas V100 visualization from point B. Note the yellow line denotes expected blade tip height from this vantage point.
Figure C7. Vestas V100 visualization from point C
Figure C8. Vestas V100 visualization from point D

79
Figure C9. Vestas V100 visualization from point E
Figure C10. Vestas V100 visualization from point F

80
Figure C11. Vestas V100 visualization from point G
Figure C12. Vestas V100 visualization from point H

81
Figure C13. Vestas V100 visualization from point I
Figure C14. Vestas V100 visualization from point J

82
Figure C15. Vestas V100 visualization from point L
Figure C16. Vestas V100 visualization from point M

83
Figure C17. Vergnet HP visualization from point E
Figure C18. Vergnet HP visualization from point F

84
Figure C19. Vergnet HP visualization from point H
Figure C20. Vergnet HP visualization from point I