Embed Size (px)
Citation preview

Released May 2019
ACHELOUS MEMS SPEAKERS UT-P 2016 | DATASHEET
Achelous MEMS speaker is ideal for in-ear audio solutions such as wired earphones or true wireless systems (TWS). Thanks to its small size and lightweight, Achelous offers maximum flexibility for outstanding design approaches. As a speaker with a wide bandwidth it enables high-res audio applications. Achelous produces vivid, clear and rich sound, immersing the listener into their personal audio environment.
FEATURES
• Full bandwidth achieved by a single MEMSspeaker
• Enables modern, lightweight and ergonomicdesigns for wired earphones and TWS
• Seamless integration into acoustics devices• Longer battery life due to the speaker low
power consumption• Competitive sound pressure level• No magnetic field• Low heat generation
APPLICATIONS
• In-ear audio systems

Released April 2019
TABLE OF CONTENT
Components 3 Specifications 4 Test conditions 6 Acoustic performance in coupler (IEC 60318-4) 7 Acoustic performance using the Carme test box in coupler 8 Mechanical dimensions 9 Connectivity 10 Tracking 10 Handling and assembly recommendations 11 Important notice and disclaimer 12
Annex: THD assessment 13
REVISION HISTORY

3
Released May 2019
COMPONENTS
Figure 1: Achelous MEMS speaker components.
4
Released May 2019
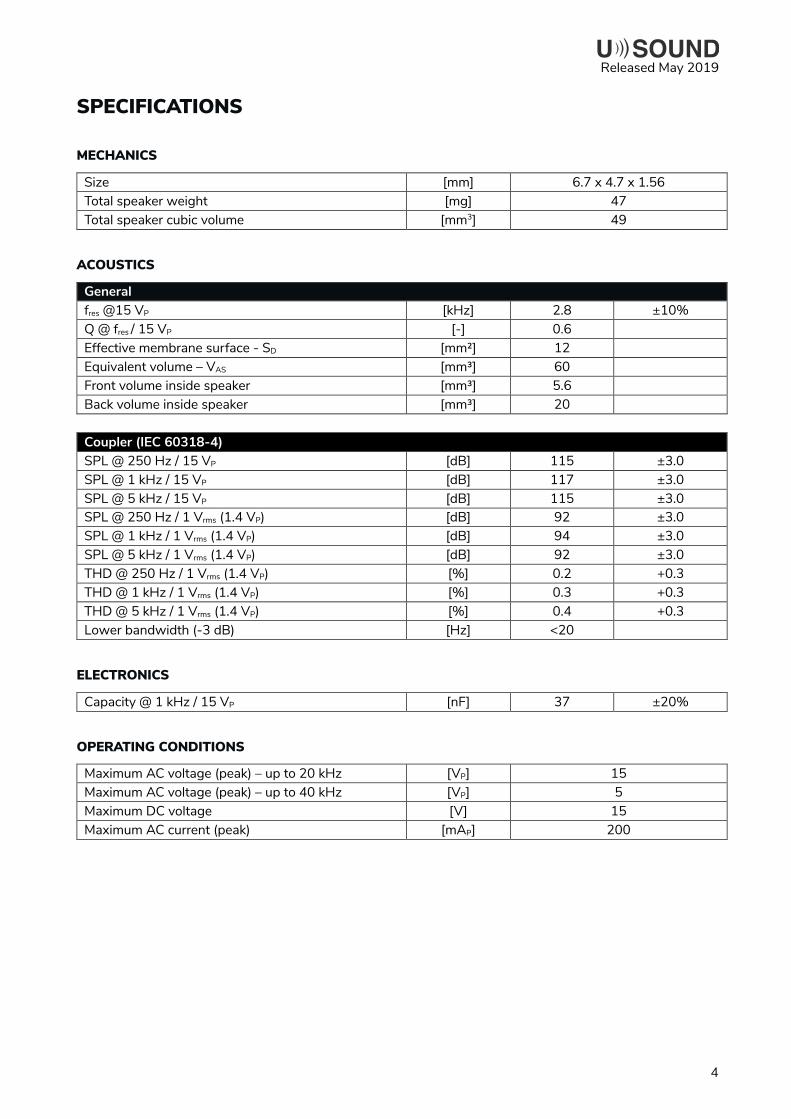
SPECIFICATIONS
MECHANICS
Size [mm] 6.7 x 4.7 x 1.56 Total speaker weight [mg] 47 Total speaker cubic volume [mm3] 49
ACOUSTICS
General fres @15 VP [kHz] 2.8 ±10% Q @ fres / 15 VP [-] 0.6 Effective membrane surface - SD [mm²] 12 Equivalent volume – VAS [mm³] 60 Front volume inside speaker [mm³] 5.6 Back volume inside speaker [mm³] 20
Coupler (IEC 60318-4) SPL @ 250 Hz / 15 VP [dB] 115 ±3.0 SPL @ 1 kHz / 15 VP [dB] 117 ±3.0 SPL @ 5 kHz / 15 VP [dB] 115 ±3.0 SPL @ 250 Hz / 1 Vrms (1.4 VP) [dB] 92 ±3.0 SPL @ 1 kHz / 1 Vrms (1.4 VP) [dB] 94 ±3.0 SPL @ 5 kHz / 1 Vrms (1.4 VP) [dB] 92 ±3.0 THD @ 250 Hz / 1 Vrms (1.4 VP) [%] 0.2 +0.3 THD @ 1 kHz / 1 Vrms (1.4 VP) [%] 0.3 +0.3 THD @ 5 kHz / 1 Vrms (1.4 VP) [%] 0.4 +0.3 Lower bandwidth (-3 dB) [Hz] <20
ELECTRONICS
Capacity @ 1 kHz / 15 VP [nF] 37 ±20%
OPERATING CONDITIONS
Maximum AC voltage (peak) – up to 20 kHz [VP] 15 Maximum AC voltage (peak) – up to 40 kHz [VP] 5 Maximum DC voltage [V] 15 Maximum AC current (peak) [mAP] 200

5
Released May 2019
POWER CONSUMPTION
Power consumption is measured with one Achelous MEMS speaker including the typical driving circuitry with the DC boost converter TPS61046 and amplifier TI LM48580. The main blocks are presented on Figure 2 and Figure 3. Condition: Supply voltage 3.6 V; audio output 94 dB in coupler.
Power consumption with white noise [mW] 19.8 Power consumption with pink noise [mW] 17.4 Power consumption with IEC noise (60268-1) [mW] 13.6
The boost converter is configured to provide a constant 15 VDC offset for the amplifier. The amplifier circuit itself is based on the typical application diagram from the LM48580 datasheet. It is based on a single ended input signal but can be also modified according to the datasheet to a differential input. The circuit has three pins for configuration. These can be switched via a microcontroller or logic, or simply hard wired. • Enabling the boost converter: The boost converter can be enabled/disabled using the VB_ENABLE
signal. If no microcontroller or logic is available, the pin can be pulled high so that the boost converter is always enabled as soon as the supply voltage is present.
• Enabling the amplifier: The amplifier can be enabled/disabled using the AMP_ENABLE signal. If no microcontroller or logic is available, the pin can be pulled high so that the boost converter is always enabled as soon as the supply voltage is present.
• Amplifier gain: The LM48580 has three different gain settings which can be configured using the GAIN signal. The gain pin can be either ground, floating or VDD depending on the needed gain.
Gain Pin Voltage Resulting Gain Setting GND 24 dB Float 18 dB VDD 30 dB
Figure 3: LM48580 amplifier including needed passive.
Figure 2: TPS61046 boost converter including needed passive components.

6
Released May 2019
TEST CONDITIONS
General Measurement system Audio Precision APx Measurement signal Exp. sweep Voltage levels – audio VDC + VAC 15 V + 15 VP
Applied back volume Open (infinite)
Coupler (IEC 60318-4) Coupler type IEC 60318-4 (711) Coupler volume 1.26 cm3 Connection tube length 1.5 mm Connection tube diameter 3.0 mm Microphone GRAS 43AC
COUPLER MEASUREMENT ADAPTER
Figure 4: Coupler adapter cross section. The outlet of the coupler for the speaker is round with a diameter of 3 mm as shown in Detail D.

7
Released May 2019
ACOUSTIC PERFORMANCE IN COUPLER (IEC 60318-4)
Figure 5: SPL @ 15 VP drive
Red lines indicate the limits. Test limits are used to stablish incoming inspection acceptance / rejection criteria, correlation of test equipment with USound is also required for elimination of equipment and test method variation.
Figure 6: THD 94 dB SPL @ 1 kHz, corresponds 1 Vrms (1.4 VP) Low pass filter @ 16 kHz is added due to typical audible frequency range of adults. In-depth information about the THD assessment of the Achelous MEMS speaker is available in the annex.
60
70
80
90
100
110
120
130
140
10 100 1,000 10,000
SPL
[dB
]
Frequency [Hz]
0123456789
10
1,000 10,000
THD
[%]
Frequency [Hz]
No filtering in the analyzer
Low Pass @16 kHz in the analyzer

8
Released May 2019
ACOUSTIC PERFORMANCE USING THE CARME TEST BOX ON COUPLER
To analyse the performance of the Achelous MEMS speakers, the test box Carme is available. With a back volume of 100 mm³. Carme provides the necessary sealing to avoid an acoustic short circuit and offers a convenient way to connect Achelous to USound's linear amplifier, Amalthea. In order to set up Carme, unscrew and separate the PCB from the shell. Remove the housing gasket and place the Achelous MEMS speaker with the contact side up. Place the PCB matching the orientation marks to the speaker. Tighten the screws for proper sealing. To obtain the measurements below, a gasket should be added on the front surface of Carme the box. The Carme box should be placed on the core part of the coupler without the ear mould adaptor.
Figure 8: Achelous SPL measurement on the coupler in the Carme test box.
100
105
110
115
120
125
130
135
10 100 1,000 10,000
SPL
[dB
]
Frequency [Hz]
Reference adapter on coupler Carme-box on coupler
Figure 7: Positive input (BE) blue and negative input (TE) green. The colour coding matches the
outputs of Amalthea.

9
Released May 2019
MECHANICAL DIMENSIONS

10
Released May 2019
CONNECTIVITY The speaker is driven by applying voltage between the connections for the top electrode (TE) and the bottom electrode (BE). The potential of BE has to be always equal or higher than the TE. To ensure that, a DC voltage together with the AC signal have to be applied on BE. Attention: The AC peak voltage must always be smaller than or equal to the DC voltage.
Connections from amplifier
Connections on the speaker
Positive voltage BE (bottom electrode) Negative voltage TE (top electrode)
Further information on how to electrically connect MEMS speakers can be found on https://athena.usound.com/how-is-ganymede-connected-electrically/
TRACKING Each speaker is equipped with an 8x18 digital matrix code (DMC) • DMC Size: 3.6 mm x 1.6 mm • Pixel size: 0.2 mm • Data format corresponds to the production
date: NNYCCDSSSS. For example: 0291024022
01 9 10 2 4022 NN Y CC D SSSS
Speaker type (01 = Adap;
02 = Achelous)
Year (Last digit
of the year)
Calendar week Week day (First day starts
on Sunday)
Serial number

11
Released May 2019
HANDLING AND ASSEMBLY RECOMMENDATIONS • The plate and membrane of Achelous MEMS speakers are sensitive to deformation and must not be
touched. Picking the speaker from the side with tweezers is recommended.
Using a gasket on the front side of Achelous MEMS speakers for sealing and cushioning impacts is advised. Additional information on mounting can be found on https://athena.usound.com/knowledge/ •
12
Released May 2019
IMPORTANT NOTICE AND DISCLAIMER USound GmbH (“USound”) makes no warranties for the use of USound products, other than those expressly contained in USound’s applicable General Terms of Sale, located at www.usound.com. USound assumes no responsibility for any errors which may have crept into this document, reserves the right to change devices or specifications detailed herein at any time without notice, and does not make any commitment to update the information contained herein. No license to patents or other intellectual property rights of USound are granted in connection with the sale of USound products, neither expressly nor implicitly. In respect of the intended use of USound products by customer, customer is solely responsible for observing existing patents and other intellectual property rights of third parties and for obtaining, as the case may be, the necessary licenses. Important note: The use of USound products as components in medical devices and/or medical applications, including but not limited to, safety and life supporting systems, where malfunctions of such USound products might result in damage to and/or injury or death of persons is expressly prohibited, as USound products are neither destined nor qualified for use as components in such medical devices and/or medical applications. The prohibited use of USound products in such medical devices and/or medical applications is exclusively at the risk of the customer.
USound GmbH | www.usound.com | [email protected]

MEMS SPEAKERS THD ASSESSMENT

14
CONTENT
Introduction 3
Fundamentals of Total Harmonic Distortion 4
THD in MEMS Compared to Electro Dynamic Speakers 9
THD Assessment Example: USound’s Achelous 10
For more articles and white papers about
For more articles and white papers about audio and MEMS speakers, visit: www.athena.usound.com

15
INTRODUCTION
The disruptive technology of MEMS loudspeakers sparks new discussions that must be addressed for a deeper comprehension of their potential and applications. USound, as the first company focused on providing audio solutions based on MEMS, is invested in facilitating information for those who want to explore this technology.
This whitepaper contains insights into total harmonic distortion (THD). Together with the sound pressure level (SPL), THD is one of the core parameters of any loudspeaker characterisation. However, in MEMS speakers, it needs to be interpreted slightly differently.
After a brief explanation of THD, we will dive right into assessing THD based on the example of USound speaker Achelous.

16
FUNDAMENTALS OF TOTAL HARMONIC DISTORTION
THD (total harmonic distortion), is a common method to describe the linearity and purity of an electric, electroacoustic or mechanic system. In acoustic engineering, it quantifi es the accuracy of sound reproduction by comparing input and output signal.
THD is given in percent, with the percentage representing the fraction of the output signal that is false compared to the input signal. Low THD thus means that the output signal resembles the input signal very closely, providing a clear and accurate sound reproduction.
DISTORTIONS IN FREQUENCY DOMAIN
Imagine you have a loudspeaker set-up connected to a frequency generator and in front of that, a measurement microphone running into a frequency analyser. If a 1 kHz sine is played through this speaker, the analyser will display the information coming from the microphone, looking something like this:
Figure 1: Acoustic spectrum of a headphone-speaker-signal when excited with a 1kHz sinus tone.
As one can see, the 1 kHz sine wave is clearly visible as a tall spike in the analyser. However, spikes at 2 kHz, 3 kHz, 4 kHz and so forth are present as well.

17
These additional spikes are not a measurement artefact but actually produced by the speaker. It is a visual representation of the speaker’s distortion. All of the produced spikes are related to the input frequency by an integer-factor n. It is common to call the input frequency k1 or fundamental frequency. The multiple frequencies (also called harmonics) are named by their relation to k1: two times the fundamental is k2, n times the fundamental is kn.
Not every speaker distorts in the same way and with the same amount. Furthermore, the distortion level depends on the input frequency and level. It can be concluded, that care has to be taken when comparing different THD measurements properly.
CALCULATION OF THD
Simply put, the THD value is the ratio of distortions (k2, k3, …, kn) to the pure signal (k1). There are different mathematical definitions in the industry, the one which is used at USound is based on the IEEE standard1.
THD is the ratio of the RMS-value of the harmonic frequencies (k2, k3, …, kn) compared to the RMS-value of k1. It can be expressed linear (in per cent) or logarithmic (in dB).
It is also possible to reduce the number of harmonic components. At USound, the THD is comprised of components up to k5.
An example:In the measurement example above, a speaker with quite some distortion was used. Based on the graph, the THD at 1 kHz can be calculated. These values are in dB and need converting into the linear unit, in this case, sound pressure.
# Sound Pressure [DBspl] Sound Pressure [mPa]
k1 93 893,4
k2 64 31,7
k3 65 35,6
k4 50 6,3
k532 2,5
1 IEEE Std 519-2014 - IEEE Recommended Practice and Requirements for Harmonic Control in Electric Power Systems, ISBN: 978-0-7381-9005-1, 2014

18
The result shows that about 5% of the RMS-value of the clean signal (k1) is added in form of harmonic frequencies (k2 – k5).
Since THD is an important parameter, this calculation is implemented in almost all standard acoustic measurement systems. Besides the simple sinus excitation (like in the example above), THD can also be measured with a sine sweep method, this will then give the THD over the whole frequency range in one go; see graph below as an example (different speaker than before).
Figure 2: SPL and THD of a typical micro speaker.
HOW IS THD CREATED
In the previous chapters, the symptoms of distortions and how they can be measured were discussed; now we consider the origin of distortions in general. Later, in chapter 3, a close look into the actual contributors in loudspeakers will be done.
Basically, distortions emerge when (otherwise constant) properties of a system change. These changes can be:
• random (irrelevant because they can’t be handled anyway)• dependent on time (usually irrelevant because the change is too slow)• dependent on the very current state of the system (typical origin for distortions)
The last case is the most important one in any type of acoustical, mechanical or electrical system. Mathematically speaking, if properties of a system change depending on the system-state, it transforms an otherwise easy relationship describable with linear differential equation with constant coeffi cients into a non-linear differential equation. This makes modelling (especially analytical modelling) crazy complicated. Anyway, why and when does this ever happen? It typically occurs if the system is stretched to its maximum. For small signals, most systems are very stable and well behaving.

19
An Example in Mechanics
A spring, close to its resting position, will produce a counterforce linearly depending on the deformation (F=k·Δx). If the deformation is too high (imagine the spring completely stretched out or completely compressed) this relationship will not hold any longer. In engineering, we call this the ‘non-linear’ range (or ‘non-linear’ behavior), because the force will not linearly rise with the deformation (and vice versa). Another term often used is ‘saturation’, which means the reduced effect from the input (in case of the spring example: the force) onto the output (the deformation).
Figure 3: Example of a non-linear relationship between input and output, which will cause distortions.
As soon as one of the system properties (like the stiffness above) changes dependent on the system state (e.g. the deformation), the whole system becomes non-linear.
If a pure sinus is used as input signal, these non-linearities cause additional frequencies to emerge. Basically, the system creates new discrete frequencies (like visible in Figure 1), which were not present in the input. The THD measurement analyses the output signal and tells how the relationship between undistorted and distorted signal is. In case of loudspeakers, which are intended to reproduce the signal (music, speech) accurately, any additional signals are unwanted; the THD should approach 0%.

20
HOW THD IS SHAPED
Following a signal through the various stages from its origin to its fi nal destination, it becomes evident that not only the ‘pure’ (undistorted) signal gets changed and shaped but also the additional distortion signals emerging along the way. A typical simplifi ed signal chain in electro-acoustics may look like the following:
Figure 4: Simplifi ed signal fl ow of a loudspeaker system from electric input to sound output.
This means for example that distortions emerging in the amplifi er section are also subjected to the following shaping by the speaker. For example, an amplifi er produces a constant THD of 1% over the whole frequency range. Let’s suppose the connected loudspeaker (with housing) is absolutely linear (adds no additional distortions) and has a fl at frequency response above 1 kHz; below it goes down by 12 dB/Oct (40 dB/Dec). This results in a total THD that is also fl at above 1 kHz but rises below 1 kHz, because the k1 (original frequency) gets smaller while the distortion components stay at a higher level. This shows that even perfectly linear systems shape the THD over frequency strongly.
Conclusion: The original frequency curve of the THD (at the emerging point) gets changed by the frequency response of the following subsystem. Care must be taken to not just assume that the THD curve is directly subjected to the frequency response of the following system, it is a bit more complicated than that. However, two basic rules can be stated:
In frequency regions of low output, the THD is generally higher, e.g. Figure 2 (the THD rises strongly below 600 Hz).
If peaks in the frequency response occur, the THD often also peaks at half, third, fourth, etc. of this peak-frequency. Peaks in the frequency response originate from resonators in the system.
Especially the second one becomes very relevant in chapter 4, where the sharp peaks in the SPL also cause the THD to peak at half and third of this peak-frequency. This is what is also called subharmonic distortion or simply subharmonics.

21
THD IN MEMS COMPARED TO ELECTRO-DYNAMIC SPEAKERS
In this chapter, the main contributors to THD in miniature speakers are explained. As described above, typically distortions arise if one or more parameters of a system vary depending on the system state. Typical varying parameters in miniature speakers are:
• stiffness of the membrane: Due to geometrical non-linearities, the stiffness depends on the excursion kms = f(Δx)
• mechanical resistance of the membrane/meshes/slits: Depending mainly on the velocity, the resistance changes. Rms = f(v)
• For micro-electro-dynamic speakers and balanced armatures, the additional non-linear influence is:
• Force factor: The effective magnetic field changes as the coil moves out of the magnet gap B = f(Δx)
In contrast, for the MEMS speakers, the additional non-linear influences are:
• Stiffness of the MEMS: Due to geometrical non-linearities, the stiffness depends on the excursion kMEMS = f(Δx)
• Piezo coefficient of the piezo material: Due to a polarisation effect in the material, its transmission coefficient depends on the input voltage d31 = f(V)
As can be seen, there are quite some effects that work against distortion-free sound reproduction. Depending on the SPL, the speaker size, the application, etc. the significance of the influence of the different distortion contributors changes.
In case of the electro-dynamic micro speakers the biggest contributors are the change in membrane stiffness and the change in force factor (effective magnetic field times wire length). For these speakers, the membrane must fulfil 3 tasks: Firstly, act as sealed separation between front and back side of the speaker. Secondly, prohibit (or at least reduce) any additional modes of the moving parts (coil, plate and membrane itself). Thirdly, be very compliant and linear. Clearly, the second and third are diametrically opposed, requiring compromise and sophisticated development.
In case of the force factor, the size of the magnets and the coil height influence directly the linear range of movement. Miniature speakers, being extremely small, push this effect also to its extreme and introduce high distortions along with high excursions.
22
In case of the balanced armature speakers, the stiffness of the system is dictated by the stiffness of the anker, contributing also mainly to the non-linearities. Due to the lower excursions, the membrane stiffness is not as relevant in comparison. As for the electro-dynamic speaker, also in this case, the change in magnetic field poses a challenge.
For USound MEMS speakers the requirements on the membrane are generally lower due to the additional fixation function of the MEMS structure. This reduces the need for the membrane to hold everything in place and reduce unwanted movement. With this relaxation, it is easier to design a compliant linear membrane. The two remaining main contributors to the distortions are the stiffness change in the MEMS and the piezo coefficient. These effects work inverse to each other, reducing to some extent the overall non-linearity of the speaker.
THD ASSESSMENT ACHELOUS MEMS SPEAKERS
USound’s Achelous MEMS speaker measured in 711 coupler shows one main THD peak at 10,5 kHz and two minor peaks at 6 and 7 kHz. These peaks are caused by subharmonics of modes happening at higher frequencies out of the hearable range.How does one evaluate and assess their influence on the listening experience and the acoustic design? In the following paragraph, we explain the root cause and its effects on earphone application.
The peaks at 7 and 10 kHz are subharmonic distortion peaks caused by a vibratory mode of the actuator plate at 21 kHz. In case of 7 kHz, the distortion mainly consists of k3, while for 10 kHz its k2. Vibratory modes are a fundamental characteristics of plates, the mode will resonate and amplify the signals corresponding to its frequency. The frequency can be adjusted by design, we have deliberately designed it to be outside of the hearable range at 21 kHz in order to have minimal impact on the acoustics of the final application. Still, the inherent non-linear dynamics of the mechanical movement of the actuator will generate a small excitation of the mode through its subharmonics at 1/2 and 1/3 of the main frequency, this then generates the THD subharmonic peaks in return.
23
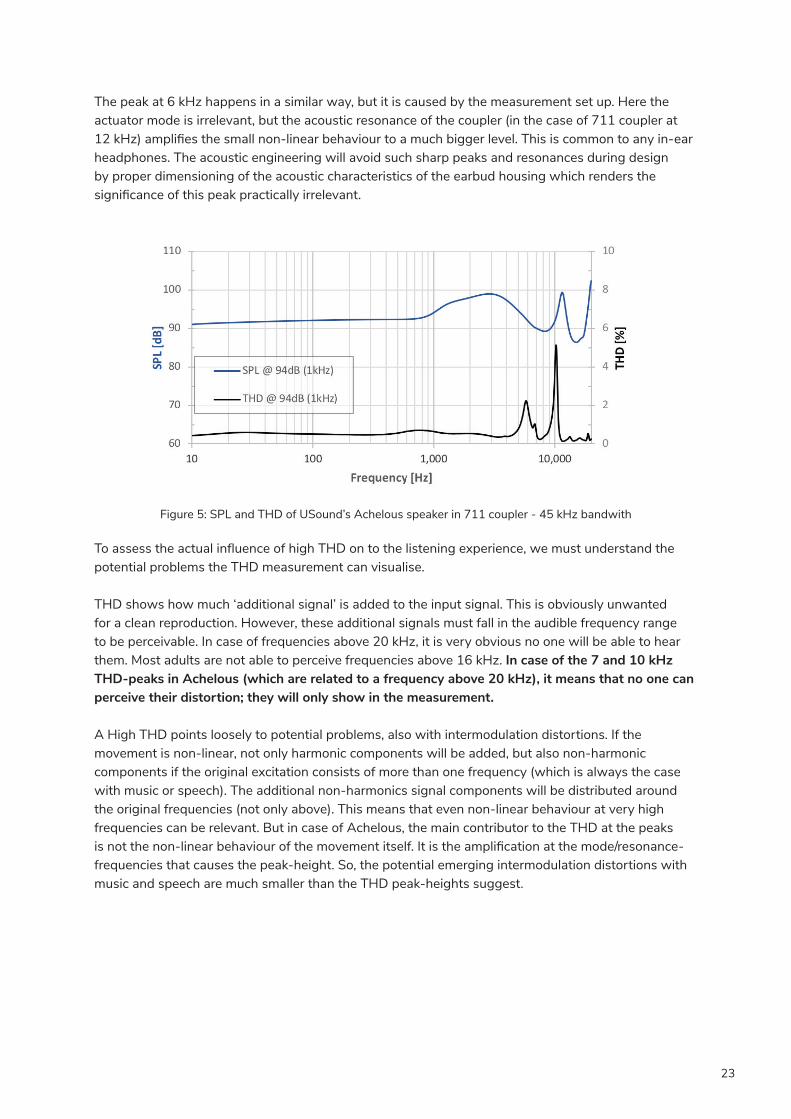
The peak at 6 kHz happens in a similar way, but it is caused by the measurement set up. Here the actuator mode is irrelevant, but the acoustic resonance of the coupler (in the case of 711 coupler at 12 kHz) amplifies the small non-linear behaviour to a much bigger level. This is common to any in-ear headphones. The acoustic engineering will avoid such sharp peaks and resonances during design by proper dimensioning of the acoustic characteristics of the earbud housing which renders the significance of this peak practically irrelevant.
Figure 5: SPL and THD of USound’s Achelous speaker in 711 coupler - 45 kHz bandwith
To assess the actual influence of high THD on to the listening experience, we must understand the potential problems the THD measurement can visualise.
THD shows how much ‘additional signal’ is added to the input signal. This is obviously unwanted for a clean reproduction. However, these additional signals must fall in the audible frequency range to be perceivable. In case of frequencies above 20 kHz, it is very obvious no one will be able to hear them. Most adults are not able to perceive frequencies above 16 kHz. In case of the 7 and 10 kHz THD-peaks in Achelous (which are related to a frequency above 20 kHz), it means that no one can perceive their distortion; they will only show in the measurement.
A High THD points loosely to potential problems, also with intermodulation distortions. If the movement is non-linear, not only harmonic components will be added, but also non-harmonic components if the original excitation consists of more than one frequency (which is always the case with music or speech). The additional non-harmonics signal components will be distributed around the original frequencies (not only above). This means that even non-linear behaviour at very high frequencies can be relevant. But in case of Achelous, the main contributor to the THD at the peaks is not the non-linear behaviour of the movement itself. It is the amplification at the mode/resonance-frequencies that causes the peak-height. So, the potential emerging intermodulation distortions with music and speech are much smaller than the THD peak-heights suggest.

24
To better visualise the influence of the frequency components above 20 kHz (which are not audible) onto the THD results, the following graph is shown. A steep low-pass (following AES172) at 22 kHz is set to eliminate any inaudible components and reduce the THD graph to only the maximum audible influences. This already eliminates half of the THD peak at 10 kHz and the complete 6 kHz peak. With a lower low-pass as for example 16 kHz (which corresponds to the listening range of most adults), the THD peak at 10 kHz is completely gone.
Figure 6: THD of Achelous in the coupler at 94dB (1 kHz) with different bandwidths of the measurement system. 45 kHz is the maximum bandwidth based on a sampling rate of 96 kHz. 22 kHz bandwidth is implemented via a
AES17 filter. The 16 kHz bandwidth is done with a Butterworth filter (slope of 48dB/Oct).
2 AES17-2015: AES standard method for digital audio engineering - Measurement of digital audio equipment; 2015

USound is a fabless audio company offering high-quality solutions based on MEMS technology, inspiring music enthusiasts and acoustic professionals with crisp, natural sound for a fantastic hearing experience.
Aiming to revolutionise the personal audio industry, USound will equip earbuds, 3D headphones for virtual reality and audio systems for wearables.
For more information about our audio solutions contact visit www.usound.com