Embed Size (px)
Citation preview

Shelbourne et al. — Density and checking of Eucalyptus nitens 357
New Zealand Journal of Forestry Science 32(3): 357–385 (2002)
WOOD DENSITY AND INTERNAL CHECKING OFYOUNG EUCALYPTUS NITENS IN NEW ZEALAND
AS AFFECTED BY SITE AND HEIGHT UP THE TREE
C. J. A. SHELBOURNE, I. D. NICHOLAS, R. B. McKINLEY, C. B. LOW,R. M. McCONNOCHIE, and M. J. F. LAUSBERG
New Zealand Forest Research Institute,Private Bag 3020, Rotorua, New Zealand
(Received for publication 29 May 2002; revision 14 October 2002)
ABSTRACTWhole-tree basic density and internal checking were assessed in Eucalyptus nitens
(Deane et Maiden) Maiden at six New Zealand sites, four in the North Island and two inthe South Island, by sampling 15 trees/site, each involving one seedlot of Victorianprovenance at a stocking of 1111 stems/ha. Sites ranged in altitude from 40 to 540 m andin latitude from 35°52´S (Dargaville) to 45°55´S (Drumfern). Site mean whole-treedensity ranged from 428 kg/m3 at Raweka (Whakatane) to 476 kg/m3 at Mangakahia(Dargaville). Density at Kinleith, Wainui (both central North Island), and Millers Flat andDrumfern (southern South Island) varied little, from 445 kg/m3 to 459 kg/m3. From theseand previous results, there was some indication that very high rainfall and high levels offoliar nitrogen, phosphorus, and magnesium led to extremely low wood density. Whole-tree density increases with age and, after an initial decrease in the lower bole, increaseswith height up the stem by 50 kg/m3 and more as age increases, resulting in lower densityin the butt log than in upper logs.
Internal checking, assessed in one breast-height disc per tree, was prevalent at all sites,especially in outer heartwood in both slowly kiln-dried and air-dried samples. Morechecks were found in air-dried discs than in kiln-dried. Many more checks were foundat the North Island sites Mangakahia, Raweka, and Kinleith than at the high-altitudecentral plateau site Wainui or the South Island sites. Higher numbers of checked rings andtotal checks were associated with higher mean annual temperatures, short green crowns,and poor crown health. Far fewer checks were found at cooler sites where trees had muchbetter crown health and longer green crowns.
Checking data were reanalysed from an earlier study of twenty 15-year-old trees fromKaingaroa Forest (altitude 230 m) from four kiln-dried discs per tree at heights of 0, 1.4,6.4, and 11.4 m, and from a 1-m air-dried diametral board sawn from the base of eachtree. Numbers of checks varied enormously among trees and fell to zero above height11.4 m. Numbers of checks in the board cross-section correlated moderately with thosein the breast-height disc. It is considered that excessive checking in E. nitens mayseriously reduce its potential for utilisation for appearance-grade lumber, particularly onwarmer New Zealand sites where crown health is poor.
Keywords: whole-tree basic density; wood drying; internal checking; site; temperature;rainfall; nutrition; within-tree variation; between-tree variation; Eucalyptusnitens.

358 New Zealand Journal of Forestry Science 32(3)
INTRODUCTIONEucalyptus nitens has become the most widely planted eucalypt in New Zealand because
of its wide adaptability, including frost resistance, its rapid growth and good form, and itssuitability for kraft pulping (Miller et al. 1992). However, there is increasing evidence thatplantations of E. nitens on warm, low-altitude sites with moderate to high rainfall in the NorthIsland are affected by fungal leaf diseases, which result in poor health, reduced growth, andeven death (Low & Shelbourne 1999; Shelbourne et al. 2000; Hood et al. 2002).
The pulp yield of E. nitens is high — 56% for 15-year-old trees from Kaingaroa Forest,55.6% for 11-year-old, and 54.7% for 8-year-old trees from Northland (Kibblewhite et al.1998, 2000) — but, as we will show, its wood density is medium to low, especially for treesunder 12 years old. Wood density is recognised as the second most important factor (aftergrowth rate ) in the profitability of kraft pulp production (Borralho et al. 1993; Greaves etal. 1997), and strongly determines kraft handsheet quality, especially handsheet bulk, animportant property for which E. nitens pulps are often deficient (Kibblewhite et al. 1998,2000). Wood density also largely determines strength and stiffness of structural timber. Itshows a high heritability (Gea et al. 1997) but little is known about the effects of site on itsexpression in New Zealand, and defining these effects was an important objective of thisstudy.
Eucalyptus nitens is grown widely for pulp in Tasmania, in South Africa, and in Chile aswell as in New Zealand, but there is increasing interest overseas in growing some stands forsolid-wood products, including appearance-grade lumber (Wardlaw & Neilsen 1999).Internal checking is a drying defect which has proved to be widespread with E. nitens onsome sites in New Zealand (Haslett 1988; Haslett & Young 1992; Lausberg et al. 1995;McKenzie, Turner, & Shelbourne in press; McKenzie, Shelbourne, Kimberley, McKinley,& Britton in press). Internal checking, expressed in disc samples as well as in sawn timber,is strongly influenced by drying methods, which have not yet been standardised. Internalchecking shows major species differences; for instance, closely-related E. maidenii Labill.has zero checking compared with E. nitens on the same site (McKinley et al. in press).Increasing the knowledge of its incidence in E. nitens on different New Zealand sites wasanother main objective of this study. As background to the experimental study, published andunpublished reports on density and checking were reviewed and a fresh extended analysisof data from an earlier study is included here.
PREVIOUS STUDIESBasic Density
Whole-tree basic density increases rapidly with age up to about age 15 years, thereafterincreasing more slowly. McKinley et al. (2000) summarised the limited New Zealand whole-tree data available in the New Zealand Forest Research Institute database, across sites, andshowed an average increase in whole-tree basic density with age from 453 kg/m3 (age 9), to477 (age 15), to 495 (age 20), to 519 kg/m3 at age 30 years. The data were very limited belowage 9 and above age 17 years.
Milne (1991) measured whole-tree basic density on 14–25 trees per site at four SouthIsland trials of Victorian provenances (Table 1). These were at Berryman’s Nursery, GoldenDowns Forest (Nelson), Callaghan’s Ridge (near Ahaura, Westland), and Longwoods Forest

Shelbourne et al. — Density and checking of Eucalyptus nitens 359
(west of Invercargill, Southland), aged 11 and 12 years, and at Glentunnel in Canterbury,aged 30 years. Site mean densities were respectively 483, 419, and 438 kg/m3 (ages 11–12)and 565 kg/m3 (age 30).
In studies of biomass for energy (F.Jamieson unpubl. data; Nicholas et al. 2000; Nicholas,Jansen & McNeil in prep.; Nicholas, Jamieson, McConchie & Hawke in prep.), 15 trees perseedlot of E. nitens were sampled at ages 5–9 years by 5-mm increment cores taken at breastheight at four sites in the North Island (Kaikohe, Rotorua, Clive, and Palmerston North), andat Christchurch in the South Island. Latitudes varied from 35°25' at Kaikohe to 43°39' atChristchurch and altitudes were mainly less than 50 m, except at Rotorua (300 m) and nearKaikohe (250 m). Seedlots of southern New South Wales and central Victorian provenanceswere sampled. Mean increment core density ranged from 399 to 419 kg/m3 and differencesbetween seedlots and sites were small. Predicted whole-tree densities of this material rangedfrom 422 kg/m3 to 442 kg/m3.
G.Jansen (unpubl. data) did biomass studies on 10-year-old trees of E. nitens, E. globulusLabill., and E. maidenii at Clive, near Napier (latitude 39°36', altitude 5 m) and at Kaikohe,at age 6 years, on five trees/site. Mean whole-tree basic densities were respectively 449, 489,and 582 kg/m3 at Clive and 431, 479, and 555 kg/m3 at Kaikohe.
Lausberg et al. (1995) preselected 20 trees for a wide range of increment-core pith-to-barkbasic density from 100 trees in a 15-year-old provenance/progeny trial in Kaingaroa Forest(latitude 38°26', altitude 230 m). These had a mean increment-core basic density of435 kg/m3 and mean whole-tree density, based on discs, of 467 kg/m3 (this was the samematerial whose pulping was reported by Kibblewhite et al. 1998).
J.D.Richardson (unpubl. data) and J.B.Ford-Robertson, G.D.Young, & I.D.Nicholas(unpubl. data) reported mean whole-tree basic densities for 26 trees of 15-year-old E. nitens(from central Victoria) and eight each of 15-year-old E. regnans F.Mueller and E. fastigataDeane et Maiden. All were grown in Kinleith Forest, near Tokoroa (altitude ca.350 m) in thecentral North Island. The mean whole-tree densities of 15-year-old E. nitens of centralVictorian provenance and of E. fastigata were similar (474 and 479 kg/m3) and that ofE. regnans was appreciably lower (426 kg/m3). Density increased with log height in E. nitensfrom 456 kg/m3 in the 6-m butt log to 533 kg/m3 for the fourth log (18–24 m height).
TABLE 1–Whole-tree basic density of E. nitens at South Island sites (Milne 1991)––––––––––––––––––––––––––––––––––––––––––––––––––––––––––––––––––––––––––––––––
Site Age Latitude Altitude Mean Mean Provenances No. Whole-(yr) (°S) (m) annual annual trees tree basic
rainfall temp. density(mm) (°C) (kg/m3)
––––––––––––––––––––––––––––––––––––––––––––––––––––––––––––––––––––––––––––––––Berrymans’s 11 41°27´ 210 1130 11.5 Toorongo/ 25 483 (Nelson) Rubicon
Callaghan’s ridge 12 42°24´ 330 1900 11.5 ?? 19 419 (Westland)
Longwoods 11 46°14´ 95 1260 10.0 Macalister/ 20 438 (Southland) Toorongo
Glentunnel 30 43°29´ 350 880 10.3 Victoria 14 565 (Canterbury)––––––––––––––––––––––––––––––––––––––––––––––––––––––––––––––––––––––––––––––––

360 New Zealand Journal of Forestry Science 32(3)
McKinley et al. (2002) reported whole-tree basic densities in species/provenance trialsof E. nitens, E. globulus, and E. maidenii grown at two sites in Northland, aged 8 and 11 years.At age 8 years these were respectively 440, 476, and 567 kg/m3 and at age 11 years 451, 540,and 574 kg/m3.
Internal Checking
Information about internal checking on drying in wood from young plantation stands ofE. nitens is limited, especially individual-tree studies examining checking at differentheights on the stem. McKimm et al. (1988) sawed logs from seven 20-year-old plantationtrees, grown at Mt Beenak, near Powelltown in central Victoria. They sawed four logs, 3 mlong, from the butt of each tree, alternately into structural and appearance grades and driedthe products using four different drying schedules. Internal and face checking were found inall products; face checking was less in quarter-sawn boards than back-sawn but the reversewas true for internal checking. Air-drying followed by high-temperature kiln-drying resultedin the least internal checking. Face and internal checking were moderately correlated withintrees, and there were large differences between trees in amount of checking. Mean whole-tree density of this 20-year-old stand was 488 kg/m3.
One of the most extensive individual-tree studies of internal checking in eucalypts wasreported by King et al. (1993); in that study 323 8-year-old trees from a provenance trial ofE. delegatensis R.T.Baker in Southland, New Zealand, were sampled by breast-height discs.The researchers recorded numbers of checks in each ring, with a subjective rating of severityof each check. They found twice as many checks in mainland provenances as in Tasmanianprovenances. Their methods formed the basis of subsequent studies of checking in E. nitensin New Zealand.
Yang & Waugh (1996) reported high levels of internal checking of timber from 15-, 25-,and 29-year-old E. nitens after air- and kiln-drying. Haslett & Young (1992) reported highlevels of checking in sawn boards from a 30-year-old plantation of E. nitens in Canterbury,in the South Island.
Purnell (1988) assessed a variety of wood properties in an 11-year-old trial of New SouthWales and Victorian provenances of E. nitens at Jessievale State Forest (latitude 26°14'S,longitude 30°31'E, altitude 1733 m) in the eastern Transvaal highveld of South Africa.Assessment was confined to properties measured on logs taken at 2.4-m intervals and onadjacent discs. Log-end splitting was assessed as “triangular” and “elliptical” splits on all logends. Collapse was high in discs from the bases of the trees, and reduced with height to 12 m.Trees varied widely in the amount of collapse, but provenance differences were notsignificant. Triangular splitting was not correlated with elliptical splitting, both of whichvaried a lot between trees and were often severe. Elliptical splits (which appear to indicatechecking) were severe at the base, decreasing to zero by height 9.6 m, whereas triangularsplits (apparently indicating growth stresses) also had higher values in the lower parts of thetree, decreasing somewhat by height 12 m.
J.B.Ford-Robertson, G.D.Young, and I.D.Nicholas (unpubl.data) and J.D.Richardson(unpubl.data) reported the subjective scoring of internal checking on discs from 26 trees of15-year-old E. nitens from central Victoria and 8 trees each of 15-year-old E. regnans and

Shelbourne et al. — Density and checking of Eucalyptus nitens 361
E. fastigata. Discs were taken at the base and at 6-m intervals up the stem, and oven driedat 103°C (a method later shown by McKenzie, Shelbourne, Kimberley, McKinley, Britton(in press) to give only weak correlations with board checking). Checking was assessed ona scale of 0 = no checks, 1 and 2 = minor checking, to 3, 4, and 5 indicating increasing severityof and numbers of checks. Checking score decreased rapidly up the stem, to near-zero levelsin the 18-m-height discs of E. nitens, and slightly higher scores in E. regnans and E. fastigata.With the small numbers of 15-year-old E. fastigata and E. regnans sampled, there were noapparent species differences, with species mean checking scores at the base ranging from3.67 to 2.50, and at 6 m from 2.25 to 1.38.
Lausberg et al. (1995) assessed internal checking of the same 20 15-year-old trees ofE. nitens from Kaingaroa Forest in the central North Island, as were assessed for density.Internal checking was recorded as number of checks per ring from discs, taken at heightintervals up to 20 m. Checking was widespread but there was a large variation between treesin number of checks. A basal 1-m billet was also removed from each tree, a diametral boardwas sawn from each billet, and internal checking was assessed. The comprehensive checkingdata will be reanalysed later in this paper.
McKenzie, Turner, & Shelbourne (in press) and McKenzie, Shelbourne, Kimberley,McKinley, & Britton (in press.) carried out a comprehensive utilisation study on 15 trees of15-year-old, very fast-grown E. nitens from Golden Downs Forest near Nelson, the same siteas was sampled by Milne (1991). Each tree was sampled by discs at about 5-m intervals anda butt log was quarter-sawn into 40-mm boards which were air-dried to 17% m.c. and laterkiln-dried and steam-reconditioned. A 1-m billet was removed from height 6–7 m andquarter-sawn into 25-mm boards. Various wood, sawn-timber, and veneer end-productcharacteristics were studied tree by tree and, in particular, checking and collapse weremeasured in butt-log boards, in 6-m-height discs (both oven-dried and dehumidifier-dried),and in 1-m boards from height 5–6 m (air- and dehumidifier-dried).
Internal checking was recorded as number of checks per millimetre of ring circumferencein the discs, as number of checks per millimetre of ring radius in the 1-m boards, and asnumber of checks at top and bottom ends of the butt-log boards. Checking was prevalent inall but two trees in the butt-log boards, was much worse at the bottom than at the top ends,and boards from all but two trees showed substantial collapse. All trees showed a lot of facechecking after steam reconditioning. In the 1-m boards, the amount of checking varied a lotbetween trees and there was less checking in the air-dried than in the dehumidifier-driedboards. The number of checks in 6-m-height discs varied enormously among trees and therewere more checks in oven-dried than in dehumidifier-dried discs. There were high correlationsof individual tree values of amounts of checking in dehumidifier-dried discs vs air-dried 1-mboards and butt-log boards, all over 0.90, but poor correlation with checking in oven-drieddiscs. Correlations of amounts of checking in butt-log boards vs 1-m boards were also all over0.90. Collapse in butt-log boards correlated well with their checking, and with checking in1-m boards and dehumidifier-dried discs.
McKinley et al. (2002) assessed checking in air-dried discs from height 6 m of ten 11-year-old trees of E. nitens, E. globulus, and E. maidenii. Total number of checks in E. nitensvaried widely between trees, from 3 to 104, but was mainly 15 or more. One tree only ofE. globulus showed checking and none of E. maidenii.

362 New Zealand Journal of Forestry Science 32(3)
In the checking studies reviewed above, trees came from Northland (lat. 36°S), centralNorth Island medium-altitude sites (lat. 38°S), and a 230-m-altitude site at Golden Downs,Nelson (lat. 41°S). At all of these sites E. nitens has shown plenty of internal checking. Inthe study reported here, results on these sites were compared with those on some colder,higher-altitude, and more southern (lat. 45°S) sites.
MATERIALS AND METHODS
Field Trials and Their Sampling
Between 1990 and 1992 a series of silvicultural regime trials of E. nitens were establishedat six sites throughout New Zealand (Table 2). These included one near Dargaville inNorthland, three trials in the central North Island, and two in the southern South Island, allplanted with a commercial seedlot of central Victorian origin. Plots established at 1111stems/ha and unthinned, as used for commercial pulp production, were sampled at each site.At all sites except Kinleith, there were three replications of this treatment with 25-treemeasurement plots. At Kinleith, there were two replicates, at separate sites, with a 100-mdifference in altitude. All trials were planted with stock of seedlot number 89/20 which wascollected from thinning a 1979-planted progeny trial at Rotoaira Forest of 80 open-pollinatednative population families, almost entirely of central Victorian provenances.
TABLE 2–Site and trial details––––––––––––––––––––––––––––––––––––––––––––––––––––––––––––––––––––––––––––––––
Location Altitude Latitude Longitude Planted(m) (°S) (°E) (year)
––––––––––––––––––––––––––––––––––––––––––––––––––––––––––––––––––––––––––––––––Mangakahia, Northland 40 35º52´ 173º52´ 1990Raweka, Bay of Plenty 250 38º09´ 176º55´ 1990Kinleith, Bay of Plenty 300& 400 38º21´ 175º51´ 1990Wainui, Taupo 540 38º54´ 176º11´ 1990Millers Flat, Otago 440 45º41´ 169º29´ 1992Drumfern, Southland 140 45º55´ 168º15´ 1991––––––––––––––––––––––––––––––––––––––––––––––––––––––––––––––––––––––––––––––––
The sites were very discontinuous in their latitudinal distribution, with four clustered inthe central North Island and none in Nelson, Canterbury, or Westland. Altitudes were quitevaried in the North Island, from 40 m near Dargaville to 540 m at Wainui, and in the SouthIsland from 440 to 140 m.
Mean annual temperature and mean annual rainfall, derived from BIOCLIM (Nix 1986;Mitchell 1991), varied widely (Table 3) from 14.7°C at Mangakahia to 8.6°C at Millers Flat,and 2060 mm at Raweka, 1400–1650 mm at other North Island sites, to 740 mm at MillersFlat. Mean daily maximum and minimum temperatures followed a similar trend to meanannual temperature.
With only six sites sampled in this study, there is no possibility of developing predictivemodels for wood density and internal checking in relation to climatic variables. However,the wide differences between sites in some of the variables may allow some hypotheses tobe proposed about these relationships that could be tested further in future, by extending thesites sampled.

Shelbourne et al. — Density and checking of Eucalyptus nitens 363
Millers Flat and Drumfern were planted later than the North Island trials (Table 4) and thismust be noted in evaluating the density and checking data. Survival was only 77% and 71%at Mangakahia and Raweka respectively, when these trials were assessed at age 8 or 9 years,but was 88% at Kinleith and over 93% at Wainui and the two South Island sites. Annualheight growth was substantially less at the high-altitude Wainui site and the two South Islandsites (ca. 2.1 m) than at the other North Island sites (2.4–2.8 m). Mean diameter at breastheight and mean annual volume increment, however, did not show these trends, and atDrumfern values were as high as at Mangakahia.
In 2001, at age 9–11 years (Table 4), 30 healthy trees in total at each location wererandomly selected from the plot surround of three plots where available (to avoid removingtrees from the measurement plots) from across the diameter range of the crop trees. For eachtree, diameter at breast height over bark (dbhob) was recorded and two pith-to-bark 5-mmincrement cores were extracted for preliminary screening for basic density. This was doneusing the maximum moisture content method (Smith 1954).
TABLE 3–Climatic data of study sites (from BIOCLIM — Mitchell 1991)––––––––––––––––––––––––––––––––––––––––––––––––––––––––––––––––––––––––––––––––Location Altitude Mean Mean Mean Mean
(m) daily daily annual annualminimum maximum temp. rainfall
temp. temp. (°C) (mm)(°C) (°C)
––––––––––––––––––––––––––––––––––––––––––––––––––––––––––––––––––––––––––––––––Mangakahia 40 10.2 19.2 14.7 1370Raweka 250 7.0 18.1 12.6 2060Kinleith 400 7.1 16.8 11.9 1650Kinleith 300 7.2 17.5 12.3 1490Wainui 540 5.6 15.8 10.8 1480Millers Flat 440 3.7 13.7 8.6 740Drumfern 140 4.7 15.0 9.8 900––––––––––––––––––––––––––––––––––––––––––––––––––––––––––––––––––––––––––––––––
TABLE 4–Tree crop particulars at each site––––––––––––––––––––––––––––––––––––––––––––––––––––––––––––––––––––––––––––––––
Mangakahia Raweka Kinleith Wainui Millers Flat Drumfern––––––––––––––––––––––––––––––––––––––––––––––––––––––––––––––––––––––––––––––––Established (year) 1990 1990 1990 1990 1992 1991Age measured (years) 9 9 9 9 8 8Stocking (stems/ha) 859 792 988 1042 1037 1050MTD* (mm) 282.0 270.3 238.0 233.3 215.8 240.3MTH* (m) 21.9 24.8 21.9 19.1 16.7 17.2Mean dbh (mm) 210.3 188.0 169.0 163.7 172.5 191.0Basal area (m2/ha) 30.2 21.8 23.2 24.1 24.5 30.1Volume (m3/ha) 223.3 170.7 170.1 159.0 147.2 185.1Mean annual height growth (m) 2.43 2.76 2.43 2.12 2.09 2.15Mean annual increment (m3/ha) 24.8 19.0 18.9 17.7 18.4 23.1––––––––––––––––––––––––––––––––––––––––––––––––––––––––––––––––––––––––––––––––* MTD (mean top diameter) and MTH (mean top height) = the mean diameter and height, respectively, of the 100
largest-diameter trees/ha.

364 New Zealand Journal of Forestry Science 32(3)
Tree, Disc, and Wood Property Measurements
From the initial increment-core density survey of 30 trees in each trial, 15 trees wereselected of the same mean value to cover the density range, five trees in each of three plotsat each site (two plots at Kinleith). After tree felling, diameter over and under bark, wasmeasured at 0.3, 0.7, 1.4, 5, 10, and 15 m. Total height of each tree was also recorded. Foliagesamples were collected to check species identification and for health assessment. A sampleof leaves from all 15 trees/site was bulked for foliar nutrient analysis.
Cross-sectional discs were cut at stump height, 1.4 m, 5 m, and at successive 5-m intervals,down to a small-end diameter of 80 mm, for whole-disc analysis of heartwood percentage,bark thickness, moisture content, and green and basic density. Decay (“rot”) was recordedas a percentage of disc area. Estimated mean values for each log, and volume-weightedwhole-tree estimates of these properties were derived from the disc measurements for eachtree.
An extra disc, 60 mm thick, was cut from each tree at height 1.4 m to provide samples forassessment of internal checking after air- or kiln-drying. Methods used here have evolvedfrom those of King et al. (1993) and Lausberg et al. (1995). To prevent excessive moistureloss during the sampling period, discs were enclosed in plastic bags and kept refrigerateduntil all trial locations had been sampled. Discs were then cut diametrically, both halves assimilar as possible, to provide one half-disc sample which was slowly kiln-dried for 10 daysusing a low-temperature schedule (40°C and 60% R.H.), and a second half-disc which wasair-dried for approximately 6 months.
After drying, the half-discs were cross-cut to expose an internal face and sanded to givea clean, smooth surface to assess for internal checking. The total number of rings and thosecontaining heartwood were recorded. The number of checks was recorded for each ring andrings were classified as heartwood, transition wood (one complete ring either side of theheartwood boundary), or sapwood.
Statistical Analysis
The data were treated as a fully randomised design and the equation for this model is :
Yijk = µ + Si + Pj : Si + Eij
Where: Yijk = the observation on the kth tree in the jth plot in the ith site
µ = the overall mean
Si = the effect of the ith sitePj : Si = the effect of the jth random plot within the ith site
Eij = the residual random error associated with the kth tree within the jth plot inthe ith site.
Analysis of variance (ANOVA) was carried out using PROC GLM of the SAS™ softwarepackage (SAS Institute Inc. 1989) with plots nested within sites. Tukey’s multiple range testwas used conservatively to test for pairwise differences between site means. PROC CORR(SAS Institute Inc. 1990) was used to obtain correlations between the traits involved in thisstudy.

Shelbourne et al. — Density and checking of Eucalyptus nitens 365
RESULTS AND DISCUSSION
Growth, Green Crown Length, and Initial Density ScreeningDiameter at breast height of 30 randomly selected trees per site ranged from 241 mm at
Raweka to 187 mm at Millers Flat, partly because trees at the latter site were 2 years youngerthan those at the North Island sites (Table 5). Density of pith-to-bark cores ranged from407 kg/m3 at Raweka to 444 kg/m3 at Wainui. Within-site variation in density was high, withstandard deviations of 24–31 kg/m3. Individual-tree values were based on two pith-to-barkcores per tree. About two-thirds of the trees at each site had values for each core within10 kg/m3 of each other. However, for the remaining one-third, values could differ widely,up to 50 kg/m3, possibly reflecting tension wood development.
TABLE 5–Increment core statistics, by sites––––––––––––––––––––––––––––––––––––––––––––––––––––––––––––––––––––––––––––––––
Site Number Age Mean dbh Basic density (kg/m3)of trees (years) (mm) -----------------------------sampled Mean Standard
deviation––––––––––––––––––––––––––––––––––––––––––––––––––––––––––––––––––––––––––––––––Mangakahia 30 10 223ab* 437ab 24Raweka 31 10 241a 407c 31Kinleith 31 10 202bc 422bc 26Wainui 30 10 209bc 444a 29Millers Flat 32 8 187c 419bc 26Drumfern 29 9 207bc 429ab 27––––––––––––––––––––––––––––––––––––––––––––––––––––––––––––––––––––––––––––––––*Tukey letters: differences significant at p <0.05
A sample of 15 or 16 trees at each site was selected for felling, based on increment coredensity, to cover the range and to be of the same mean as the 30-tree sample. Mean tree heightof this sample and the derived length of green crown (Table 6) showed that trees were tallerat Raweka and shorter at the two South Island sites, a result of being 1 or 2 years youngerand slower in height growth. Green crowns were much shorter at the lower-altitude centralNorth Island and Northland sites than at the high-altitude Wainui site and the two SouthIsland sites. The highest value at Millers Flat (440 m altitude in central Otago, with the lowest
TABLE 6–Site means of felled sample trees for height, volume, and green crown height and length––––––––––––––––––––––––––––––––––––––––––––––––––––––––––––––––––––––––––––––––
Site Number Height (m) Volume Green Greenof trees ------------------------------- (m3) crown crown
Total Merchantable height lengthto 50 mm s.e.d. (m) (m)
––––––––––––––––––––––––––––––––––––––––––––––––––––––––––––––––––––––––––––––––Mangakahia 15 21.3b* 14.9ab 0.363ab 17.3de 4.1cRaweka 16 24.7 17.0a 0.454a 19.6e 5.1cKinleith 15 20.5bc 13.3bc 0.297ab 16.9de 3.6cWainui 15 21.7b 13.4bc 0.312ab 14.4c 7.3bMillers Flat 16 17.6d 10.1d 0.205b 6.7a 10.8aDrumfern 15 18.8cd 11.4cd 0.258b 11.0b 7.8b––––––––––––––––––––––––––––––––––––––––––––––––––––––––––––––––––––––––––––––––* Tukey letters: differences significant at p <0.05

366 New Zealand Journal of Forestry Science 32(3)
temperatures of all sites) was for 8-year-old trees, vs 9-year-olds at Drumfern and 10-year-olds at the other sites. Unfortunately, no health scoring was undertaken but, anecdotally,crown health was described as very poor at Mangakahia and Raweka, a little better atKinleith, excellent at Wainui, and equally good at Millers Flat and Drumfern. Crown healthis mainly affected by leaf fungi Mycosphaerella spp. and Septoria (now calledPhaeophleospora eucalypti (Hood et al. 2002).
Wood PropertiesWood properties, bark thickness, heartwood percentage, moisture content percentage,
green density, and basic wood density varied significantly (p<0.001) among the sitessampled in this study (Table 7), as shown by the F ratios for sites. Only for heartwood wasthe plot-within-site effect significant. Heart rot was present in only very small amounts,generally in basal and breast-height (1.4-m) discs, and then only appreciably at Millers Flat,and it showed a strong plot-within-site variance indicating localised occurrence in the stand.
TABLE 7–Site means for volume-weighted whole-tree wood properties––––––––––––––––––––––––––––––––––––––––––––––––––––––––––––––––––––––––––––––––
Site No. of Bark Heart- Moisture Green Basic Rottrees thickness wood content density density (% disc
(mm) (%) (%) (kg/m3) (kg/m3) area)––––––––––––––––––––––––––––––––––––––––––––––––––––––––––––––––––––––––––––––––Mangakahia 15 7.8a 53a 128bc 1082a 476a 0.36aRaweka 16 6.3b 52a 152a 1069a 428b 0.38aKinleith 15 7.6ab 50ab 139ab 1055ab 445ab 1.10aWainui 15 7.6ab 41c 118c 996c 458ab 0.02aMillers Flat 16 6.8ab 32d 128bc 1034b 459ab 2.59bDrumfern 15 7.1ab 44bc 123bc 992c 448ab 0.25aANOVA F for Sites (5, 74) 3.1* 30.8*** 8.4*** 27.9*** 3.0* 7.7***––––––––––––––––––––––––––––––––––––––––––––––––––––––––––––––––––––––––––––––––Tukey letters significant at p <0.05* significant at p ≤0.05** significant at p ≤0.01*** significant at p ≤0.001
Whole-tree basic density means at each site varied from 476 kg/m3 at Mangakahia to428 kg/m3 at Raweka. Means at the other four sites varied only little, from 445 to 459 kg/m3.There was no evident effect of temperature on these results. Raweka and Mangakahia hadthe highest mean annual temperatures of the six sites, both lying within warm areas of theBay of Plenty and Northland. However, Raweka had by far the highest rainfall of 2060 mm.The two South Island sites shared the prevailing lowest temperatures but trees had similardensities to those on much warmer and wetter sites. The younger age of trees at Drumfern(9 years) and Miller’s Flat (8 years) appears to have had little effect on density.
Nutrient levels in the foliage, analysed by bulking individual-tree samples for each site(Appendix Table 1), showed that Raweka (with its lowest basic density) was outstanding,with the highest levels of foliar nitrogen, phosphorus, and magnesium of all sites. Its levelsof aluminium, copper, and manganese were also by far the lowest. Beets et al. (2001)concluded that foliar nitrogen status was the main variable associated with wood density in

Shelbourne et al. — Density and checking of Eucalyptus nitens 367
Pinus radiata D.Don, high levels being associated with low density. They also indicated thathigher rainfall induces lower density. However, foliar levels of nitrogen at Mangakahia(highest-density site) were about average for the six sites.
In Milne’s (1991) study (Table 1), whole-tree basic densities showed a similar range ofmeans in the three 11- to 12-year-old stands sampled in the South Island, ranging from419 kg/m3 in Westland to 483 kg/m3 at Golden Downs. Mean annual rainfall at the Westlandsite of 1900 mm was almost double that at Golden Downs, adding support to the high-rainfall/low-density hypothesis. By contrast, in the North Island, whole-tree density for 2915-year-old trees from Kaingaroa Forest (altitude 230 m) averaged 467 kg/m3 (Lausberg etal. 1995) and 26 15-year-old trees from Kinleith averaged 474 kg/m3 (J.D.Richardsonunpubl. data), all of Victorian provenances.
There was wide tree-to-tree variation in whole-tree basic density within all six sites andin corresponding breast height core density. The within-site range of whole-tree density wasca. 111 kg/m3 at Mangakahia and Wainui and Drumfern, up to 145 kg/m3 at Millers Flat. Withan average within-site standard variation for whole-tree density of 37 kg/m3, this providesgood potential for gain from phenotypic selection for density, as a basis for geneticimprovement of this trait.
The other wood properties of bark thickness, heartwood, and stem rot, that are not directlyrelated to density, showed significant differences between sites (Table 7) — minor for barkthickness but substantial for heartwood development. Bark was thinner on trees at Rawekathan at the other sites, perhaps in relation to the same factors that caused its very low density.Heartwood percentage was lowest at Millers Flat and was also low at the other “cold” sites,Wainui and Drumfern, with trees aged respectively 8, 10, and 9 years. Stem rot, confinedmainly to the basal and breast-height discs, was much worse at Millers Flat than elsewhere.Moisture content was significantly lower in trees at Wainui than other sites and higher atRaweka.
There were clear and strong trends in all wood properties from the base of the tree to thetop. These are shown graphically for individual variables in Fig. 1–4 (each site line-plot,based on means of 15 trees, or less for upper logs), and by disc and log height class inAppendix Tables A2 and A3. Differences between sites at each disc sampling height weresignificant for all wood properties at most sample heights, as shown by ANOVA F-ratios.
Bark thickness (Fig.1) quickly reduced from up to 14 mm at the base to 6–8 mm at 1.4 mheight, gradually decreasing to 3–5 mm from 15 m upwards. Heartwood percentage (Fig. 2)at the base, at 1.4 m, and up to 5 m height averaged 41% to 61%, depending on site, and from10 m upwards decreased rapidly to near zero at 15–20 m. Moisture content (Fig. 3) at eachsite decreased with height, parallel with the increase in basic density. Green density (notgraphed) decreased from the base to height 5 m and then increased again with increasingheight. Basic density (Fig. 4) at each site decreased from the base to 1.4 m, by up to27 kg/m3 at Kinleith, and then increased strongly to the top sampling point. At Wainui,however, the increase was only 12 kg/m3.
Internal CheckingInternal checking was assessed only on the breast-height discs, each of which was
bisected diametrically to give two semi-circular samples which were respectively air-dried

368 New Zealand Journal of Forestry Science 32(3)
FIG. 3–Average changes in moisture content with height up the stem, by site.
FIG. 1–Average changes in bark thickness with height up the stem, by site.
FIG. 2–Average changes in heartwood percentage with height up the stem, by site.
0
2
4
6
8
10
12
14
16
0 5 10 15 20 25Disc height (m)
Bar
k th
ickn
ess
(mm
)
MangakahiaRawekaKinleithWainuiMiller's FlatDrumfern
0
10
20
30
40
50
60
70
0 5 10 15 20 25Disc height (m)
Hea
rtw
oo
d (
%)
MangakahiaRawekaKinleithWainuiMiller's FlatDrumfern
60
80
100
120
140
160
180
0 5 10 15 20 25
Disc height (m)
Mo
istu
re c
on
ten
t (%
)
MangakahiaRawekaKinleithWainuiMiller's FlatDrumfern

Shelbourne et al. — Density and checking of Eucalyptus nitens 369
and kiln-dried. The number of rings affected by checks, and the number of checks, wererecorded for the heartwood, “transition wood” (one ring either side of the heartwood/sapwood boundary), and sapwood of each sample, and the mean values are given in Tables8 and 9.
There was much more checking apparent in the air-dried discs than in the kiln-dried discs.More checking occurred in the transition-wood zone in both air- and kiln-dried discs than inthe heartwood or sapwood, despite there being, normally, only two rings in the transition-wood zone. Considering all checked rings seen in air-dried discs, an average of 4.0 rings hadchecks at Raweka and Mangakahia, 3.1 rings at Kinleith, and 2.3 rings or less at the otherthree sites. The same site effects for total number of checks/disc were evident; at Mangakahia,
FIG. 4–Average changes in basic density with height up the stem, by site.
TABLE 8–Site means for internal checking of air-dried breast-height discs––––––––––––––––––––––––––––––––––––––––––––––––––––––––––––––––––––––––––––––––
Site No. of No. of No. of No. of rings with checking Total--------------------------------------------
trees rings heart- Heart- Trans- Sap- All No. ofwood wood ition wood checksrings wood per disc
––––––––––––––––––––––––––––––––––––––––––––––––––––––––––––––––––––––––––––––––Mangakahia 15 10.5a 5.9a 0.87bc 2.5a 0.67 4.0b 37.8abcRaweka 16 10.0ab 5.2b 1.13c 2.3ab 0.63 4.0b 43.2bcKinleith 15 9.8b 5.1bc 0.40abc 1.8abc 0.87 3.1ab 50.5cWainui 15 10.0ab 6.0a 0.33ab 1.5bc 0.27 2.1a 12.3aMillers Flat 16 7.9d 4.5c 0.13ab 1.4c 0.31 1.8a 15.7abDrumfern 15 8.8c 5.0bc 0.07a 1.7abc 0.53 2.3a 19.5abANOVA F for Sites 30.7*** 14.3*** 4.8*** 4.1** 1.8 6.8*** 4.5**––––––––––––––––––––––––––––––––––––––––––––––––––––––––––––––––––––––––––––––––Tukey letters significant at p <0.05* significant at p ≤0.05** significant at p ≤0.01*** significant at p ≤0.001
350
400
450
500
550
600
0 5 10 15 20 25Disc height (m)
Bas
ic d
ensi
ty (
kg/3
m)
MangakahiaRawekaKinleithWainuiMiller's FlatDrumfern

370 New Zealand Journal of Forestry Science 32(3)
Raweka, and Kinleith there were on average 44 checks/disc, and at the other sites there wereonly an average of 16 per disc. Although there were fewer rings checked and fewer checksper disc, the trends in site differences of internal checking in kiln-dried discs were verysimilar to those for air-dried.
There was wide tree-to-tree variation in checking at the heavily checked sites ofMangakahia and Raweka. Total number of checks per tree in the breast-height disc variedfrom 95 to 7 and no trees were free of checks. By contrast, at Millers Flat, at Drumfern, andeven at Wainui in the central North Island, from one-third to one-half of the trees had zeroor only a very few checks in the air-dried breast-height disc, indicating scope for selection.With an average within-site standard deviation of number of checks per disc of 28, there wasplenty of variation between trees at a site for selection. The heritability of checking inE. nitens is unknown, however.
Lausberg et al. (1995) reported five times more checks visible on the inside than on theoutside, when dried discs were cross-cut perpendicular to the stem axis. The same was foundhere where numbers of checks was assessed on the outside of a sub-sample of discs from theNorth Island sites. However, for the two South Island sites (where checking was much less)the reverse was the case. There is no ready explanation for this phenomenon. It is possiblethat the discs from Millers Flat and Drumfern, which were collected within a week of eachother by the same team and were not cold-stored as long as the earlier-collected North Islanddiscs, showed an obscure effect of a different storage history.
On a site-mean basis, amounts of checking in air-dried discs were evidently unrelated tobasic density, or to mean annual rainfall, but showed a positive association with mean annualtemperature and mean minimum daily temperature (more checking on warm sites). Therewas also a clear negative association of site means of both number of rings checked and totalnumber of checks, with length of green crown, and thus with crown health — i.e., sites withgood crown health had far fewer checks. Length of green crown seemed to reflect the levelof ecological adaptation of the species to the site.
TABLE 9–Site means for internal checking of kiln-dried breast-height discs––––––––––––––––––––––––––––––––––––––––––––––––––––––––––––––––––––––––––––––––
Site No. of No. of No. of No. of rings with checking Total--------------------------------------------
trees rings heart- Heart- Trans- Sap- All No. ofwood wood ition wood checksrings wood per disc
––––––––––––––––––––––––––––––––––––––––––––––––––––––––––––––––––––––––––––––––Mangakahia 15 10.5a 6.0a 0.93b 1.6ab 0.27 2.8bc 18.2abRaweka 16 10.0ab 5.2b 1.25b 1.8b 0.19 3.3c 28.3bKinleith 15 9.8b 5.1b 0.27a 1.7ab 0.40 2.4abc 30.3bWainui 15 10.0ab 5.9a 0.27a 0.8a 0.13 1.2a 7.1aMillers Flat 16 7.9d 4.4c 0.06a 1.1ab 0.19 1.3ab 10.9abDrumfern 15 8.8c 5.0bc 0.13a 1.7ab 0.20 2.1abc 16.2abANOVA F for Sites 30.7*** 15.4*** 10.2*** 3.1* 0.5 4.9*** 3.2*––––––––––––––––––––––––––––––––––––––––––––––––––––––––––––––––––––––––––––––––Tukey letters significant at p <0.05* significant at p ≤0.05** significant at p ≤0.01*** significant at p ≤0.001

Shelbourne et al. — Density and checking of Eucalyptus nitens 371
Much the same trends in site-mean checking were evident for kiln-dried discs. Checkingwas again more frequent in the transition wood zone but mean numbers of rings affected ineach zone and overall were less at most sites than for air-dried discs. Total numbers of checkswere reduced to half to two-thirds of those in air-dried discs at the three northernmost sites,but to more than two-thirds at Wainui and the two South Island sites.
Average Within-site Correlations Amongst Wood Properties, InternalChecking, and Tree Characteristics
These correlations were estimated within each site, z- transformed (Snedecor 1962 ), andaveraged over the six sites, then transformed back to r values. Basic density showed nosignificant correlations within sites with growth traits, diameter, and volume at the individual-tree level (Table 10). Neither did it show any significant correlation with the amount ofheartwood and the length of green crown. There was a strong negative relationship betweenbasic density and moisture content. Diameter and volume were strongly correlated withgreen crown length, which is considered to reflect crown health. Heartwood percentageshowed a weak to moderate correlation with tree diameter and volume.
TABLE 10–Average within-site correlations of individual-tree basic density with other traits, over sixsites
––––––––––––––––––––––––––––––––––––––––––––––––––––––––––––––––––––––––––––––––Basic Diameter Volume Heart- Green Moisture
density wood crown contentpercentage length
––––––––––––––––––––––––––––––––––––––––––––––––––––––––––––––––––––––––––––––––Basic density 1.00Diameter 0.00 1.00Volume –0.01 0.98*** 1.00Heartwood percentage –0.10 0.42*** 0.40*** 1.00Green crown length 0.03 0.80*** 0.80*** 0.20 1.00Moisture content –0.87*** 0.08 0.09 0.23* –0.01 1.00––––––––––––––––––––––––––––––––––––––––––––––––––––––––––––––––––––––––––––––––* significant at p ≤0.05** significant at p ≤0.01*** significant at p ≤0.001
Average within-site correlations of total number of checks and number of rings that werechecked (Table 11) with basic density, bark thickness, diameter, and green crown lengthwere all very low and non-significant, whether measured on air-dried or kiln-dried discs.Number of rings checked had slightly higher correlations with the other traits than totalnumber of checks. Total number of checks was quite strongly correlated with number of ringschecked for air- and kiln-dried discs (r = 0.68 and 0.69 respectively, p <0.001) and there wasa very weak negative relationship of number of rings checked with density (r = –0.30 and–0.35 respectively, p <0.01).
Average within-site correlations between checking in air- and kiln-dried discs (Table 12)were highly significant but only moderate for total number of checked rings (0.65) and totalnumber of checks (0.77). For each tree, the breast-height disc was bisected diametrally togive semi-circular half-discs for air- and kiln-drying, and thus the circumferential variation

372 New Zealand Journal of Forestry Science 32(3)
in checking within a disc is reflected in these correlations. It is surmised that correlationswould have been higher if adjacent whole discs had been given the alternative dryingtreatments.
A FURTHER ANALYSIS OF THE DATA OF LAUSBERG et al. (1995)ON CHECKING IN DISCS AND BOARDS
DiscsAs referred to under “Previous Studies” above, Lausberg et al. (1995) assessed checking
in twenty 15-year-old trees of E. nitens, grown in Kaingaroa Forest in the central North
TABLE 11–Mean within-site correlations of individual-tree total numbers of checks with other traits,over six sites
––––––––––––––––––––––––––––––––––––––––––––––––––––––––––––––––––––––––––––––––Total Heart- Bark Basic Diameter Green No. ofNo. of wood thickness density under crown ringschecks percentage bark length checked
––––––––––––––––––––––––––––––––––––––––––––––––––––––––––––––––––––––––––––––––Air-dried breast-height discsTotal No. of checks 1.00Heartwood percentage 0.09 1.00Bark thickness 0.11 0.34*** 1.00Basic density –0.07 –0.10 0.22 1.00Diameter under bark 0.10 0.40*** 0.70*** –0.03 1.00Green crown length 0.08 0.20 0.64*** 0.03 0.82*** 1.00No. of rings checked 0.68*** 0.17 0.09 –0.30** 0.25 0.18 1.00
Kiln-dried breast-height discsTotal No. of checks 1.00Heartwood percentage 0.03 1.00Bark thickness 0.08 0.34*** 1.00Density –0.09 –0.10 0.22 1.00Diameter under bark 0.08 0.40*** 0.70*** –0.03 1.00Green crown length 0.05 0.20 0.64*** 0.03 0.82*** 1.00No. of rings checked 0.69*** 0.09 0.04 –0.35*** 0.13 0.11 1.00––––––––––––––––––––––––––––––––––––––––––––––––––––––––––––––––––––––––––––––––* significant at p ≤0.05** significant at p ≤0.01*** significant at p ≤0.001
TABLE 12–Average correlation coefficients of the same traits between air-dried and kiln-dried discs––––––––––––––––––––––––––––––––––––––––––––––––––––––––––––––––––––––––––––––––
Trait name r value––––––––––––––––––––––––––––––––––––––––––––––––––––––––––––––––––––––––––––––––
Number of rings of heartwood 0.95***Number of checks in heartwood rings 0.67***Number of checks in “transition rings” 0.40***Number of checks in sapwood rings 0.33**Total number of checked rings 0.65***Total number of checks 0.77***
––––––––––––––––––––––––––––––––––––––––––––––––––––––––––––––––––––––––––––––––* significant at p ≤0.05** significant at p ≤0.01*** significant at p ≤0.001

Shelbourne et al. — Density and checking of Eucalyptus nitens 373
Island, which had been selected for a range of basic density. Discs were taken at 0, 1.4, 6.4,and 11.4 m up the stem, but little checking was observed above this. Discs were cut in half,diametrically, and slowly kiln-dried at 40ºC and 60% RH for 10 days. All internal checks onthe external face of the disc were recorded (contrary to practice in this study), by ring, andwhether checks crossed latewood bands. A sub-sample of discs was cross-cut to exposechecks inside the disc. Checks were in the same areas and in the same proportions butnumbers were five times higher than occurrred on the external surface.
There was large tree-to-tree variation (F 19, 60, p <0.001) in numbers of checks per ring(Table 13). There was a rapid decrease in number of checks from the base of the tree (meanof 5.2 checks /ring) to the 11.4-m disc (0.5 checks per ring) (F 60, 1060 p <0.001), wherechecking became nearly negligible. About one-quarter of the trees showed very largenumbers of checks and a few trees had negligible numbers of checks. Trees rankedapproximately the same for checking in 0-, 1.4-, and 6.4-m discs. From breast height to 6.4 mnumbers of checks per ring were reduced by half, from an overall-discs mean of 4.5 to 2.4checks/ring (Fig. 5).
Evidently checking in this material would have been a serious problem if the butt log hadbeen sawn but not serious in the second (5.5 m) log. The large increase in numbers of checksvisible on fresh-cut inner surfaces of discs raises the question, unanswerable from these data,whether bisecting discs in this manner would have revealed more checks at greater heightsup the stem.
TABLE 13–Mean number of checks per ring, by individual trees and by disc heights.Source: M.J.F.Lausberg (unpubl. data)
––––––––––––––––––––––––––––––––––––––––––––––––––––––––––––––––––––––––––––––––Tree No. Mean number Number of checks per ring for each disc/height
of checks per ring ---------------------------------------------------------------------------over all 4 discs 0.0 m 1.4 m 6.4 m 11.4 m
––––––––––––––––––––––––––––––––––––––––––––––––––––––––––––––––––––––––––––––––3 2.0 abcde 4.81 1.94 abc 0.00 a 0.00 a9 0.6 a 1.31 0.31 a 0.63 ab 0.00 a
11 2.2 abcde 4.75 2.19 abc 0.81 ab 0.13 a13 1.5 ab 2.69 1.25 a 1.44 ab 0.00 a16 2.9 abcde 4.94 4.25 abc 1.44 ab 0.00 a17 7.5 f 8.00 11.25 bc 7.75 c 0.63 ab35 1.6 ab 2.38 2.06 abc 1.25 ab 0.00 a37 3.1 abcde 5.38 5.06 abc 0.75 ab 0.00 a42 2.3 abcde 4.19 2.31 abc 1.31 ab 0.19 a49 1.9 abcde 3.56 2.38 abc 0.88 ab 2.25 b57 7.7 f 8.31 11.69 c 6.13 bc 0.25 ab63 1.7 abc 2.31 2.81 abc 0.25 ab 1.56 ab64 6.1 ef 9.56 8.56 abc 1.75 abc 0.88 ab68 6.0 def 9.75 6.38 abc 5.00 abc 0.06 a73 2.0 abcde 4.00 1.81 ab 1.19 ab 0.06 a76 5.1 bcdef 7.44 8.56 abc 2.06 abc 0.06 a77 3.1 abcde 6.81 3.13 abc 0.88 ab 0.06 a85 1.8 abcd 1.81 3.31 abc 1.25 ab 0.06 a90 1.5 ab 2.69 1.81 ab 0.75 ab 0.00 a93 5.9 cdef 7.38 7.13 abc 5.50 abc 0.81 a
Mean ofall trees 3.3 5.18 c 4.60 c 2.41 b 0.45 a––––––––––––––––––––––––––––––––––––––––––––––––––––––––––––––––––––––––––––––––

374 New Zealand Journal of Forestry Science 32(3)
Checks in discs were largely confined to the heartwood and increased in frequencytowards the outer rings of heartwood into the sapwood (Fig. 5). This is partly a scalar effect,related to the increasing circumference of rings from pith to bark.
1-m Boards
Checking was also examined in cross-sections of air-dried diametrical boards, sawn froma 1-m billet from below 1.4 m in each tree. The 25-mm diametrical boards were end-sealedand air-dried for 3 months to 30% moisture content (m.c.) and then forced-air-dried to below20% m.c., before being placed in a 12% m.c. equilibrium room for 2 weeks. They were thencross-cut to give one cross-section for assessing internal checking.
Numbers of checks per ring from opposite sides of the pith were counted for each board,designated arbitrarily as sides A and B. Mean checks per ring in boards are compared withthe mean number of checks per ring in the breast-height (kiln-dried) discs in Fig.6, and givenby individual trees in Table 13.
There were large and significant differences among trees in mean number of checks in the1.4-m disc (F 19,15 p <0.001) and, similarly, for the 1-m boards (F 19, 15 p <0.001) each sideof the pith and for the whole cross-section (Fig.6, Table 14). Numbers of checks increasedsteadily from the pith to ring 11 or 12, the outermost heartwood ring, and then reduced to nearzero in the outer sapwood rings. These ranged, for the breast-height disc, from 11.7 checksper ring for tree 57 to near zero for tree 9 and, for combined sides of boards, from 4.6 checksper ring for tree 57 to near zero for several trees. Differences between rings were also highly
FIG. 5–Mean number of internal checks per ring, by disc height Source: M.J.F.Lausberg (unpubl. data)
0 1 2 3 4 5 6 7 8 9 10 11 12 13 14 15 16Growth rings
15
10
5
0
Ch
ecks
Height: 0 metres
Heart ––––> <––– Sap
0 1 2 3 4 5 6 7 8 9 10 11 12 13 14 15 16Growth rings
Heart ––––> <––– Sap
Height: 6.4 metres
0 1 2 3 4 5 6 7 8 9 10 11 12 13 14 15 16Growth rings
15
10
5
0
Ch
ecks
Height: 1.4 metres
Heart ––––> <––– Sap
0 1 2 3 4 5 6 7 8 9 10 11 12 13 14 15 16Growth rings
Heart ––––> <––– Sap
Height: 11.6 metres

Shelbourne et al. — Density and checking of Eucalyptus nitens 375
FIG. 6–Mean number of internal checks per ring, for 1.4-m disc and for boards from basal billetSource: M.J.F.Lausberg (unpubl. data)
significant (F 15, 287 p <0.001). There were on average nearly 4 times the number of checksper ring in the discs that there were in the boards, mainly because the cross-sectional area ofthe discs was greater than that of the 25-mm-thick boards. There was also appreciablevariation in number of checks either side of the pith in the boards.
There was a weak-to-moderate but significant correlation (r = 0.51, p <0.05) betweennumbers of rings checked in the 1.4-m discs and in the boards. The correlation between totalnumber of checks in the kiln-dried 1.4-m discs and the total number of checks in both sidesof the boards combined (r = 0.78, p <0.01) was only moderate, which may indicate that onecross-sectional sample for each board was insufficient. There would also be very differentcross-sectional vs tangential drying surfaces for checking to be expressed in discs and boards.Also, the kiln-drying of discs was a different treatment to the air-drying of boards.
The correlation between numbers of rings checked on opposite sides of each board wasonly 0.52 whilst that between total numbers of checks on opposite sides was 0.92. The meannumber of checks per ring was very variable, with an average of only 0.6 checks per ring foreach side of the board or 1.2 per whole board, indicating that many rings would have nochecks.
DISCUSSION AND CONCLUSIONS
This survey of wood density of E. nitens was planned to elucidate, if possible, any patternand/or causes of variation in density and internal checking with site. Site mean whole-treebasic density, estimated from 15 trees/site (each planted with the same seedlot at the same
Side A
0 1 2 3 4 5 6 7 8 9 10 11 12 13 14 15 16Growth rings
0 1 2 3 4 5 6 7 8 9 10 11 12 13 14 15 16Growth rings
15
10
5
0
Ch
ecks
1.4-metre disc
Side B
0 1 2 3 4 5 6 7 8 9 10 11 12 13 14 15 16Growth rings
15
10
5
0
Ch
ecks
1-metre board (combined sides)
0 1 2 3 4 5 6 7 8 9 10 11 12 13 14 15 16Growth rings

376 New Zealand Journal of Forestry Science 32(3)
spacing), ranged from 428 to 476 kg/m3. Sites ranged in altitude from 40 to 540 m, and inlatitude from 35°52´S to 45°55´S. Mean density was quite similar at four of the sites —Kinleith, Wainui (both central North Island), Millers Flat, and Drumfern (southern SouthIsland) — varying from 445 kg/m3 to 459 kg/m3. At Mangakahia (Northland) density washighest (476 kg/m3), and at Raweka (coastal Bay of Plenty) it was lowest (428 kg/m3).Raweka had the highest mean annual rainfall of all sites, and Mangakahia the highest meanannual temperature, appreciably higher than Raweka, the next warmest site. Raweka alsostood out as having highest foliar levels of nitrogen, phosphorus, and magnesium, and lowestlevels of aluminium and copper of the six sites.
Whole-tree density from earlier studies at other sites in New Zealand, at or about the sameage, nearly falls within the range for the sites in this study. These include 15-year-old treesat Kaingaroa (altitude 230 m) and Kinleith (altitude ca. 350 m). The highest site mean densitywas for 11-year-old trees at Golden Downs Forest in Nelson (483 kg/m3), and the lowest wasat Ahaura in Westland (419 kg/m3), both sites having the same mean annual temperature of11.5°C, about the same as Kinleith’s. Ahaura’s mean annual rainfall was 1900 mm, almostdouble that at Golden Downs, supporting the hypothesis that high rainfall may contribute tolow wood density. However, temperature does not seem to have much effect on density, witha mean annual temperature for Mangakahia, the highest density site in this study, of 14.7°Cin contrast to that at Golden Downs of 11.5°C.
TABLE 14–Mean number of checks per ring for 1.4-m discs and diametrical boards––––––––––––––––––––––––––––––––––––––––––––––––––––––––––––––––––––––––––––––––
Tree Mean No. of checks/ring Total No. of checks/ringfor 1.4-m disc for board
––––––––––––––––––––––––––––––––––––––––––––––––––––––––––––––––––––––––––––––––3 2.1 abc 0.50 a9 0.3 a 0.63 ab
11 2.3 abc 0.31 a13 1.3 ab 0.07 a16 4.3 abc 0.75 ab17 11.3 bc 3.53 bc35 2.2 abc 0.60 ab37 5.4 abc 0.73 ab42 2.5 abc 0.07 a49 2.4 abc 0.19 a57 11.7 c 4.60 c63 3.2 abc 0.14 a64 9.1 abc 2.60 abc68 6.4 abc 1.80 abc73 1.9 abc 1.33 ab76 8.6 abc 2.53 abc77 3.3 abc 1.40 ab85 3.3 abc 0.00 a90 1.9 abc 1.33 ab93 7.6 abc 1.79 abc93 7.6 abc 1.79 abc
Means 4.56 1.25––––––––––––––––––––––––––––––––––––––––––––––––––––––––––––––––––––––––––––––––Tukey letters significant at p <0.05

Shelbourne et al. — Density and checking of Eucalyptus nitens 377
All whole-tree density studies of E. nitens, including this one, show a small decrease indensity from the base of the tree to 1.4 m height, sometimes up to 6 m, and thence a steadyincrease with height. The amount of increase in disc density from 1.4 m up to 15 m heightin this study varied with site, from 71 kg/m3 at Mangakahia to 12 kg/m3 at Wainui. Lausberget al. (1995), McKenzie, Shelbourne, Kimberley, McKinley, & Britton (in prep.), andRichardson (unpubl. data) all showed increases of up to 77 kg/m3 from breast height tomerchantable top. The extent of the increase appears to increase with age of tree. Meanwhole-tree density also increases with age, as shown in a summation of New Zealand data(McKinley et al. 2000), though the range is less than that due to site.
The increase of basic density with height found in E. nitens has important consequencesfor utilisation. Log mean values for basic density are lowest for the butt log and increasesubstantially for the second and third 5-m logs. This trend would favour utilisation of theupper logs for veneers for laminated veneer lumber where stiffness is desirable (McKenzie,Turner, & Shelbourne in prep.; McKenzie, Shelbourne, Kimberley, McKinley, & Britton inprep.). For pulping, whole-tree chip density will always be higher than that of breast heightsamples.
Internal checking is an artifact of drying wood, rather than a wood property. In this study,a breast-height disc from 15 trees per site was divided into two semi-circular halves, one air-dried and the other slowly kiln-dried. These were cross-cut after drying, and internalchecking was measured on internal faces. There were large differences between sites in thetotal numbers of checks and in the numbers of rings checked. Checking was concentratedmostly in the outer heartwood (“transition wood”). Kiln-drying of discs resulted in fewerrings with checks than air-drying and far fewer checks, especially at the sites with severechecking, but correlations of individual tree values between air- and kiln-dried disc halveswere high. Numbers of rings checked and total number of checks were much higher atKinleith, Raweka, and Mangakahia, the sites with higher mean annual temperatures, than atcolder Wainui, Drumfern, and Millers Flat. At the latter sites, green crowns were muchlonger and health was much better than at the other warmer sites. Incidence of checking washighly variable among trees within sites, which promised well for selective breedingprovided some means can be devised for non-destructive assessment of “checkability”.
Average within-site correlations of basic density of individual trees with growth rate,heartwood percentage, and length of green crown were all very low and non-significant,though individual within-site correlations often fluctuated wildly. Average within-sitecorrelations of numbers of rings checked and total number of checks with density, barkthickness, stem diameter, and green crown length were also very low and non-significant,for both air-dried and kiln-dried discs. However, average within-site correlations of diameterand volume with green crown length (which is considered to reflect crown health) werestrong. Long green crowns are associated with low checking at the site level but within sitesbig trees have longer green crowns; however, this appears unrelated to the amount ofchecking in their dried wood. Wood density and internal checking each generally behavedindependently of the other wood and tree properties at each site.
The further analysis of checking data from an earlier study by Lausberg et al. (1995)greatly extended the scope of the present study. The disc sampling of 20 trees from KaingaroaForest at consecutive heights, as well as by a cross-section of a diametrical board sawn from

378 New Zealand Journal of Forestry Science 32(3)
a basal 1-m billet, showed similar high levels of checking to those at other warmer NorthIsland sites. Discs were kiln-dried and checks on the external surface of the disc wererecorded, rather than on the inside of the disc (after cross-cutting) as in the recent study.Checking was highly variable between trees and was found in decreasing amounts up to butnot beyond height 11.4 m. Checks were found throughout the heartwood in both air-driedboards and kiln-dried discs, but with some increase in frequency in outer-heartwood rings.There was also considerable variation in checking from one side of the diametrical board tothe other. The correlation between number of checks per ring (in one cross-section) of each1-m board and kiln-dried disc was moderate (r = 0.78). This gives some confidence that thekiln-dried discs were representative of internal checking in sawn timber, fully substantiatedlater by the sawing study of McKenzie, Shelbourne, Kimberley, McKinley & Britton (inpress).
Internal checking is a serious and prevalent drying defect of E. nitens sawn timber whichis site-dependent in its severity. As an artifact of drying solid wood products, it may preventsome E. nitens plantations from providing appearance-grade lumber, especially when grownon warmer sites. The high variability among trees in checking does offer the possibility ofselecting against it in breeding programmes, and non-destructive means of evaluation arebeing developed. Growing E. nitens only on sites where it is well-adapted and has long,healthy, green crowns will reduce internal checking.
ACKNOWLEDGMENTSThe co-operation of site owners Carter Holt Harvey Forests, Fletcher Challenge Forests, Southwood
Export Ltd, and Ian Garden in collection of material is gratefully acknowledged. Jeremy Cox and DaveHenley helped in tree felling, and Don McConchie, Errol Hay, and Eva Moke with field and laboratorywork. BIOCLIM climatic data for the sites was provided by Andrew Dunningham. The research wasfunded by the Eucalypt Co-operative and the Foundation for Research, Science and Technology.
REFERENCESBEETS, P.N.; GILCHRIST, K.; JEFFREYS, M.P. 2001: Wood density of radiata pine; effect of
nitrogen supply. Forest Ecology and Management 145: 173–180.BORRALHO, N.M.G.; COTTERILL, P.P.; KANOWSKI, P.L. 1993: Breeding objectives for pulp
production of Eucalyptus globulus under different industrial cost structures. Canadian Journalof Forest Research 23: 648–656.
GEA, L.D.; McCONNOCHIE, R.M.; BORRALHO, N.M.G. 1997: Genetic parameters for growth andwood density traits in Eucalytus nitens in New Zealand. New Zealand Journal of ForestryScience 27(3): 237–244.
GREAVES, B.L.; FRENCH, J.; MADDERN, K.N. 1997: Breeding objective for plantation eucalyptsgrown for production of kraft pulp. Forest Science 43(4): 465–472.
HASLETT, A.N. 1988: Properties and utilisation of exotic speciality timbers grown in New Zealand.Part V: Ash eucalypts and Eucalyptus nitens: E. delegatensis, E. fastigata, E. fraxinoides,E. obliqua, E. regnans, E. sieberi, and E. nitens. New Zealand Ministry of Forestry, ForestResearch Institute, FRI Bulletin No. 119(5).
HASLETT, A.N.; YOUNG, G.D. 1992: Nitens for sawn timber? New Zealand Tree Grower 13(2): 8–9.HOOD, I.A.; GARDNER, J.F.; KIMBERLEY, M.O.; MOLONY, K. 2002: Variation among eucalypt
species in early susceptibilitty to the leaf spot fungi Phaeophleospora eucalypti andMycosphaerella spp. New Zealand Journal of Forestry Science 32(2): 235–255.
Shelbourne et al. — Density and checking of Eucalyptus nitens 379
KIBBLEWHITE, R.P.; JOHNSON, B.I.; SHELBOURNE, C.J.A. 2000: Kraft pulp qualities ofEucalyptus nitens, E. globulus, and E. maidenii, at ages 8 and 11 years. New Zealand Journalof Forestry Science 30(3): 447–457.
KIBBLEWHITE, R.P.; RIDDELL, M.J.C.; SHELBOURNE, C.J.A. 1998: Kraft fibre and pulpqualities of 29 trees of 15-year-old New Zealand-grown Eucalyptus nitens. Appita Journal51(2): 114–121.
KING, J.N.; BURDON, R.D.; YOUNG, G.D. 1993: Provenance variation in New Zealand-grownEucalyptus delegatensis. 2: Internal checking and other wood properties. New Zealand Journalof Forestry Science 23(3): 314–323.
LAUSBERG, M.J.F.; GILCHRIST, K.F.; SKIPWORTH, J.H. 1995: Wood properties of Eucalyptusnitens grown in New Zealand. New Zealand Journal of Forestry Science 25(2): 147–163.
LOW, C.B.; SHELBOURNE, C.J.A. 1999: Performance of Eucalyptus globulus, E. maidenii,E. nitens, and other eucalypts in Northland and Hawke’s Bay at ages 7 and 11 years. NewZealand Journal of Forestry Science 29(2): 274–288.
McKENZIE, H.M.; TURNER, J.C.P.; SHELBOURNE, C.J.A.: Processing young plantation-grownEucalyptus nitens (Dean et Maiden) for solid-wood products. 1: individual-tree variation inquality and recovery of appearance-grade lumber and veneer (in prep.).
McKENZIE, H.M.; SHELBOURNE, C.J.A.; KIMBERLEY, M.O.; McKINLEY, R.B.; BRITTON,R.A.J.: Processing young plantation-grown Eucalyptus nitens (Dean et Maiden) for solid-woodproducts. 2: Predicting product quality from tree, increment core, disc, and one-metre billetcharacteristics (in prep.).
McKIMM, R.J.; WAUGH, G.; NORTHWAY, R.L. 1988: Utilisation potential of plantation-grownEucalyptus nitens. Australian Forestry 51(1): 63–71.
McKINLEY, R.B.; SHELBOURNE, C.J.A.; HARRIS, J.M.; YOUNG, G.D. 2000: Variation inwhole-tree basic density of a range of plantation species grown in New Zealand. New ZealandJournal of Forestry Science 30(3): 436–446.
McKINLEY, R.B.; SHELBOURNE, C.J.A.; LOW, C.B.; PENELLUM, B.; KIMBERLEY, M.O.2002: Wood properties of young Eucalyptus nitens, E. globulus, and E. maidenii in Northland,New Zealand. New Zealand Journal of Forestry Science 32(3):
MILLER, J.T.; CANNON, P.G.; ECROYD, C.E. 1992: Introduced forest trees in New Zealand:Recognition, role and seed source. 11 Eucalyptus nitens (Deane et Maiden) Maiden. NewZealand Ministry of Forestry, FRI Bulletin No. 124(11).
MILNE, P. 1991: Wood properties of Eucalyptus nitens grown in South Island. New Zealand.Dissertation for New Zealand Diploma of Science. AAVA (The Authority for AdvancedVocational Awards).
MITCHELL, N.D. 1991: The derivation of climate surfaces for New Zealand, and their application tothe bioclimatic analysis of the distribution of kauri (Agathis australis). New Zealand Journal ofthe Royal Society 21: 13–24.
NICHOLAS, I.D.; JANSEN, G.R.; McNEIL, D.L.: Above-ground biomass of the Eucalyptus nitenscomponent in a Canterbury 7-year-old mixed species stand (in prep.).
NICHOLAS, I.D.; KIMBERLEY, M.O.; JANSEN, G. 2000: A comparison of biomass productivityfor Eucalyptus nitens, E. globulus ssp. globulus and E. globulus ssp. maidenii on two sites inNew Zealand. Poster paper: The future of eucalypts for wood products. Page 378 in Proceedingsof IUFRO Conference, 19 to 24 March, Launceston, Tasmania, Australia.
NICHOLAS, I.D.; JAMIESON, F.; McCONCHIE, M.; HAWKE, A.: Wood density assessment ofpotential New Zealand bioenergy species (in prep.).
NIX, H.A. 1986: A biogeographic analysis of Australian Elapid snakes. Pp. 4–15 in Longmore, R.(Ed.) “Atlas of Elapid snakes of Australia”. Australian Government Publishing Service,Canberra.
PURNELL, R.C. 1988: Variation in wood properties of Eucalyptus nitens in a provenance trial on theeastern Transvaal highveld in South Africa. South African Forestry Journal 144: 10–22.

380 New Zealand Journal of Forestry Science 32(3)
SAS INSTITUTE INC. 1989: “SAS/STAT® User’s Guide”, Version 6, fourth edition. Cary, NorthCarolina.
–––––1990: “SAS® Procedures User’s Guide”, Version 6, fourth edition. Cary, North Carolina.SHELBOURNE, C.J.A.; LOW, C.B.; SMALE, P.J. 2000: Eucalypts for Northland: 7- to 11-year
results from trials of nine species at four sites. New Zealand Journal of Forestry Science 30(3):366–383.
SMITH, D.M. 1954: Maximum moisture content method for determining the specific gravity of smallwood samples. United States Department of Agriculture, Forest Service, Forest ProductsLaboratory Report No. 2014. 8 p.
SNEDECOR, G.W.1962: “Statistical Methods”. The Iowa State University Press, Ames, Iowa, USA.WARDLAW, T.J.; NEILSEN, W.A. 1999: Decay and other defects associated with pruned branches
of Eucalyptus nitens. Tasforests 11: 49–57.YANG, J.L.; WAUGH, G. 1996: Potential of plantation-grown eucalypts for structural sawn products.
II. Eucalyptus nitens (Dean & Maiden) and E. regnans F. Muell. Australian Forestry 59 (2):99–107.

Shelbourne et al. — Density and checking of Eucalyptus nitens 381
AP
PE
ND
IX
TA
BLE
A1–
ME
AN
NU
TR
IEN
T L
EV
ELS
IN F
OLI
AG
E, B
Y S
ITE
S––
––––
––––
––––
––––
––––
––––
––––
––––
––––
––––
––––
––––
––––
––––
––––
––––
––––
––––
––––
––––
––––
––––
––––
––––
––––
––––
––––
––––
––––
––––
–
Site
NP
KM
gC
Ca
Na
Al
BC
uM
nZ
nF
e(%
)(%
)(%
)(%
)(%
)(%
)(%
)(p
pm)
(ppm
)(p
pm)
(ppm
)(p
pm)
(ppm
)––
––––
––––
––––
––––
––––
––––
––––
––––
––––
––––
––––
––––
––––
––––
––––
––––
––––
––––
––––
––––
––––
––––
––––
––––
––––
––––
––––
––––
––––
––––
–M
iller
s F
lat
1.58
0.11
50.
578
0.12
155
.90.
669
0.02
3819
386
712
26D
rum
fern
1.52
0.10
70.
544
0.12
856
.90.
623
0.02
2915
344
813
25M
anga
kahi
a1.
500.
108
0.55
70.
127
56.2
0.44
60.
0637
213
255
1027
Wai
nui
1.53
0.11
60.
546
0.12
655
.90.
815
0.01
5815
542
313
29R
awek
a1.
760.
120
0.56
90.
147
56.2
0.48
30.
0120
151
165
1228
Kin
leith
1.54
0.11
00.
605
0.12
6.56
.00.
560
0.01
3816
488
012
28––
––––
––––
––––
––––
––––
––––
––––
––––
––––
––––
––––
––––
––––
––––
––––
––––
––––
––––
––––
––––
––––
––––
––––
––––
––––
––––
––––
––––
––––
––––
–

382 New Zealand Journal of Forestry Science 32(3)
TA
BLE
A2–
ME
AN
DIS
C/H
EIG
HT
WO
OD
PR
OP
ER
TIE
S, B
Y S
ITE
S (
15 T
RE
ES
PE
R S
ITE
)––
––––
––––
––––
––––
––––
––––
––––
––––
––––
––––
––––
––––
––––
––––
––––
––––
––––
––––
––––
––––
––––
––––
––––
––––
––––
––––
––––
––––
––––
––––
–D
isc
Site
No.
of
Dbh
(m
m)
Bar
kH
eart
-M
oist
ure
Den
sity
(kg
/m3 )
Rot
heig
httr
ees
----
----
----
----
----
---
thic
knes
sw
ood
cont
ent
----
----
----
----
----
----
--(m
)O
ver
Und
er(m
m)
(%)
(%)
Gre
enB
asic
bark
bark
––––
––––
––––
––––
––––
––––
––––
––––
––––
––––
––––
––––
––––
––––
––––
––––
––––
––––
––––
––––
––––
––––
––––
––––
––––
––––
––––
––––
––––
––––
–––
0M
anga
kahi
a15
271
245
13.2
ab
61 a
140
bc11
11 a
466
a1.
12 a
Raw
eka
1626
624
411
.4 a
b60
ab
161
a10
96 a
422
b0.
64 a
Kin
leith
1524
922
114
.0 a
56 a
bc14
4 ab
1101
a45
3 ab
0.52
aW
ainu
i15
251
224
13.7
a52
c12
5 c
1051
b46
8 a
0.08
aM
iller
s F
lat
1623
121
010
.7 b
45 d
131
bc10
41 b
454
ab6.
02
bD
rum
fern
1525
022
512
.3 a
b54
bc
134
bc10
42 b
447
ab0.
04 a
AN
OV
A F
for
Site
s1.
581.
693.
47**
13.9
***
8.9*
**22
.8**
*2.
9*17
.7**
*
1.4
Man
gaka
hia
1523
221
5 8
.4 a
61 a
136
bc10
89 a
462
a0.
32R
awek
a16
231
217
6.8
ab
60 a
165
a10
72 a
408
b1.
50K
inle
ith15
208
192
8.0
ab
56 a
b15
0 ab
1061
a42
6 ab
0.12
Wai
nui
1521
319
8 7
.6 a
b51
b12
3 c
1004
b45
1 a
0.00
Mill
ers
Fla
t16
198
185
6.3
b41
c13
6 bc
1016
b43
4 ab
2.72
Dru
mfe
rn15
210
196
7.2
ab
54 a
b13
4 bc
1005
b43
1 ab
1.22
AN
OV
A F
for
Site
s1.
92.
02.
3*17
.6**
*12
.1**
*23
.4**
*4.
6**
2.3*
5.0
Man
gaka
hia
1519
4 ab
183
ab5.
556
ab
126
bc10
56 a
468
a0.
29R
awek
a16
207
a19
7 a
5.3
59 a
153
a10
57 a
421
b0.
00K
inle
ith15
176
ab16
5 ab
5.3
50 a
bc13
6 ab
1029
a44
1 ab
1.37
Wai
nui
1518
7 ab
175
ab5.
948
bc
115
c 9
72 b
453
ab0.
00M
iller
s F
lat
1616
1 b
151
b5.
023
d12
4 bc
1034
a46
5 a
0.00
Dru
mfe
rn15
171
ab16
2 ab
4.4
41 c
119
bc 9
63 b
442
ab0.
00A
NO
VA
Ffo
r S
ites
3.1*
*3.
3**
2.1
28.8
***
9.4*
**18
.6**
*3.
2*2.
1––
––––
––––
––––
––––
––––
––––
––––
––––
––––
––––
––––
––––
––––
––––
––––
––––
––––
––––
––––
––––
––––
––––
––––
––––
––––
––––
––––
––––
––––
––––
–

Shelbourne et al. — Density and checking of Eucalyptus nitens 383
TA
BLE
A2–
cont
.––
––––
––––
––––
––––
––––
––––
––––
––––
––––
––––
––––
––––
––––
––––
––––
––––
––––
––––
––––
––––
––––
––––
––––
––––
––––
––––
––––
––––
––––
––––
–D
isc
Site
No.
of
Dbh
(m
m)
Bar
kH
eart
-M
oist
ure
Den
sity
(kg
/m3 )
Rot
heig
httr
ees
----
----
----
----
----
---
thic
knes
sw
ood
cont
ent
----
----
----
----
----
----
--(m
)O
ver
Und
er(m
m)
(%)
(%)
Gre
enB
asic
bark
bark
––––
––––
––––
––––
––––
––––
––––
––––
––––
––––
––––
––––
––––
––––
––––
––––
––––
––––
––––
––––
––––
––––
––––
––––
––––
––––
––––
––––
––––
––––
–––
10.0
Man
gaka
hia
1515
1 ab
140
ab5.
5 a
42 a
114
bc10
76 a
503
ab0.
00R
awek
a16
170
a16
1 a
4.4
bc47
a14
3 a
1062
ab
439
c0.
04K
inle
ith14
134
bc12
6 bc
4.1
bc32
b12
5 b
1031
b46
2 bc
2.90
Wai
nui
1514
1 ab
132
ab4.
5 ab
19 c
111
bc 9
69 c
462b
c0.
00M
iller
s F
lat
1610
4 c
97
c3.
5 c
6 d
108
c10
62 a
b51
5 a
0.00
Dru
mfe
rn15
120
bc11
3 bc
3.6
bc19
c 9
8 c
959
c48
6 ab
0.00
AN
OV
A F
for
Site
s7.
8***
7.7*
**9.
3***
45.2
***
14.4
***
30.2
***
8.4*
**1.
9
15.0
Man
gaka
hia
1311
0 ab
101
ab4.
9 a
12 a
bc10
9 bc
d11
08 a
533
a0.
00R
awek
a16
126
a11
8 a
3.9
ab18
ab
132
a10
74 a
b46
6 b
0.00
Kin
leith
911
4 ab
106
ab4.
1 ab
21 a
121
ab10
50 b
477
b0.
19W
ainu
i14
92
ab 8
6 ab
3.4
b 2
c11
4 ab
c 9
85 c
463
b0.
00M
iller
s F
lat
3 8
2 7
53.
3 3
c 9
210
6755
70.
00D
rum
fern
8 9
0 ab
84
ab3.
2 b
4 b
c 8
8 d
948
c50
6 ab
0.00
AN
OV
A F
for
Site
s3.
6**
3.7*
*6.
8***
4.7*
*9.
6***
28.2
***
8.4*
**0.
3
20.0
Man
gaka
hia
3 9
2 8
34.
5 5
110
1120
a53
40.
00R
awek
a10
98
91
3.7
012
210
69 a
b48
40.
00K
inle
ith 4
91
84
3.9
412
210
61 b
480
0.00
Wai
nui
1 8
0 7
33.
5 2
85
988
c53
40.
00A
NO
VA
Ffo
r S
ites
0.5
0.6
1.1
0.8
1.2
11.6
***
1.9
0––
––––
––––
––––
––––
––––
––––
––––
––––
––––
––––
––––
––––
––––
––––
––––
––––
––––
––––
––––
––––
––––
––––
––––
––––
––––
––––
––––
––––
––––
––––
–*
sign
ifica
nt a
t p ≤0
.05
**si
gnifi
cant
at p
≤0.0
1**
*si
gnifi
cant
at p
≤0.
001

384 New Zealand Journal of Forestry Science 32(3)
TA
BLE
A3–
ME
AN
WO
OD
PR
OP
ER
TIE
S, L
OG
BY
LO
G, F
OR
EA
CH
SIT
E––
––––
––––
––––
––––
––––
––––
––––
––––
––––
––––
––––
––––
––––
––––
––––
––––
––––
––––
––––
––––
––––
––––
––––
––––
––––
––––
––––
––––
––––
––––
–Lo
gS
iteN
o.V
olum
eB
ark
Hea
rt-
Moi
stur
eD
ensi
ty (
kg/m3 )
Rot
of(m
3 )th
ickn
ess
woo
dco
nten
t--
----
----
----
----
----
----
tree
s(m
m)
(%)
(%)
Gre
enB
asic
––––
––––
––––
––––
––––
––––
––––
––––
––––
––––
––––
––––
––––
––––
––––
––––
––––
––––
––––
––––
––––
––––
––––
––––
––––
––––
––––
––––
––––
––––
–––
But
tM
anga
kahi
a15
0.19
09.
860
a13
5 bc
1091
a46
5 a
0.62
aR
awek
a16
0.19
98.
360
a16
0 a
1078
a41
7 b
0.75
aK
inle
ith15
0.15
79.
955
ab
144
ab10
71 a
441
ab0.
53 a
Wai
nui
150.
166
9.7
50 b
122
c10
16 b
459
a0.
03 a
Mill
ers
Fla
t16
0.13
47.
939
c13
2 bc
1031
b44
8 ab
3.70
bD
rum
fern
150.
156
8.9
51 b
131
bc10
12 b
441
ab0.
42 a
AN
OV
A F
for
Site
s2.
22.
8*28
.2**
*9.
5***
23.6
***
3.2*
9.9*
**
Sec
ond
Man
gaka
hia
150.
110
ab5.
5 a
51 a
b12
2 bc
1063
a48
0 a
0.18
ab
Raw
eka
160.
135
a4.
9 ab
54 a
149
a10
59 a
428
b0.
02 a
Kin
leith
140.
093
ab4.
9 ab
46 b
133
ab10
35 a
447
ab1.
41 b
Wai
nui
150.
099
ab5.
4 a
38 c
114
c 9
71 b
456
ab0.
00 a
Mill
ers
Fla
t16
0.06
4 b
4.6
ab19
d11
9 bc
1042
a48
0 a
0.00
aD
rum
fern
150.
080
b4.
1 b
34 c
112
c 9
62 b
456
ab0.
00 a
AN
OV
A F
for
Site
s4.
7***
3.3*
52.3
***
10.5
***
27.1
***
4.2*
*2.
6*
Thi
rdM
anga
kahi
a13
0.06
45.
4 a
33 a
112
bc10
85 a
514
ab0.
00R
awek
a16
0.08
44.
2 ab
37 a
139
a10
66 a
448
c0.
03K
inle
ith 9
0.06
84.
3 ab
37 a
127
ab10
34 a
457
c3.
20W
ainu
i14
0.05
04.
3 ab
15 b
111
bc 9
72 b
462
bc0.
00M
iller
s F
lat
30.
040
4.1
1710
110
5653
00.
00D
rum
fern
80.
043
4.0
b18
b 9
7 c
948
b48
2 ab
c0.
00A
NO
VA
Ffo
r S
ites
2.3
3.7*
*19
.2**
*12
.8**
*29
.2**
*6.
9***
1.3
––––
––––
––––
––––
––––
––––
––––
––––
––––
––––
––––
––––
––––
––––
––––
––––
––––
––––
––––
––––
––––
––––
––––
––––
––––
––––
––––
––––
––––
––––
–––
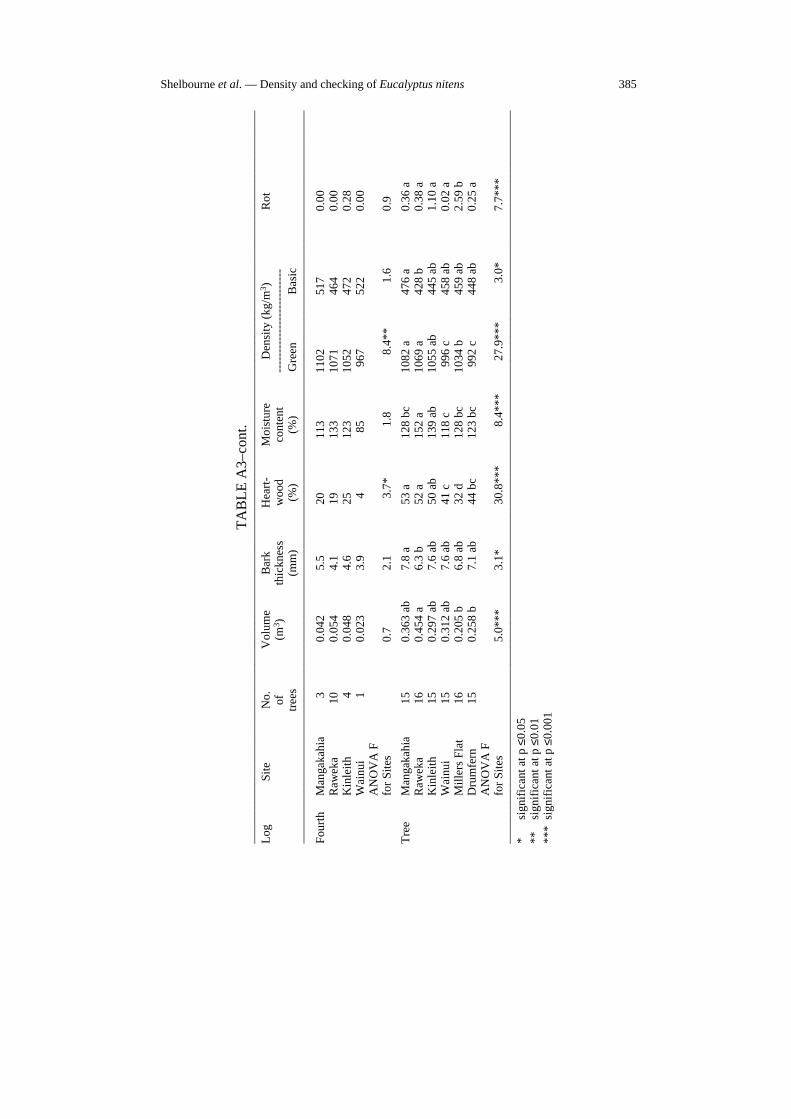
Shelbourne et al. — Density and checking of Eucalyptus nitens 385
TA
BLE
A3–
cont
.––
––––
––––
––––
––––
––––
––––
––––
––––
––––
––––
––––
––––
––––
––––
––––
––––
––––
––––
––––
––––
––––
––––
––––
––––
––––
––––
––––
––––
––––
––––
–Lo
gS
iteN
o.V
olum
eB
ark
Hea
rt-
Moi
stur
eD
ensi
ty (
kg/m3 )
Rot
of(m
3 )th
ickn
ess
woo
dco
nten
t--
----
----
----
----
----
----
tree
s(m
m)
(%)
(%)
Gre
enB
asic
––––
––––
––––
––––
––––
––––
––––
––––
––––
––––
––––
––––
––––
––––
––––
––––
––––
––––
––––
––––
––––
––––
––––
––––
––––
––––
––––
––––
––––
––––
–––
Fou
rth
Man
gaka
hia
30.
042
5.5
2011
311
0251
70.
00R
awek
a10
0.05
44.
119
133
1071
464
0.00
Kin
leith
40.
048
4.6
2512
310
5247
20.
28W
ainu
i 1
0.02
33.
9 4
85
967
522
0.00
AN
OV
A F
for
Site
s0.
72.
13.
7*1.
88.
4**
1.6
0.9
Tre
eM
anga
kahi
a15
0.36
3 ab
7.8
a53
a12
8 bc
1082
a47
6 a
0.36
aR
awek
a16
0.45
4 a
6.3
b52
a15
2 a
1069
a42
8 b
0.38
aK
inle
ith15
0.29
7 ab
7.6
ab50
ab
139
ab10
55 a
b44
5 ab
1.10
aW
ainu
i15
0.31
2 ab
7.6
ab41
c11
8 c
996
c45
8 ab
0.02
aM
iller
s F
lat
160.
205
b6.
8 ab
32 d
128
bc10
34 b
459
ab2.
59 b
Dru
mfe
rn15
0.25
8 b
7.1
ab44
bc
123
bc 9
92 c
448
ab0.
25 a
AN
OV
A F
for
Site
s5.
0***
3.1*
30.8
***
8.4*
**27
.9**
*3.
0*7.
7***
––––
––––
––––
––––
––––
––––
––––
––––
––––
––––
––––
––––
––––
––––
––––
––––
––––
––––
––––
––––
––––
––––
––––
––––
––––
––––
––––
––––
––––
––––
–––
*si
gnifi
cant
at p
≤0.0
5**
sign
ifica
nt a
t p ≤0
.01
***
sign
ifica
nt a
t p ≤
0.00
1