Embed Size (px)
Citation preview
1 | P a g e
WOODSIDE HIGH SCHOOL SELF EVALUATION SUMMARY 2016-17 WE AIM TO: BRING EQUALITY OF EDUCATIONAL EXPERIENCE TO EVERY STUDENT IN ORDER TO MAXIMISE OUTCOMES FOR ALL.
CONTENTS: CONTEXT 2015/16 AND SUMMARY LEADERSHIP & MANAGEMENT OUTCOMES FOR PUPILS QUALITY FIRST TEACHING & ASSESSMENT BEHAVIOUR FOR LEARNING, PERSONAL
DEVELOPMENT & WELFARE ENVIRONMENT & RESOURCES
2 | P a g e
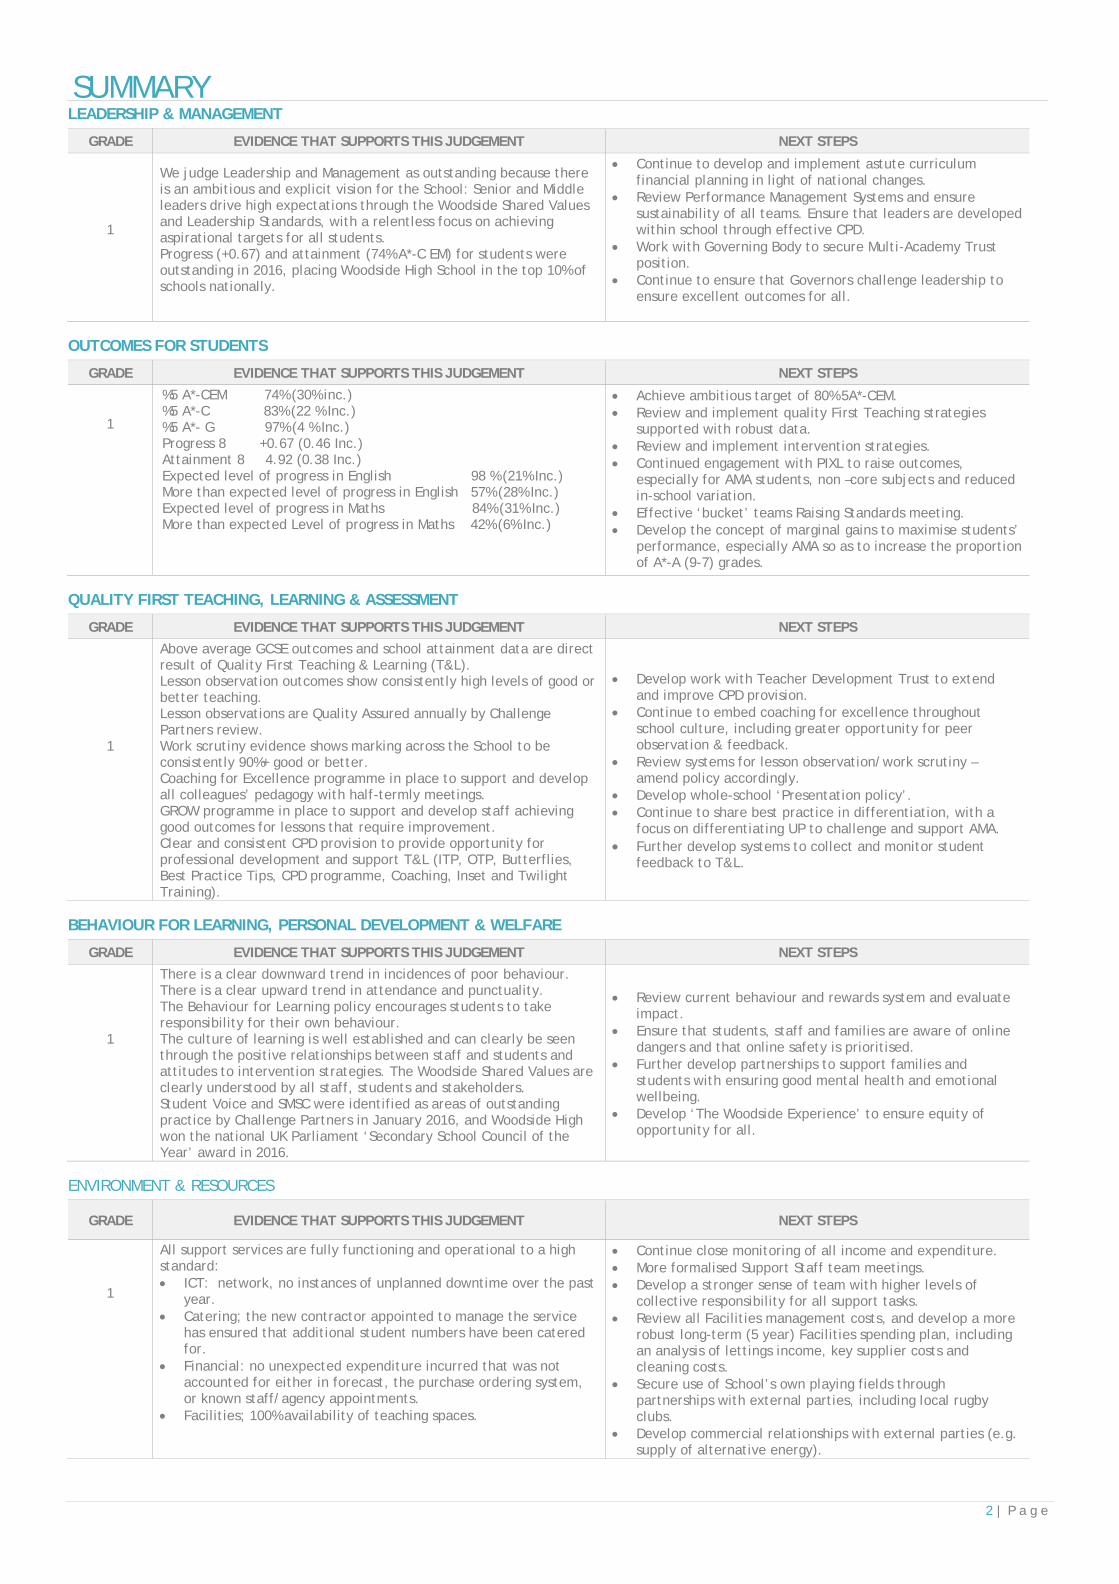
SUMMARY LEADERSHIP & MANAGEMENT
GRADE EVIDENCE THAT SUPPORTS THIS JUDGEMENT NEXT STEPS
1
We judge Leadership and Management as outstanding because there is an ambitious and explicit vision for the School: Senior and Middle leaders drive high expectations through the Woodside Shared Values and Leadership Standards, with a relentless focus on achieving aspirational targets for all students. Progress (+0.67) and attainment (74% A*-C EM) for students were outstanding in 2016, placing Woodside High School in the top 10% of schools nationally.
Continue to develop and implement astute curriculum financial planning in light of national changes.
Review Performance Management Systems and ensure sustainability of all teams. Ensure that leaders are developed within school through effective CPD.
Work with Governing Body to secure Multi-Academy Trust position.
Continue to ensure that Governors challenge leadership to ensure excellent outcomes for all.
OUTCOMES FOR STUDENTS
GRADE EVIDENCE THAT SUPPORTS THIS JUDGEMENT NEXT STEPS
1
%5 A*-CEM 74% (30% inc.) %5 A*-C 83% (22 % Inc.) %5 A*- G 97% (4 % Inc.) Progress 8 +0.67 (0.46 Inc.) Attainment 8 4.92 (0.38 Inc.) Expected level of progress in English 98 % (21% Inc.) More than expected level of progress in English 57% (28% Inc.) Expected level of progress in Maths 84% (31% Inc.) More than expected Level of progress in Maths 42% (6% Inc.)
Achieve ambitious target of 80% 5A*-CEM. Review and implement quality First Teaching strategies
supported with robust data. Review and implement intervention strategies. Continued engagement with PIXL to raise outcomes,
especially for AMA students, non –core subjects and reduced in-school variation.
Effective ‘bucket’ teams Raising Standards meeting. Develop the concept of marginal gains to maximise students’
performance, especially AMA so as to increase the proportion of A*-A (9-7) grades.
QUALITY FIRST TEACHING, LEARNING & ASSESSMENT
GRADE EVIDENCE THAT SUPPORTS THIS JUDGEMENT NEXT STEPS
1
Above average GCSE outcomes and school attainment data are direct result of Quality First Teaching & Learning (T&L). Lesson observation outcomes show consistently high levels of good or better teaching. Lesson observations are Quality Assured annually by Challenge Partners review. Work scrutiny evidence shows marking across the School to be consistently 90%+ good or better. Coaching for Excellence programme in place to support and develop all colleagues’ pedagogy with half-termly meetings. GROW programme in place to support and develop staff achieving good outcomes for lessons that require improvement. Clear and consistent CPD provision to provide opportunity for professional development and support T&L (ITP, OTP, Butterflies, Best Practice Tips, CPD programme, Coaching, Inset and Twilight Training).
Develop work with Teacher Development Trust to extend and improve CPD provision.
Continue to embed coaching for excellence throughout school culture, including greater opportunity for peer observation & feedback.
Review systems for lesson observation/work scrutiny – amend policy accordingly.
Develop whole-school ‘Presentation policy’. Continue to share best practice in differentiation, with a
focus on differentiating UP to challenge and support AMA. Further develop systems to collect and monitor student
feedback to T&L.
BEHAVIOUR FOR LEARNING, PERSONAL DEVELOPMENT & WELFARE
GRADE EVIDENCE THAT SUPPORTS THIS JUDGEMENT NEXT STEPS
1
There is a clear downward trend in incidences of poor behaviour. There is a clear upward trend in attendance and punctuality. The Behaviour for Learning policy encourages students to take responsibility for their own behaviour. The culture of learning is well established and can clearly be seen through the positive relationships between staff and students and attitudes to intervention strategies. The Woodside Shared Values are clearly understood by all staff, students and stakeholders. Student Voice and SMSC were identified as areas of outstanding practice by Challenge Partners in January 2016, and Woodside High won the national UK Parliament ‘Secondary School Council of the Year’ award in 2016.
Review current behaviour and rewards system and evaluate impact.
Ensure that students, staff and families are aware of online dangers and that online safety is prioritised.
Further develop partnerships to support families and students with ensuring good mental health and emotional wellbeing.
Develop ‘The Woodside Experience’ to ensure equity of opportunity for all.
ENVIRONMENT & RESOURCES
GRADE EVIDENCE THAT SUPPORTS THIS JUDGEMENT NEXT STEPS
1
All support services are fully functioning and operational to a high standard: ICT: network, no instances of unplanned downtime over the past
year. Catering; the new contractor appointed to manage the service
has ensured that additional student numbers have been catered for.
Financial: no unexpected expenditure incurred that was not accounted for either in forecast, the purchase ordering system, or known staff/agency appointments.
Facilities; 100% availability of teaching spaces.
Continue close monitoring of all income and expenditure. More formalised Support Staff team meetings. Develop a stronger sense of team with higher levels of
collective responsibility for all support tasks. Review all Facilities management costs, and develop a more
robust long-term (5 year) Facilities spending plan, including an analysis of lettings income, key supplier costs and cleaning costs.
Secure use of School’s own playing fields through partnerships with external parties, including local rugby clubs.
Develop commercial relationships with external parties (e.g. supply of alternative energy).
3 | P a g e
SUMMARY REPORT FOR STAKEHOLDERS & STRATEGIC PARTNERS
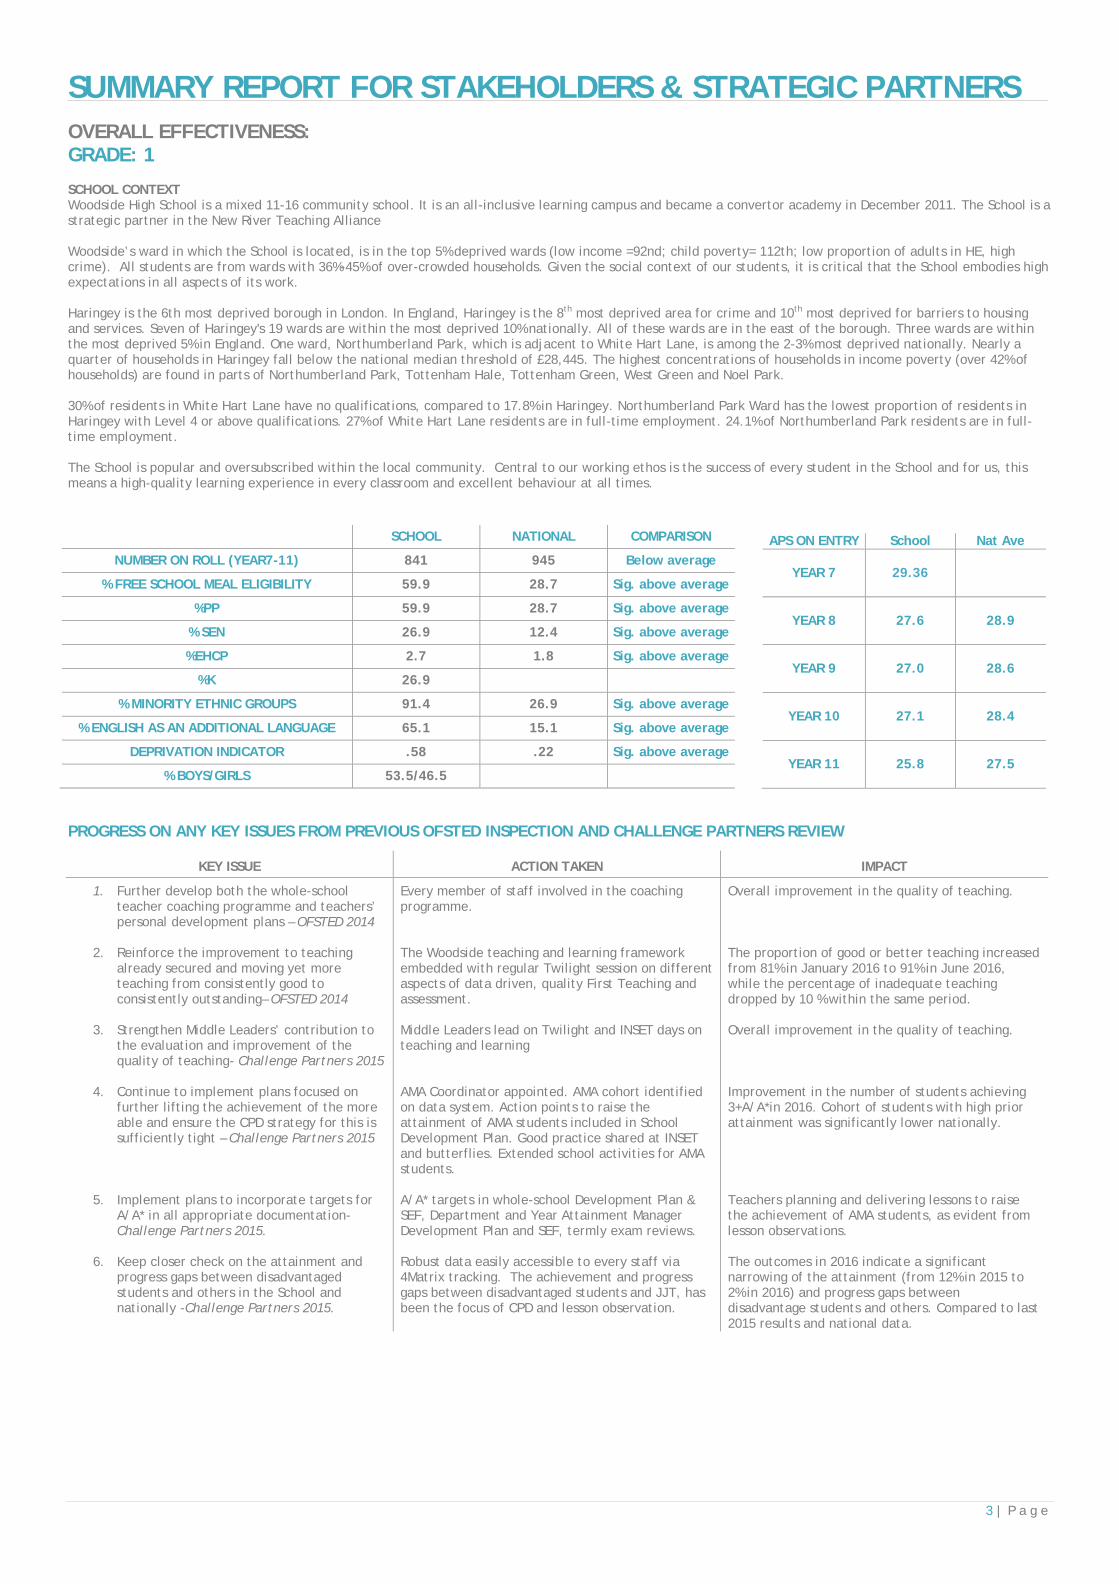
OVERALL EFFECTIVENESS: GRADE: 1 SCHOOL CONTEXT Woodside High School is a mixed 11-16 community school. It is an all-inclusive learning campus and became a convertor academy in December 2011. The School is a strategic partner in the New River Teaching Alliance Woodside’s ward in which the School is located, is in the top 5% deprived wards (low income =92nd; child poverty= 112th; low proportion of adults in HE, high crime). All students are from wards with 36%-45% of over-crowded households. Given the social context of our students, it is critical that the School embodies high expectations in all aspects of its work. Haringey is the 6th most deprived borough in London. In England, Haringey is the 8th most deprived area for crime and 10th most deprived for barriers to housing and services. Seven of Haringey's 19 wards are within the most deprived 10% nationally. All of these wards are in the east of the borough. Three wards are within the most deprived 5% in England. One ward, Northumberland Park, which is adjacent to White Hart Lane, is among the 2-3% most deprived nationally. Nearly a quarter of households in Haringey fall below the national median threshold of £28,445. The highest concentrations of households in income poverty (over 42% of households) are found in parts of Northumberland Park, Tottenham Hale, Tottenham Green, West Green and Noel Park. 30% of residents in White Hart Lane have no qualifications, compared to 17.8% in Haringey. Northumberland Park Ward has the lowest proportion of residents in Haringey with Level 4 or above qualifications. 27% of White Hart Lane residents are in full-time employment. 24.1% of Northumberland Park residents are in full-time employment. The School is popular and oversubscribed within the local community. Central to our working ethos is the success of every student in the School and for us, this means a high-quality learning experience in every classroom and excellent behaviour at all times.
SCHOOL NATIONAL COMPARISON
NUMBER ON ROLL (YEAR7-11) 841 945 Below average
% FREE SCHOOL MEAL ELIGIBILITY 59.9 28.7 Sig. above average
%PP 59.9 28.7 Sig. above average
% SEN 26.9 12.4 Sig. above average
%EHCP 2.7 1.8 Sig. above average
%K 26.9
% MINORITY ETHNIC GROUPS 91.4 26.9 Sig. above average
% ENGLISH AS AN ADDITIONAL LANGUAGE 65.1 15.1 Sig. above average
DEPRIVATION INDICATOR .58 .22 Sig. above average
% BOYS/GIRLS 53.5/46.5
PROGRESS ON ANY KEY ISSUES FROM PREVIOUS OFSTED INSPECTION AND CHALLENGE PARTNERS REVIEW
KEY ISSUE ACTION TAKEN IMPACT
1. Further develop both the whole-school teacher coaching programme and teachers’ personal development plans – OFSTED 2014
2. Reinforce the improvement to teaching already secured and moving yet more teaching from consistently good to consistently outstanding– OFSTED 2014
3. Strengthen Middle Leaders’ contribution to
the evaluation and improvement of the quality of teaching- Challenge Partners 2015
4. Continue to implement plans focused on
further lifting the achievement of the more able and ensure the CPD strategy for this is sufficiently tight – Challenge Partners 2015
5. Implement plans to incorporate targets for A/A* in all appropriate documentation- Challenge Partners 2015.
6. Keep closer check on the attainment and progress gaps between disadvantaged students and others in the School and nationally -Challenge Partners 2015.
Every member of staff involved in the coaching programme. The Woodside teaching and learning framework embedded with regular Twilight session on different aspects of data driven, quality First Teaching and assessment. Middle Leaders lead on Twilight and INSET days on teaching and learning AMA Coordinator appointed. AMA cohort identified on data system. Action points to raise the attainment of AMA students included in School Development Plan. Good practice shared at INSET and butterflies. Extended school activities for AMA students. A/A* targets in whole-school Development Plan & SEF, Department and Year Attainment Manager Development Plan and SEF, termly exam reviews. Robust data easily accessible to every staff via 4Matrix tracking. The achievement and progress gaps between disadvantaged students and JJT, has been the focus of CPD and lesson observation.
Overall improvement in the quality of teaching. The proportion of good or better teaching increased from 81% in January 2016 to 91% in June 2016, while the percentage of inadequate teaching dropped by 10 % within the same period. Overall improvement in the quality of teaching. Improvement in the number of students achieving 3+A/A*in 2016. Cohort of students with high prior attainment was significantly lower nationally. Teachers planning and delivering lessons to raise the achievement of AMA students, as evident from lesson observations. The outcomes in 2016 indicate a significant narrowing of the attainment (from 12% in 2015 to 2% in 2016) and progress gaps between disadvantage students and others. Compared to last 2015 results and national data.
APS ON ENTRY School Nat Ave
YEAR 7 29.36
YEAR 8 27.6 28.9
YEAR 9 27.0 28.6
YEAR 10 27.1 28.4
YEAR 11 25.8 27.5
4 | P a g e
EFFECTIVENESS OF LEADERSHIP & MANAGEMENT: GRADE: 1
IMPACT ON OUTCOMES & SCHOOL IMPROVEMENT
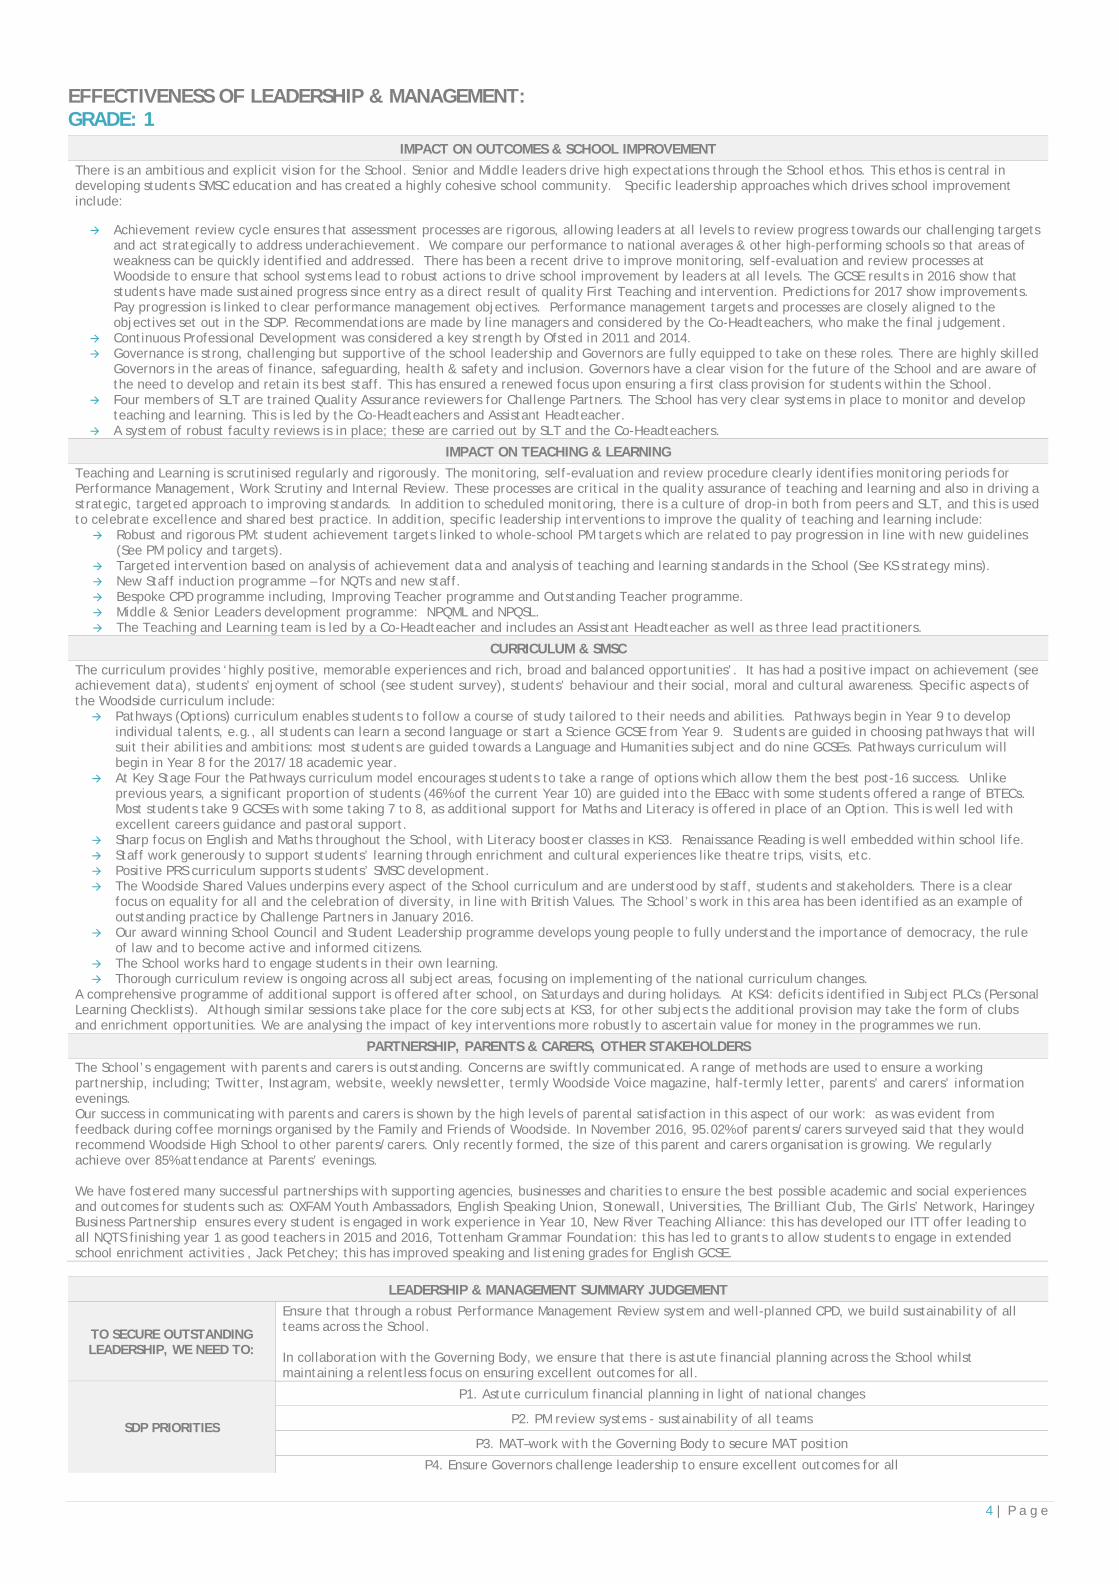
There is an ambitious and explicit vision for the School. Senior and Middle leaders drive high expectations through the School ethos. This ethos is central in developing students SMSC education and has created a highly cohesive school community. Specific leadership approaches which drives school improvement include:
Achievement review cycle ensures that assessment processes are rigorous, allowing leaders at all levels to review progress towards our challenging targets and act strategically to address underachievement. We compare our performance to national averages & other high-performing schools so that areas of weakness can be quickly identified and addressed. There has been a recent drive to improve monitoring, self-evaluation and review processes at Woodside to ensure that school systems lead to robust actions to drive school improvement by leaders at all levels. The GCSE results in 2016 show that students have made sustained progress since entry as a direct result of quality First Teaching and intervention. Predictions for 2017 show improvements. Pay progression is linked to clear performance management objectives. Performance management targets and processes are closely aligned to the objectives set out in the SDP. Recommendations are made by line managers and considered by the Co-Headteachers, who make the final judgement.
Continuous Professional Development was considered a key strength by Ofsted in 2011 and 2014. Governance is strong, challenging but supportive of the school leadership and Governors are fully equipped to take on these roles. There are highly skilled
Governors in the areas of finance, safeguarding, health & safety and inclusion. Governors have a clear vision for the future of the School and are aware of the need to develop and retain its best staff. This has ensured a renewed focus upon ensuring a first class provision for students within the School.
Four members of SLT are trained Quality Assurance reviewers for Challenge Partners. The School has very clear systems in place to monitor and develop teaching and learning. This is led by the Co-Headteachers and Assistant Headteacher.
A system of robust faculty reviews is in place; these are carried out by SLT and the Co-Headteachers.
IMPACT ON TEACHING & LEARNING
Teaching and Learning is scrutinised regularly and rigorously. The monitoring, self-evaluation and review procedure clearly identifies monitoring periods for Performance Management, Work Scrutiny and Internal Review. These processes are critical in the quality assurance of teaching and learning and also in driving a strategic, targeted approach to improving standards. In addition to scheduled monitoring, there is a culture of drop-in both from peers and SLT, and this is used to celebrate excellence and shared best practice. In addition, specific leadership interventions to improve the quality of teaching and learning include: Robust and rigorous PM: student achievement targets linked to whole-school PM targets which are related to pay progression in line with new guidelines
(See PM policy and targets). Targeted intervention based on analysis of achievement data and analysis of teaching and learning standards in the School (See KS strategy mins). New Staff induction programme – for NQTs and new staff. Bespoke CPD programme including, Improving Teacher programme and Outstanding Teacher programme. Middle & Senior Leaders development programme: NPQML and NPQSL. The Teaching and Learning team is led by a Co-Headteacher and includes an Assistant Headteacher as well as three lead practitioners.
CURRICULUM & SMSC
The curriculum provides ‘highly positive, memorable experiences and rich, broad and balanced opportunities’. It has had a positive impact on achievement (see achievement data), students’ enjoyment of school (see student survey), students’ behaviour and their social, moral and cultural awareness. Specific aspects of the Woodside curriculum include: Pathways (Options) curriculum enables students to follow a course of study tailored to their needs and abilities. Pathways begin in Year 9 to develop
individual talents, e.g., all students can learn a second language or start a Science GCSE from Year 9. Students are guided in choosing pathways that will suit their abilities and ambitions: most students are guided towards a Language and Humanities subject and do nine GCSEs. Pathways curriculum will begin in Year 8 for the 2017/18 academic year.
At Key Stage Four the Pathways curriculum model encourages students to take a range of options which allow them the best post-16 success. Unlike previous years, a significant proportion of students (46% of the current Year 10) are guided into the EBacc with some students offered a range of BTECs. Most students take 9 GCSEs with some taking 7 to 8, as additional support for Maths and Literacy is offered in place of an Option. This is well led with excellent careers guidance and pastoral support.
Sharp focus on English and Maths throughout the School, with Literacy booster classes in KS3. Renaissance Reading is well embedded within school life. Staff work generously to support students’ learning through enrichment and cultural experiences like theatre trips, visits, etc. Positive PRS curriculum supports students’ SMSC development. The Woodside Shared Values underpins every aspect of the School curriculum and are understood by staff, students and stakeholders. There is a clear
focus on equality for all and the celebration of diversity, in line with British Values. The School’s work in this area has been identified as an example of outstanding practice by Challenge Partners in January 2016.
Our award winning School Council and Student Leadership programme develops young people to fully understand the importance of democracy, the rule of law and to become active and informed citizens.
The School works hard to engage students in their own learning. Thorough curriculum review is ongoing across all subject areas, focusing on implementing of the national curriculum changes.
A comprehensive programme of additional support is offered after school, on Saturdays and during holidays. At KS4: deficits identified in Subject PLCs (Personal Learning Checklists). Although similar sessions take place for the core subjects at KS3, for other subjects the additional provision may take the form of clubs and enrichment opportunities. We are analysing the impact of key interventions more robustly to ascertain value for money in the programmes we run.
PARTNERSHIP, PARENTS & CARERS, OTHER STAKEHOLDERS
The School’s engagement with parents and carers is outstanding. Concerns are swiftly communicated. A range of methods are used to ensure a working partnership, including; Twitter, Instagram, website, weekly newsletter, termly Woodside Voice magazine, half-termly letter, parents’ and carers’ information evenings. Our success in communicating with parents and carers is shown by the high levels of parental satisfaction in this aspect of our work: as was evident from feedback during coffee mornings organised by the Family and Friends of Woodside. In November 2016, 95.02% of parents/carers surveyed said that they would recommend Woodside High School to other parents/carers. Only recently formed, the size of this parent and carers organisation is growing. We regularly achieve over 85% attendance at Parents’ evenings. We have fostered many successful partnerships with supporting agencies, businesses and charities to ensure the best possible academic and social experiences and outcomes for students such as: OXFAM Youth Ambassadors, English Speaking Union, Stonewall, Universities, The Brilliant Club, The Girls’ Network, Haringey Business Partnership ensures every student is engaged in work experience in Year 10, New River Teaching Alliance: this has developed our ITT offer leading to all NQTS finishing year 1 as good teachers in 2015 and 2016, Tottenham Grammar Foundation: this has led to grants to allow students to engage in extended school enrichment activities , Jack Petchey; this has improved speaking and listening grades for English GCSE.
LEADERSHIP & MANAGEMENT SUMMARY JUDGEMENT
TO SECURE OUTSTANDING LEADERSHIP, WE NEED TO:
Ensure that through a robust Performance Management Review system and well-planned CPD, we build sustainability of all teams across the School. In collaboration with the Governing Body, we ensure that there is astute financial planning across the School whilst maintaining a relentless focus on ensuring excellent outcomes for all.
SDP PRIORITIES
P1. Astute curriculum financial planning in light of national changes
P2. PM review systems - sustainability of all teams
P3. MAT–work with the Governing Body to secure MAT position
P4. Ensure Governors challenge leadership to ensure excellent outcomes for all
5 | P a g e
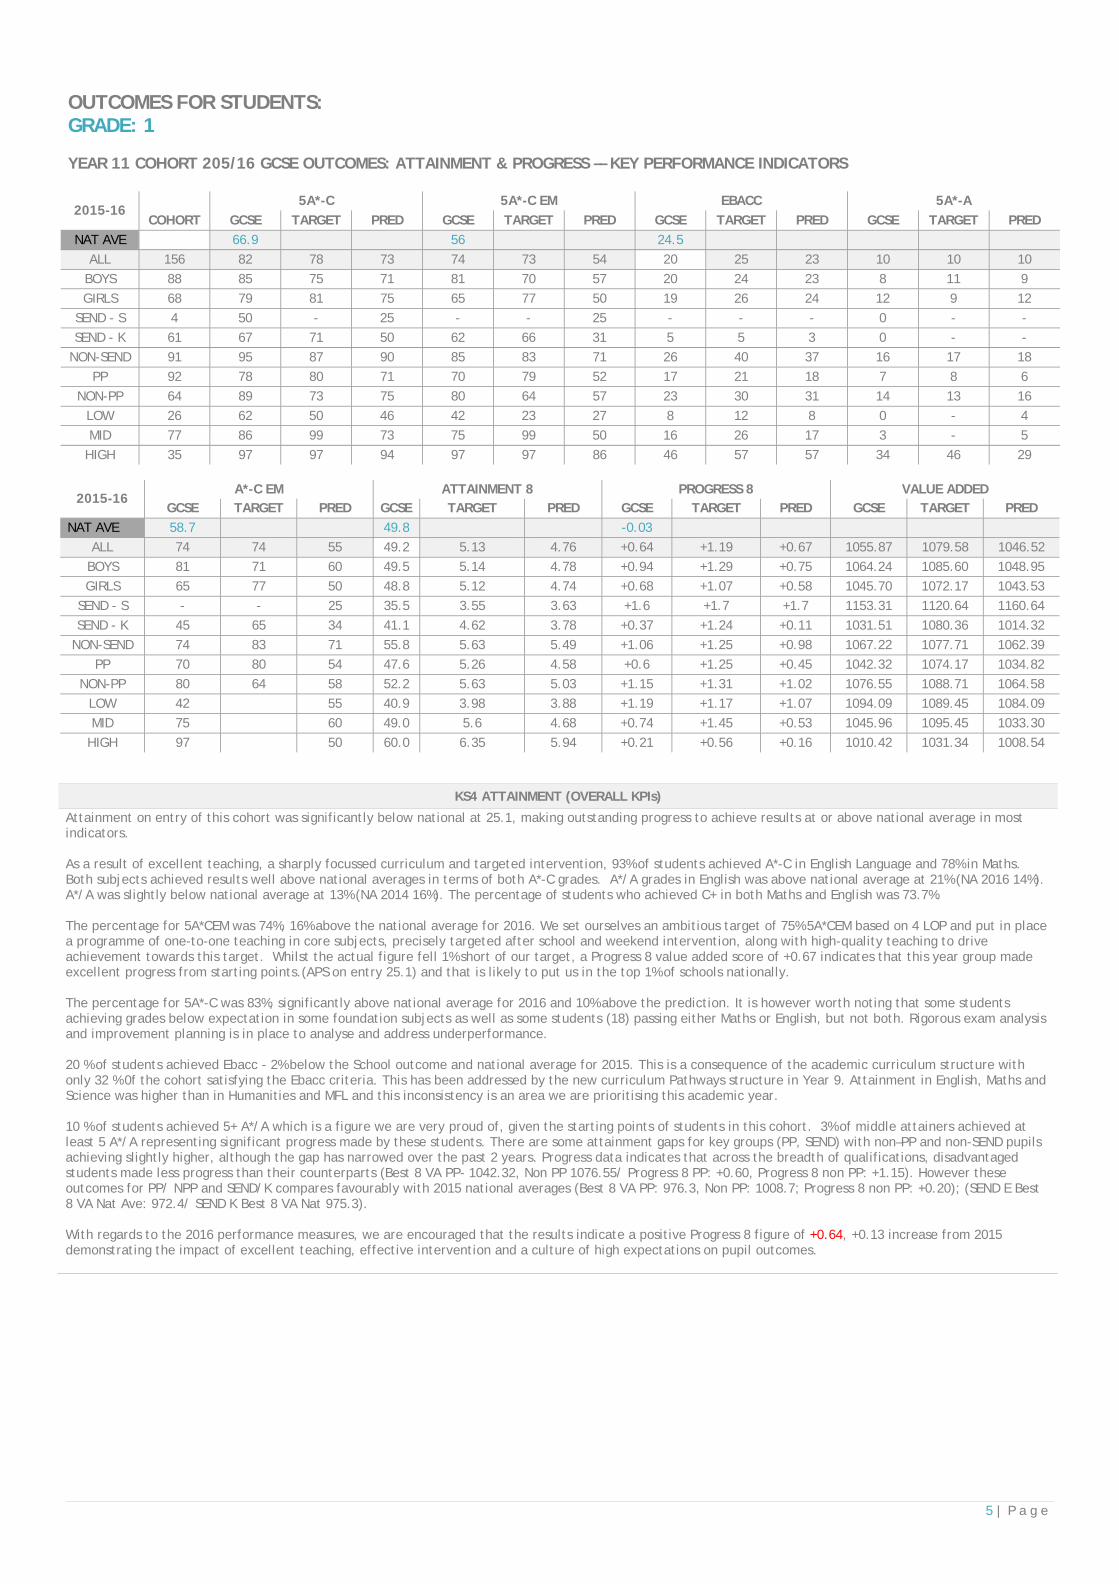
OUTCOMES FOR STUDENTS: GRADE: 1 YEAR 11 COHORT 205/16 GCSE OUTCOMES: ATTAINMENT & PROGRESS –– KEY PERFORMANCE INDICATORS
2015-16 5A*-C 5A*-C EM EBACC 5A*-A
COHORT GCSE TARGET PRED GCSE TARGET PRED GCSE TARGET PRED GCSE TARGET PRED
NAT AVE 66.9 56 24.5 ALL 156 82 78 73 74 73 54 20 25 23 10 10 10
BOYS 88 85 75 71 81 70 57 20 24 23 8 11 9
GIRLS 68 79 81 75 65 77 50 19 26 24 12 9 12
SEND - S 4 50 - 25 - - 25 - - - 0 - -
SEND - K 61 67 71 50 62 66 31 5 5 3 0 - -
NON-SEND 91 95 87 90 85 83 71 26 40 37 16 17 18
PP 92 78 80 71 70 79 52 17 21 18 7 8 6
NON-PP 64 89 73 75 80 64 57 23 30 31 14 13 16
LOW 26 62 50 46 42 23 27 8 12 8 0 - 4
MID 77 86 99 73 75 99 50 16 26 17 3 - 5
HIGH 35 97 97 94 97 97 86 46 57 57 34 46 29
2015-16 A*-C EM ATTAINMENT 8 PROGRESS 8 VALUE ADDED
GCSE TARGET PRED GCSE TARGET PRED GCSE TARGET PRED GCSE TARGET PRED
NAT AVE 58.7
49.8
-0.03
ALL 74 74 55 49.2 5.13 4.76 +0.64 +1.19 +0.67 1055.87 1079.58 1046.52
BOYS 81 71 60 49.5 5.14 4.78 +0.94 +1.29 +0.75 1064.24 1085.60 1048.95
GIRLS 65 77 50 48.8 5.12 4.74 +0.68 +1.07 +0.58 1045.70 1072.17 1043.53
SEND - S - - 25 35.5 3.55 3.63 +1.6 +1.7 +1.7 1153.31 1120.64 1160.64
SEND - K 45 65 34 41.1 4.62 3.78 +0.37 +1.24 +0.11 1031.51 1080.36 1014.32
NON-SEND 74 83 71 55.8 5.63 5.49 +1.06 +1.25 +0.98 1067.22 1077.71 1062.39
PP 70 80 54 47.6 5.26 4.58 +0.6 +1.25 +0.45 1042.32 1074.17 1034.82
NON-PP 80 64 58 52.2 5.63 5.03 +1.15 +1.31 +1.02 1076.55 1088.71 1064.58
LOW 42 55 40.9 3.98 3.88 +1.19 +1.17 +1.07 1094.09 1089.45 1084.09
MID 75 60 49.0 5.6 4.68 +0.74 +1.45 +0.53 1045.96 1095.45 1033.30
HIGH 97 50 60.0 6.35 5.94 +0.21 +0.56 +0.16 1010.42 1031.34 1008.54
KS4 ATTAINMENT (OVERALL KPIs)
Attainment on entry of this cohort was significantly below national at 25.1, making outstanding progress to achieve results at or above national average in most indicators. As a result of excellent teaching, a sharply focussed curriculum and targeted intervention, 93% of students achieved A*-C in English Language and 78% in Maths. Both subjects achieved results well above national averages in terms of both A*-C grades. A*/A grades in English was above national average at 21% (NA 2016 14%). A*/A was slightly below national average at 13% (NA 2014 16%). The percentage of students who achieved C+ in both Maths and English was 73.7%. The percentage for 5A*CEM was 74%, 16% above the national average for 2016. We set ourselves an ambitious target of 75% 5A*CEM based on 4 LOP and put in place a programme of one-to-one teaching in core subjects, precisely targeted after school and weekend intervention, along with high-quality teaching to drive achievement towards this target. Whilst the actual figure fell 1% short of our target, a Progress 8 value added score of +0.67 indicates that this year group made excellent progress from starting points.(APS on entry 25.1) and that is likely to put us in the top 1% of schools nationally. The percentage for 5A*-C was 83%, significantly above national average for 2016 and 10% above the prediction. It is however worth noting that some students achieving grades below expectation in some foundation subjects as well as some students (18) passing either Maths or English, but not both. Rigorous exam analysis and improvement planning is in place to analyse and address underperformance. 20 % of students achieved Ebacc - 2% below the School outcome and national average for 2015. This is a consequence of the academic curriculum structure with only 32 % 0f the cohort satisfying the Ebacc criteria. This has been addressed by the new curriculum Pathways structure in Year 9. Attainment in English, Maths and Science was higher than in Humanities and MFL and this inconsistency is an area we are prioritising this academic year. 10 % of students achieved 5+ A*/A which is a figure we are very proud of, given the starting points of students in this cohort. 3% of middle attainers achieved at least 5 A*/A representing significant progress made by these students. There are some attainment gaps for key groups (PP, SEND) with non–PP and non-SEND pupils achieving slightly higher, although the gap has narrowed over the past 2 years. Progress data indicates that across the breadth of qualifications, disadvantaged students made less progress than their counterparts (Best 8 VA PP- 1042.32, Non PP 1076.55/ Progress 8 PP: +0.60, Progress 8 non PP: +1.15). However these outcomes for PP/ NPP and SEND/K compares favourably with 2015 national averages (Best 8 VA PP: 976.3, Non PP: 1008.7; Progress 8 non PP: +0.20); (SEND E Best 8 VA Nat Ave: 972.4/ SEND K Best 8 VA Nat 975.3). With regards to the 2016 performance measures, we are encouraged that the results indicate a positive Progress 8 figure of +0.64, +0.13 increase from 2015 demonstrating the impact of excellent teaching, effective intervention and a culture of high expectations on pupil outcomes.
6 | P a g e
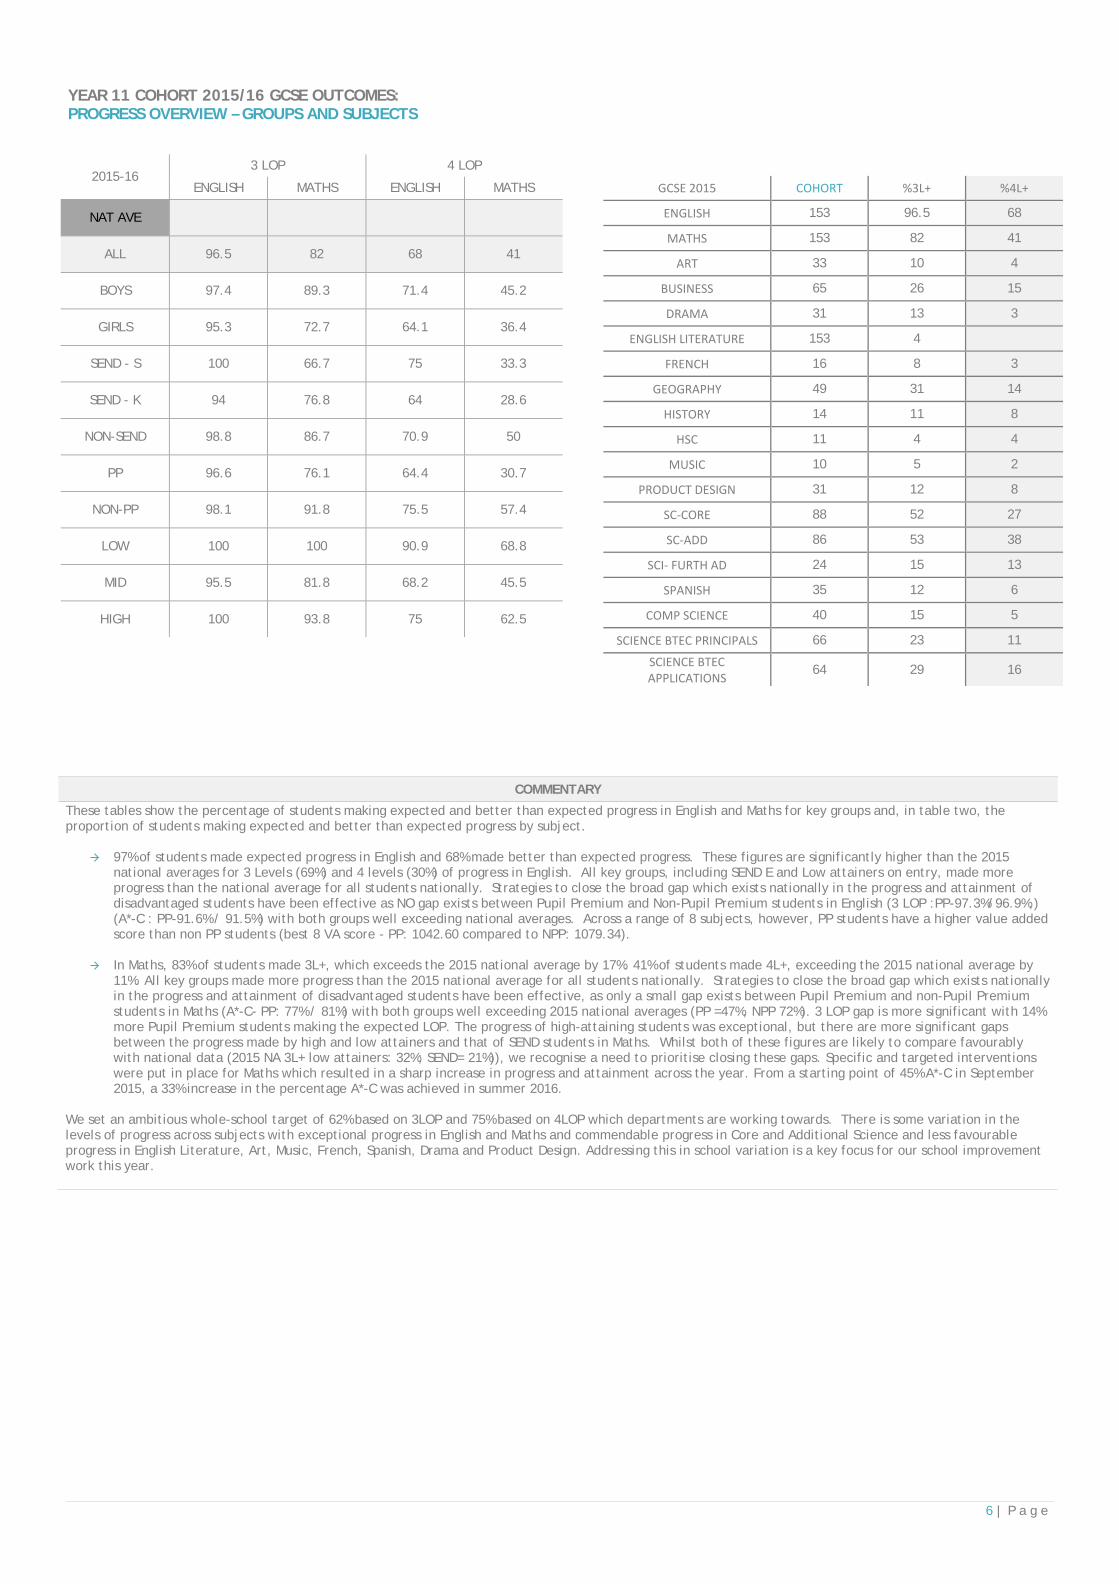
YEAR 11 COHORT 2015/16 GCSE OUTCOMES: PROGRESS OVERVIEW – GROUPS AND SUBJECTS
COMMENTARY
These tables show the percentage of students making expected and better than expected progress in English and Maths for key groups and, in table two, the proportion of students making expected and better than expected progress by subject.
97% of students made expected progress in English and 68% made better than expected progress. These figures are significantly higher than the 2015 national averages for 3 Levels (69%) and 4 levels (30%) of progress in English. All key groups, including SEND E and Low attainers on entry, made more progress than the national average for all students nationally. Strategies to close the broad gap which exists nationally in the progress and attainment of disadvantaged students have been effective as NO gap exists between Pupil Premium and Non-Pupil Premium students in English (3 LOP :PP-97.3%/96.9%,) (A*-C : PP-91.6% / 91.5%) with both groups well exceeding national averages. Across a range of 8 subjects, however, PP students have a higher value added score than non PP students (best 8 VA score - PP: 1042.60 compared to NPP: 1079.34).
In Maths, 83% of students made 3L+, which exceeds the 2015 national average by 17%. 41% of students made 4L+, exceeding the 2015 national average by 11%. All key groups made more progress than the 2015 national average for all students nationally. Strategies to close the broad gap which exists nationally in the progress and attainment of disadvantaged students have been effective, as only a small gap exists between Pupil Premium and non-Pupil Premium students in Maths (A*-C- PP: 77% / 81%) with both groups well exceeding 2015 national averages (PP =47%, NPP 72%). 3 LOP gap is more significant with 14% more Pupil Premium students making the expected LOP. The progress of high-attaining students was exceptional, but there are more significant gaps between the progress made by high and low attainers and that of SEND students in Maths. Whilst both of these figures are likely to compare favourably with national data (2015 NA 3L+ low attainers: 32%; SEND= 21%)), we recognise a need to prioritise closing these gaps. Specific and targeted interventions were put in place for Maths which resulted in a sharp increase in progress and attainment across the year. From a starting point of 45% A*-C in September 2015, a 33% increase in the percentage A*-C was achieved in summer 2016.
We set an ambitious whole-school target of 62% based on 3LOP and 75% based on 4LOP which departments are working towards. There is some variation in the levels of progress across subjects with exceptional progress in English and Maths and commendable progress in Core and Additional Science and less favourable progress in English Literature, Art, Music, French, Spanish, Drama and Product Design. Addressing this in school variation is a key focus for our school improvement work this year.
2015-16 3 LOP 4 LOP
ENGLISH MATHS ENGLISH MATHS
NAT AVE
ALL 96.5 82 68 41
BOYS 97.4 89.3 71.4 45.2
GIRLS 95.3 72.7 64.1 36.4
SEND - S 100 66.7 75 33.3
SEND - K 94 76.8 64 28.6
NON-SEND 98.8 86.7 70.9 50
PP 96.6 76.1 64.4 30.7
NON-PP 98.1 91.8 75.5 57.4
LOW 100 100 90.9 68.8
MID 95.5 81.8 68.2 45.5
HIGH 100 93.8 75 62.5
GCSE 2015 COHORT %3L+ %4L+
ENGLISH 153 96.5 68
MATHS 153 82 41
ART 33 10 4
BUSINESS 65 26 15
DRAMA 31 13 3
ENGLISH LITERATURE 153 4
FRENCH 16 8 3
GEOGRAPHY 49 31 14
HISTORY 14 11 8
HSC 11 4 4
MUSIC 10 5 2
PRODUCT DESIGN 31 12 8
SC‐CORE 88 52 27
SC‐ADD 86 53 38
SCI‐ FURTH AD 24 15 13
SPANISH 35 12 6
COMP SCIENCE 40 15 5
SCIENCE BTEC PRINCIPALS 66 23 11
SCIENCE BTEC APPLICATIONS
64 29 16
7 | P a g e
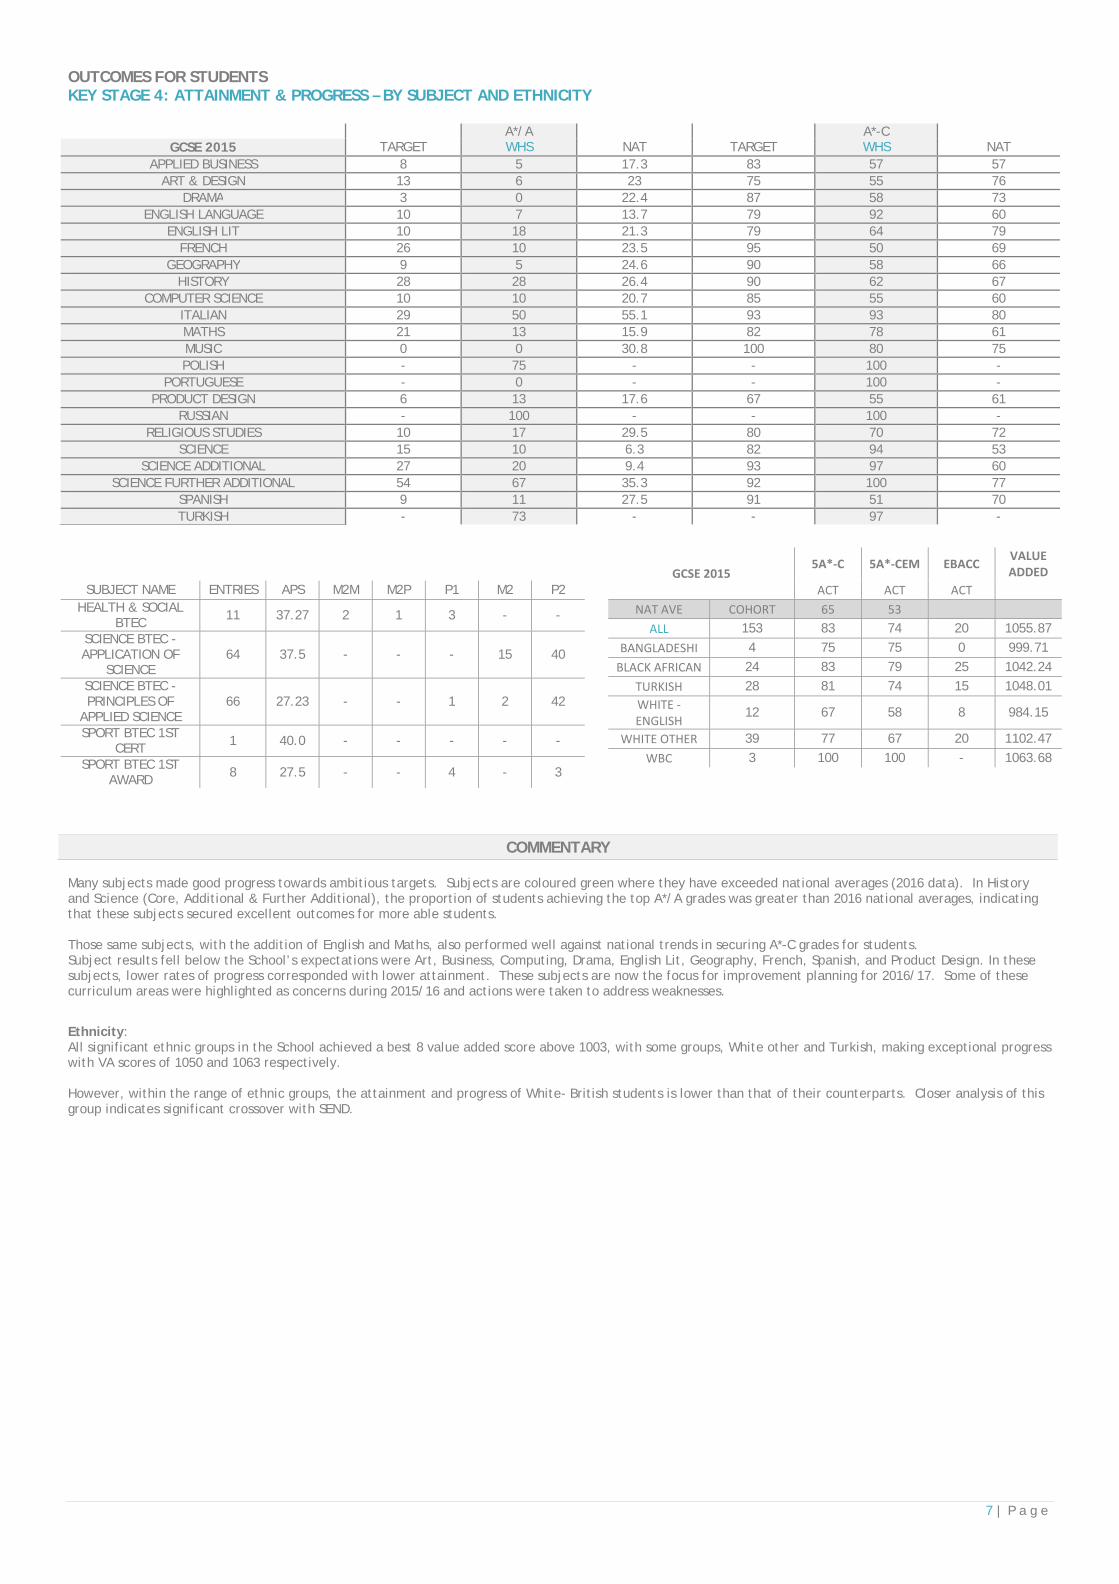
OUTCOMES FOR STUDENTS KEY STAGE 4: ATTAINMENT & PROGRESS – BY SUBJECT AND ETHNICITY
TARGET
A*/A WHS
NAT
TARGET
A*-C WHS
NAT GCSE 2015
APPLIED BUSINESS 8 5 17.3 83 57 57 ART & DESIGN 13 6 23 75 55 76
DRAMA 3 0 22.4 87 58 73 ENGLISH LANGUAGE 10 7 13.7 79 92 60
ENGLISH LIT 10 18 21.3 79 64 79 FRENCH 26 10 23.5 95 50 69
GEOGRAPHY 9 5 24.6 90 58 66 HISTORY 28 28 26.4 90 62 67
COMPUTER SCIENCE 10 10 20.7 85 55 60 ITALIAN 29 50 55.1 93 93 80 MATHS 21 13 15.9 82 78 61 MUSIC 0 0 30.8 100 80 75 POLISH - 75 - - 100 -
PORTUGUESE - 0 - - 100 - PRODUCT DESIGN 6 13 17.6 67 55 61
RUSSIAN - 100 - - 100 - RELIGIOUS STUDIES 10 17 29.5 80 70 72
SCIENCE 15 10 6.3 82 94 53 SCIENCE ADDITIONAL 27 20 9.4 93 97 60
SCIENCE FURTHER ADDITIONAL 54 67 35.3 92 100 77 SPANISH 9 11 27.5 91 51 70 TURKISH - 73 - - 97 -
SUBJECT NAME ENTRIES APS M2M M2P P1 M2 P2 HEALTH & SOCIAL
BTEC 11 37.27 2 1 3 - -
SCIENCE BTEC - APPLICATION OF
SCIENCE 64 37.5 - - - 15 40
SCIENCE BTEC - PRINCIPLES OF
APPLIED SCIENCE 66 27.23 - - 1 2 42
SPORT BTEC 1ST CERT 1 40.0 - - - - -
SPORT BTEC 1ST AWARD
8 27.5 - - 4 - 3
COMMENTARY Many subjects made good progress towards ambitious targets. Subjects are coloured green where they have exceeded national averages (2016 data). In History and Science (Core, Additional & Further Additional), the proportion of students achieving the top A*/A grades was greater than 2016 national averages, indicating that these subjects secured excellent outcomes for more able students. Those same subjects, with the addition of English and Maths, also performed well against national trends in securing A*-C grades for students. Subject results fell below the School’s expectations were Art, Business, Computing, Drama, English Lit, Geography, French, Spanish, and Product Design. In these subjects, lower rates of progress corresponded with lower attainment. These subjects are now the focus for improvement planning for 2016/17. Some of these curriculum areas were highlighted as concerns during 2015/16 and actions were taken to address weaknesses.
However, within the range of ethnic groups, the attainment and progress of White- British students is lower than that of their counterparts. Closer analysis of this group indicates significant crossover with SEND.
Ethnicity: All significant ethnic groups in the School achieved a best 8 value added score above 1003, with some groups, White other and Turkish, making exceptional progress with VA scores of 1050 and 1063 respectively.
GCSE 2015 5A*‐C 5A*‐CEM EBACC
VALUE ADDED
ACT ACT ACT
NAT AVE COHORT 65 53
ALL 153 83 74 20 1055.87
BANGLADESHI 4 75 75 0 999.71
BLACK AFRICAN 24 83 79 25 1042.24
TURKISH 28 81 74 15 1048.01 WHITE ‐ENGLISH
12 67 58 8 984.15
WHITE OTHER 39 77 67 20 1102.47
WBC 3 100 100 - 1063.68
8 | P a g e
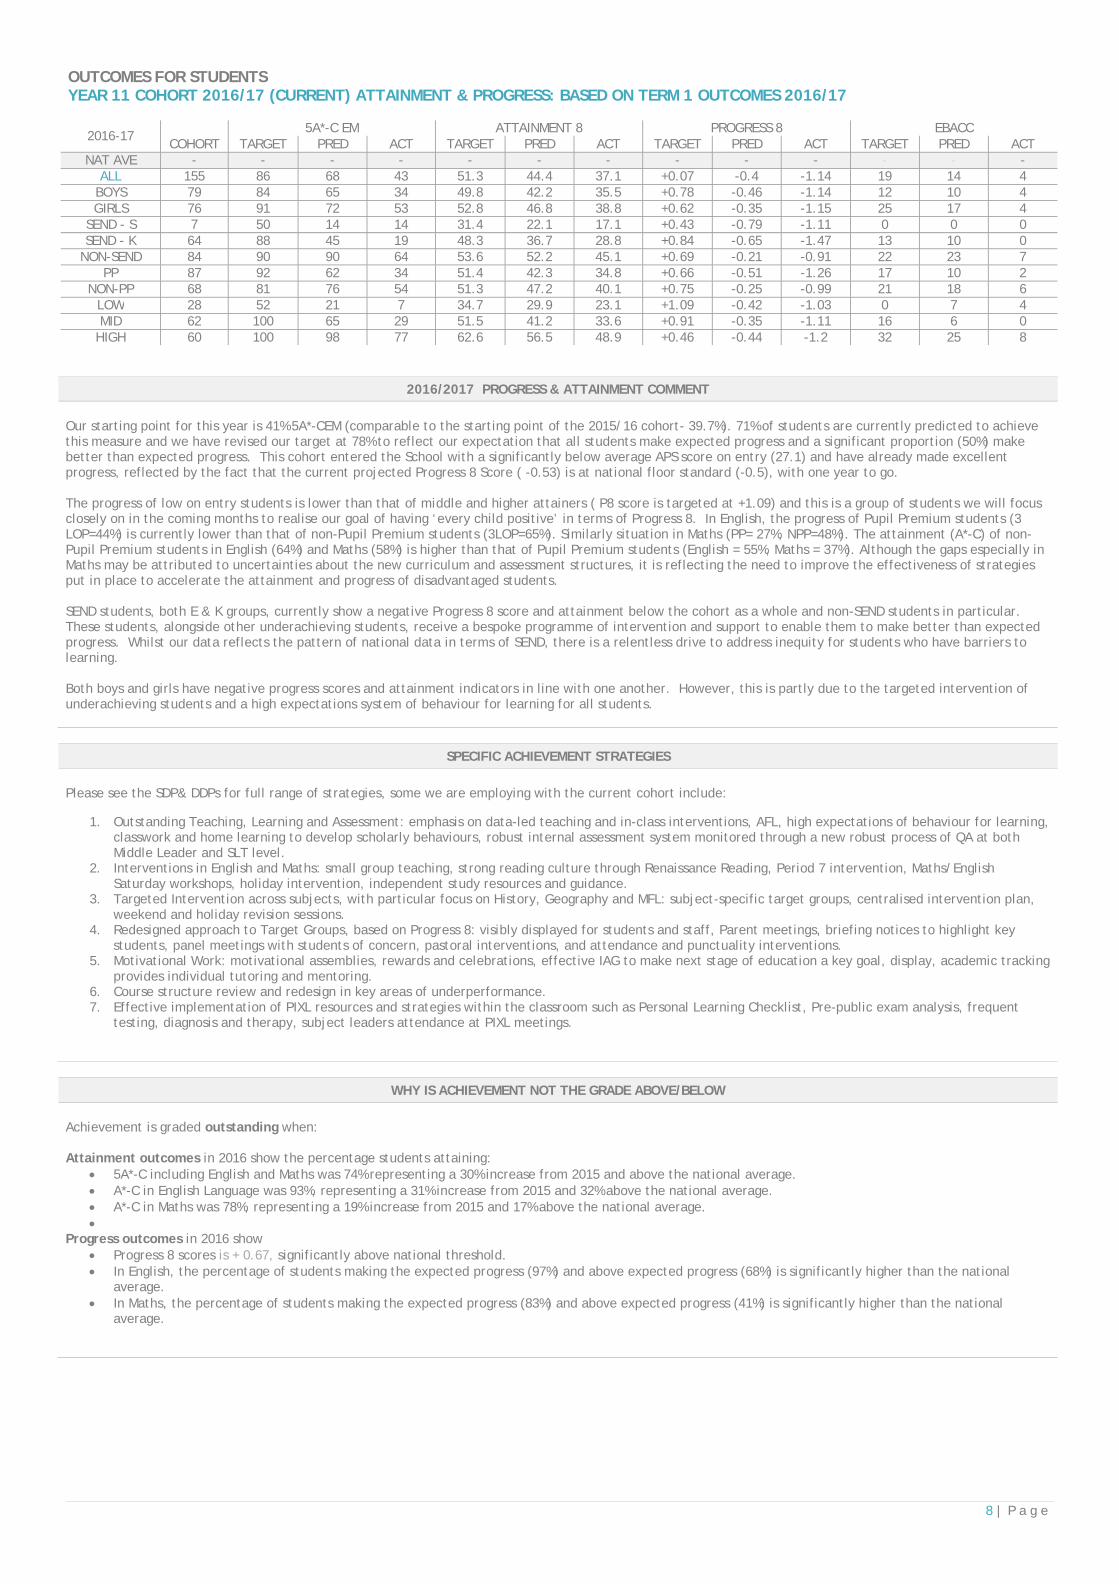
OUTCOMES FOR STUDENTS YEAR 11 COHORT 2016/17 (CURRENT) ATTAINMENT & PROGRESS: BASED ON TERM 1 OUTCOMES 2016/17
2016-17 5A*-C EM ATTAINMENT 8 PROGRESS 8 EBACC
COHORT TARGET PRED ACT TARGET PRED ACT TARGET PRED ACT TARGET PRED ACT NAT AVE - - - - - - - - - - - - -
ALL 155 86 68 43 51.3 44.4 37.1 +0.07 -0.4 -1.14 19 14 4 BOYS 79 84 65 34 49.8 42.2 35.5 +0.78 -0.46 -1.14 12 10 4 GIRLS 76 91 72 53 52.8 46.8 38.8 +0.62 -0.35 -1.15 25 17 4
SEND - S 7 50 14 14 31.4 22.1 17.1 +0.43 -0.79 -1.11 0 0 0 SEND - K 64 88 45 19 48.3 36.7 28.8 +0.84 -0.65 -1.47 13 10 0
NON-SEND 84 90 90 64 53.6 52.2 45.1 +0.69 -0.21 -0.91 22 23 7 PP 87 92 62 34 51.4 42.3 34.8 +0.66 -0.51 -1.26 17 10 2
NON-PP 68 81 76 54 51.3 47.2 40.1 +0.75 -0.25 -0.99 21 18 6 LOW 28 52 21 7 34.7 29.9 23.1 +1.09 -0.42 -1.03 0 7 4 MID 62 100 65 29 51.5 41.2 33.6 +0.91 -0.35 -1.11 16 6 0
HIGH 60 100 98 77 62.6 56.5 48.9 +0.46 -0.44 -1.2 32 25 8
2016/2017 PROGRESS & ATTAINMENT COMMENT
Our starting point for this year is 41% 5A*-CEM (comparable to the starting point of the 2015/16 cohort- 39.7%). 71% of students are currently predicted to achieve this measure and we have revised our target at 78% to reflect our expectation that all students make expected progress and a significant proportion (50%) make better than expected progress. This cohort entered the School with a significantly below average APS score on entry (27.1) and have already made excellent progress, reflected by the fact that the current projected Progress 8 Score ( -0.53) is at national floor standard (-0.5), with one year to go. The progress of low on entry students is lower than that of middle and higher attainers ( P8 score is targeted at +1.09) and this is a group of students we will focus closely on in the coming months to realise our goal of having ‘every child positive’ in terms of Progress 8. In English, the progress of Pupil Premium students (3 LOP=44%) is currently lower than that of non-Pupil Premium students (3LOP=65%). Similarly situation in Maths (PP= 27%, NPP=48%). The attainment (A*-C) of non-Pupil Premium students in English (64%) and Maths (58%) is higher than that of Pupil Premium students (English = 55%, Maths = 37%). Although the gaps especially in Maths may be attributed to uncertainties about the new curriculum and assessment structures, it is reflecting the need to improve the effectiveness of strategies put in place to accelerate the attainment and progress of disadvantaged students. SEND students, both E & K groups, currently show a negative Progress 8 score and attainment below the cohort as a whole and non-SEND students in particular. These students, alongside other underachieving students, receive a bespoke programme of intervention and support to enable them to make better than expected progress. Whilst our data reflects the pattern of national data in terms of SEND, there is a relentless drive to address inequity for students who have barriers to learning. Both boys and girls have negative progress scores and attainment indicators in line with one another. However, this is partly due to the targeted intervention of underachieving students and a high expectations system of behaviour for learning for all students.
SPECIFIC ACHIEVEMENT STRATEGIES
Please see the SDP& DDPs for full range of strategies, some we are employing with the current cohort include:
1. Outstanding Teaching, Learning and Assessment: emphasis on data-led teaching and in-class interventions, AFL, high expectations of behaviour for learning, classwork and home learning to develop scholarly behaviours, robust internal assessment system monitored through a new robust process of QA at both Middle Leader and SLT level.
2. Interventions in English and Maths: small group teaching, strong reading culture through Renaissance Reading, Period 7 intervention, Maths/English Saturday workshops, holiday intervention, independent study resources and guidance.
3. Targeted Intervention across subjects, with particular focus on History, Geography and MFL: subject-specific target groups, centralised intervention plan, weekend and holiday revision sessions.
4. Redesigned approach to Target Groups, based on Progress 8: visibly displayed for students and staff, Parent meetings, briefing notices to highlight key students, panel meetings with students of concern, pastoral interventions, and attendance and punctuality interventions.
5. Motivational Work: motivational assemblies, rewards and celebrations, effective IAG to make next stage of education a key goal, display, academic tracking provides individual tutoring and mentoring.
6. Course structure review and redesign in key areas of underperformance. 7. Effective implementation of PIXL resources and strategies within the classroom such as Personal Learning Checklist, Pre-public exam analysis, frequent
testing, diagnosis and therapy, subject leaders attendance at PIXL meetings.
WHY IS ACHIEVEMENT NOT THE GRADE ABOVE/BELOW
Achievement is graded outstanding when: Attainment outcomes in 2016 show the percentage students attaining:
5A*-C including English and Maths was 74% representing a 30% increase from 2015 and above the national average. A*-C in English Language was 93%, representing a 31% increase from 2015 and 32% above the national average. A*-C in Maths was 78%, representing a 19% increase from 2015 and 17% above the national average.
Progress outcomes in 2016 show Progress 8 scores is + 0.67, significantly above national threshold. In English, the percentage of students making the expected progress (97%) and above expected progress (68%) is significantly higher than the national
average. In Maths, the percentage of students making the expected progress (83%) and above expected progress (41%) is significantly higher than the national
average.
9 | P a g e
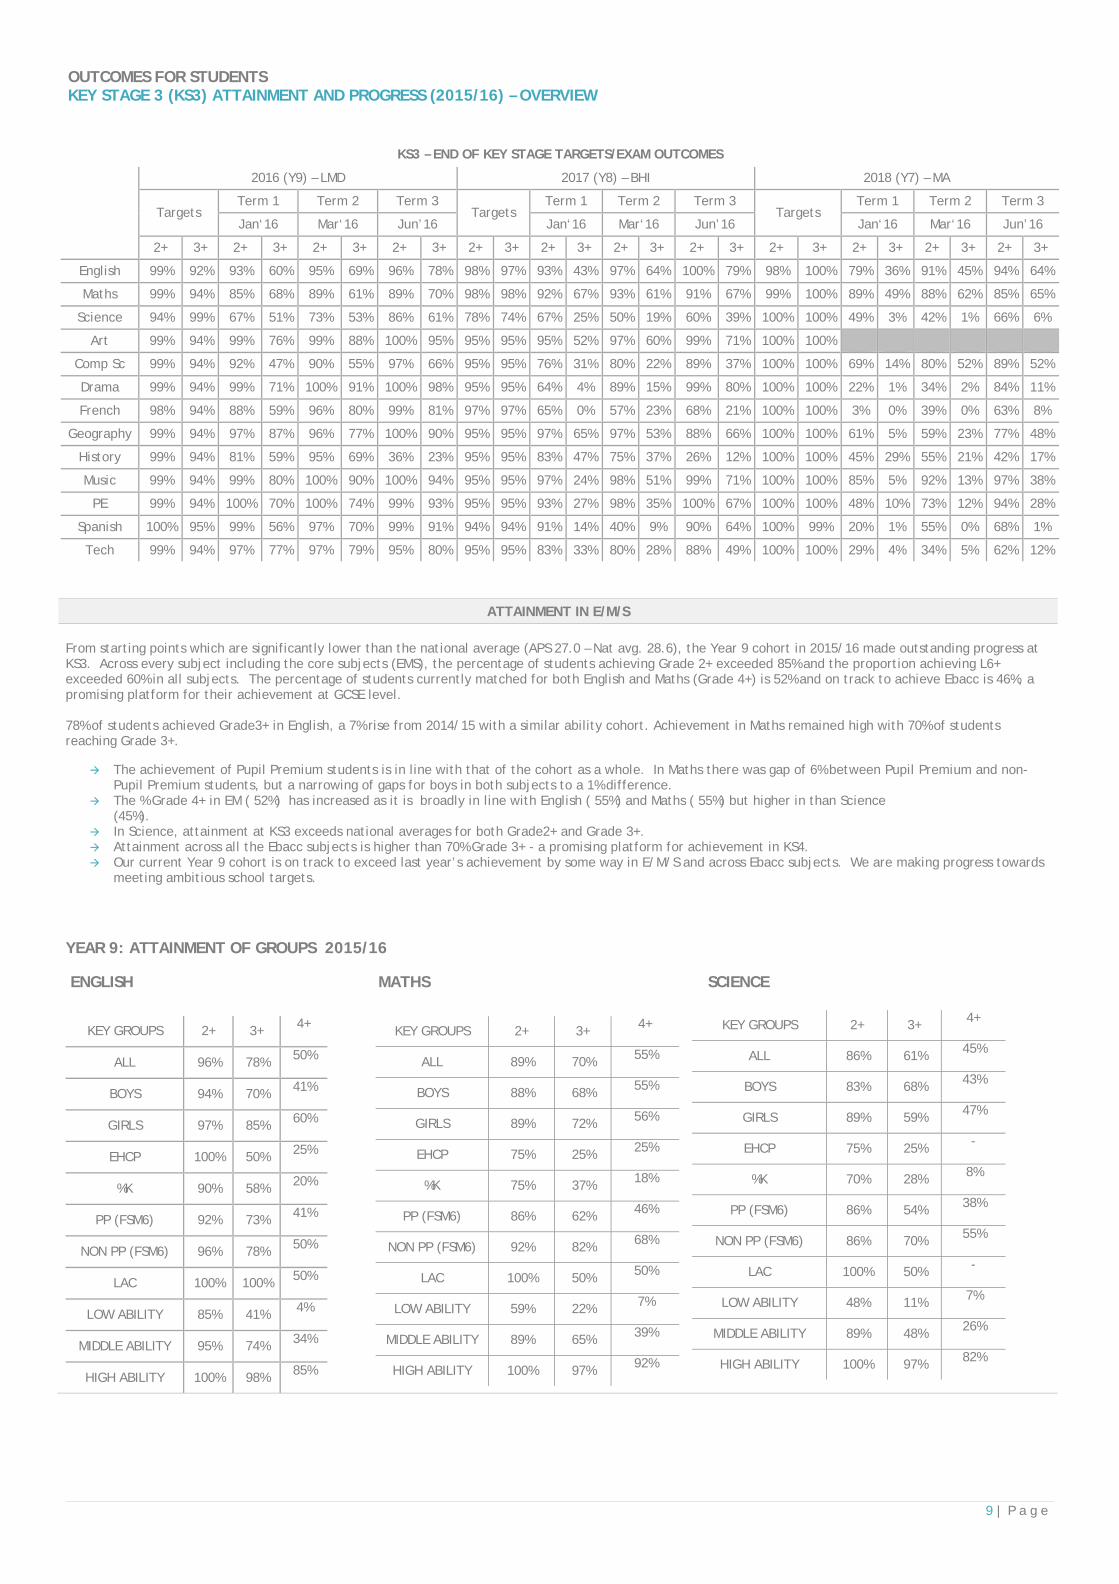
OUTCOMES FOR STUDENTS KEY STAGE 3 (KS3) ATTAINMENT AND PROGRESS (2015/16) – OVERVIEW
KS3 – END OF KEY STAGE TARGETS/EXAM OUTCOMES
2016 (Y9) – LMD 2017 (Y8) – BHI 2018 (Y7) – MA
Targets Term 1 Term 2 Term 3
Targets Term 1 Term 2 Term 3
Targets Term 1 Term 2 Term 3
Jan‘16 Mar‘16 Jun’16 Jan‘16 Mar‘16 Jun’16 Jan‘16 Mar‘16 Jun’16
2+ 3+ 2+ 3+ 2+ 3+ 2+ 3+ 2+ 3+ 2+ 3+ 2+ 3+ 2+ 3+ 2+ 3+ 2+ 3+ 2+ 3+ 2+ 3+
English 99% 92% 93% 60% 95% 69% 96% 78% 98% 97% 93% 43% 97% 64% 100% 79% 98% 100% 79% 36% 91% 45% 94% 64%
Maths 99% 94% 85% 68% 89% 61% 89% 70% 98% 98% 92% 67% 93% 61% 91% 67% 99% 100% 89% 49% 88% 62% 85% 65%
Science 94% 99% 67% 51% 73% 53% 86% 61% 78% 74% 67% 25% 50% 19% 60% 39% 100% 100% 49% 3% 42% 1% 66% 6%
Art 99% 94% 99% 76% 99% 88% 100% 95% 95% 95% 95% 52% 97% 60% 99% 71% 100% 100% Comp Sc 99% 94% 92% 47% 90% 55% 97% 66% 95% 95% 76% 31% 80% 22% 89% 37% 100% 100% 69% 14% 80% 52% 89% 52%
Drama 99% 94% 99% 71% 100% 91% 100% 98% 95% 95% 64% 4% 89% 15% 99% 80% 100% 100% 22% 1% 34% 2% 84% 11%
French 98% 94% 88% 59% 96% 80% 99% 81% 97% 97% 65% 0% 57% 23% 68% 21% 100% 100% 3% 0% 39% 0% 63% 8%
Geography 99% 94% 97% 87% 96% 77% 100% 90% 95% 95% 97% 65% 97% 53% 88% 66% 100% 100% 61% 5% 59% 23% 77% 48%
History 99% 94% 81% 59% 95% 69% 36% 23% 95% 95% 83% 47% 75% 37% 26% 12% 100% 100% 45% 29% 55% 21% 42% 17%
Music 99% 94% 99% 80% 100% 90% 100% 94% 95% 95% 97% 24% 98% 51% 99% 71% 100% 100% 85% 5% 92% 13% 97% 38%
PE 99% 94% 100% 70% 100% 74% 99% 93% 95% 95% 93% 27% 98% 35% 100% 67% 100% 100% 48% 10% 73% 12% 94% 28%
Spanish 100% 95% 99% 56% 97% 70% 99% 91% 94% 94% 91% 14% 40% 9% 90% 64% 100% 99% 20% 1% 55% 0% 68% 1%
Tech 99% 94% 97% 77% 97% 79% 95% 80% 95% 95% 83% 33% 80% 28% 88% 49% 100% 100% 29% 4% 34% 5% 62% 12%
ATTAINMENT IN E/M/S
From starting points which are significantly lower than the national average (APS 27.0 – Nat avg. 28.6), the Year 9 cohort in 2015/16 made outstanding progress at KS3. Across every subject including the core subjects (EMS), the percentage of students achieving Grade 2+ exceeded 85% and the proportion achieving L6+ exceeded 60% in all subjects. The percentage of students currently matched for both English and Maths (Grade 4+) is 52% and on track to achieve Ebacc is 46%, a promising platform for their achievement at GCSE level. 78% of students achieved Grade3+ in English, a 7% rise from 2014/15 with a similar ability cohort. Achievement in Maths remained high with 70% of students reaching Grade 3+.
The achievement of Pupil Premium students is in line with that of the cohort as a whole. In Maths there was gap of 6% between Pupil Premium and non-Pupil Premium students, but a narrowing of gaps for boys in both subjects to a 1% difference.
The % Grade 4+ in EM ( 52%) has increased as it is broadly in line with English ( 55%) and Maths ( 55%) but higher in than Science (45%).
In Science, attainment at KS3 exceeds national averages for both Grade2+ and Grade 3+. Attainment across all the Ebacc subjects is higher than 70% Grade 3+ - a promising platform for achievement in KS4. Our current Year 9 cohort is on track to exceed last year’s achievement by some way in E/M/S and across Ebacc subjects. We are making progress towards
meeting ambitious school targets.
YEAR 9: ATTAINMENT OF GROUPS 2015/16 ENGLISH MATHS SCIENCE
KEY GROUPS 2+ 3+ 4+
ALL 86% 61% 45%
BOYS 83% 68% 43%
GIRLS 89% 59% 47%
EHCP 75% 25% -
%K 70% 28% 8%
PP (FSM6) 86% 54% 38%
NON PP (FSM6) 86% 70% 55%
LAC 100% 50% -
LOW ABILITY 48% 11% 7%
MIDDLE ABILITY 89% 48% 26%
HIGH ABILITY 100% 97% 82%
KEY GROUPS 2+ 3+ 4+
ALL 89% 70% 55%
BOYS 88% 68% 55%
GIRLS 89% 72% 56%
EHCP 75% 25% 25%
%K 75% 37% 18%
PP (FSM6) 86% 62% 46%
NON PP (FSM6) 92% 82% 68%
LAC 100% 50% 50%
LOW ABILITY 59% 22% 7%
MIDDLE ABILITY 89% 65% 39%
HIGH ABILITY 100% 97% 92%
KEY GROUPS 2+ 3+ 4+
ALL 96% 78% 50%
BOYS 94% 70% 41%
GIRLS 97% 85% 60%
EHCP 100% 50% 25%
%K 90% 58% 20%
PP (FSM6) 92% 73% 41%
NON PP (FSM6) 96% 78% 50%
LAC 100% 100% 50%
LOW ABILITY 85% 41% 4%
MIDDLE ABILITY 95% 74% 34%
HIGH ABILITY 100% 98% 85%
10 | P a g e
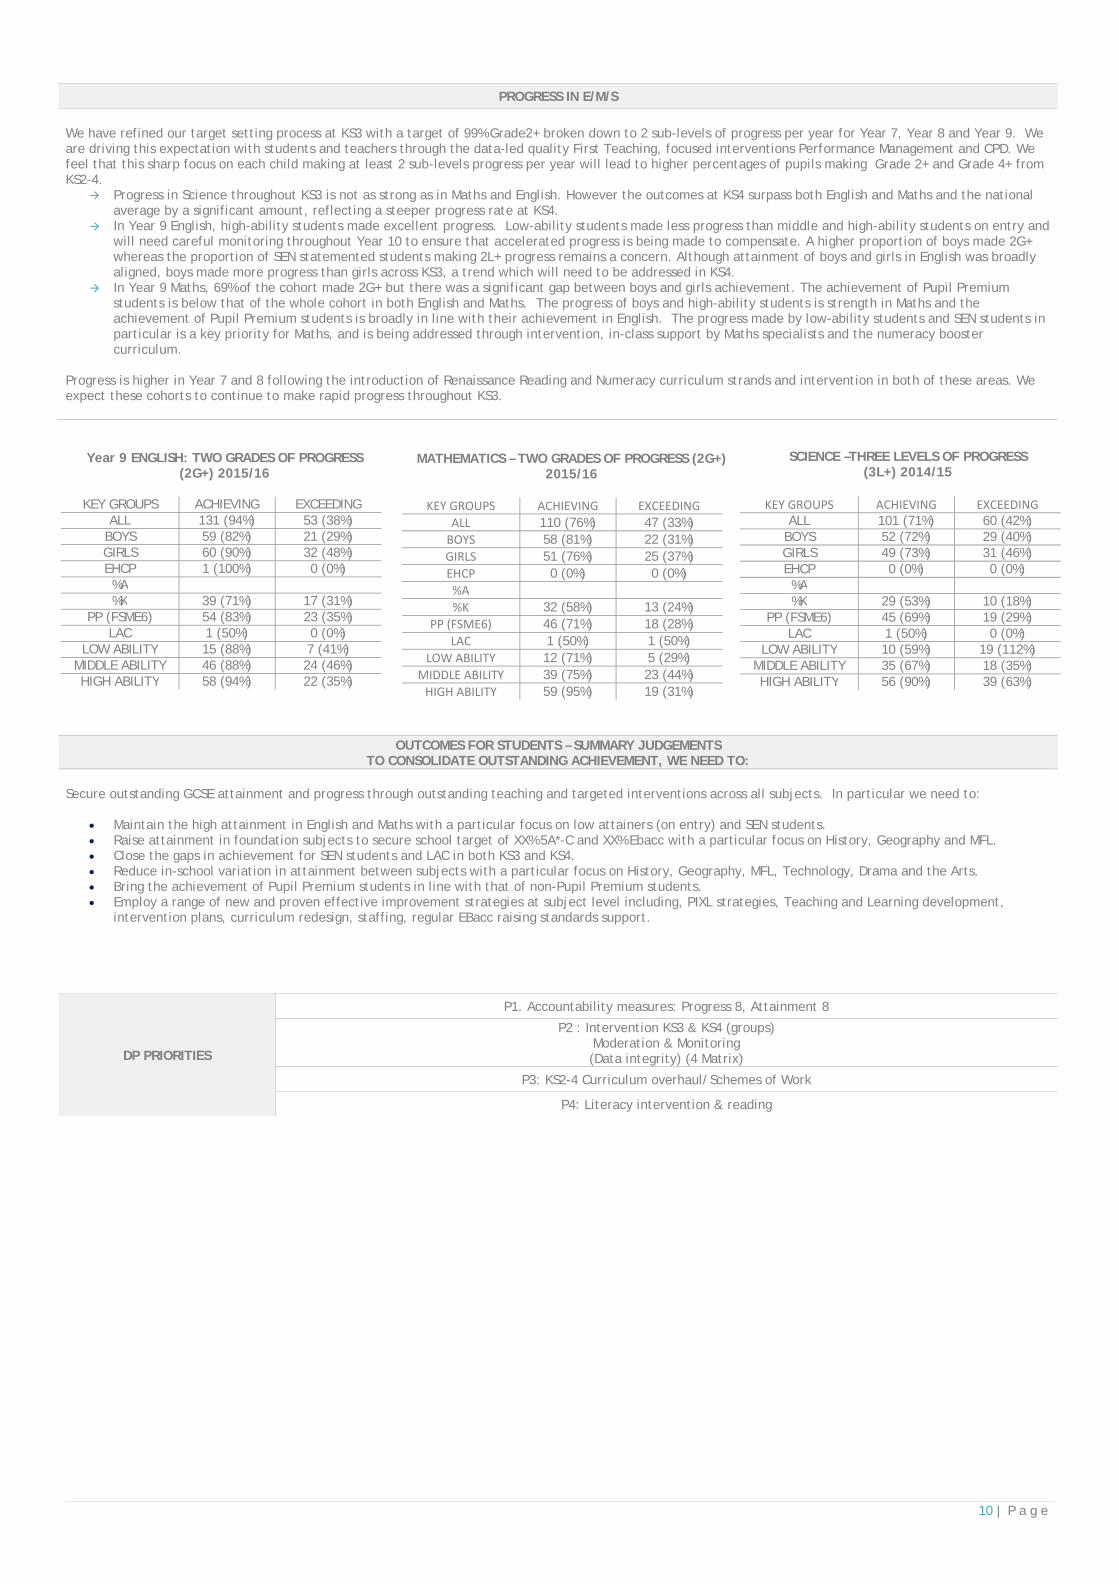
PROGRESS IN E/M/S
We have refined our target setting process at KS3 with a target of 99% Grade2+ broken down to 2 sub-levels of progress per year for Year 7, Year 8 and Year 9. We are driving this expectation with students and teachers through the data-led quality First Teaching, focused interventions Performance Management and CPD. We feel that this sharp focus on each child making at least 2 sub-levels progress per year will lead to higher percentages of pupils making Grade 2+ and Grade 4+ from KS2-4.
Progress in Science throughout KS3 is not as strong as in Maths and English. However the outcomes at KS4 surpass both English and Maths and the national average by a significant amount, reflecting a steeper progress rate at KS4.
In Year 9 English, high-ability students made excellent progress. Low-ability students made less progress than middle and high-ability students on entry and will need careful monitoring throughout Year 10 to ensure that accelerated progress is being made to compensate. A higher proportion of boys made 2G+ whereas the proportion of SEN statemented students making 2L+ progress remains a concern. Although attainment of boys and girls in English was broadly aligned, boys made more progress than girls across KS3, a trend which will need to be addressed in KS4.
In Year 9 Maths, 69% of the cohort made 2G+ but there was a significant gap between boys and girls achievement. The achievement of Pupil Premium students is below that of the whole cohort in both English and Maths. The progress of boys and high-ability students is strength in Maths and the achievement of Pupil Premium students is broadly in line with their achievement in English. The progress made by low-ability students and SEN students in particular is a key priority for Maths, and is being addressed through intervention, in-class support by Maths specialists and the numeracy booster curriculum.
Progress is higher in Year 7 and 8 following the introduction of Renaissance Reading and Numeracy curriculum strands and intervention in both of these areas. We expect these cohorts to continue to make rapid progress throughout KS3.
Year 9 ENGLISH: TWO GRADES OF PROGRESS (2G+) 2015/16
KEY GROUPS ACHIEVING EXCEEDING
ALL 131 (94%) 53 (38%) BOYS 59 (82%) 21 (29%) GIRLS 60 (90%) 32 (48%) EHCP 1 (100%) 0 (0%) %A %K 39 (71%) 17 (31%)
PP (FSME6) 54 (83%) 23 (35%) LAC 1 (50%) 0 (0%)
LOW ABILITY 15 (88%) 7 (41%) MIDDLE ABILITY 46 (88%) 24 (46%) HIGH ABILITY 58 (94%) 22 (35%)
OUTCOMES FOR STUDENTS – SUMMARY JUDGEMENTS TO CONSOLIDATE OUTSTANDING ACHIEVEMENT, WE NEED TO:
Secure outstanding GCSE attainment and progress through outstanding teaching and targeted interventions across all subjects. In particular we need to:
Maintain the high attainment in English and Maths with a particular focus on low attainers (on entry) and SEN students. Raise attainment in foundation subjects to secure school target of XX% 5A*-C and XX% Ebacc with a particular focus on History, Geography and MFL. Close the gaps in achievement for SEN students and LAC in both KS3 and KS4. Reduce in-school variation in attainment between subjects with a particular focus on History, Geography, MFL, Technology, Drama and the Arts. Bring the achievement of Pupil Premium students in line with that of non-Pupil Premium students. Employ a range of new and proven effective improvement strategies at subject level including, PIXL strategies, Teaching and Learning development,
intervention plans, curriculum redesign, staffing, regular EBacc raising standards support.
DP PRIORITIES
P1. Accountability measures: Progress 8, Attainment 8
P2 : Intervention KS3 & KS4 (groups) Moderation & Monitoring (Data integrity) (4 Matrix)
P3: KS2-4 Curriculum overhaul/Schemes of Work
P4: Literacy intervention & reading
MATHEMATICS – TWO GRADES OF PROGRESS (2G+) 2015/16
KEY GROUPS ACHIEVING EXCEEDING
ALL 110 (76%) 47 (33%) BOYS 58 (81%) 22 (31%) GIRLS 51 (76%) 25 (37%) EHCP 0 (0%) 0 (0%) %A %K 32 (58%) 13 (24%)
PP (FSME6) 46 (71%) 18 (28%) LAC 1 (50%) 1 (50%)
LOW ABILITY 12 (71%) 5 (29%) MIDDLE ABILITY 39 (75%) 23 (44%) HIGH ABILITY 59 (95%) 19 (31%)
SCIENCE –THREE LEVELS OF PROGRESS (3L+) 2014/15
KEY GROUPS ACHIEVING EXCEEDING
ALL 101 (71%) 60 (42%) BOYS 52 (72%) 29 (40%) GIRLS 49 (73%) 31 (46%) EHCP 0 (0%) 0 (0%) %A %K 29 (53%) 10 (18%)
PP (FSME6) 45 (69%) 19 (29%) LAC 1 (50%) 0 (0%)
LOW ABILITY 10 (59%) 19 (112%) MIDDLE ABILITY 35 (67%) 18 (35%) HIGH ABILITY 56 (90%) 39 (63%)
11 | P a g e
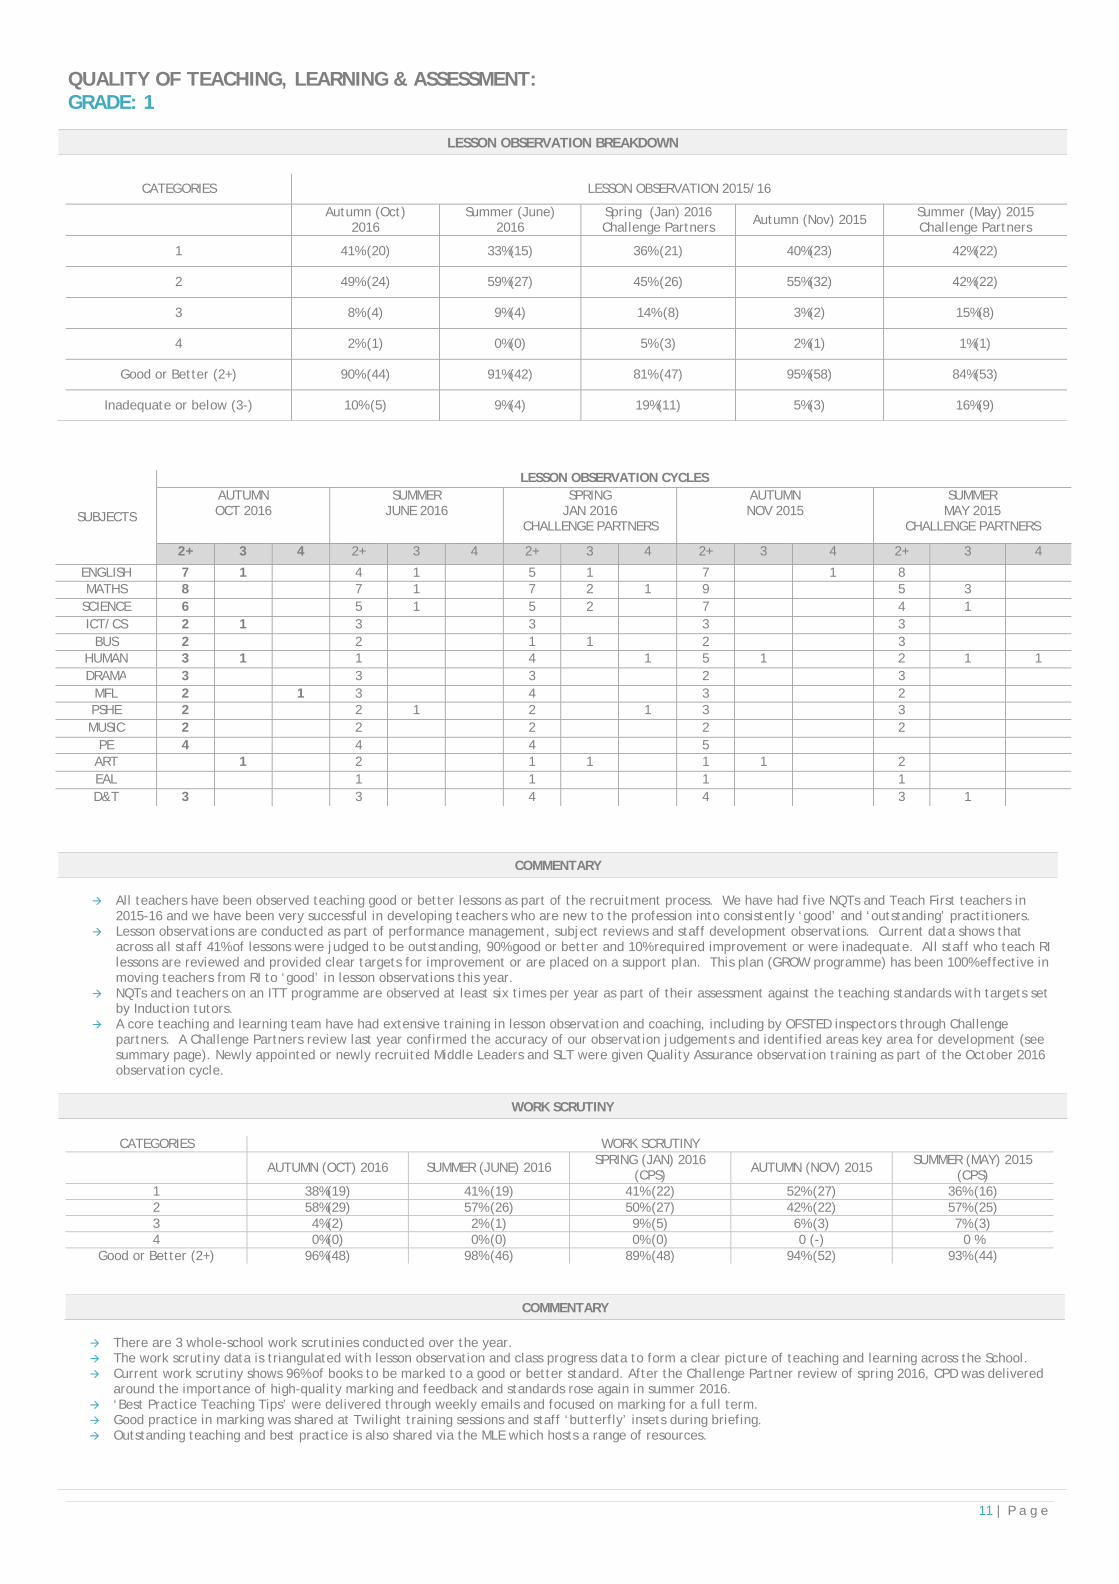
QUALITY OF TEACHING, LEARNING & ASSESSMENT: GRADE: 1
LESSON OBSERVATION BREAKDOWN
CATEGORIES LESSON OBSERVATION 2015/16
Autumn (Oct)
2016 Summer (June)
2016 Spring (Jan) 2016 Challenge Partners Autumn (Nov) 2015
Summer (May) 2015 Challenge Partners
1 41% (20) 33%(15) 36% (21) 40%(23) 42%(22)
2 49% (24) 59%(27) 45% (26) 55%(32) 42%(22)
3 8% (4) 9%(4) 14% (8) 3%(2) 15%(8)
4 2% (1) 0%(0) 5% (3) 2%(1) 1%(1)
Good or Better (2+) 90% (44) 91%(42) 81% (47) 95%(58) 84%(53)
Inadequate or below (3-) 10% (5) 9%(4) 19%(11) 5%(3) 16%(9)
COMMENTARY
All teachers have been observed teaching good or better lessons as part of the recruitment process. We have had five NQTs and Teach First teachers in
2015-16 and we have been very successful in developing teachers who are new to the profession into consistently ‘good’ and ‘outstanding’ practitioners. Lesson observations are conducted as part of performance management, subject reviews and staff development observations. Current data shows that
across all staff 41% of lessons were judged to be outstanding, 90% good or better and 10% required improvement or were inadequate. All staff who teach RI lessons are reviewed and provided clear targets for improvement or are placed on a support plan. This plan (GROW programme) has been 100% effective in moving teachers from RI to ‘good’ in lesson observations this year.
NQTs and teachers on an ITT programme are observed at least six times per year as part of their assessment against the teaching standards with targets set by Induction tutors.
A core teaching and learning team have had extensive training in lesson observation and coaching, including by OFSTED inspectors through Challenge partners. A Challenge Partners review last year confirmed the accuracy of our observation judgements and identified areas key area for development (see summary page). Newly appointed or newly recruited Middle Leaders and SLT were given Quality Assurance observation training as part of the October 2016 observation cycle.
WORK SCRUTINY
CATEGORIES WORK SCRUTINY
AUTUMN (OCT) 2016 SUMMER (JUNE) 2016 SPRING (JAN) 2016
(CPS) AUTUMN (NOV) 2015
SUMMER (MAY) 2015 (CPS)
1 38%(19) 41% (19) 41% (22) 52% (27) 36% (16) 2 58%(29) 57% (26) 50% (27) 42% (22) 57% (25) 3 4%(2) 2% (1) 9% (5) 6% (3) 7% (3) 4 0%(0) 0% (0) 0% (0) 0 (-) 0 %
Good or Better (2+) 96%(48) 98% (46) 89% (48) 94% (52) 93% (44)
COMMENTARY
There are 3 whole-school work scrutinies conducted over the year. The work scrutiny data is triangulated with lesson observation and class progress data to form a clear picture of teaching and learning across the School. Current work scrutiny shows 96% of books to be marked to a good or better standard. After the Challenge Partner review of spring 2016, CPD was delivered
around the importance of high-quality marking and feedback and standards rose again in summer 2016. ‘Best Practice Teaching Tips’ were delivered through weekly emails and focused on marking for a full term. Good practice in marking was shared at Twilight training sessions and staff ‘butterfly’ insets during briefing. Outstanding teaching and best practice is also shared via the MLE which hosts a range of resources.
SUBJECTS
LESSON OBSERVATION CYCLES AUTUMN OCT 2016
SUMMER JUNE 2016
SPRING JAN 2016
CHALLENGE PARTNERS
AUTUMN NOV 2015
SUMMER MAY 2015
CHALLENGE PARTNERS
2+ 3 4 2+ 3 4 2+ 3 4 2+ 3 4 2+ 3 4
ENGLISH 7 1 4 1 5 1 7 1 8 MATHS 8 7 1 7 2 1 9 5 3
SCIENCE 6 5 1 5 2 7 4 1 ICT/CS 2 1 3 3 3 3
BUS 2 2 1 1 2 3 HUMAN 3 1 1 4 1 5 1 2 1 1 DRAMA 3 3 3 2 3
MFL 2 1 3 4 3 2 PSHE 2 2 1 2 1 3 3 MUSIC 2 2 2 2 2
PE 4 4 4 5 ART 1 2 1 1 1 1 2 EAL 1 1 1 1 D&T 3 3 4 4 3 1
12 | P a g e
DEVELOPING TEACHING
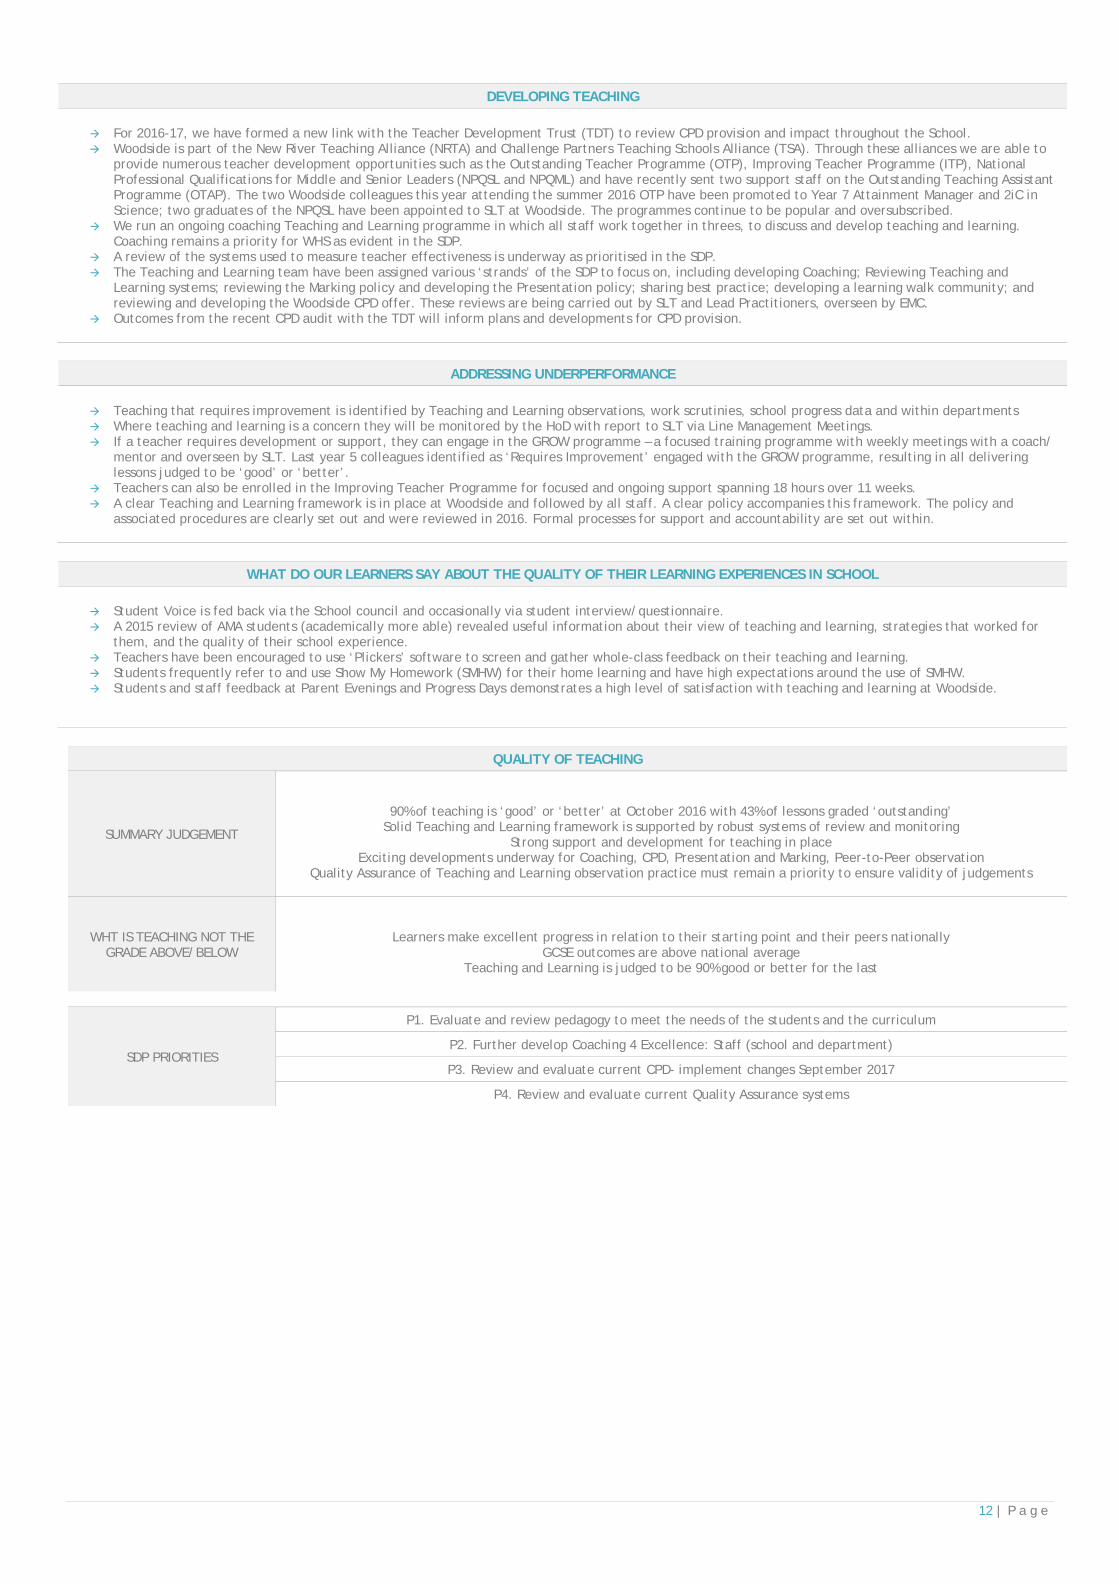
For 2016-17, we have formed a new link with the Teacher Development Trust (TDT) to review CPD provision and impact throughout the School. Woodside is part of the New River Teaching Alliance (NRTA) and Challenge Partners Teaching Schools Alliance (TSA). Through these alliances we are able to
provide numerous teacher development opportunities such as the Outstanding Teacher Programme (OTP), Improving Teacher Programme (ITP), National Professional Qualifications for Middle and Senior Leaders (NPQSL and NPQML) and have recently sent two support staff on the Outstanding Teaching Assistant Programme (OTAP). The two Woodside colleagues this year attending the summer 2016 OTP have been promoted to Year 7 Attainment Manager and 2iC in Science; two graduates of the NPQSL have been appointed to SLT at Woodside. The programmes continue to be popular and oversubscribed.
We run an ongoing coaching Teaching and Learning programme in which all staff work together in threes, to discuss and develop teaching and learning. Coaching remains a priority for WHS as evident in the SDP.
A review of the systems used to measure teacher effectiveness is underway as prioritised in the SDP. The Teaching and Learning team have been assigned various ‘strands’ of the SDP to focus on, including developing Coaching; Reviewing Teaching and
Learning systems; reviewing the Marking policy and developing the Presentation policy; sharing best practice; developing a learning walk community; and reviewing and developing the Woodside CPD offer. These reviews are being carried out by SLT and Lead Practitioners, overseen by EMC.
Outcomes from the recent CPD audit with the TDT will inform plans and developments for CPD provision.
ADDRESSING UNDERPERFORMANCE
Teaching that requires improvement is identified by Teaching and Learning observations, work scrutinies, school progress data and within departments Where teaching and learning is a concern they will be monitored by the HoD with report to SLT via Line Management Meetings. If a teacher requires development or support, they can engage in the GROW programme – a focused training programme with weekly meetings with a coach/
mentor and overseen by SLT. Last year 5 colleagues identified as ‘Requires Improvement’ engaged with the GROW programme, resulting in all delivering lessons judged to be ‘good’ or ‘better’.
Teachers can also be enrolled in the Improving Teacher Programme for focused and ongoing support spanning 18 hours over 11 weeks. A clear Teaching and Learning framework is in place at Woodside and followed by all staff. A clear policy accompanies this framework. The policy and
associated procedures are clearly set out and were reviewed in 2016. Formal processes for support and accountability are set out within.
WHAT DO OUR LEARNERS SAY ABOUT THE QUALITY OF THEIR LEARNING EXPERIENCES IN SCHOOL
Student Voice is fed back via the School council and occasionally via student interview/questionnaire. A 2015 review of AMA students (academically more able) revealed useful information about their view of teaching and learning, strategies that worked for
them, and the quality of their school experience. Teachers have been encouraged to use ‘Plickers’ software to screen and gather whole-class feedback on their teaching and learning. Students frequently refer to and use Show My Homework (SMHW) for their home learning and have high expectations around the use of SMHW. Students and staff feedback at Parent Evenings and Progress Days demonstrates a high level of satisfaction with teaching and learning at Woodside.
QUALITY OF TEACHING
SUMMARY JUDGEMENT
90% of teaching is ‘good’ or ‘better’ at October 2016 with 43% of lessons graded ‘outstanding’ Solid Teaching and Learning framework is supported by robust systems of review and monitoring
Strong support and development for teaching in place Exciting developments underway for Coaching, CPD, Presentation and Marking, Peer-to-Peer observation
Quality Assurance of Teaching and Learning observation practice must remain a priority to ensure validity of judgements
WHT IS TEACHING NOT THE GRADE ABOVE/BELOW
Learners make excellent progress in relation to their starting point and their peers nationally GCSE outcomes are above national average
Teaching and Learning is judged to be 90% good or better for the last
SDP PRIORITIES
P1. Evaluate and review pedagogy to meet the needs of the students and the curriculum
P2. Further develop Coaching 4 Excellence: Staff (school and department)
P3. Review and evaluate current CPD- implement changes September 2017
P4. Review and evaluate current Quality Assurance systems
13 | P a g e
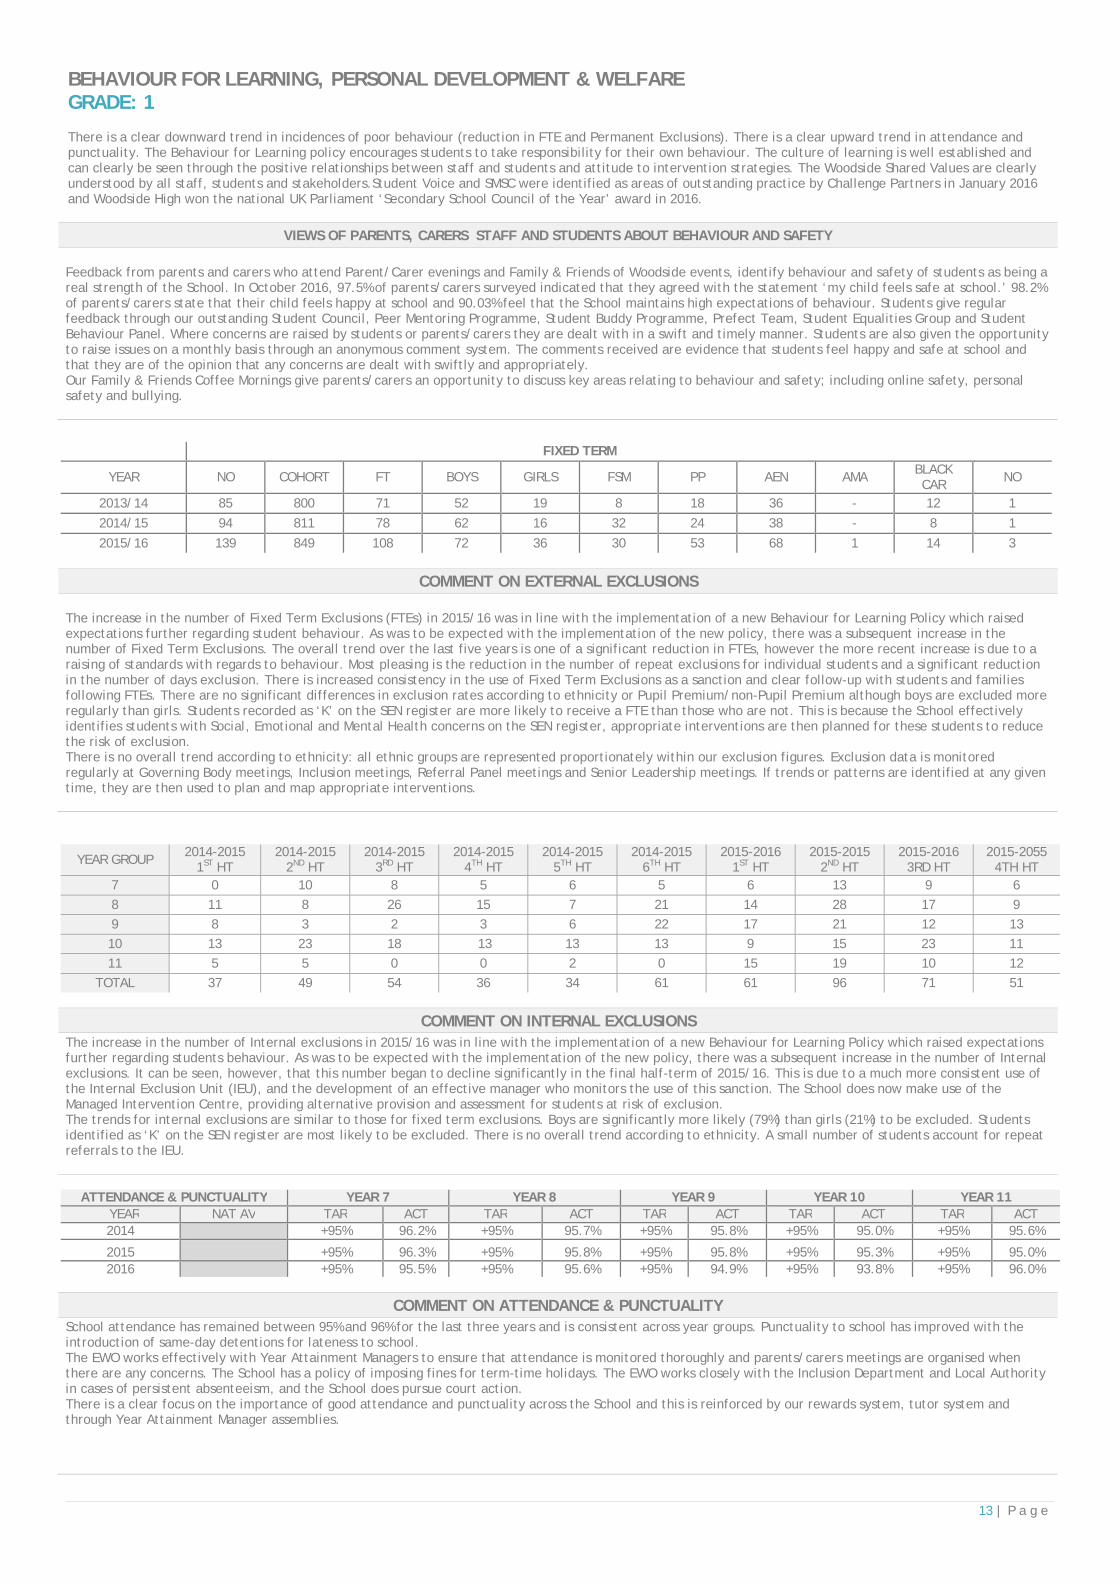
BEHAVIOUR FOR LEARNING, PERSONAL DEVELOPMENT & WELFARE GRADE: 1 There is a clear downward trend in incidences of poor behaviour (reduction in FTE and Permanent Exclusions). There is a clear upward trend in attendance and punctuality. The Behaviour for Learning policy encourages students to take responsibility for their own behaviour. The culture of learning is well established and can clearly be seen through the positive relationships between staff and students and attitude to intervention strategies. The Woodside Shared Values are clearly understood by all staff, students and stakeholders.Student Voice and SMSC were identified as areas of outstanding practice by Challenge Partners in January 2016 and Woodside High won the national UK Parliament ‘Secondary School Council of the Year’ award in 2016.
VIEWS OF PARENTS, CARERS STAFF AND STUDENTS ABOUT BEHAVIOUR AND SAFETY
Feedback from parents and carers who attend Parent/Carer evenings and Family & Friends of Woodside events, identify behaviour and safety of students as being a real strength of the School. In October 2016, 97.5% of parents/carers surveyed indicated that they agreed with the statement ‘my child feels safe at school.’ 98.2% of parents/carers state that their child feels happy at school and 90.03% feel that the School maintains high expectations of behaviour. Students give regular feedback through our outstanding Student Council, Peer Mentoring Programme, Student Buddy Programme, Prefect Team, Student Equalities Group and Student Behaviour Panel. Where concerns are raised by students or parents/carers they are dealt with in a swift and timely manner. Students are also given the opportunity to raise issues on a monthly basis through an anonymous comment system. The comments received are evidence that students feel happy and safe at school and that they are of the opinion that any concerns are dealt with swiftly and appropriately. Our Family & Friends Coffee Mornings give parents/carers an opportunity to discuss key areas relating to behaviour and safety; including online safety, personal safety and bullying.
COMMENT ON EXTERNAL EXCLUSIONS The increase in the number of Fixed Term Exclusions (FTEs) in 2015/16 was in line with the implementation of a new Behaviour for Learning Policy which raised expectations further regarding student behaviour. As was to be expected with the implementation of the new policy, there was a subsequent increase in the number of Fixed Term Exclusions. The overall trend over the last five years is one of a significant reduction in FTEs, however the more recent increase is due to a raising of standards with regards to behaviour. Most pleasing is the reduction in the number of repeat exclusions for individual students and a significant reduction in the number of days exclusion. There is increased consistency in the use of Fixed Term Exclusions as a sanction and clear follow-up with students and families following FTEs. There are no significant differences in exclusion rates according to ethnicity or Pupil Premium/non-Pupil Premium although boys are excluded more regularly than girls. Students recorded as ‘K’ on the SEN register are more likely to receive a FTE than those who are not. This is because the School effectively identifies students with Social, Emotional and Mental Health concerns on the SEN register, appropriate interventions are then planned for these students to reduce the risk of exclusion. There is no overall trend according to ethnicity: all ethnic groups are represented proportionately within our exclusion figures. Exclusion data is monitored regularly at Governing Body meetings, Inclusion meetings, Referral Panel meetings and Senior Leadership meetings. If trends or patterns are identified at any given time, they are then used to plan and map appropriate interventions.
COMMENT ON INTERNAL EXCLUSIONS The increase in the number of Internal exclusions in 2015/16 was in line with the implementation of a new Behaviour for Learning Policy which raised expectations further regarding students behaviour. As was to be expected with the implementation of the new policy, there was a subsequent increase in the number of Internal exclusions. It can be seen, however, that this number began to decline significantly in the final half-term of 2015/16. This is due to a much more consistent use of the Internal Exclusion Unit (IEU), and the development of an effective manager who monitors the use of this sanction. The School does now make use of the Managed Intervention Centre, providing alternative provision and assessment for students at risk of exclusion. The trends for internal exclusions are similar to those for fixed term exclusions. Boys are significantly more likely (79%) than girls (21%) to be excluded. Students identified as ‘K’ on the SEN register are most likely to be excluded. There is no overall trend according to ethnicity. A small number of students account for repeat referrals to the IEU.
ATTENDANCE & PUNCTUALITY YEAR 7 YEAR 8 YEAR 9 YEAR 10 YEAR 11 YEAR NAT AV TAR ACT TAR ACT TAR ACT TAR ACT TAR ACT 2014 +95% 96.2% +95% 95.7% +95% 95.8% +95% 95.0% +95% 95.6%
2015 +95% 96.3% +95% 95.8% +95% 95.8% +95% 95.3% +95% 95.0% 2016 +95% 95.5% +95% 95.6% +95% 94.9% +95% 93.8% +95% 96.0%
COMMENT ON ATTENDANCE & PUNCTUALITY School attendance has remained between 95% and 96% for the last three years and is consistent across year groups. Punctuality to school has improved with the introduction of same-day detentions for lateness to school. The EWO works effectively with Year Attainment Managers to ensure that attendance is monitored thoroughly and parents/carers meetings are organised when there are any concerns. The School has a policy of imposing fines for term-time holidays. The EWO works closely with the Inclusion Department and Local Authority in cases of persistent absenteeism, and the School does pursue court action. There is a clear focus on the importance of good attendance and punctuality across the School and this is reinforced by our rewards system, tutor system and through Year Attainment Manager assemblies.
FIXED TERM
YEAR NO COHORT FT BOYS GIRLS FSM PP AEN AMA BLACK CAR
NO
2013/14 85 800 71 52 19 8 18 36 - 12 1
2014/15 94 811 78 62 16 32 24 38 - 8 1
2015/16 139 849 108 72 36 30 53 68 1 14 3
YEAR GROUP 2014-2015
1ST HT 2014-2015
2ND HT 2014-2015
3RD HT 2014-2015
4TH HT 2014-2015
5TH HT 2014-2015
6TH HT 2015-2016
1ST HT 2015-2015
2ND HT 2015-2016
3RD HT 2015-2055
4TH HT 7 0 10 8 5 6 5 6 13 9 6
8 11 8 26 15 7 21 14 28 17 9
9 8 3 2 3 6 22 17 21 12 13
10 13 23 18 13 13 13 9 15 23 11
11 5 5 0 0 2 0 15 19 10 12
TOTAL 37 49 54 36 34 61 61 96 71 51
14 | P a g e
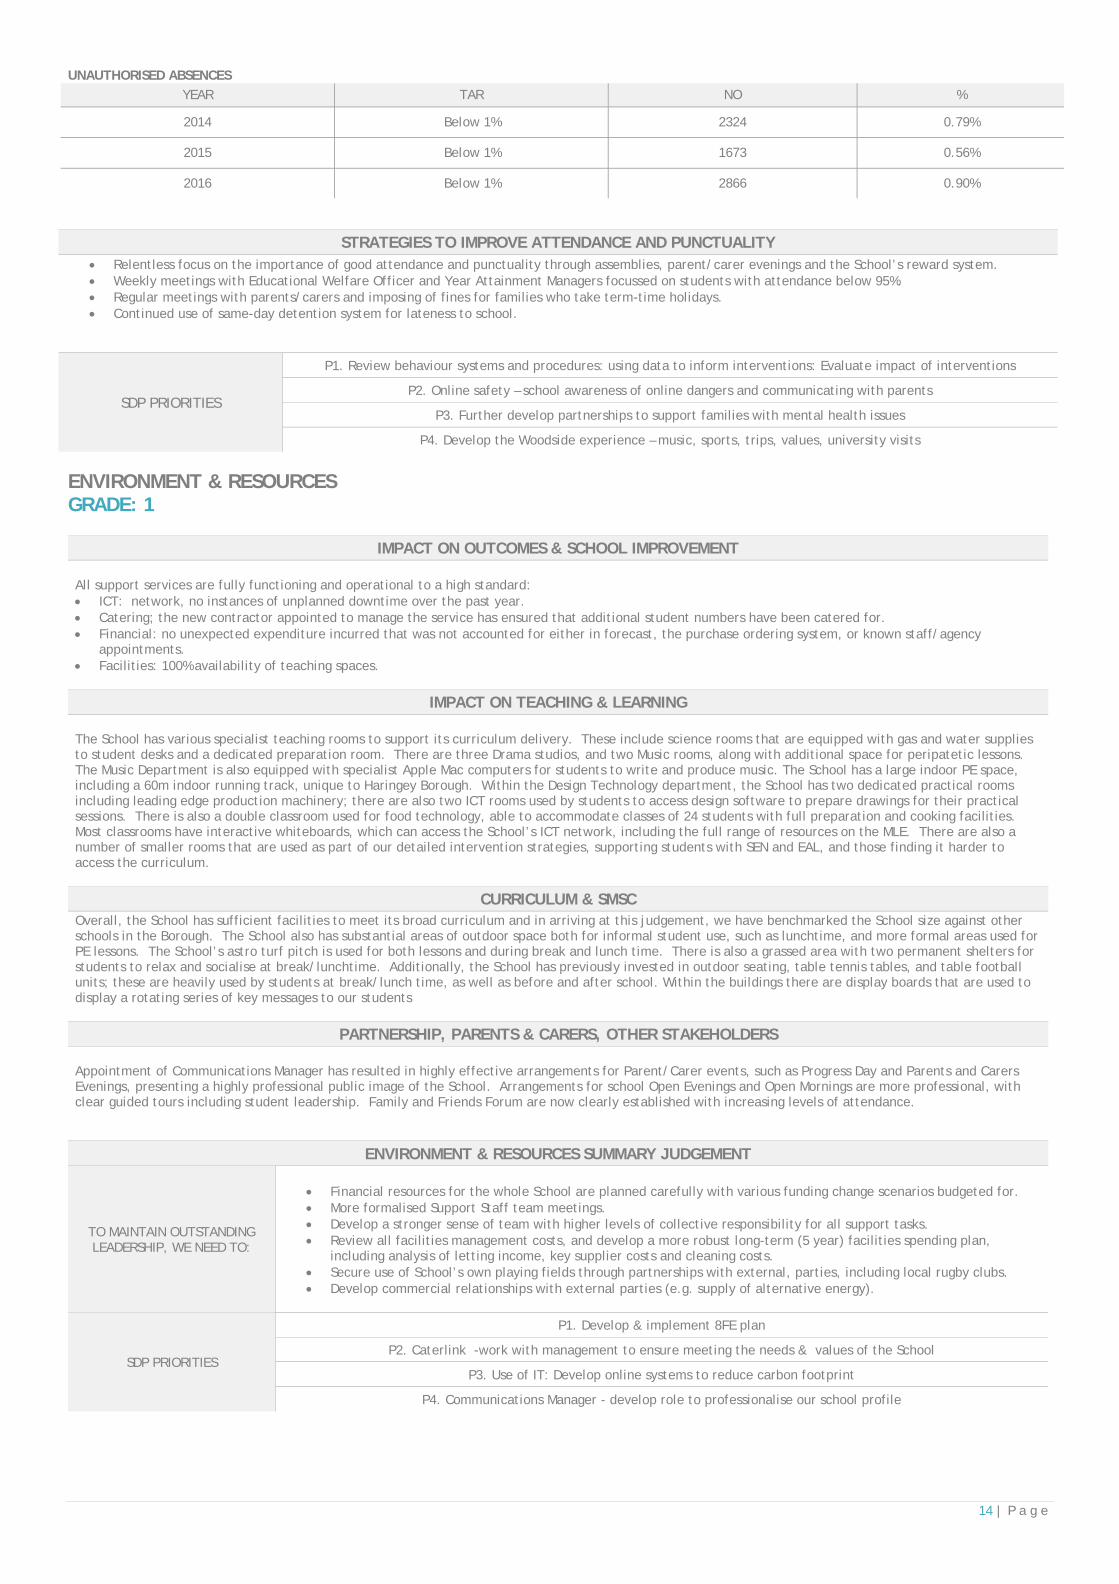
UNAUTHORISED ABSENCES
YEAR TAR NO %
2014 Below 1% 2324 0.79%
2015 Below 1% 1673 0.56%
2016 Below 1% 2866 0.90%
STRATEGIES TO IMPROVE ATTENDANCE AND PUNCTUALITY Relentless focus on the importance of good attendance and punctuality through assemblies, parent/carer evenings and the School’s reward system. Weekly meetings with Educational Welfare Officer and Year Attainment Managers focussed on students with attendance below 95%. Regular meetings with parents/carers and imposing of fines for families who take term-time holidays. Continued use of same-day detention system for lateness to school.
SDP PRIORITIES
P1. Review behaviour systems and procedures: using data to inform interventions: Evaluate impact of interventions
P2. Online safety – school awareness of online dangers and communicating with parents
P3. Further develop partnerships to support families with mental health issues
P4. Develop the Woodside experience – music, sports, trips, values, university visits
ENVIRONMENT & RESOURCES GRADE: 1
IMPACT ON OUTCOMES & SCHOOL IMPROVEMENT
All support services are fully functioning and operational to a high standard: ICT: network, no instances of unplanned downtime over the past year. Catering; the new contractor appointed to manage the service has ensured that additional student numbers have been catered for. Financial: no unexpected expenditure incurred that was not accounted for either in forecast, the purchase ordering system, or known staff/agency
appointments. Facilities: 100% availability of teaching spaces.
IMPACT ON TEACHING & LEARNING
The School has various specialist teaching rooms to support its curriculum delivery. These include science rooms that are equipped with gas and water supplies to student desks and a dedicated preparation room. There are three Drama studios, and two Music rooms, along with additional space for peripatetic lessons. The Music Department is also equipped with specialist Apple Mac computers for students to write and produce music. The School has a large indoor PE space, including a 60m indoor running track, unique to Haringey Borough. Within the Design Technology department, the School has two dedicated practical rooms including leading edge production machinery; there are also two ICT rooms used by students to access design software to prepare drawings for their practical sessions. There is also a double classroom used for food technology, able to accommodate classes of 24 students with full preparation and cooking facilities. Most classrooms have interactive whiteboards, which can access the School’s ICT network, including the full range of resources on the MLE. There are also a number of smaller rooms that are used as part of our detailed intervention strategies, supporting students with SEN and EAL, and those finding it harder to access the curriculum.
CURRICULUM & SMSC Overall, the School has sufficient facilities to meet its broad curriculum and in arriving at this judgement, we have benchmarked the School size against other schools in the Borough. The School also has substantial areas of outdoor space both for informal student use, such as lunchtime, and more formal areas used for PE lessons. The School’s astro turf pitch is used for both lessons and during break and lunch time. There is also a grassed area with two permanent shelters for students to relax and socialise at break/lunchtime. Additionally, the School has previously invested in outdoor seating, table tennis tables, and table football units; these are heavily used by students at break/lunch time, as well as before and after school. Within the buildings there are display boards that are used to display a rotating series of key messages to our students
PARTNERSHIP, PARENTS & CARERS, OTHER STAKEHOLDERS
Appointment of Communications Manager has resulted in highly effective arrangements for Parent/Carer events, such as Progress Day and Parents and Carers Evenings, presenting a highly professional public image of the School. Arrangements for school Open Evenings and Open Mornings are more professional, with clear guided tours including student leadership. Family and Friends Forum are now clearly established with increasing levels of attendance.
ENVIRONMENT & RESOURCES SUMMARY JUDGEMENT
TO MAINTAIN OUTSTANDING LEADERSHIP, WE NEED TO:
Financial resources for the whole School are planned carefully with various funding change scenarios budgeted for. More formalised Support Staff team meetings. Develop a stronger sense of team with higher levels of collective responsibility for all support tasks. Review all facilities management costs, and develop a more robust long-term (5 year) facilities spending plan,
including analysis of letting income, key supplier costs and cleaning costs. Secure use of School’s own playing fields through partnerships with external, parties, including local rugby clubs. Develop commercial relationships with external parties (e.g. supply of alternative energy).
SDP PRIORITIES
P1. Develop & implement 8FE plan
P2. Caterlink -work with management to ensure meeting the needs & values of the School
P3. Use of IT: Develop online systems to reduce carbon footprint
P4. Communications Manager - develop role to professionalise our school profile