Embed Size (px)
Citation preview
Work Ethic and Work Orientation Across Trinidad and Tobago Generational Cohorts
Paula B. Thomas
A Dissertation Submitted to the Faculty of
The Chicago School of Professional Psychology
In Partial Fulfillment of the Requirements
For the Degree of Doctor of Philosophy in Business Psychology
July 9, 2019
ProQuest Number:
All rights reserved
INFORMATION TO ALL USERSThe quality of this reproduction is dependent upon the quality of the copy submitted.
In the unlikely event that the author did not send a complete manuscriptand there are missing pages, these will be noted. Also, if material had to be removed,
a note will indicate the deletion.
ProQuest
Published by ProQuest LLC ( ). Copyright of the Dissertation is held by the Author.
All rights reserved.This work is protected against unauthorized copying under Title 17, United States Code
Microform Edition © ProQuest LLC.
ProQuest LLC.789 East Eisenhower Parkway
P.O. Box 1346Ann Arbor, MI 48106 - 1346
22624603
22624603
2019
ii
Unpublished Work
Copyright 2019 by Paula B. Thomas
All Rights Reserved
iii
Work Ethic and Work Orientation Across Trinidad and Tobago Generational Cohorts
A Dissertation Submitted to the Faculty of
The Chicago School of Professional Psychology
In Partial Fulfillment of the Requirements
For the Degree of Doctor of Philosophy in Business Psychology
Paula B. Thomas
2019
Approved By:
Kristy Wanner, Ph.D., Chairperson
Assistant Professor, Business Psychology Division, The Chicago School of Professional
Psychology
Jehanzeb Cheema, Ph.D., Member
Adjunct Assistant Professor, Business Psychology Division, The Chicago School of
Professional Psychology
Kwame Charles, Ph.D., Member
Lead Consultant, Quality Consultants Limited
iv
Permission to Reproduce Copyrighted Material
I wish to express my sincere appreciation to Assistant Professor John P. Meriac of The
University of Missouri - St. Louis for permission to utilize his Multidimensional Work Ethic
Profile – Short Form (MWEP-SF) instrument from his study “Development and validation of a
short form for the multidimensional work ethic profile” (2013). See letter of permission in
Appendix A.
I am also grateful to Professor Bryan J. Dik of Colorado State University for his
permission to utilize his Calling and Vocation Questionnaire (CVQ) from his research entitled
“Development and Validation of the Calling and Vocation Questionnaire (CVQ) and Brief
Calling Scale (BCS)” (2012). See letter of permission in Appendix B.
Finally, I extend my gratitude to Professor Tamara Hagmaier of University of Erlangen-
Nuremberg for permission to utilize her Multidimensional Calling Measure (MCM) from her
study “The multidimensionality of calling: Conceptualization, measurement and a bicultural
perspective” (2012). See letter of permission in Appendix C.
v
Acknowledgements
As I sat at my desk, gazing at the panoramic view of the City of Port-of-Spain and
struggling through the literature for countless hours to commence this dissertation, I gained a
deeper insight into how peoples’ ideas and expectations of work are influenced by their social
values. The process had me examine ways in which my own value system prepared me for the
world of work. Hence the importance of commencing this acknowledgment section with the
opposing perspectives of my both parents’ attitudes, beliefs, and approaches to work.
My father, a public servant who never had the opportunity to attend secondary school,
approached work as a means to an end, and after his retirement at age 60 had no desire to
continue working in spite of many opportunities. In direct contrast, my 86 year old mother, a
registered nurse for the last 67 years, in spite of her early stages of dementia, continues to seize
opportunities to care of the sick. Experiencing these contrasting attitudes, beliefs, and
approaches to work, and also observing the impact on their total well-being, are the foundations
for this dissertation topic, and for this, I am truly grateful to my both parents.
In order to use my own motivation to assist others to develop their motivation to work, I
must acknowledge the work of all the early researchers, especially Max Weber, Michael Miller,
Amy Wrzesniewski, William Strauss, and Neil Howe. Together their work laid the foundation
for this research study. I also extend my heartfelt gratitude to the D.C. Campus Librarian, Avril
Cunningham, who ensured that I sourced every single piece of existing literature on all my
variables. She demonstrated the epitome of what Librarians can be when they are demonstrating
the ‘presence of a calling.’ Avril, keep up the great work raising the bar for research.
Additionally, when I was engulfed in all the existing literature and just did not know how to
start, my nephew Joel mentored and coached me to break down the barriers of writer’s block and
vi
just start writing. Joel, I am truly grateful for your love, support and commitment to honing your
own craft.
As the pieces started to come together, I extend my sincere appreciation for the
commitment of my Chair, Dr. Kristy Wanner, whose patience, guidance, and support challenged
me to be more. Also, special thanks to my committee members Dr. Jehanzeb Cheema who
tirelessly worked with me to ensure that the methodology and statistical analyses sufficiently
answered the research questions; Dr. Kwame Charles, for his wisdom and expertise on the
Trinidad and Tobago (T&T) work environment and also throughout the entire study. Together,
we have created a study that will add significant value to the T&T work environment. I sincerely
appreciate their contributions.
Without the opportunity to collect data to answer the research questions, this study will
not be significant. Therefore, I wish to express my sincere gratitude to the Massy Group of
Companies for actively participating in the data collection: Gervase Warner, Group Chief
Executive Officer and President of Massy Holdings Ltd., my heartfelt thank you for your
enthusiasm to participate in this study; Julie Avey, SVP Human Resources, Massy Ltd., for your
patience, understanding and support to ensure that the data collection process was completed in
alignment with The Chicago School of Professional Psychology IRB’s approval; Gwendoline
McLaren, Tracy Awai, and Wendy Joseph, Sr. HR Professionals Massy Ltd., for your patience,
understanding and assistance with compiling the list of individuals qualified to participate in the
study; Thalia Bernard, HR Officer, Massy Motors, for all your support and assistance with the
coordination of the pilot test and the focus group session; and all the Massy employees that took
their valuable time to complete the survey. This study could not have been completed without
your invaluable contribution. It is greatly appreciated, thank you!
vii
I must acknowledge my Mother/Father God for the confidence, intelligence, strength, and
wisdom to pursue and complete this insurmountable task. I also look forward to strengthening
my faith as I pursue the opportunities to mentor and coach organizations to develop programs
that will guide their employees to be oriented to their work as a ‘calling.’
viii
Dedication
I dedicate this dissertation to my mother, Marjorie Sheila Thomas for your love, support,
and generosity throughout my doctoral journey, and also for shaping your children’s lives by
inculcating values of hard work, sacrifice, commitment, and most of all love for what you do, as
you epitomized your work as a ‘calling.’
To my nieces and nephews, Joel, Gabrielle, Raquel, Darnel, Renisse, Imani, Shari,
Thecla, Jamaal, Sarena, Mia, Cameron, Garrett, and Kali, I dedicate this dissertation to the
pursuit of your ‘calling’ as you all continue your dearest grandmother’s legacy.
Finally, I dedicate this dissertation to the Trinidad and Tobago work environment. It is
hoped that the leaders will appreciate the value of individuals oriented to their work as a
‘calling’ and embark on developing and implementing programs that will recruit individuals
with a ‘calling,’ and also coach and guide others to find their ‘calling.’
ix
Abstract
The drastic decline of the work ethic of the Trinidad and Tobago working population is plaguing
the individuals’ and organizations’ performance, thereby exacerbating the currently depressed
economy. This quantitative, predictive study was designed to determine the extent that work
orientation predicted work ethic across three generational cohorts and three industries while
controlling for education, gender, position, tenure, income, religion, and ethnicity. Utilizing a
post-positivist philosophical framework, the Protestant Work Ethic and generational theories
provided the theoretical framework for this study. Applying the non-probability, criterion
sampling technique, 1,578 employees from a sample organization in T&T were invited to
complete the survey instrument, which included the Multidimensional Work Ethic Profile- SF,
Calling and Vocational Questionnaire, and the Multidimensional Calling Measure. A total of 353
responses were received, of which 291 were used for the data analysis. The results of a
MANCOVA indicated there were no significant mean differences in work ethic and work
orientation across the three generational cohorts. The results of a four-level hierarchical
ANCOVA model indicated there were no significant two-way interaction effects. However, a
simplified main effect model indicated there was a highly statistically significant effect of
‘presence of a calling’ only on work ethic (p < .001), explaining approximately 10% of the
variance in work ethic. These results will furnish the senior executives in the sample
organization with the insights to develop recruitment, selection and retention programs
identifying and targeting individuals with a ‘presence of a calling’ to improve both the
employees’ overall well-being and organizational performance.
x
Table of Contents
Chapter 1: Nature of the Study .....................................................................................................1
Background ..............................................................................................................................1
Problem Statement ...................................................................................................................3
Purpose of the Study .................................................................................................................6
Research Questions ..................................................................................................................6
Theoretical Framework ............................................................................................................9
Generational Theory ...........................................................................................................9
Work Ethic Theory ...........................................................................................................10
Scope of the Study ..................................................................................................................10
Delimitations ....................................................................................................................11
Limitations ........................................................................................................................12
Significance of the Study .......................................................................................................13
Definition of Key Terms ........................................................................................................14
Summary ................................................................................................................................16
Chapter 2: Literature Review ......................................................................................................18
Introduction ............................................................................................................................18
Research Strategy ...................................................................................................................18
Historical Perspectives of Work .............................................................................................20
Work Ethic .............................................................................................................................26
Generational Cohorts ..............................................................................................................35
Baby Boomers ..................................................................................................................37
Generation X ....................................................................................................................38
xi
Generation Y/Millennial ...................................................................................................39
Generational Cohorts in the Work Environment ..............................................................42
Work Orientation ....................................................................................................................46
Tripartite model ................................................................................................................49
Research on the Calling Construct ...................................................................................54
Trinidad and Tobago ..............................................................................................................57
Summary ................................................................................................................................62
Chapter 3: Research Design and Method....................................................................................64
Introduction ............................................................................................................................64
Research Questions and their Rationales ...............................................................................64
Research Design .....................................................................................................................67
Population and Sample ...........................................................................................................68
Procedures ..............................................................................................................................73
Validity ...................................................................................................................................78
Instrumentation .......................................................................................................................79
Measurement Scales Variables .........................................................................................81
Demographic Variables ....................................................................................................87
Open-Ended Questions .....................................................................................................88
Reverse Scoring ................................................................................................................89
Data Collection .......................................................................................................................90
Data Processing ......................................................................................................................90
Assumptions ...........................................................................................................................96
Ethical Assurances .................................................................................................................96
xii
Conclusion ..............................................................................................................................97
Chapter 4: Findings .....................................................................................................................99
Introduction ............................................................................................................................99
Data Source and Sampling Approach ..................................................................................100
Participants ...........................................................................................................................100
Data Screening .....................................................................................................................101
Preliminary Analyses ...........................................................................................................103
Descriptive Statistics ............................................................................................................103
Demographic Variables ..................................................................................................103
Measurement Scales .......................................................................................................111
Confirmatory Factor Analysis (CFA) ...................................................................................114
Descriptive Comparison of the Original and Modified Measurement Scales ......................122
Correlation Analysis .............................................................................................................124
Quantitative Statistical Analyses ..........................................................................................131
Research Question #1 - MANCOVA .............................................................................131
Research Question #2 - ANCOVA Model #1 ................................................................132
Research Question #2a - ANCOVA Model #2a ............................................................133
Research Question #2b - ANCOVA Model #2b ............................................................135
ANCOVA Model #3 ......................................................................................................137
ANCOVA Model #4 ......................................................................................................139
Qualitative Analysis .............................................................................................................145
Data Cleaning and Coding ...................................................................................................145
Data Reduction .....................................................................................................................148
xiii
Results ..................................................................................................................................148
Results of First Open-Ended Question ...........................................................................148
Results of Second Open-Ended Question ......................................................................152
Results of Third Open-Ended Question .........................................................................155
Conclusion ............................................................................................................................159
Chapter 5: Discussion and Conclusions ....................................................................................161
Introduction ..........................................................................................................................161
Summary of the Findings .....................................................................................................161
Interpretation of the Findings ...............................................................................................162
Findings ..........................................................................................................................162
Interpretation ..................................................................................................................163
Summary ..............................................................................................................................170
Implications ..........................................................................................................................171
Implications for Theory ..................................................................................................172
Implications for Practice ................................................................................................173
Limitations ............................................................................................................................175
Recommendations for Future Research ...............................................................................177
Conclusion ............................................................................................................................180
References .................................................................................................................................183
Appendix A – Invitation to Massy Group of Companies to Participate in the Study ...............207
Appendix B – Massy’s Consent to Participate .........................................................................208
Appendix C- Institution Review Board Exempt Determination ...............................................210
Appendix D – Invitation to Participate .....................................................................................211
xiv
Appendix F– Survey Instrument ...............................................................................................214
Appendix G – Thank you Note .................................................................................................219
Appendix H – Follow-up Reminder .........................................................................................220
Appendix I – Permission and Consent to use the MWEP – SF Scale ......................................221
Appendix J - Permission and Consent to use the CVQ Scale ...................................................224
Appendix K – Permission and Consent to Utilize the MCM Scale ..........................................227
Figure L 10 – Measurement Scales’ Normality Curves by Demographic Variables ...............230
Table M 25 – Measurement Scales: Response Category Percentages by Items ......................257
Appendix N – Open-Ended Responses Consistent with Psychological Traits .........................261

xv
List of Tables
Table 1 Variable Information for MWEP-SF, CVQ, and MCM Scales ....................................... 83
Table 2 Variable Reliability for MWEP, CVQ, and MCM Goodness of Fit Models .................. 92
Table 3 Frequency Distribution for Original and Transformed Demographic Categories ......... 108
Table 4 Descriptive Statistics for the MWEP-SF, CVQ, and MCM Measurement Scales ........ 112
Table 5 Goodness-of-Fit Indicators of Models for MWEP-SF Measurement Scale .................. 115
Table 6 CFA, AVE, and MSV for the Original MWEP-SF Model-A and Model-B ................. 117
Table 7 Goodness-of-Fit indicators for Models for CVQ Measurement Scale .......................... 117
Table 8 CR, AVE, and MSV for the Original CVQ Model-A and Model B ............................. 119
Table 9 Goodness-of-Fit Indicators of Models for MCM Measurement Scale .......................... 120
Table 10 CR, AVE, and MSV for the Original MCM Model-A and Model-B .......................... 121
Table 11 Descriptive statistics for the MWEP-SF, CVQ and MCM Scales ............................... 123
Table 12 Correlations among MWEP-SF, CVQ, and MCM Scales ........................................... 124
Table 13 Correlations among MWEP-SF, CVQ, and MCM Sub-Scales Factors ...................... 126
Table 14 Correlations for MWEP-SF, CVQ, MCM and Ordinal Dem. Variables ..................... 128
Table 15 Correlations for the MWEP-SF, CVQ, MCM, and Categorical Dem. Variables ........ 130
Table 16 Multivariate Analysis of Covariance (MANCOVA) Summary .................................. 132
Table 17 ANCOVA Model #1 Summary ................................................................................... 133
Table 18 ANCOVA Model #2a Summary .................................................................................. 135
Table 19 ANCOVA Model #2b Summary ................................................................................. 137
Table 20 ANOVA Model #3 Summary ...................................................................................... 139
Table 21 ANCOVA Model #4 Summary ................................................................................... 141
Table 22 Themes, Categories, and No. of Code for 1st Open-Ended Statement......................... 149
xvi
Table 23 Themes, Categories, and No. of Code for 2nd Open-Ended Statement ........................ 153
Table 24 Themes, Categories, and No. of Code for 3rdOpen-Ended Statement ......................... 156
Table M 25 Measurement Scales: Response Category Percentages by Items ............................ 258
xvii
List of Figures
Figure 1 Research Model ................................................................................................................ 8
Figure 2 Modified Research Model .............................................................................................. 95
Figure 3 Population by Generation Cohort ................................................................................. 104
Figure 4 Population by Industry ................................................................................................. 105
Figure 5 Population by Generational Cohort by Industry ........................................................... 106
Figure 6 Final Research Model .................................................................................................. 144
Figure 7 Population by Generation Cohort for Qualitative Questions ....................................... 146
Figure 8 Population by Industry for Qualitative Questions ........................................................ 147
Figure 9 Population by Generation Cohort and Industry for Qualitative Questions .................. 148
Figure L 10 Measurement Scales’ Normality Curves by Demographic Variables .................... 231
1
Chapter 1: Nature of the Study
Background
Globally, the institution of work has been plagued with a number of different variables.
The decline of individuals’ attitudes and beliefs toward their work is one such variable. As such,
scholars have developed a keen interest in understanding how these variables impact the
performance of individuals and organizations (Meriac, Thomas, & Milunski, 2015).
A review of the historical evolution of the institution of work indicated that it
significantly contributed to the shaping of societies (Czerw, 2013). In tribal communities,
individuals worked to satisfy survival and safety needs. In ancient times, work was humiliating
for the slaves, and in the Middle Ages, it was considered punishment for original sin and also a
way to redeem sin (Czerw, 2013). During the 17th century, the perception of work changed
radically to a sacrificial character rooted in Christianity and continued into the 19th century, when
it was perceived as unpleasant and burdensome (Czerw, 2013). Consequently, in the 21st
century, there were demands to build an economy rooted in knowledge and values. This resulted
in the introduction of solidarity, cooperation, respect, and mutual obligation, hence introducing
the concept of human capital to enhance productivity and gain work satisfaction and value
(Czerw, 2013).
While the institution of work makes a significant contribution to the forming of societies,
individuals’ attitudes and beliefs toward work also reflect their fundamental value of work.
Meriac, Woehr, and Banister (2010) defined this as work ethic. Earlier, Weber (1958) was
responsible for introducing the modern perspective of the work ethic construct. Weber (1958)
conceptualized that the escalation of capitalism resulted in industrialization, which emanated
from inculcating attitudes and beliefs of hard work, conscientious use of time, and denial of
2
luxurious and worldly possessions. Weber’s work ethic principles may somewhat explain the
dynamics that contributed to improving and sustaining U.S. and European economies during a
turbulent economic depression (Zabel, Biermeier-Hanson, Shepard, Early, & Shepard, 2016).
The industrialization of the earlier societies may indicate that the work ethic of their
working population was high. However, in the late 20th century, scholars believed that the work
ethic, both in the U.S.A. and other industrialized countries, declined (Ali & Azim, 1995;
Eisenberger, 1989; Sacks, 1998). News articles and the World Economic Forum Insight Report
suggested that work ethic in Trinidad and Tobago (T&T), a developing nation, began declining
in the 1970s.
Bissessar (2012) noted that over the last 50 years the general work attitude of the T&T
working population significantly deteriorated. Charles (2016) explained that low levels of
engagement, lack of organizational commitment, high levels of absenteeism, and poor
management and organizational culture are some of the factors that contribute to the poor work
ethic in T&T. Additionally, the Global Competitiveness Index Report indicated that work ethic
elevated to the most problematic factor for doing business in T&T (World Economic Forum,
2012 - 2017). It is disheartening to experience the drastic decline of the T&T working
population’s attitudes and beliefs toward work. Applying Weber’s work ethic principle, one
could surmise that it is one of the major contributors to the currently depressed T&T economy.
The contemporary perspective on work ethic has concluded that it is directly related to
job performance (Yandle, 1992) and indirectly related to absenteeism, turnover (Klebnikov,
1993; Shimko, 1992), and counterproductive work behaviors (Sheehy, 1990). Other scholars
concluded that work ethic is not declining; instead, work ethic is significantly different across the
three generations (Baby Boomers, Generation Xer, and Yers) that are currently coexisting in the
3
workforce (Allerton, 1994; Corbo, 1997; Spiegler, 1997). Globally and more specifically in
T&T, it is expected that these generations will continue to work together for an extended period
of time. Therefore, it is critical that both scholars and professionals develop a deeper insight into
the factors that predict and explain the work ethic of the different generational cohorts.
In addition to the generational differences in the work environment that may predict and
explain work ethic, Wrzesniewski (2003) surmised that an individual’s relationship to and
ability to draw meaning from his/her work create opportunities for both the individual and
organization. The primary meaning that an individual sees in his/her work activity is
conceptualized as work orientation. Bellah, Madsen, Sullivan, Swidler, & Tipton (1985)
introduced a tripartite model (job, career, or calling) to explain this work orientation
phenomenon. Individuals with a job orientation toward work focus only on the material benefit
(Duffy & Sedlacek, 2007), those with a career orientation focus only on moving up the corporate
ladder (Duffy & Sedlacek, 2007), and those with a calling orientation focus only on the
fulfillment of doing the work, rather than advancements or financial benefits (Wrzesniewski,
2003). Recent research concluded that individuals oriented to their work as a calling reported
higher individual and work-related outcomes (Duffy, Dik, & Steger, 2011b), which may indicate
that the work ethic of those with a calling is higher than those with a job or career. This study is
therefore designed to predict work ethic and work orientation across T&T generational cohorts
employed in a major multi-national, multi-industry corporation.
Problem Statement
The problem is that the drastic decline of the work ethic of the T&T working population
is plaguing both the individuals’ and organizations’ performance, thereby exacerbating the
currently depressed T&T economy. Numerous researchers have conceptualized that Weber’s
4
Protestant Work Ethic (PWE) theory, which is grounded in the principles of hard work and
contempt for leisure, may explain how economies have improved and sustained themselves
during turbulent economic periods (Weber, 1958; Miller, Woehr, & Hudspeth, 2001; Ali, 2013;
Zabel, Biermeier-Hanson, Shepard, Early, & Shepard, 2016).
Despite all of the knowledge relating to the work ethic construct and individual well-
being and work-related outcomes (Smrt & Karau, 2011; Meriac, Woehr, Gorman, & Thomas,
2013; Christopher, Zabel, Jones, & Marek, 2008), researchers have pointed out conflicting
perspectives. Earlier, some researchers concluded that work ethic is declining (Ali & Azim,
1995; Eisenberger, 1989; Sacks, 1998) while others indicated that there is no decline, that the
situation is caused by varying perspectives of the different generations that are coexisting in the
workplace (Allerton, 1994; Corbo, 1997; Spiegler, 1997). More recently, conflicting
perspectives emerged with regards to the work ethic of the different generational cohorts that
coexist in the working environment. Some concluded that there were no generational differences
(Hite, Daspit, & Dong, 2015; Jobe, 2014; Khosravi, 2014; Real, Mitnick, & Maloney, 2010;
Zabel et al., 2016), while Meriac et al., (2010) concluded that there were generational
differences.
Contemporary researchers are urging future researchers to collect data from one sample
type, either professional or student populations, to make the comparisons between the different
generational cohorts (Zabel et al., 2016). This is significant as the effects that were determined
may emanate from the sample type as opposed to the generational cohort. Also, current
researchers are suggesting that future researchers examine generational cohorts across cultures,
particularly in a European nation. They determined this as necessary since Weber, the German
5
sociologist, explained that PWE was responsible for economic growth in both Europe and U.S.A.
(Weber, 1958; Zabel et al., 2016).
Therefore, the primary focus of this study was to determine whether work ethic can be
predicted across T&T generational cohorts and how these generational cohorts are oriented to
their work. This quantitative study, using a predictive research design, will measure the
composite scores of the seven work ethic dimensions (hard work, self-reliance, leisure, centrality
of work, morality/ethics, delay of gratification, wasted time), the three ‘presence of a calling’
dimensions (transcendent summons, purposeful work, pro-social orientation) and the three
‘experience of a calling’ dimensions (identification with one’s work and person environment fit,
sense meaning and value driven behavior, transcendent guiding force ) among members of the
three generational cohorts (Baby Boomers, Generation Xers, and Generation Yers) that are co-
existing across three industries (Automotive, Retail, and Technology) in the T&T work
environment. The Multidimensional Work Ethic Profile –Short Form (MWEP-SF), the Calling
and Vocational Questionnaire (CVQ) – Presence of Calling, and the Multiple Calling Measure
(MCM) will be used to collect data. The sample will be drawn across three industries
(Automotive, Retail, and Technology) from a major multi-national, multi-industry corporation
located on the twin island of T&T.
It is therefore expected that the results of this study will provide the insights that will lay
the foundation for scholars and practitioners to develop and implement more sustainable
recruitment, retention and motivational programs and strategies. The researcher is hopeful that
the implementation of these programs and strategies should improve the overall well-being of
individuals in the work environment, the productivity and profitability of organizations, and the
overall T&T economy.
6
Purpose of the Study
The purpose of this predictive quantitative research design is to predict work ethic and
work orientation across the generational cohorts employed in a major multi-national, multi-
industry corporation in the twin islands of T&T.
Research Questions
Two research questions guide this study, with the second question having two parts:
1. What are the differences in work ethic and work orientation among T&T generational
cohorts employed at a major multi-national, multi-industry corporation, controlling for
the demographic variables?
2. a. Does work orientation predict work ethic across T&T generational cohorts employed at
a major multi-national, multi-industry corporation, controlling for demographic
variables?
2. b. Does work orientation predict work ethic across three industries at a major multi-
national, multi-industry corporation in T&T, controlling for demographic variables?
For the first research question, generational cohort is the only independent variable (IV).
The three dependent variables are work ethic and the two variables associated with work
orientation (presence of a calling and experience of a calling). The eight covariates are industry,
education, gender, position, tenure, income, religion, and ethnicity.
The first part of the second research question has two independent variables. They are
the two variables associated with work orientation (presence of a calling and experience of a
calling). The dependent variable is work ethic, and the covariates are generational cohorts and
the seven demographic variables (education, gender, position, tenure, income, religion, and
ethnicity).
7
The second part of the second research question has two independent variables. They are
the two variables associated with work orientation (presence of a calling and experience of a
calling). The dependent variable is work ethic, and the covariates are industry, education,
gender, position, tenure, income, religion, and ethnicity. Figure 1.1 depicts a graphical
illustration of the study’s research model.

8
Demographic
Variables
Industry
Auto, Retail, Tech
Generational
Cohorts
B/B, Xers, Yers
Work Orientation
Presence of a
Calling
Work Orientation
Experience of a
Calling
Transcendent
Summons (4)
Purposeful
Work (4)
Work
Pro-Social
Orientation (4)
MCM-IP
(3)
MCM-TGF
(3)
MCM- SMVB
(3)
Work
Ethic
Wasted
Time (4)
Centrality of
Work (4)
Morality
/Ethic (4)
Leisure (4)
Gratification
(4)
Hard Work
(4)
Self-
Reliance (4)
Figure 1. The Research Model illustrates the expected relationships between the independent variables, covariates and the dependent variable.
9
Theoretical Framework
The purpose of a theoretical framework is to identify clearly what the study will explore,
examine, measure or describe utilizing a logical structured representation of the concepts, variables,
and relationships that will be included in the scientific study (Desjardins, 2010). The researcher
will be utilizing a post-positivist perspective to engage in the study. The post-positivist perspective
is grounded on the rationale that knowledge is obtained through direct observation and
measurement of the phenomenon (Babbie, 2013). The post-positivist perspective will ensure that
the study is free from the researcher’s core values, ideologies, politics, and passions while engaging
in the scientific method to examine and document human experiences (Ryan, 2006). It will be
accomplished by observing real events empirically and using logical analysis to explain the
phenomenon.
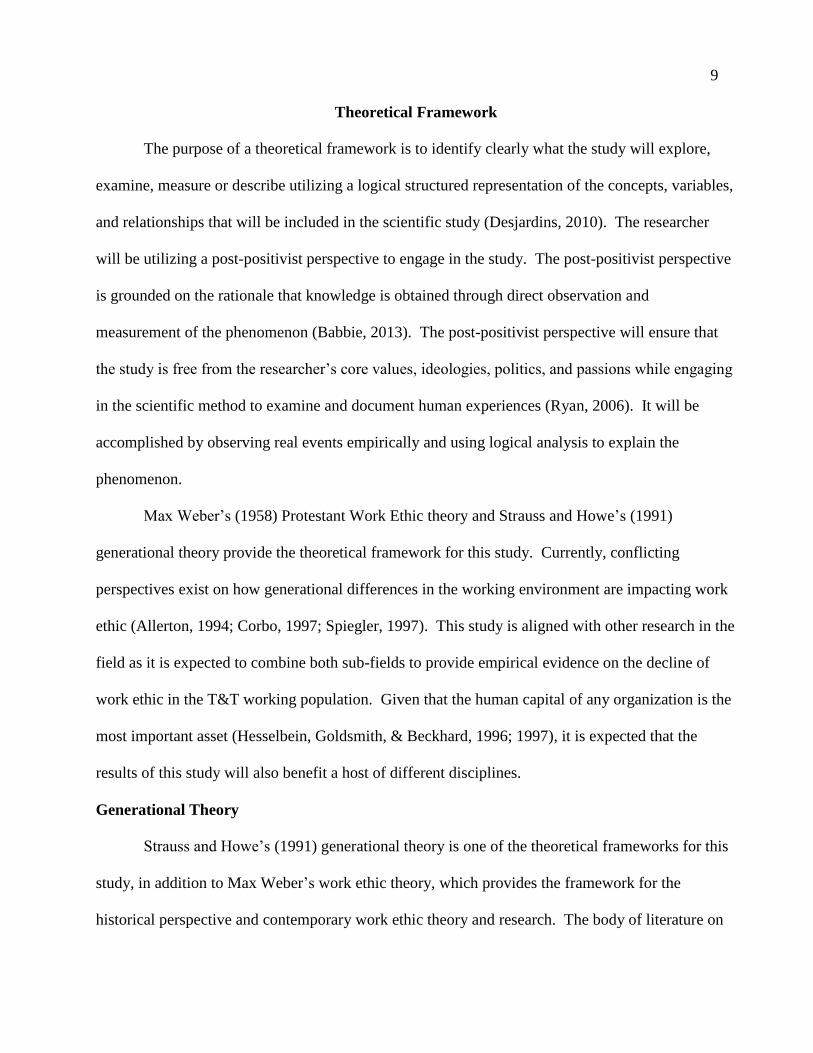
Max Weber’s (1958) Protestant Work Ethic theory and Strauss and Howe’s (1991)
generational theory provide the theoretical framework for this study. Currently, conflicting
perspectives exist on how generational differences in the working environment are impacting work
ethic (Allerton, 1994; Corbo, 1997; Spiegler, 1997). This study is aligned with other research in the
field as it is expected to combine both sub-fields to provide empirical evidence on the decline of
work ethic in the T&T working population. Given that the human capital of any organization is the
most important asset (Hesselbein, Goldsmith, & Beckhard, 1996; 1997), it is expected that the
results of this study will also benefit a host of different disciplines.
Generational Theory
Strauss and Howe’s (1991) generational theory is one of the theoretical frameworks for this
study, in addition to Max Weber’s work ethic theory, which provides the framework for the
historical perspective and contemporary work ethic theory and research. The body of literature on
10
generational theory has varying perspectives, particularly with respect to the validity of how the
generations were categorized and the ability to predict the generations’ behaviors and beliefs. Some
generational theorists articulated their concerns over changes in the members of Generation Xers’
and Yers’ work attitudes and beliefs. However, others are optimistic, describing Generation Yers as
“a good news revolution” (Howe & Strauss, 2000, p. 7).
Work Ethic Theory
Max Weber’s classic work ethic theory focused on the economic development of the
Western World. The two-part classic essays written by Weber in 1904 and 1905, The Protestant
Ethic and the Spirit of Capitalism, were used as the framework for both the non-Marxist analysis of
capitalism and the most contemporary work ethic discussions (Clegg, Hardy, & Nord, 2002). The
work ethic theory was developed on the principle that western capitalism was not totally dependent
on economic forces (Weber, 1958) but also hard work and the dedication of the Puritans. A number
of different factors were identified by Weber that contributed significantly to the economic
development in Europe and U.S.A. Some of these factors are the religious beliefs of the Puritans
and also other Protestant Christians. In the 20th century, Weber’s Protestant Work Ethic theory
stimulated widespread attention (Furnham, 1987). Researchers, including Weber himself, began
questioning the religious orientation with regards to the work ethic theory (Miller, Woehr, &
Hudspeth, 2001).
Scope of the Study
The purpose of this section is to assist in identifying the delimitations and limitations that
can impact or restrict the analysis and methodology of the research data (Neill, 2016). The
delimitations and limitations of this study are explained in detail below.
11
Delimitations
In designing the study the researcher selected six parameters in relation to the participants.
1) They should be permanently employed with the target organization, 2) they must have been born
between 1940 and 1993, 3) they must be at least 25 years old, 4) they must be literate, 5) they must
be computer literate, and 6) they must have an e-mail address. A more detailed explanation of each
of the parameters is explored below.
The first delimitation of the study is that participants must be permanently employed with
the target organization. The target organization was selected as it is a major multi-national, multi-
industry corporation, representing six different industries under one umbrella. It also provided the
opportunity to select three different industries (Automotive, Retail, and Technology), hence
representing a broader cross-section of the T&T work environment.
The researcher determined that participants who are permanently employed may enjoy
richer experiences as they have the opportunity to reap the benefits of promotional opportunities,
training and development, and employee benefits which may significantly impact their work ethic.
Another delimitation of the study is participants’ year of birth, which will assign them to
one of three generational cohorts. Baby Boomers are individuals born between 1940 and 1959,
Generation Xers are individuals born between 1960 and 1980, and Generation Yers are individuals
born between 1981 and 1993. Assignment to one of the three generational cohorts is mandatory for
this study based on the research problem and the research questions. All people outside of these
age ranges will not be included.
The third delimitation of the study is that participants must be at least 25 years old.
Professional attitude and habit formation, according to Seashore (1923, p. 227), is developed over
time and is evident in individuals from the age of 25. It is therefore assumed that participants who
12
have attained the age of 25 would have inculcated the work attitudes and habits that are critical for
the outcome of this study.
The questionnaire will involve participants reading, comprehending, and selecting
appropriate responses. It is therefore mandatory to include only participants that are competent in
reading and writing. Thus, the fourth delimitation of the study is individuals who are literate. The
survey will be administered using SurveyMonkey, an online platform. Therefore, the fifth
delimination of this study is that participants must be computer literate. Given that an invitation to
participate will be emailed to individuals, it is therefore mandatory for them to have email
addresses. This is the sixth delimitation of the study.
Limitations
In designing the study, the researcher identified five limitations that may impact the results
of the study. They are 1) the quantitative nature of the study, 2) the sample size, 3) willingness of
participants to report their true feelings, perceptions, and beliefs, 4) exposure to participants’ biases,
and 5) low response rates. Details of each of the five limitations are discussed below.
The first limitation is the methodology selected for the study. Utilizing the quantitative
approach will hinder the researcher from exploring in depth what the respondents mean by their
responses, hence losing the richness of the data collected. To diminish this limitation, the
researcher has included three open-ended questions at the end of the survey instruments. This
strategy will provide the opportunity to delve deeper into these three items. Secondly, the scope of
this study is limited to the sample size. As the participants may not be a representative sample of
all workers in T&T, the results cannot be generalized beyond the stated population. Thirdly, the
findings will be limited to the extent that participants are willing to report their true feelings,
perceptions, and beliefs. A possibility exists that the participants’ responses might be influenced by
13
their personal definitions, and they may also be inclined to provide socially desired answers.
Fourthly, participants may be inclined to second guess the purpose of the study and provide a
response that they think is most appropriate, thereby leading to participant’s bias. Lastly, the study
is relying on self-reported instruments that may have low response rates, misunderstanding of
questions, and inability to explore answers if needed. These five limitations pose threats to both the
internal reliability and validity of the study.
Significance of the Study
The primary purpose of this study is to examine the differences in work ethic and work
orientation (presence of a calling and experience of a calling) across generational cohorts, as well as
three industries in a major multi-national, multi-industry corporation located in T&T. It is expected
that the results of this study will make significant and unique contributions to scholars and
practitioners both locally and internationally.
Over the last 50 years, work ethic has been gradually declining among the T&T working
population. No reported empirical studies have been conducted to gain a deeper insight into the
factors that impact work ethic in T&T (Bissessar, 2012; Charles, 2016). This study is therefore
unique as it is the first empirical study designed to examine work ethic across generations in T&T.
Furthermore, the researcher only located four published empirical studies that examined
generational cohort and work ethic across cultures over the last seven years within the databases
reviewed. Therefore, this study will increase the knowledge base of work ethic and generational
cohort across cultures and ethnic groups.
Work orientation is a relativity new construct with a significant number of empirical and
published studies conducted in the U.S.A. since 2007. In spite of the growing interest in the
construct, the researcher was not able to locate any empirical studies that examined both work
14
orientation and generational cohort. This will be the first study to examine generational cohorts and
work orientation in T&T.
Similarly, within the databases reviewed, no published empirical studies in T&T or
elsewhere investigated the three variables generational cohort, work orientation (presence of a
calling and experience of a calling), and work ethic together. This study is unique as it is the first
time that these three variables (generational cohort, work ethic, and work orientation) may be
examined together in any part of the world and more specifically in T&T.
The results of this study will provide deeper insights to enable scholars in the field to
improve the knowledge of work orientation and work ethic, thereby improving the performance of
both individuals and organizations. It will provide practitioners in the field with the insights that
should assist them in developing and implementing programs designed to improve the overall work
experiences of the working population. Additionally, it should be valuable in understanding the
working relations, diversity, and inclusion across generations, particularly where one generation
supervises another.
The results of this study should also provide the target organization’s executive team with
guidance in developing and implementing alternative recruitment, selection, retention, and
motivational programs. These programs should be designed to meet the needs of the three
generational cohorts co-existing in their workforce.
Definition of Key Terms
The key terms of this study are defined as follows:
Calling: as performing work for the fulfillment of doing the work, and not for career
advancements or financial benefits. For example, individuals approaching work as a calling is
15
typically associated with the belief that the work they engage in contributes to a greater good while
making the world a better place (Wrzesniewski et al., 2003).
Experience of a calling: as individuals encountering their work as a calling from a higher
force, performing their job to their highest potential, while displaying moral and ethical values
(Hagmaier & Abele, 2012).
Identification with one’s work: as performing a job which belongs to the self and the full
potential realized (Hagmaier & Abele, 2012).
Presence of a calling: as individuals encountering their work as a broarder sense of purpose,
assisting the larger society, and as a calling from an external source beyond the self (Duffy & Dik,
2013a).
ProSocial Orientation: as individuals using their career to directly or indirectly assist the
larger society (Duffy & Dik, 2013a).
Purposeful Work: as approaching work with a broarder sense of purpose (Duffy & Dik,
2013a).
Transcendent Summons: as experiencing work as a call from an external source of a higher
power beyond the self (Duffy & Dik, 2013a).
Transcendent guiding force: as a call received from a higher force (Hagmaier & Abele,
2012).
Value Driven Behavior: as the moral and ethic values that influence an individual’s work-
related behavior (Hagmaier & Abele, 2012).
Work Orientation: as the framework an individual uses to make meaning of their work, how
they are likely to perform their job in alignment with these meanings, and the primary purpose of
16
them working (Peterson, Park, Hall, & Seligman, 2009; Scott Morton & Podolny, 2002;
Wrzesniewski & Dutton, 2001).
Summary
Work constitutes an essential role in peoples’ lives. However, it is experienced differently.
Varying perspectives explain this phenomenon. Earlier researchers have identified that individuals’
attitudes and beliefs toward their work (Miller et al., 2001), how they are orientated to their work
(Wrzesniewski, 1999; Dik & Duffy, 2009), and the period of time in which they were born (Strauss
& Howe, 1991) are significant contributors. As such, these variables are being examined in this
study. The discourse below provides a summary of each chapter of this study.
The first chapter commenced with a broad overview of the institution of work and highlights
the decline of work ethic as one of the critical factors plaguing the work environment globally.
Consequently, the researcher conceptualized the core problem of the study as the gradual decline of
work ethic plaguing the three generational cohorts that currently co-exist in the T&T work
environment and possibly hindering the rejuvenation of the recently depressed T&T economy. As
the problem of the study was conceptualized, the research questions, theoretical framework, and
scope of the study were later formulated. Finally, the uniqueness and significance of the study were
discussed.
An extensive and critical review of the relevant literature on work ethic, generational cohort,
work orientation, and some aspects of T&T that were relevant to the study can be found in Chapter
2. Weber’s Protestant Work Ethic theory (1958) was used as the foundation for the work ethic
construct, while Strauss and Howe (1991) generational theory were used to provide the context for
the generational cohorts. As such, Chapter 2 critically reviews the literature of both Weber’s PWE
theory and Strauss and Howe generational theory to provide the framework for the study.
17
The study utilized a predictive research design to answer the research questions. Therefore,
the third chapter explains in detail the steps involved in determining the population and sample size,
the procedures and instruments, and how the data was processed and analyzed using MANCOVA
and ANCOVA. The chapter concludes with a discussion on the validity, assumptions, limitations,
delimitations, and ethical consideration involved with the study.
Chapter 4 provides a description and summary of the statistical analyses that were used to
evaluate the research questions established in Chapter 1. It commences with an explanation of how
the data was sourced, the sampling approach, and participants. The chapter continues with
descriptions of the data screening process and preliminary analyses that were conducted, which
includes descriptive statistics, confirmatory factor analysis, and correlations. The chapter concludes
with quantitative and qualitative analyses. The quantitative statistical analyses were conducted to
answer the researcher’s questions, while the qualitative analysis of the three open-ended questions
will be used to provide deeper, richer meaning to the quantitative analyses.
The study concludes with Chapter 5, which draws conclusions from the results of the study,
and provides a detailed analysis of the limitations of the study and recommendations for future
research.
18
Chapter 2: Literature Review
Introduction
The review of the literature presented in this chapter begins with an explanation of the
research strategy used to examine all the relevant and emerging literature on work ethic,
generational cohorts, work orientation, T&T economic climate, and the work ethic of the T&T
working population. The literature review commences with a historical perspective of work,
definitions, and measurements of work ethic. It concludes with a thorough explanation of both the
Multi-dimensional Work Ethic Profile (MWEP) and the Multi-dimensional Work Ethic Profile-SF
(MWEP-SF) instruments. The chapter continues with defining and examining the generational
theory and concludes with a detailed explanation of the three generational cohorts that co-exist in
the T&T work environment. Work orientation, the next section of the chapter, commences with an
explanation of the meaning and meaningfulness of work, the tripartite model of work (job, career,
and calling), how calling is conceptualized and defined. The section concludes with a summary of
the results of the research on work as a calling. The chapter closes with a historical review of
T&T’s current economic climate and the evolution of the work ethic of its working population.
Research Strategy
To answer the research questions, a review of the literature was conducted using seven
aggregate databases via The Chicago School of Professional Psychology's Library located at
library.thechicagoschool.edu. A brief description of each of these databases follows. ProQuest
Central is the largest aggregated database of periodical content, covering more than 160 subject
areas. EBSCO Academic Search Elite is a multi-disciplinary database providing full text for more
than 4,600 journals, including full text for nearly 3,900 peer-reviewed titles. SAGE Knowledge is
the ultimate social sciences digital library for students, researchers, and faculty. PsycINFO is the
19
largest database devoted to peer-reviewed literature in behavioral science and mental health. Taylor
& Francis Social Sciences and Humanities Library provides access to over 1,400 online journals
from Routledge, the pioneering social science, and humanities publisher. WorldCat Local is the
largest network of library content and services dedicated to online access. Google Scholar provides
a simple way to search across many disciplines and sources for scholarly literature.
Searches were executed with the phrases “Trinidad and/or Tobago” and "work ethic" or
"work orientation" or "generational cohorts." Other keywords that were used to execute additional
searches were “work orientation,” “experience a calling,” “job, career, and calling,” “calling,”
“generational cohorts,” “generations,” “millennials,” “baby boomers,” “generational X,”
“generation Y,” “work ethic,” “work ethics,” “work ethic/s in Trinidad and Tobago,” “labor in
Trinidad & Tobago,” and “history of Trinidad &Tobago’s economy.”
These searches revealed that a plethora of empirical research has been conducted on work
ethic globally, whereas only a couple have been conducted in the Caribbean region in general.
However, an exhaustive search yielded that no scholarly literature currently exists on work ethic in
T&T specifically. Instead, the results of the search revealed only normative statements regarding
the state and concern of work ethic in the twin islands. Currently, no formal study has been
completed on work ethic in T&T, which is one of the main motivations for this study.
Similar to work ethic, in excess of 750 research studies have been conducted on generational
cohorts in the U.S. work environment, but no formal research exists on generational cohorts in
T&T. In contrast to work ethic and generational cohorts, no empirical research studies appeared to
exist on work orientation or ‘calling’ prior to 1994. However, while some evidence indicates that
less than 10 empirical studies were conducted over the last 20 years, most of the research has only
been conducted within the last five years. This point emphasizes that scientifically-derived
20
knowledge of what it means to have a ‘calling’ is new and is a work in progress. Similar to work
ethic and generational cohorts, no research has been conducted on work orientation or ‘calling’ in
T&T. After an in-depth study of the literature, the researcher has concluded that no evidence exists
of empirical studies conducted anywhere in the world that explore the relationship between
generational cohort/s, work orientation, and work ethic together. This demonstrates a gap in the
literature and therefore justifies the uniqueness of this study. To get a deeper insight into the work
ethic construct, the next section reviews the historical perspectives of work ethic that were revealed
in the research.
Historical Perspectives of Work
The observable differences in the meaning of work can be traced across societies, cultures
and historical periods. The traditional Judeo-Christian perceived heaven as eternal and work as
punishment for Adam and Eve’s sins (Rodgers, 1974). Other societies such as the Greeks,
Hebrews, and Romans also perceived the institution of work with the same scorn and disdain as the
Judeo-Christians (Rodgers, 1974). The medieval period shifted the experience of work from scorn
and disdain to independence through earnings. This new trend of work was later endorsed by St.
Thomas Aquinas on the condition that any surplus wealth was shared with the less fortunate
(Rodgers, 1974).
Slavery, (1501-1865) the period of human chattel enslavement, introduced another
perspective of work. During this period the slaves were alienated from their communities and were
forced to acculturate into new communities. Work for them was alienation, exploitation, and
severely harsh treatment (The Abolition Project, 2009). However, slavery made a significant
contribution to the economy of the society (Williams, 1994).
21
The Protestant Reformation (1517-1559), a turbulent period in Western Europe in the 16th
century, was responsible for another shift in the perspective of work. Martin Luther introduced the
concept of work as the best way to serve God as individuals were encouraged to pursue their
“calling” with spiritual dignity (Yankelovich, 1974). Also, in the 16th century, John Calvin was
responsible for another shift in the perspective of work. He introduced a moral connection between
work and God referred to as “God’s work.” He encouraged individuals to work methodically,
unceasingly and believe that only those who were the predetermined elect had the potential to go to
heaven. Since it was impossible to identify the elects, success in worldly possessions implied
inclusion to heaven, and idle individuals were doomed to damnation (Porter, 2004).
Gayle Porter, Professor of Management at Rutgers University and professional training &
coaching consultant, explained that while the principles of the PWE were maintained after the
Puritan colonization of America, the emphasis on religion was replaced with national virtues and
social duty (Porter, 2010). Benjamin Franklin (1732) introduced virtues that became popular.
These virtues are moderation, frugality, industry, justice, chastity, humility, resolution, cleanliness,
sincerity, temperance, silence, tranquility, and order (Porter, 2010, p. 538). During the period of
pre-industrial America (1750-1850), while businesses functioned much more leisurely, they
promoted Franklin’s virtues (Porter, 2010). Transitioning from the pre-industrial period to the
industrial ages between the 18th and 19th century, people continued to combine both leisure and
work (Laurie, 1979).
In the early 19th century, American settlers needed to engage in hard labor for their survival.
They viewed this hard work as a privilege, glory, and delight, as opposed to a burden and a bare
necessity (Rodgers, 1974). These beliefs of hard work and self-denial associated with Protestantism
were the framework of Weber’s Protestant Work Ethic (PWE; Weber, 1958). Weber’s PWE was
22
considered the central value system after the Reformation period in Western civilization and also
forms the foundation for the more contemporary perspective of work ethic (Howard, 1982).
German scholar and influential thinker, Max Weber (1864 – 1920), in his essay, The
Protestant Ethic and The Spirit of Capitalism, originally published in 1904 and 1905, introduced the
concept of the PWE (Weber, 1958). Weber’s Protestant work ethic was characterized as physically
taxing, over long periods, no leisure time, pride in one’s work, focusing on achieving, acquiring
wealth, frugality, thrift, and wise investments (Cherrington, 1980). These characteristics of the
PWE provided the rationale for wealth accumulation, thereby contributing to the rise in capitalism
(Weber, 1958).
Hard work appears to be entrenched in Weber’s Protestant Work Ethic, which is grounded
in beliefs that are commonly associated with the Quakers and Puritans. These beliefs include
industriousness, asceticism, and self-discipline, and were usually instilled as family values (Weber,
1958). Religious doctrines, extended family, and the education system are also responsible for
instilling work values in the communities’ youths (Weber, 1958).
In spite of Weber’s original PWE concept that was rooted in religious doctrines, the
evolution of capitalism that focused on wealth accumulation eliminated the support of religious
beliefs (Miller et al., 2001). The PWE is therefore no longer associated with Protestant religious
beliefs or preferences (Miller et al., 2001). Weber (1958) explained that the values associated with
work ethic were entrenched more in social as opposed to religious beliefs. This point is supported
by the responses to the 1950’ classic ‘lottery question’ that was posed to individuals from
representative labor samples across a variety of occupations and countries. The results revealed that
65-95% of respondents agreed that if they won the lottery or inherited a large sum of money to live
comfortably, they would continue to work regardless of their economic need (Harpaz, 1990; 1999;
23
Kaplan & Tausky, 1974; Morse & Weiss, 1955; MOW International Research Team, 1987; Parker,
1971; Warr, 1982).
While research failed to establish a consistent relationship between religious orientation and
work ethic beliefs (Beit-Hallahmi, 1979; Cameron, 1969; Featherman, 1971; Giorgi & Marsh,
1990; Glenn & Hyland, 1967; McHoskey, 1994), it was concluded that all religious orientations
stressed the importance of work (Ray, 1982). Other contemporary work ethic theorists have also
made similar contributions to this side of the debate. Ray (1982) concluded that the “Protestant’s
ethic is certainly not dead, it is just no longer restricted to Protestants” (p. 135). Miller et al., (2001)
concluded that work ethic initially perceived as a religious construct is more likely to be secular,
being viewed more as general work ethic and not PWE. Additionally, a global study exploring the
‘Meaning of Work’ conducted in the 1980’s by the MOW International Research Team (1987)
assessed the importance of work in people’s lives. In comparison to other aspects, work was ranked
first in two of the eight countries and second to family in the other six. Therefore, the meaning that
individuals attribute to their work attitude and values are central to their core existence.
During the pre-industrialized period and the beginning of the industrialized period the
struggle was to be better than the previous generation. However, from the mid-19th century,
industries instead competed for market share (Lasch, 1979). This new shift gave birth to the
management of interpersonal relations. The new paradigm focused on accomplishing personal
advancement and self-testing, the primary benchmark for personal worth (Porter, 2010). The PWE
virtues survived as instrumental values that provided the means to accomplish the overall goal, but
they were not the end goal (Porter, 2010).
With the rapid growth of mills and factories in the 19th century, management’s focus shifted
from efficiency to craft, and workers perceived that industrialization would upset the certainty that
24
hard work brought economic success (Rodgers, 1974, p. 28). While the industrial era brought an
improved standard of living for the middle class, it also propelled longer hours of uninterrupted
work. This further created the possibility of an unemployment dilemma in economic uncertainties
(Eisenberger, 1989). Scholars explained that misalignment between individuals’ hard work and
their inability to control their destiny was the first contributor to the diminishing of work ethic in
the U.S. (Porter, 2010).
Later, Taylor’s scientific management (1909) brought a new perspective to work. It was
seen as a necessary evil and idleness was considered a luxury (Eisenberger, 1989). In 1913, Henry
Ford’s 380% workforce turnover signaled a shift of workers’ values from intrinsic to economic
(Zuboff, 1983). The economic focus gave birth to the rise of capitalism and the separation between
an owner and management of an enterprise (Porter, 2010).
During the 1930s, scholars shifted their concentration and introduced behavioral
management theories. The behavioral management theories focused on the art of getting things
done through and with people in formally organized groups. Additionally, they created an
environment for individual performance while contributing to overall organizational goals (Koontz,
1961).
Simultaneously, the 1930s also experienced a decline in work ethic as the workers’ working
hours were reduced and their leisure time increased (Porter, 2004). This work ethic decline
continued in the 1950s as the emphasis shifted from production to consumption (Porter, 2004).
After World War II, the economy expanded, affluence increased, and the labor movement ensured
that workers had more leisure time (Porter, 2004).
The downward spiral of work ethic continued in the U.S.A. in the 1960s as the availability
of good paying jobs was taken for granted, and a steady increase in the standard of living was an
25
expectation (Porter, 2004). Cherrington (1980) concluded that work ethic declined in the U.S. to
almost nothing in the late 1960s and re-emerged in the 1970s. Scholars in the 1970s determined
that the work ethic decline emanated from individuals focusing more on their self-fulfillment as
opposed to organizational advancement, which was often perceived as a lack of ambition (Porter,
2004).
As the work ethic of the U.S. working population declined in the 1970s, scholars and
professionals developed a keen interest in understanding the variables that predicted and explained
work ethic. As such, research burgeoned after the 1970s with the development of formal
instruments to measure work ethic. A brief overview of some of these studies concluded that the
decline of work ethic was directly related to job performance (Yandle, 1992) and indirectly related
to absenteeism, turnover (Klebnikov, 1993; Shimko, 1992), and counterproductive behavior
(Sheehy, 1990). Some researchers presented a conflicting perspective, concluding that work ethic
is not declining, but the attitudes and beliefs of Generation Xers are different than those of the
earlier generations (Allerton, 1994; Corbo, 1997; Spiegler, 1997). In the early 21st century
researchers examined work ethic across career stages (Pogson, Cober, Doverspike, & Rogers, 2003;
Van Ness, Melinsky, Buff, & Seifer, 2010), culture (Woehr, Arciniega, & Lim, 2007), and gender
(Meriac, Poling, & Woehr, 2009). The results revealed some differences across career groups,
similarities across cultural groups, and no significant differences between the gender groups. These
studies were conducted mainly in the U.S.A. and more developed nations, however, as mentioned
earlier, no evidence of empirical studies conducted on work ethic and the T&T working population
was found.
The previous section examined the historical perspectives of work based on research
conducted primarily in the U.S., and it provided the foundation for this study. It was also used as
26
the background for the next section, which examines the work ethic construct, as it has been
understood in social and academic realms, over the last 40 years.
Work Ethic
Business leaders and decision-makers are, now more than ever, focused on their employees’
work ethic. As previously mentioned, from the 1930s to the 1970s, scholars and business leaders
recognized a decline of work ethic among the working population in America and Canada (Ali &
Azim, 1995; Eisenberger, 1989; Sacks, 1998). News articles and the World Economic Forum
Insight Report points to a decline of work ethic in the twin islands over the last 50 years (Bissessar,
2012; Charles, 2016; World Economic Forum, 2012 - 2017).
So, how is work ethic understood and explained today from a research perspective? To
really understand work ethic as a research concept (what is known as a construct), we must first
define ‘work,’ and ‘ethic,’ and then the construct of ‘work ethic.’
Work is a universal phenomenon that varies in usage from formal activities to informal
activities (Osibanjo, Akinbode, Falola, & Oludayo, 2015). Within the context of this study, a
widely used definition of work is any physical and/or mental activity which converts natural
resources into a more valuable form, increases the knowledge and understanding of the world, and
provides/distributes goods and services to others (Kuper & Kuper, 1996). Economics is the primary
function of work. Employees are responsible for converting natural resources (raw material and
labor) into goods and services that are expected to be sold at a profit. In return, they expect to
receive a salary for meeting their employers’ expectations (Osibanjo et al., 2015).
Ethic, on the other hand, is derived from the Greek word “ethos,” meaning “character or
custom.” Ethic, according to Malloy (2003), is the study of human behavior with reference to the
behavior that is expected from an individual within a given context or setting. In contrast to Malloy
27
(2003), Huberts, Kaptein, and Lasthuizen (2007, p. 589) defined ethic as “the collection of values
and norms that function as standards or yardstick for assessing the integrity of individual conduct.”
It is also responsible for defining “right or wrong behaviors” (Fajana, 2006). Pojman (2006)
identified four characteristics that conceptualize ethic. They are actions (right, wrong, permissive),
consequences (good, bad, indifferent), character (virtuous, vicious), and motives (goodwill, evil
will). So, then, how are the words, work and ethic defined as a construct together?
In the field of I/O psychology, the work ethic construct has a number of different
definitions, causing some disparity. Originating from Weber’s work, current scholars view work
ethic as an attitudinal construct pertaining to work-oriented values (Miller et al., 2001, p. 4).
Cherrington (1980), in contrast to Weber, described work ethic as a “feeling of pride and
craftsmanship and a moral obligation towards producing a product/service valuable to society”
(Cherrington, 1980, pp. 627-628). In the absence of a universally accepted definition, an article
published in the Journal of Vocational Behavior in 2001, called “The Meaning and Measurement of
Work Ethic: Construction and Initial Validation of a Multidimensional Inventory” by Miller et al.
(2001) provided a useful one. Miller et al. (2001) defined it as “reflecting a collection of
individuals’ attitudes and beliefs toward work in general and not with reference to a specific job”
(Miller et al., 2001, p. 5).
The description of work ethic by Weber (1958) and Miller et al. (2001) were comparable
with respect to the attitudinal construct. However, Miller and his colleagues (2001) provided a
deeper insight into the context of work. They explained that it was not about a specific job, but
rather about the individual’s attitude towards work in general Miller et al. (2001, p. 5). How
individuals’ attitudes towards their work impact their individual and work-related outcomes will be
reviewed below.
28
The effort that an individual is motivated to undertake towards his/her work is significantly
subjective and considered an attitude toward work (Czerw & Grabowski, 2015). As discussed in
more detail above, a summary of the evolution of work across the centuries revealed that each era
shaped a perception of work that was inculcated by its members of society. The more
contemporary perception of work can be linked to the historical evolution of work attitudes. In an
employee’s eyes, work fulfills various functions, thereby inculcating different attitudes. The first is
a punitive attitude, which is perceived as an imposed behavior and linked to a feeling of unjust
exploitation. The second, an instrumental attitude, is defined as a pragmatic attitude where
employees appreciate the material advantages of working. The third is an autotelic attitude.
Employees inculcating this attitude perceive work as a purpose and source for personal
development (Czerw & Grabowski, 2015).
In addition to the three basic attitudes mentioned above, Czerw (2013) identified two other
attitudes that employees project towards work. These are hedonic-autotelic and normative attitudes.
The hedonic-autotelic attitude perceives work as progressive, pleasant, a source of profit, and as an
opportunity for personal goals. The normative attitude, on the other hand, perceives work with
pride, obligation, respect, as an opportunity to offer advantages for others, and as a collectivist
concept.
Another approach, the psychological perspective of work, was introduced into the work
ethic literature by McClelland (1961). One viewpoint within the psychological perspective is that
work ethic is a system of both attitudes and beliefs. It can be deduced that the attitude system
includes opinions and contains cognitive, emotional, and behavioral components. The belief
system, on the other hand, refers to the cognitive and behavioral components only and represents
emotional and assessment elements of attitudes (Reykowski, 1998). The belief system also focuses
29
on importance, meaning and value of work, and time and independence (Christopher, Zabel, &
Jones, 2008a). This debate provides a compelling position for the work ethic construct.
Researchers’ varying perspectives on the work ethic construct, whether viewed as an attitude,
belief, or both, have guided their decisions in developing or selecting instruments to measure the
work ethic construct. Additionally, they have informed the development of the instruments over the
last 10 years.
The ability to accurately measure the work ethic construct is of paramount importance for
this study. This is necessary to determine the relationship between work ethic and other work-
related attitudes and behaviors. As such, an extensive review was conducted of the seven work
ethic instruments developed between 1961 and 1984 to measure Weber’s work ethic construct:
Protest Ethic Scale (Goldstein & Eichhorn, 1961), Pro-Protestant Ethic Scale (Blood, 1969),
Protestant Work Ethic Scale (Mirels & Garrett, 1971), Spirit of Capitalism Scale (Hammond &
Williams, 1976), Work and Leisure Ethic Scales (Buchholz, 1978), Eclectic Protestant Ethic Scale
(Ray, 1982), and Australian Work Ethic Scale (Ho & Lloyd, 1984). Scholars, however, identified a
number of problems that were common to these seven instruments.
Firstly, scholars concluded that Weber’s work ethic construct was typically described as a set
of multi-dimensional values. However, researchers traditionally emphasized the construct as uni-
dimensional, and as such have designed instruments that only measure one dimension (Miller et al.,
2001, pp. 4-5). Miller et al. (2001) explained that while using a single score may not be a problem,
from both an operational and conceptual perspective, disregarding the multidimensionality of work
ethic can be problematic. On the other hand, Carver (1989) and McHoskey (1994) explained that
exclusively using an overall score may result in losing information regarding different components
of work ethic and also how they relate to other constructs. Furnham (1984) provided further support
30
for this critique. He explained that using different instruments to measure work ethic and deriving
one single score may partially explain some of the ambiguous results in the work ethic literature.
Furnham (1984) further provided some examples that echoed these ambiguous results. He explained
how Blood (1969) concluded that individuals with greater work ethic beliefs were more satisfied with
their job and life in general. Additionally, Merrens and Garrett (1975) determined that individuals
that were more productive and worked longer on a monotonous task had higher work ethic beliefs.
However, in direct contrast, Ganster (1980;1981) found no evidence to support the earlier claims of
Blood (1969) and Merrens and Garrett (1975). Interpreting these results, according to Furnham
(1990), presented great difficulty. He further explained that it is difficult to determine whether these
conflicting results were because of the lack of robustness in the studies or because of deficiencies in
the relevance of the construct and the psychometric properties of the measures that were utilized.
The second critique according to Furnham (1990), is that the aforementioned seven existing
work ethic measures, appeared to be individually measuring different components of work ethic as
opposed to the entire construct. He further substantiated this claim by administering the seven
existing measures to 1,021 participants. He concluded that the correlations ranged from .19 to .066,
with a mean r of .36. He explained that if the scales were measuring the same constructs, the
correlation values should be much higher. Furnham (1990) further concluded that these earlier
work ethic measures were more concerned with reliability issues than validity issues as they
neglected to assess the entire work ethic construct as conceptualized by Weber.
The third and final critique concerned the publication dates of these measures. Miller et al.
(2001) explained that the actual date a measure was developed may not make it less valid.
However, it may make it less relevant to more current issues. For example, a scale may be less
about explaining work ethic across generational cohorts, which is a primary focus of this study.
31
Based on these three critiques, Furnham (1990) recommended that researchers focus on developing
a work ethic measure that was multidimensional and psychometrically sound. In an attempt to
respond to Furnham’s (1990) recommendation, Miller et al. (2001) embarked on a study to
conceptually and empirically identify the structure of Weber’s work ethic beliefs and develop a
current, practical, and psychometrically sound work ethic measure.
To commence his study, Miller et al. (2001) identified characteristics of the work ethic
construct. The construct is multidimensional, pertains to work and work-related activities in
general, is learned and not specific to any particular job, refers to attitudes and beliefs, is a
motivational construct reflected in behavior, and is secular. The study concluded by constructing
and evaluating a Multidimensional Work Ethic Profile (MWEP). The development of the scale,
along with its specific psychometrics, will be discussed in Chapter 3.
Since its publication, the MWEP has gained popularity and has been used in more than 24
publications in a host of different settings. It has been found to correlate with several individuals
and workplace variables. Examining the relationship between the seven dimensions of the MWEP
and personality and intelligence variables were of particular interest to the scholars. Christopher,
Zabel, and Jones (2008), in their study that compared the seven dimensions of work ethic with
conscientiousness, found that several of the work ethic dimensions shared a significant proportion
of variance with sub-dimensions of conscientiousness. Therefore, they concluded that the seven
dimensions of work ethic should not be collapsed into an overall scale.
In another study Christopher, Zabel, Jones, and Marek (2008) examined the relationships
between the seven work ethic dimensions and just world beliefs, social dominance, and right-wing
authoritarianism. They concluded that specific work ethic dimensions were predictive of
theoretically relevant constructs. The seven work ethic dimensions were later compared with the
32
Big Five personality variables and general intelligence. The researchers concluded that the work
ethic dimensions were modestly related to intelligence after controlling for the Big Five personality
variables, with R2=.056 (Christopher et al., 2010). The findings of these studies made a significant
contribution to explaining the direction and magnitude of the work ethic relationship and how other
variables differed by dimension. These results provided additional evidence to support earlier
claims that the work ethic construct is multidimensional in nature.
Using the MWEP globally, scholars investigated work ethic across a number of different
settings such as career, student and professional population, and generational cohort. One example
is a study by Pogson et al. (2003) that examined the differences in work ethic across three career
stages (early, mid, and late), using a student and professional population. The results of their study
indicated that early career respondents scored significantly higher on hard work and delay
gratification, while later career participants scored significantly higher on morality/ethic, wasted
time, and leisure. These results support Miller’s point that work ethic is not uni-dimensional, but is
a multi-dimensional construct. Additionally, it makes the point that individuals who are in the
earlier stages of their career focus on hard work and are willing to delay gratification, while
individuals who are more advanced in their career focus on morality/ethic, wasted time, and leisure.
In another study, Van Ness et al. (2010) examined the differences in the seven MWEP
dimensions of work ethic between college students and experienced professionals across a wide
range of industries (manufacturing, merchandising, general services, financial services,
technologies, drugs, medical supplies, and banking). They concluded that groups differed on
several dimensions of work ethic; however, there were no differences in the overall levels of work
ethic. Additionally, Meriac et al. (2010) examined the mean differences and measurement
invariance of the MWEP across Baby Boomers, Generation Xers, and Generation Yers. They
33
concluded that the dimensions morality/ethics, hard work, and delay of gratification were not
equivalent across groups. However, leisure was the only dimension that was equivalent across
groups. These results confirm the position held by Miller et al. (2001) that work ethic is not
unidimensional, but instead a multidimensional construct.
Scholars also used the MWEP scale to examine gender and cross-cultural differences. One
example is a study by Woehr et al. (2007) that examined the measurement invariance and mean
differences of work ethic dimensions across three cultures (United States, Mexico, and Korea). The
study concluded that the MWEP scale was equivalent across the three cultures. In a later study in
2009, Meriac et al. examined gender differences in work ethic. The findings indicated that the
MWEP dimensions were not different across male and female respondents, and the mean
differences on work ethic dimensions were not practically significant. The MWEP was used across
three significantly different cultures (North American, South American, and Asian), and no
significant work ethic differences were found. Therefore, in spite of the fact that it was developed
across a U.S. population, it is evident that the MWEP is appropriate for measuring the work ethic of
the T&T working population in this study.
Aside from the work environment, the MWEP scale was also used in academic settings. In
2011, Parkhurst, Fleisher, Skinner, Woehr, and Hawthorne-Embree used an interrupted task
paradigm and illustrated that a subset of the MWEP dimensions predicted choice effort in a
mathematics task. Additionally, Meriac (2012) concluded that the seven dimensions of the MWEP
predicted academic performance, student citizenship, and counterproductive behavior, but they
were not limited to standardized test scores and high school grade point average. Collectively, these
findings provide the rationale for the importance of the multi-dimensionality of the MWEP
34
instrument. While, in some studies, no significant differences were found in the overall score,
significant mean differences were seen in some of the dimensions.
Notwithstanding the popularity of the MWEP and its applicability in a host of settings,
researchers have criticized it for being “too long.” Each of the MWEP’s seven dimensions consists
of seven to ten items and when administered in a battery of combined measures, it will require too
much time and space to complete, particularly in an organizational environment. Another challenge
to such long instruments is that they tend to have more missing data and higher refusal rates than
shorter tests (Stanton, Sinar, Balzer, & Smith, 2002).
In response to the critiques of the MWEP, Meriac et al. (2013) developed a shorter version.
While the MWEP-SF contained 37 fewer items than the original version, the relationships between
the variables in the work ethic nomological was consistent with those in the full version. Since the
development of the MWEP-SF, it has been gradually becoming popular. It has been used across
local and international settings, in both student and non-student populations. It has also been used
by correctional officers (Gorman & Meriac, 2016; Ryan & Tipu, 2016; Minneti, 2016; Tipu &
Ryan, 2016).
The historical perspective of work ethic and the detailed explanation of the work ethic
construct provide the framework for this non-experimental research study. Additionally, Meriac et
al. (2010) concluded that morality/ethic, hard work, and delay of gratification were not equivalent
across generational cohorts. Given the drastic decline in the work ethic of the T&T working
population, and the fact that three generations are co-existing in the T&T working environment, a
deeper insight into these dimensions will assist to predict and explain work ethic across the
generational cohorts. Consequently, these results will make a significant contribution to both
scholars and professionals in the field. The next section therefore introduces generational cohort
35
and provides a detailed explanation of the different generational cohorts, how specific life events
shape their perspectives of work, and how these perspectives impact their work experience.
Generational Cohorts
The concept of generations is grounded in the principle that historical events and cultural
phenomena occurring during an individual’s key development stages (Noble & Schewe, 2003;
Twenge, 2000) may lead them to form a collection of memories that impact their lives (Dencker,
Joshi, & Martocchio, 2008). Since the mid-20th century, there has been a growing interest among
business management gurus and authors that examine the meaningful and substantive differences
among individuals that share these historical events and cultural phenomena in today’s work
environment (Costanza, Badger, Fraser, Severt, & Gade, 2012). Some of the most notable
historical events are the Great Depression, World War II, the Civil Rights movement, the
September 11th terrorist attack, and most importantly for T&T, the 1970 Black Power Revolution
(Costanza et al., 2012). When specific individuals of similar ages existing at a specific point in
time, share the same experiences, this creates similarities between them (Costanza et al., 2012).
This group of similar individuals is commonly referred to as a generational cohort and is usually
defined by the age of its membership.
A review of the generational differences literature revealed that there are several definitions
and while they are similar, they have expanded over a period of time. Generation was earlier
described by Karl Mannheim (1893 – 1947), one of the founding fathers of the sociology of
knowledge, as social constructions with individuals of a specific age being defined by historical and
social events (Mannheim, 1952). Ryder (1965), more explicitly described a generation as an
aggregate of individuals who experience the same event within the same time interval (Ryder, 1965,
p. 845). Strauss and Howe (1991), leading researchers on generations and founding partners of
36
LifeCourse Associates, theorized that generations came in cycles and used demographic and
historical data to identify more than 400 years of generations. They defined a generation as a cohort
identified by political, economic and social events, occurring in four 20-year recurring cycles,
spanning a lifetime. More recently, Kupperschmidt (2000) defined a generation as an identifiable
group sharing birth years, age, location, and other significant life events at critical developmental
stages (Kupperschmidt, 2000, p. 66). These definitions provide the framework for the formation of
the generational cohorts. The specific historical events of each generational cohort, how they
contribute to the development of specific characteristics, and how these characteristics impact the
world of work will be discussed in detail below.
In their 1991 book, Generations: The History of America’s Future, 1584 – 2069, Howe and
Strauss, expanded upon and brought popularity to the generational theory. They explained that the
generational theory is grounded within the ethos of individuals’ historical events and personal
experiences during their first 20 years of life. This results in each of these individuals having a
powerful ability to establish common ground for shared beliefs, values, and attitudes for others.
They further explained that the differences between one generation and another must be distinctive.
There must be a clear distinction in how they were raised as children, what public events they
witnessed as adolescents, and the social mission they engaged in as they came of age (Howe &
Strauss, 2007). It should be noted that these differences are not attributable solely to the age of the
individual but instead to the generational cohort’s shared experiences of its common influences
(Costanza et al., 2012).
Using demographic and historical data, Strauss and Howe (1991) categorized 19 generations
over more than 400 years (1588 – 2025). The 15th through the 18th (Silent, Baby Boomers,
Generation Xers, and Generation Yers) currently coexist in the U.S. world of work. However, the
37
16th through the 18th (Baby Boomers, Generation Xers, and Generation Yers) coexist in the T&T
workforce, which is the primary location and focus of this study. As such, they are discussed in
detail below.
Baby Boomers
Baby Boomers, individuals born between 1943 and 1960, also considered the postwar
generation, grew up in a time of grand visions. They were labeled the drug, sex, and rock ‘n’ roll
generation. The large size of this cohort inculcated competition for resources and opportunities
(Lancaster & Stillman, 2002). Living in prosperity, they were optimistic and were responsible for
many of the movements in American history (Lancaster & Stillman, 2002), such as women in the
workplace challenging the glass ceiling (Howe & Strauss, 2007). As the boomers matured, they
were more individualistic as they sourced inner life, self-perfection, and deeper meaning in life.
This was in contrast to their parents’ secular blueprint of collectivism- institutions, civic
participation, and team play (Howe & Strauss, 2007).
The 1970s experienced an influx of both male and female boomers in disciplines such as
teaching, religion, journalism, law, marketing, and art. The boomers focused on advancement, and
material success (Kupperschmidt, 2000; Strauss & Howe, 1991). They were often referred to as
workaholics, valuing their careers and seeking meaningful work over leisure and their families
(Strauss & Howe, 1991). In the 1980s, an era of deregulations, tax cuts, and entrepreneurship, the
boomers refashioned themselves as yuppie individuals. Political battles between the “red” and
“blue” zones ensued in the 1990s. All the generational cohorts suffered declining economic
prosperity and academic achievement while crime rates, substance abuse, and sexual risk taking
increased.

38
The Baby Boomers in T&T, while they may have shared somewhat similar experiences to
those in the U.S., have had some unique experiences. They grew up in the wake of T&T’s
independence and made a significant contribution to the development of the twin islands. Most of
their adult life experiences were in a flourishing economy, hence they enjoyed the highest standard
of living in the developing world.
Generation X
Generation X, individuals born between 1961 and 1981, grew up with failing schools,
courtships and marriages; increases in crime and teen pregnancies; and the normalization of the
spread of AIDS (Howe & Strauss, 2007). The generation X cohort in the U.S.A. is much smaller
than the boomers because of the decision to have smaller families and the easy access to birth
control (Glass, 2007). They were often referred to as cynical and skeptical (Lancaster & Stillman,
2002), which may have been in response to their negative experiences. From an early stage, Gen
Xers learned to distrust institutions, starting with the family. With mothers forced to enter the
world of work and no availability of child care, this generation was considered the first to endure a
latchkey childhood with long periods of self-care (Kupperschmidt, 2000; Strauss & Howe, 1991).
They developed independence, adaptability and resilience skills because of this phenomenon
(Scheef & Thiefoldt, 2004). It also contributed to them instilling family values and flexible work
arrangements to ensure the balance of their work and family (Losyk, 1997). Many Gen Xers have
focused on building the strong families that they missed out on as children (Howe & Strauss, 2007).
The Gen Xers that grew up in T&T endured much of the same as those in the U.S.
Additionally, some had to deal with the migration of their parents, who lived and worked abroad,
and were raised instead by their grandparents and/or other family members. This phenomenon gave
39
rise to the coining of the term “barrel children,” which described those who received material
support from their parents but lacked their emotional support (Jokhan, 2017).
At work, Gen Xers demonstrate a motivation to acquire money and achieve career
advancement and power (Arnett, 2000). The other generations describe them as “lost and
misguided”; however, they are labeled as the greatest entrepreneurial generation, with about 60% of
the Gen Xers reporting a preference for being their own boss (Howe & Strauss, 2007). They have
demonstrated less loyalty to an organization, but instead, they have proven to be more committed to
their work (Cohen, 2002). To motivate a Gen Xer at work, research shows that giving them regular
feedback, challenging them, and providing them with developmental opportunities produces the
greatest outcomes (Cohen, 2002). This entrepreneurial spirit, along with their resilience in the
marketplace and highly technical abilities is credited for America’s prosperity in the globalization
era. Some indication of this trend was also seen in T&T, with the observation of an increase in the
percentage of small entrepreneurs in the marketplace. These entrepreneurs, design and market
local products such as organic soaps, handcrafted items, and exotic foods. However, the researcher
has not been able to source concrete data to verify this claim of a rise in entrepreneurship in the
T&T work environment.
Generation Y/Millennial
Generation Y, or Millennial Generation, refer to individuals who were born between 1982
and 2005. This generation experienced a steady reduction in abortion, high-risk behaviors, and
divorce rates. Also witnessed with the rise of Gen Y were the reframing of babies as special and
the emergence of new hands-off parental styles (Strauss & Howe, 1991). Millennials were the first
generation of individuals entering the world of work that were able to access technology throughout
their entire lives. Those Gen Yers born in the U.S.A. after 2000, were expected to surf the internet
40
to complete assignments from as early as elementary school. In T&T, however, the access to
technology in homes and schools progressed at a much slower rate, meaning that a large percentage
of this generation may not have had access to technology. As such, unlike the U.S.A., it had not
been incorporated into most of their schools curriculum. With much easier access to educational
programs online, millennials have taken advantage of this opportunity, and they are considered the
most educated generational cohort.
Divorced parents and smaller families are prevalent among millennials. This trend may
have resulted in their parents having much more resources, enabling them to be furnished with
much more material items and attention. This phenomenon may have resulted in millennials being
much more sheltered for a longer period of time by their “helicopter parents,” who are driven to
provide excessive attention and micro-manage every aspect of their lives (Glass, 2007). This would
have significantly impacted their expectations in the workplace.
Their savvy approach to technology may have been responsible for millennials’
development of new trends and attitudes toward the working environment, such as flexibility in
work locations and timing, balancing work and families, and measuring productivity. Where,
when, and how the work is completed is not of interest to millennials. They are focused on working
smarter and not harder, reducing the number of hours spent on the job, and instead, increasing the
hours spent with family and on leisure activities. The results of a survey conducted by Pew
Research Center (2010) indicated that millennials are more focused on family life as opposed to
career and financial success.
Similar to the support they received from their parents, millennials expect their managers
and supervisors to mentor, coach and guide them to achieve their professional goals. They want to
be committed to the organization for the long haul but on their terms. They consider collaborative
41
work environments more stimulating for their success, and they are concerned with increasing their
levels of competencies through continuing education. To succeed in their world of work,
millennials demand more information and excessive communication. Millennials’ general attitudes
towards work definitely create friction between them and members of the older cohorts, who have
different perceptions of work (Hankin, 2004; Terjesen, Vinnicombe, & Freeman, 2007). The
impact of the introduction of these generational cohort concepts on the popular generational theory
will be discussed below.
It is quite evident that the generational theory is making a significant contribution across
disciplines. However, it is not without challenges. Costanza et al. (2012) conceptualized that great
disparities may exist between the locations and experiences of the historical events that define
generations. For example, the historical and cultural events experienced by individuals growing up
in Trinidad and Tobago in the 1950s and 1960s were significantly different from those experienced
by individuals growing up in Brazil, China, Russia, or the U.S. This, therefore, questions the
generalizability of generations across cultures. According to Parry and Urwin (2010), generational
conceptualizations are most often based on historical events of the U.S. However, the current
researcher was unable to find any empirical evidence or other literature that uncovered the impact
on the Caribbean islands and more specifically, T&T. In this regard, it may be questionable to
assign generalized labels to groups of individuals born within similar time periods. This is owing to
the fact that individuals within a group might have had completely different historical experiences
from each other. However, now more than ever due to the drastic improvements in Information and
Communication Technology (ICT), scholars have agreed that active global forces contribute to
people across the globe sharing similar experiences.
42
Over the past century, global forces were active. As a result, people from different parts of
the world were sharing and facing common experiences simultaneously. Codrington (2004)
reiterated that in sharing these common experiences concurrently, regardless of location, people of
the same age inculcate a similar value system. This was evident during 1989 and 1990 when the
entire world appeared to be in chaos. In Russia, Gorbachev took power, announced perestroika and
terminated communism. Frederik Willem de Klerk came into power in South Africa, ended
apartheid, released Mandela, and terminated communism. The Romanian dictator, Nicolae
Ceausescu, was overthrown and Eastern Europe opened up. German students smashed the Berlin
wall, Chinese students rioted in Tiananmen Square, America invaded Panama, and in 1990, the
Jamaat al Muslimeen attempted to overthrow the Trinidad and Tobago government (Codrington,
2004). These examples illustrate the point that global forces are active, and in spite of an
individuals’ birth locations, they all share similar experiences. This possibly makes literature on
U.S. generational cohorts somewhat applicable to T&T. These examples also support the
researcher’s decision to utilize Strauss and Howe’s (1991) generational theory as an element within
the theoretical framework for this study, in spite of the fact that a U.S. sample was used in the
development of the generational theory. The next section provides a detailed breakdown of
working population statistics, both in the U.S.A. and T&T. The chapter continues to explore how
utilizing the generational theory impacts the work environment globally, but more specifically in
T&T.
Generational Cohorts in the Work Environment
It is quite evident that, globally, the world of work includes employees with a broad range of
ages and generational memberships. A review of the Bureau of Labor and Statistics Report
revealed that approximately 243,000,000 individuals were classified as “working age” in the United
43
States. Of those, 155,000,000 were actively employed or seeking employment. Ninety-six percent
of the current U.S. workforce includes three different generations: Baby Boomers (34%),
Generation X (37%), and Generation Y or Millennials (25%). The other 4% includes the Silent
Generation, of which most are retired (United States Department of Labor Bureau of Labor
Statistics, 2012).
Similar to the U.S. BLS (2012), the T&T workforce includes a broad range of ages and
generational memberships. According to the T&T Central Statistics Office Report, Q2 (CSO,
2015), approximately 649,000 individuals were classified as “working age” in T&T, with 628,000
actively employed either part or full time. It was further estimated that 100% of the current T&T
workforce includes three different generations: Baby Boomers (13%), Generation X (46%) and
Generation Y (41%; CSO, 2015). These statistics confirm that in both the U.S.A. and T&T, the
work environment consists of diverse groups of employees. It is important to note that the
mandatory retirement age in T&T is 60 years, as opposed to 65 in the U.S. This may account for
the 21% difference in the proportions of Baby Boomers included in the workforces of the two
countries. Also, 41% of the T&T working population consists of Gen Yers. This is significantly
greater than the 25% in the US, and this may be because birth rates have been increasing
significantly in T&T since 1981. Now more than ever, researchers have developed a keen interest
in understanding how these generational cohorts behave and impact the workplace.
The variation within the working population raises questions about the workplace and the
dynamics experienced among the different generational cohorts. For organizations to perform
optimally, each of their leaders must have an in-depth understanding of the work values that are
specific to every generational cohort. Researchers have recognized that significant work ethic
differences are present among generational cohorts, more specifically in older generations (Davis,
44
Pawlowski, & Houston, 2006). These differences considerably impact the overall performance of
organizations. The Baby Boomer workaholics have set new standards, thereby inculcating
workaholic work ethic. In direct contrast, the Generation Xers and Yers are actively imposing a
shift on those earlier standards. Instead, they are focusing on inculcating a balance, carefully
allocating their time between work and family (Peart, 2004). To justify this position, Hesselbein et
al. (1997) identified that over the last three years, 10% more members in the workforce (an increase
from 62% to 72%) indicated that they were seeking a job that does not interfere with their personal
and family lives.
Miller’s seven dimensions (self-reliance, morality/ethics, wasted time, hard-work, the
centrality of work, leisure, and delay of gratification), which are central to his MWEP construct, are
evident throughout the generational literature (Pogson et al., 2003; Woehr et al., 2007; Meriac et al.,
2009; Meriac et al., 2010; Zabel et al., 2016; Van der Walt, Jonck, & Sobayeni, 2016). Some
examples are seen in the description of Baby Boomers as hard-working and that of younger
generations as being focused on self-reliance and establishing a work/leisure balance. Earlier
research has illustrated that while the three generations may believe in engaging in hard work, there
may be some differences of opinion with regards to the personal sacrifices required for hard work
(Jones, 1997).
Recent research attempted to ascertain whether a work ethic disparity exists among
generational cohorts. Peart (2004) emphasized that the period during which an individual is born
can explain how they are oriented to work and what they want from a career. In terms of their work
ethic, Baby Boomers were described as process-oriented and driven individuals prone to wearing
their values on their sleeves (Dawn, 2004, p. 40). Similarly, Generation Xers, were characterized
by having a strong and driven work ethic. However, in direct contrast to Baby Boomers, Gen Xers
45
have results oriented mentalities combined with more skeptical outlook and more balanced work
ethic approach (Dawn, 2004). Baby Boomers’ and the Gen Xers’ opposing perspectives on work
impact both individual well-being and work-related outcomes.
So, what can we expect from the Generation Yers or the Millennials? Research has
demonstrated that this cohort is experiencing a “real revolution.” The career ambitions of Gen Yers
have decreased, while their desires to balance work and family time have increased. This
revolutionary shift mirrors the 1950s era when the mother focused on the family. However, in the
Millennial generation, both mothers and fathers are focusing on the family. Gen Yers thrive much
better in a work environment that is collaborative. They are focused on enhancing their work skills
through continued education and are demanding more information from and communication with
their employers (Hankin, 2004; Terjesen et al., 2007).
It is expected that a diverse workforce will create a plethora of advantages for an
organization. As discussed above, the generational cohorts’ varying perspectives of work cannot be
understated. However, for successful business outcomes, managers will require much more than
simply acknowledging the differences between the different cohorts. They will have to identify the
differences within the generational cohorts, promote inclusiveness among the groups, and shield
against discrimination (Kiiru-Weatherly, 2016).
Costanza (2012), conducted a meta-analysis of generational differences on three work-
related criteria, including job satisfaction, organizational commitment, and intent to turnover.
While the results generally did not support that there are systematic, substantive differences among
generations in these three work-related outcomes, the researchers identified the need for additional,
scientifically sound primary research on generational differences in work-related outcomes. They
identified a number of areas for further investigation. The first and most significant one is to assess
46
and compare differences such as job satisfaction, organizational commitment, and work ethic across
all the generational cohorts in the working environment. Therefore, this researcher is taking heed of
the call and designed this study to explore the relationship between T&T’s generational cohorts and
work ethic.
Currently, varying perspectives exists across the generational cohorts in the work
environment. Some researchers concluded that the decline of work ethic was a result of the
different work values of the younger generations in the world of work. However, others concluded
that the work ethic of the younger generation was rejuvenating and optimistic. This study seeks to
present some clarity as it predicts the relationships between work ethic, work orientation, and
T&T’s generational cohorts. Having examined the literature on the work ethic and generational
cohort variables above, the next section unravels the literature on work orientation.
Work Orientation
There is no doubt that work plays a significant role in everyone’s life. Yet, it can be
experienced differently by individual people and across groups of people. Amy Wrzesniewski,
Professor of Organizational Behavior at the Yale University, focuses on how people make meaning
of their work. She explained that while some may experience work as a source of “pain, drudgery,
and boredom,” others may experience it as “joy, energy, and fulfillment,” and still, others may
experience it as a “complex mix” of these two extremes (Wrzesniewski, 2003, p. 297).
The dynamic interplay between an individual, the organization, and the work itself provides
the context for his/her perception of work, whether it is viewed as just a job, as something that is
inherently important, a star, a hero, or a villain (Wrzesniewski, 2003). Wrzesniewski (2003)
surmised that an individual’s relationship with his/her work is significantly more important than the
type of work that he/she engages in, creating opportunities for both the individual and organization.
47
Gaining a deeper insight into these opportunities is the focus of this study. However, to accomplish
this feat, it is important to explore the meaning and meaningfulness of work.
In spite of the fact that ‘meaning’ appears to be a simple concept to grasp, scholars have
argued that actually defining it seems to be a challenge (Brief & Nord, 1990; MOW International
Research Team, 1987; Super & Sverko, 1995). Exactly what meaning is, and more specifically
where it came from, is complex. It can be constructed individually, socially, or by using a
combination of the two (Pratt & Ashforth, 2003). Within the organizational behavior field, the
meaning of work has been deeply rooted in an individuals’ subjective interpretations of their work
experiences and interactions (Baumeister, 1991; Brief & Nord, 1990; Wrzesniewski, 2003).
Scholars have conceptualized a range of different definitions of the “meaning of work,” from
general beliefs, values, and attitudes toward work (Brief & Nord, 1990; Nord, Brief, Atieh, &
Doherty, 1990; Roberson, 1990; Ros, Schwartz, & Surkiss, 1999) to the personal experience and
significance of work ( (MOW International Research Team, 1987; Wrzesniewski, Dutton , &
Debebe, 2003). So, is “meaningfulness of work” the same as “meaning of work?”
The constructs “meaning” and “meaningfulness” have often been used interchangeably,
thereby making it difficult to identify their similarities and differences. Pratt and Ashforth (2003)
asserted that the “meaning” of work typically refers to the type of meaning an individual makes of
their work, whereas “meaningfulness” refers to the amount of significance that is attached to it.
Scholars that focused on the meaning of work have considered a broad range of factors that
influenced perceptions of meaning and meaningfulness. These factors range from individual
attitudes to organizational values to spiritual connections and beyond (Rosso, Dekas, &
Wrzesniewski, 2010). They are all considered potential sources of meaning or meaningfulness in
work.
48
The self is one of four main sources of meaning and meaningfulness of work that were
identified (Rosso et al., 2010). The self has always been a primary agent in determining many
different kinds of behaviors, attitudes, and beliefs (Bandura, 1989; Maslow, 1968; Rogers, 1961).
Scholars referring to the self typically invoke the self-concept (Bono & Judge, 2003; Shamir, 1991),
which is the totality of an individual’s thoughts and feelings referencing himself/herself as an object
(Rosenberg, 1979, p. 7). Individuals’ self-concepts change as their self-perceptions and feelings
change in response to their varying experiences and work context (Ashforth & Mael, 1989). Over
the last 10 years, scholars have developed a keen interest in understanding how individuals’ values,
motivations, and beliefs influence their perceptions of their meaning of work.
The meaning of work literature conceptualized that an individual’s work values and the
meaning that he/she attaches to his/her work have a “mutually causal relationship” (Nord et al.,
1990, p. 22). This relationship results from the interplay between the meanings a society attaches to
work and what an individual gleans from his/her work. Scholars proposed that when an individual
experiences a form of intrinsic motivation, it can be interpreted as a sign of congruence between
his/her self-concept and his/her work activities, leading to a deeper experience of meaningfulness
(Cardador, Pratt, & Dane, 2006; Hackman & Oldham, 1980; Shamir, 1991). The self can also
shape the meaning of work through the individual’s belief about the role or function of work in
his/her life. Job involvement and work centrality, work orientation, and calling are three popular
constructs commonly used to further explain beliefs within the meaning of work literature (Rosso et
al., 2010).
The job involvement construct investigates an individual’s belief in the role that his/her job
plays in his/her life. It also examines the alignment between one’s needs and the perception of the
job in terms of meeting those specific needs (Kanungo, 1982). On the other hand, work centrality
49
compares work to other domains in an individual’s life (e.g., family, leisure, religion, community
involvement). In contrast, work orientation examines how the meaning an individual makes of
his/her work is influenced by the individual’s belief of work (Bellah et al., 1985; Wrzesniewski,
McCauley, Rozin, & Schwartz, 1997). The construct of work orientation is much broader in
comparison to job involvement or work centrality. It explores individuals’ belief about the general
work activity as opposed to their immediate work beliefs. From a psychological perspective,
according to Christopher et al. (2008a), the belief system focuses on importance, meaning, and
value of work in addition to time and independence.
The work orientation construct characterizes the primary meaning that an individual sees in
the work activity. It is supported by the assumption that people can derive different meanings from
any job, but these meanings are primarily shaped by the individual’s orientation to work.
Individuals’ work orientations provide the framework for their understanding of what work means
to them, how they are likely to perform their job in alignment with these meanings, and the primary
purpose of working (Peterson, Park, Hall, & Seligman, 2009; Scott Morton & Podolny, 2002;
Wrzesniewski & Dutton, 2001).
Tripartite model
Robert Bellah (1927 – 2013), is an American sociologist and the Elliott Professor of
Sociology at the University of California, Berkeley, and is internationally known for his work on
the sociology of religion. He explained this concept more clearly by introducing a tripartite model
of an individual’s orientation toward his/her work. The model proposed three dominant
orientations (job, career, or calling) that individuals experienced towards work in the U.S.A.
(Baumeister, 1991; Bellah et al., 1985; Schwartz, 1986, 1994; Wrzesniewski et al., 1997). These
50
three elements in the tripartite model will be defined, and their impact on individuals’ work
experiences will be explored in more detail below.
The first orientation toward work is one in which individuals perceive their work as a job,
defined as something that is done primarily to make money (Duffy & Sedlacek, 2007). Individuals
approaching their work as a job focus only on the material benefits of the work and exclude any
other meaning and fulfillment. It is a means to a financial end that will ultimately allow them to
enjoy time away from their job. Individuals perceiving their work as a job typically articulate their
interests and ambitions outside of their work boundaries (Wrzesniewski et al., 1997). In most
instances, their interests and ambitions are articulated in hobbies, sports, and other life interest.
However, the means to engage in these activities are achieved through the monetary gains from
their jobs.
In direct contrast, the second orientation towards work is exhibited by those who perceive
their work as a career. This is defined as something which is moderately fulfilling but involves a
constant process of trying to move up the corporate ladder (Duffy & Sedlacek, 2007). These
individuals work for the benefits accompanying advancement through the organizational structure
or career ladder. These benefits are pay increases, prestige, power, and status and are the focus for
these individuals. In addition, these advancements usually bring about increased levels of self-
esteem, power, and social standing (Bellah et al., 1985, p. 66).
Wrzesniewski et al. (1997) concluded that individuals with job and career orientations
towards their work reported lower job and life satisfaction, which may significantly impact
individual performance and by extension the overall performance of the organization. While
individuals with jobs derive much more satisfaction from their hobbies and social lives in
comparison to their work, those with careers derive satisfaction from moving up the corporate
51
ladder and gaining power. Although some may perceive this as bleak, individuals with job and
career orientations may have opposing views and determine that their sources of inspiration, while
different, are still valid. These gloomy results may have discouraged scholars from conducting
empirical studies on individuals that endorse their work as jobs or careers, hence the limited
discussion on these two work orientations. Given that more positive results are achieved for both
the individual and organization when work is endorsed as a calling, scholars have demonstrated
much more interest in the calling construct. Therefore, the section below on the calling construct
will provide deeper insights than those provided in the two earlier sections on job and career.
The third orientation is known as a calling. This represents those individuals who work for
the fulfillment of doing the work and not for advancements or financial benefits. Approaching
work as a calling is an end in itself. It is typically associated with the belief that the work an
individual engages in contributes to a greater good while making the world a better place
(Wrzesniewski et al., 2003). Traditionally, calling was referred to as a “calling” by God to engage
in morally and socially significant work, as mentioned earlier in the chapter (Weber, 1958).
However, in contemporary times, calling has lost its religious significance and is retained only to
focus on engaging in work that contributes to the wider world (Davidson & Caddell, 1994). It
should be noted that it is the perception of the individual and not the work itself that defines
whether the work contributes to making the world a better place (Wrzesniewski, 2003). For
example, Bunderson and Thompson, in their study on Zookeepers in 2009, concluded that they
pursued their calling as Zookeepers not because they derived a pleasure in cleaning animal cages,
but because it made up part of what their job offered to society. They therefore felt a sense of
obligation to clean the cages because of society’s need. This tripartite model will provide the
opportunity for the researcher to explore employees’ core beliefs about their work and the impacts

52
of these beliefs on their work ethic. Of particular interest, is understanding how many employees
believe that they have a calling, and determining if it relates to the level of work ethic that they
exhibit.
Ryan Duffy is an associate professor at the University of Florida whose primary research
interest is on calling and psychology of working. Bryan Dik is a Professor of Counseling
Psychology at Colorado State University whose area of specialization is vocational psychology.
Together, they focused on calling in the work environment and have identified three common
features of calling: an external summons, profound meaning, and a clearly implied pro-social
motivation (Dik & Duffy, 2009; Duffy & Dik, 2013a). Consequently, they defined calling as “a
transcendent summons, experienced as originating beyond the self, to approach a particular life role
in a manner oriented toward demonstrating or deriving a sense of purpose or meaningfulness, and
that holds other-oriented values and goals as primary sources of motivation” (Dik & Duffy, 2009, p.
427). So, while scholars have been investigating the calling construct, the question is to what extent
is it accurately endorsed by both student and working populations?
Scholars conceptualized a “calling” as being a long-term work orientation, (Bellah et al.,
1985; Elangovan et al., 2010; Rosso et al., 2010; Wrzesniewski, 2011) comprising an individual’s
fundamental beliefs and preferences about work, and shaping how the individual makes sense of
work and life outside of work. To explore the degree to which first year college students endorsed
the term ‘calling,’ and to investigate its relation to their well-being, Dik, Sargent, and
Steger (2008) utilized two of the four items on the Brief Calling Scale (BCS): “I have a calling to a
particular kind of work” and “I have a good understanding of my calling as it applies to my
career.” The results of the study revealed that over 40% of the respondents believed that it was
mostly or totally true that they had a calling, and 30% reported that they were searching for a
53
calling (Duffy & Sedlacek, 2010). Wrzesniewski et al. (1997) found similar results among the
working population, with approximately one-third of the respondents endorsing a calling career.
Given the fact that the calling construct has a short past, these results suggest that it is gaining
significance among both the student and working populations as at least one-third of the
respondents across both populations endorsed having a “calling.” As the empirical studies on the
calling construct expanded, so did the measures. The section below will explain and assess each of
the five measures.
Over the last decade, I/O psychologists’ interests in the concept of having and living a
calling have grown exponentially. To explore this concept, five instruments that would allow the
measurement of the calling construct were developed. The first instrument is the three Calling
Paragraphs developed by Wrzesniewski et al. (1997). The next two instruments are both uni-
dimensional: the twelve-item Calling Scale developed by Dobrow and Tosti-Kharas (2011), and the
four-item Brief Calling Scale (BCS) developed by Dik, Eldridge, Steger, and Duffy (2012). The
last two instruments are multidimensional: the 24-item Calling and Vocation Questionnaire (CVQ),
and the nine-item Multidimensional Calling Measure (MCM). Both were developed in 2012 by
Tamara Hagmaier, a member of the Social Psychology Group at the University of Erlangen-
Nuremberg with expertise in personality and health psychology, and Andrea Abele, Chair of the
Social Psychology Department at the University of Erlangen-Nuremberg.
An assessment of the five instruments above conducted by Duffy, Autin, Allan, & Douglass,
(2015) revealed that the BCS had the best predictor of the face-valid calling question. The CVQ
was the next best, followed by the MCM, CS and the Calling Paragraphs. Another assessment of
these five calling instruments and work meaning, career commitment, and job satisfaction revealed
that while all the instruments may be able to predict positive work-related outcomes, the MCM, CS,
54
and Calling Paragraphs may be better at measuring the outcomes and correlates of calling than the
calling construct itself. The section below explores how these five measures were used to expand
the literature on the calling construct.
Research on the Calling Construct
Recently, calling as a construct has been receiving growing attention from scholars over a
range of disciplines. They are interested in gaining a better understanding of how individuals
develop meaning, purpose, and identity from their work and how it impacts work-related and
general well-being outcomes. Vocational psychologists have a keen interest in understanding the
role of calling among adolescent and young adult populations. This is because it is expected to
guide the individuals’ employment decision-making processes, thereby resulting in happier and
healthier individuals.
Utilizing the BCS instrument and surveying 3,091 first-year undergraduates, researchers
examined how calling related to career outcomes such as decidedness, self-efficacy, and vocational
self-clarity. The results of the study revealed that the presence of a calling strongly correlated with
career decidedness, choice comfort, and self-clarity and moderately correlated with choice-work
salience (Duffy & Sedlacek, 2007).
On the other hand, I/O psychologists and management researchers are interested in the role
of calling among adult populations in the workplace as they expect that it will significantly
contribute to work-related and well-being outcomes. In two earlier studies that utilized the Calling
Paragraphs, working adults representing diverse occupations were selected to participate. They
were asked to read three different paragraphs, each of which presented a potential perspective on
their orientation to work, whether it was viewed as a job, career, or calling. In the first study,
Davidson and Caddell (1994) surveyed 1,869 Catholics and Protestants. The results of the study
55
revealed that individuals perceiving their work as a calling were more likely to express social
justice beliefs and reported greater job satisfaction and security. The second study conducted by
Wrzesniewski et al. (1997) surveyed 196 administrative and professional employees. The study
concluded that individuals perceiving their work as a calling reported higher levels of well-being
than the other two groups (job and career).
More recently, Peterson, Park, Hall, and Seligman (2009), using the same methodology as
Wrzesniewski et al. (1997) surveyed 9,803 employed adults. The results of the study revealed that
calling was moderately correlated with work zest and life satisfaction and strongly correlated with
work satisfaction. In total, the results of these studies suggest that for both working adults and
undergraduate students, endorsing work as a calling may relate to favorable career and well-being
outcomes. More specifically, those that are more likely to endorse a calling may be more satisfied
with life and work. They may be more decided and more committed to their careers, display more
organization commitment, and view life as more meaningful (Duffy, Dik, & Steger, 2011b).
Another study targeting employees within specific occupational groups analyzed the
completed surveys of 982 respondents. The results revealed that the extent to which zookeepers
endorsed a calling moderately correlated with their occupational identification, occupational
importance, work meaningfulness, and perceived organizational duty (Bunderston & Thompson,
2009). In another study that was conducted over three and a half years and four waves, the
researchers surveyed 567 young musicians to investigate the dynamics of the sense of calling. The
researcher concluded that the perceptions of calling was related to the level of involvement in music
activities, enjoyment of practicing, parents involved in the arts, and enjoying socializing with other
musicians (Dobrow, 2007). Collectively, these studies also suggest that adults viewing their work
56
as a calling appear to have a much higher level of well-being, work satisfaction, enjoyment of work,
and occupational commitment.
The research on the calling construct highlighted above indicates that individuals oriented to
their work as a calling experience higher levels of individual and work-related outcomes.
Furthermore, it suggests that these individuals may also experience higher levels of work ethic.
Additionally, there are varying perspectives on how the younger generations’ beliefs and attitudes
towards work impact their work ethic. Some make the claim that work ethic is declining because of
the younger generations, while others claim that they are rejuvenating and invigorating. It is,
therefore, the expectation of the researcher that this study will enable scholars and professionals to
predict and explain the decline of work ethic across T&T’s generational cohorts and also explain
individuals’ orientation towards their work.
According to Duffy et al. (2011), there are a number of potential research directions to be
explored, one being the need to examine the cultural formulation of calling and how it may relate to
a host of individual well-being and organizational outcomes. A few studies have examined
racial/ethnic differences within the United States but few have been conducted in other countries
around the world. Duffy et al. (2011) reiterated that studies focusing on populations outside of the
U.S.A. will be critical to making more generalizable claims with regards to work orientation.
Therefore, this research study is designed to respond to the call for action by exploring the
relationship between work ethic and work orientation among T&T’s generational cohorts. This will
add to the current body of literature and expand our understanding of work orientation cross-
nationally and culturally. The next section focuses on understanding the unique history and set of
conditions that may have contributed to the T&T work environment.
57
Trinidad and Tobago
In order to provide a deeper insight into the landscape of the T&T work environment and
how people feel about their jobs, it is important to review some key historical developments of the
country. The relationships between individuals’ work orientations and their work ethic in T&T
have been dynamic and evolutionary. These relationships are heavily dependent on social,
economic, and political factors. When the British conquered T&T in the early 19th century,
investors and colonists took advantage of the high price of sugar and invested in sugar plantations.
They utilized the existing co-slavery population and also brought in a large percentage of
indentured laborers from East India and much smaller percentages from China, Portugal, and other
countries. This forced, harsh, and brutal work environment inculcated a work ethic that hinged on
discipline and hard work. Furthermore, in 1866, the drilling of oil commenced (Historical Facts on
the Petroleum Industry of T&T, n.d.). In the early 20th century, other countries were able to
produce sugar more cheaply, thereby threatening the sugar cane industry in T&T. This dilemma
resulted in increased and widespread unemployment (Historical Settings of T & T, 2003).
Simultaneously, the drilling for oil continued and the refining of oil commenced, with the
first small refinery being constructed in 1912 (Historical Facts on the Petroleum Industry of T&T,
n.d.). Later in the 1930s, the worldwide depression further worsened the T&T unemployment crisis
and led to a series of strikes and riots, hence strengthening a growing labor movement (Rahim,
2004). After its’ inception in T&T, the labor movement played a crucial role in reforming the
relationship between employers and employees in the work environment. However, in more recent
times, it may have contributed to the deterioration of the work ethic of the T&T working
population.
58
After swapping their return passages to India for grants of state land (Dabydeen, 1995), East
Indian migrants used their land to plant rice and garden vegetables and rear cows. Both men and
women labored ceaselessly, thereby inculcating values of hard work and dedication that were also
recognized by colonial officials (Dabydeen, 1995). During this period of extreme hardship,
migrants were highly motivated to engage in hard work and explore new opportunities for their
survival.
Globally, while not always by choice, Africans made significant contributions to the hard
work mentality (Warner-Lewis, 2007). Like the East Indian migrants, they, too, traded their return
passages to Africa for grants of state land in T&T. Some of them farmed their land and sold the
produce, while others engaged themselves as traders and artisans. In the mid 20th century, as the
number of Afro-Trinidadians landowners increased, so too did the Afro-Trinidad middle class.
This resulted in the emergence of a black professional class of lawyers, doctors, nurses, and
teachers (Premdas, 2007). Through hard work and dedication, Africans were motivated to explore
professional working opportunities. This trend continued as T&T gained its independence from
Britain in 1962.
While some noticeable growth of the economy occurred during the 1950s and early 1960s,
in 1967, five years after becoming an independent nation, T&T experienced an oil production high
of 65 million barrels per year. This rise in oil production significantly increased the Gross National
Income (GNI) per capita, thereby elevating the T&T economy to one of the highest income
economies in Latin America and the Caribbean (The World Bank, n.d.). Some might argue that this
drastic increase in the GNI contributed significantly to the birth of a healthy T&T economy.
Demas (1983) explained that while a number of advantages can be attributed to the
accumulation of wealth in this small nation, it also presented a number of disadvantages. With a
59
population of approximately 1.4 million (Trinidad and Tobago Central Statistical Office Quarter 2
Report, 2015), the T&T government earns 40% of its GDP from the energy sector. However, only
5% of the labor market was employed in this sector (Artana, Auguste, Moya, Sookram , & Watson,
2007). This dilemma placed a strain on the T&T government, forcing it to develop and implement
programs to provide unskilled and semi-skilled workers with temporary employment above
minimum wage (Demas, 1983). Consequently, these programs began to create social safety nets for
their beneficiaries.
The Unemployment Relief Program (URP) and the Community Environment Protection and
Enhancement Program (CEPEP) are two programs that were designed to provide unskilled and
semi-skilled citizens with temporary employment opportunities at wages exceeding the minimum
wage. The major objectives of the URP were to provide short-term employment on a rotational
basis, for the purpose of teaching and empowering women to be more marketable and to create the
opportunity for small-scale contract work in the community. CEPEP, on the other hand, was
designed to provide employment through environmental cleanup, coastal maintenance, waste
removal, and disaster and emergency response (Demas, 1983).
These programs saw the enrollment of large numbers of skilled and unskilled workers and
were considered successful at shielding low-skilled workers from economic downturns. However,
the results of an analysis concluded by the International Monetary Fund (IMF) revealed that these
programs added little value and were often plagued with underemployment. Sufficient work were
not allocated to these projects based on the number of enrollees. Hence, almost 50% of enrollees
worked for less than the expected time, but may have been compensated for working the entire
period, thereby creating a “dependency syndrome.” The IMF concluded that reducing high
60
dependence on government support would be the key to enhancing labor market competitiveness
(Demas, 1983).
The shift in the Trinidad and Tobago economy from a labor-intensive sugar producing
industry, to a capital-intensive oil and gas industry presented a dilemma. On one hand, it
contributed to the significant increase of the country’s economic conditions and ushered in some
aspects of development. However, on the other hand, the country’s highest income earner only
employed a small portion of the labor force, thereby creating mass unemployment. The fact that the
twin-island was an immature nation, only becoming independent about a decade before benefitting
from an oil production high, may have contributed to its inability to face this dilemma with much
more sustainable programs. As such, they instead developed and implemented programs that added
little value and resulted in underemployment, a dependency syndrome, and poor work ethic.
As the T&T economy improved over the last 50 years and the government developed and
implemented programs to shield the unskilled workers from financial hardship, the rigid and
disciplined work habits that prevailed in the sugar cane era and post worldwide depression began to
decline. This is consistent with Porter’s (2004) finding, which conceptualized that as working
hours are reduced and leisure time increased, more opportunities become available for workers to
focus on self-fulfillment as opposed to organizational advancement. As a result, work ethic begins
to decline. Bissessar (2012) highlighted an example to echo Porter’s (2004) point. She explained
that prior to 1970, no problems appeared to exist with the attitudes of T&T employees towards
work. However, statistics revealed that as the economy improved in the late 1970s and early 1980s,
the loss of manpower days through strikes and absenteeism began to increase significantly
(Bissessar, 2012).
61
Over the next 35 years, the work ethic trend worsened. In 2015, T&T ranked 94th out of 138
countries in the Global Competitiveness Index (GCI). This was 10 places lower than they were in
2011, when they ranked 84th out of 144 countries. Poor work ethic, after being consistently cited as
one of the top four problems over the last five years, elevated to the first position in 2014 and again
in 2015 (World Economic Forum, 2012 - 2017). The low levels of work ethic among the T&T
working population impact organizations’ overall performance, contributing to high rates of
absenteeism and tardiness as well as low levels of engagement, productivity, and organizational
commitment.
According to Charles (2016), the T&T world of work is plagued with poor work ethic. He
explained that employers highlighted low levels of engagement, lack of organizational commitment,
high levels of absenteeism, and poor management and organizational cultures as the main factors
that contribute to the poor work ethic in T&T. In spite of the fact that T&T enjoys the highest GDP
per capita in Latin America and the Caribbean, the poor work ethic of its working population makes
the nation uncompetitive in the global arena.
An analysis of the GCI Report revealed that countries with successful economies, such as
Switzerland, Germany, and the Netherlands, all enjoy a high work ethic. However, countries with
weaker economies, such as T&T are challenged with a low work ethic (Competing in a global
setting – poor work ethic, 2016). While there are a number of factors that may contribute to
economic development, it is safe to assume that work ethic is a major contributor.
The results mentioned above are disheartening. During the last 40 years, T&T was
considered one of the wealthiest countries in the Caribbean. However, its working population
inculcated poor working attitudes. This may have resulted from the ease with which unskilled and
semi-skilled workers were able to obtain money from government-assisted programs (Demas,
62
1983). As the price of oil continues to decline significantly, the T&T economy is currently under
threat. Issues relating to work ethic in both the public and private sectors are of primary concern if
a sustainable and healthy economy is to be achieved.
Currently, no evidence of published empirical studies on work ethic exists in T&T.
Therefore, it was decided that it would be beneficial to explore the relationship between work ethic
and work orientation among generational cohorts, especially given the researcher’s burning interest
in the topic. This study will provide decision makers with a deeper understanding of the level of
work ethic currently existing in the T&T economy and society at large. It is expected that the
results of this study will provide insight into some of the variables that predict work ethic across the
T&T generational cohorts. Additionally, it will explain the generational differences between
individuals’ orientation to their work and how these orientations impact their work ethic in the T&T
work environment. It is the expectation of the researcher that these results will guide organizational
leaders and decision makers to develop and implement hiring, motivating and retaining strategies to
improve the overall performance of their organization and by extension the T&T economy.
Summary
This chapter provides an extensive review of the relevant literature on work ethic,
generational cohorts, work orientation, and some aspects of T&T relating to the study. The
historical perspectives of work were used to provide an overall context for work, thereby serving
both work ethic and work orientation. Emanating from these perspectives, Weber’s work ethic
theory was used to provide the foundation for the work ethic construct. In spite of Weber
describing the work ethic construct as multidimensional, researchers developed uni-dimensional
instruments to measure it. More recently, Miller et al. (2001) critiqued earlier measures and
developed a 65-item Multidimensional Work Ethic Profile (MWEP) to measure work ethic, which
63
is most commonly used today. Most recently, in response to researchers critiquing Miller’s MWEP
as being too long and time-consuming to administer, (Meriac et al., 2013) developed the shortened
version, MWEP-SF.
Generational cohorts and established statistics for both the United States and T&T were
highlighted. A comparison of the definitions of the significant contributors and the theoretical
issues that impact the generational theory were reviewed. An in-depth explanation of the four
generations that co-exist in the United States workplace were examined. This discourse provided
the framework for the context of the generational cohort within this study.
To explain the work orientation construct, the differences between meaning and
meaningfulness of work were explored. Additionally, the chapter examined the impact of
individuals’ self-concepts on their beliefs of their meaning of work, which also influences their
work orientation or the meaning they make of their work. It provided the framework to launch the
tripartite model, which highlights the three work-oriented approaches – job, career, and calling.
Given that the study is being conducted in the twin islands of T&T, the chapter concludes with a
brief historical and economic review of the evolution of work ethic of the T&T working population.

64
Chapter 3: Research Design and Method
Introduction
This chapter describes the researcher’s use of analytical techniques to explain the
differences in work ethic and work orientation among generational cohorts employed at a major
multi-national, multi-industry corporation, located in the twin islands of T&T. The chapter
commences with a brief summary of the problem statement, which is followed by the research
questions and their rationale. It continues with an explanation of the quantitative, non-experimental
research design selected to answer the research questions. Next, the population for the study, the
inclusion and exclusion criteria utilized to select the sample, and the power analysis conducted to
determine the sample size are all discussed. The procedures for data collection are explained in
detail also, along with the procedures used to ensure that the study’s internal and external validity is
maintained. The instrument used to collect the data is then discussed, followed by a detailed
explanation of all the variables included in the instrument. The chapter continues with a brief
overview of the how the data was collected and processed to answer the research questions. It
concludes with the assumptions and ethical considerations that were entrenched for the execution of
the study.
Research Questions and their Rationales
In the early 1960s the T&T economy shifted from an agriculture-based, labor-intensive
industry to an oil-based, capital-intensive industry. This shift later resulted in a dilemma for the
twin islands. While it initially made a significant contribution to the growth of the economy, it also
contributed to mass unemployment. This was because the energy sector only employed 5% of the
working population while contributing 40% to the gross domestic product (GDP) and 80% of
exports (Artana et al., 2007). To alleviate the initial unemployment crisis, the T&T government
65
developed and implemented programs for skilled and unskilled workers (Demas, 1983). However,
in most instances, sufficient work was not created for all the enrollees of the program. This meant
that some enrollees would have received compensation in-spite of not working for it, thereby
creating underemployment (Demas, 1983). Over a period of time, as underemployment persisted
along with the ease with which skilled and unskilled workers earned money, a drastic decline in the
work ethic of the T&T working population was noted (Demas, 1983). During the period 2012
through 2017, work ethic became the most problematic factor for doing business in T&T (World
Economic Forum, 2012 - 2017). More recently, with the significant reduction in the price of oil
threatening the T&T economy, these low levels of work ethic may be further exacerbating the
situation.
Intricately woven into the current T&T work environment are three different generational
cohorts (Hansen & Leuty, 2012). While this diversity can be beneficial, the different work attitudes
and values among the generational cohorts present some challenges (Hansen & Leuty, 2012). The
researcher will utilize a post-positivist lens and employ scientific methods of inquiry to gain
knowledge of and predict the differences in work ethic and work orientation among the Trinidad
&Tobago generational cohorts employed at a major multi-national, multi-industry corporation.
Exploring how work orientation and work ethic are affected by the participants’ experiences
can add to the existing body of knowledge as well as provide implications for further research.
Based on the literature reviewed, previous research studies have provided general conclusions about
the relationships between work orientation and work-related outcomes such as career commitment,
organizational commitment, withdrawal commitment (Duffy, Allan, & Dik, 2011a), work
meaningfulness, occupational identity, occupational self-efficacy, work engagement, and person-
job-fit (Hirschi, 2012). Additionally, researchers have examined how work orientation related to
66
life meaning and life satisfaction (Duffy & Sedlacek, 2010). Previous research studies have also
provided general conclusions about work ethic and a wide range of attitudinal and performance
outcomes across a broad range of populations, both student and non-student, in the U.S.A. and other
international locations (Meriac et al., 2013; Ryan, 2002). Across the student population, work ethic
was associated with promising academic outcomes, and across the non-student population, work
ethic was associated with increased work-related outcomes. Based on the databases reviewed, some
evidence exists of empirical research conducted on work ethic and work orientation separately.
However, no evidence was found of empirical research conducted on work orientation and work
ethic together among generational cohorts in any part of the world, or more specifically in T&T.
Therefore, two research questions guide this study, with the second question having two parts:
1. What are the differences in work ethic and work orientation among T&T generational
cohorts employed at a major multi-national, multi-industry corporation, controlling for the
demographic variables?
2.a) Does work orientation predict work ethic across all T&T generational cohorts employed
at a major multi-national, multi-industry corporation, controlling for demographic variables?
2.b.) Does work orientation predict work ethic across all industries at a major multi-national,
multi-industry corporation in T&T, controlling for demographic variables?
For the first research question generational cohort is the only independent variable (IV).
The three dependent variables are work ethic and the two variables associated with work orientation
(presence of a calling and experience of a calling), and the seven covariates are (gender, education,
religion, ethnicity, position, income, and tenure).
The first part of the second research question has two independent variables, which are the
two variables associated with work orientation (presence of a calling and experience of a calling).
67
The dependent variable is work ethic, and the covariates are generational cohorts and the seven
demographic variables.
The second part of the second research question has two independent variables, which are
the two variables associated with work orientation (presence of a calling and experience of a
calling). The dependent variable is work ethic, and the covariates are industry, education, gender,
position, tenure, income, religion, and ethnicity.
Research Design
The purpose of this quantitative study is to predict the differences in work ethic and work
orientation (presence of a calling and experience of a calling) across T&T generational cohorts in
three industries in a major multi-national, multi-industry corporation. The post-positivistic tradition
that draws from the positivist scientific method is the foundation for the quantitative approach
(Creswell, 2014). The positivist tradition in the physical sciences emphasizes the truth as being
absolute. In contrast, the post-positivistic tradition discards that concept and instead affirms that
research involving human subjects cannot be considered to be absolutely true (Arbnor & Bjerke,
1997). Post-positivism does not deviate too far from the positivism and scientific method. It
involves the need for accurate observation and measurement as well as the testing and refinement of
theories (Creswell, 2014).
Quantitative research design involves the gathering, analyzing, interpreting, and presenting
of numerical information (Teddlie & Tashakkori , 2009). It also involves establishing, confirming,
or validating relationships (Leedy & Ormrod, 2001). It was further reiterated that in contrast to a
qualitative study, which is designed to understand the personal elements associated with behaviors,
judgments, and individual construction of lived events, the purpose of a quantitative study is to
68
identify and isolate specific variables within the context of the study (Berg & Lune , 2012; Teddlie
& Tashakkori , 2009).
This study is expected to predict the variance of work ethic and work orientation across
generational cohorts and industries, and seven other demographic variables. Also, the variables
occurred naturally and were not manipulated. Therefore, the predictive research design was the
most appropriate to answer the research questions. In addition, the researcher was not expecting
explicit cause and effect results. However, it was the researcher’s expectation that by using the
predictive research designs, probable cause and effect statements may have been generated to
explain the relationships of the variables, possibly creating the opportunity for more rigorous
research. Finally, work orientation is a relatively new phenomenon, particularly in T&T.
Therefore, the predictive design may have created the opportunity to gain more information as,
currently, little is known about the phenomenon.
It is expected that these results will provide opportunities for additional inquiry, analysis,
and findings of the bodies of literature pertaining to work ethic, work orientation, and generational
cohorts. This section explains in detail the data that were collected. The next section provides
insights on the population that was used for the study, the specific sample, and how the sample size
was calculated to ensure the accuracy of results with adequate statistical power.
Population and Sample
The Trinidad and Tobago Central Statistical Office Quarter 2 Report (2015), classified
approximately 649,000 individuals as “working age” of which 628,000 were actively employed. It
was further estimated that 100% of the current Trinidad and Tobago workforce included three
different generations: Baby Boomers (13%), Generation X (46%), and Generation Y (41%).
69
A multi-national, multi-industry corporation operating in the twin islands of T&T was
selected to participate in the study. This corporation was selected on the basis that it is one of the
largest corporations operating in T&T, with over 3,600 employees. Also, the structure of the
selected corporation comprises companies within six different industries (Retail, Financial,
Automotive, Information Technology, Energy, and Industrial Equipment). Selecting this
corporation provides the researcher with the opportunity to compare the work ethic of the different
generational cohorts across three different industries. Additionally, the structure of the corporation
allowed for smooth conduction of the data collection as organizing the three industries involved
dealing with only one company representative as opposed to three. However, the researcher was
cognizant of the fact that this may compromise the generalizability of the results to other
organizations.
The Automotive, Retail, and Technology industries were selected to participate in the study.
The rationale for this decision was based on the fact that the numbers of employees across the three
generational cohorts in these industries were significantly larger than those of the other industries.
This creates opportunities for a larger sample size and increased statistical power and significance.
A total of 2,810 individuals were employed in the Automotive, Retail, and Technology
industries, which represents the target population of this study. The non-probability criterion
sampling technique was utilized to select the sample for the study. The criterion sampling
technique identified and selected all the employees within the three sample industries in the
conglomerate that qualified to participate in the study. This was based on the established inclusion
and exclusion criteria that would significantly impact the outcome of the study (Patton, 2002, p.
238). This study had six main inclusion criteria: birth year between 1940 and 1993; employment in
the automotive, retail, or retail industry; permanent employment with the conglomerate; literacy; at
70
least 25 years of age; and computer literacy. The study also had five main exclusion criteria:
illiteracy; birth year outside of the 1940 to 1993 range; employment with the conglomerate in a
contract, temporary, or part-time position; employment in the financial, energy, or industrial
equipment industry; and computer illiteracy.
Employees’ birth years were sourced from the company’s database, and the first inclusion
criterion ensured that only those employees born between 1940 and 1993 could be selected. This
was done to ensure that all participants would belong to one of the three generational cohorts, which
is critical to the outcome of the study. The first cohort, Baby Boomers, consists of individuals born
between 1940 and 1959. Individuals born between 1960 and 1980 comprise the second cohort,
Generation X. The third cohort, Generation Y is comprised of individuals born between 1981 and
1993. The second inclusion criterion required that selected individuals be employed in the
automotive, retail, or technology industry. This is also critical to the outcome of the study.
Permanent employment with the conglomerate was the third inclusion criterion for selection.
Permanency may provide employees with richer experiences as they may enjoy promotional
opportunities, training and development, and employee benefits. These factors may significantly
impact their work ethic and by extension the results of the study. The fourth inclusion criterion
required participants to be at least 25 years old. According to (Seashore, 1923, p. 227), the
formation of professional mannerisms, a critical component of this study, occurs in individuals who
have attained the age of 25. The fifth inclusion criterion for the study was computer literacy.
Given that the study was conducted through an online program, participants needed to be able to
complete the survey online.
The first exclusion criterion of the study was illiteracy. The questionnaire involved
participants reading, comprehending, and selecting appropriate responses. Therefore, it was
71
mandatory to ensure that only participants capable of reading, comprehending, and writing could be
included. The second exclusion criterion prevented the selection of individuals who did not belong
to any of the three generational cohorts. This criterion is critical because membership to one of the
three generational cohorts is mandatory for this study. Therefore, individuals born before 1940 and
after 1993 did not qualify to participate in the study. The third exclusion criterion was employment
in a contract, temporary, or part-time position within the conglomerate. It was assumed that
participants employed under alternative employment arrangements may be forbidden from
experiencing the richness of secure, full-time employment such as promotional opportunities,
training and development, and employee benefits. Therefore, the work ethic of participants who are
unable to enjoy these opportunities may be significantly impacted. The fourth exclusion criterion
was employment in the financial, energy, and industrial equipment industry. Given that the
automotive, retail, and technology industries were selected for the study, individuals employed in
the financial, energy, and industrial equipment industries were excluded from participating. The
fifth exclusion criterion was computer illiteracy. As the data were collected using an online
program, computer illiterate participants would not be able to complete the online survey
effectively and efficiently, which would create a major threat to the validity of the study. Utilizing
the criterion sampling technique allowed the researcher to mitigate threats to internal validity, hence
reducing the possibility of extraneous factors that might have impacted the overall findings of the
study. On completion of the criterion sampling technique, it was determined that 1,578 employees
had qualified to participate in the study.
In summary, a non-probability criterion sampling technique was utilized to recruit the
respondents for the study. Using this technique allowed for 1,578 employees to be short-listed for
participation in the study. Based on their birth year, they all belonged to one of the three
72
generational cohorts, and they were all permanently employed in either the automotive, retail, or
technology industry. Additionally, they were all computer literate and at least 25 years old. All
1,578 employees meeting the inclusion and exclusion criteria were invited to participate in the
study. However, to ensure statistically significant results, the minimum sample size required for
this study was calculated using Power Analysis, which will be explained in detail in the next
section.
Power analysis is a critical aspect of experimental design. It enables the researcher to
determine the required sample size with a given effect size, level of confidence, and power (Cohen,
1992a). According to Triola (2001), the larger the sample size, the greater the accuracy and
statistical power in a statistical analysis.
Power analysis program G*Power (version 3.1.9.2) was used to calculate the sample size
required for this study. In the MANOVA model with three groups, one predictor variable, three
response variables, a medium expected effect size (f2 = 0.0625), and a 5% level of significance, a
sample of 252 resulted in a power of .8. Dividing the total sample of 252 across the three
generational cohorts equated to 84 participants per generational cohort.
Given that the survey was completed via SurveyMonkey the researcher anticipated a
response rate of less than 20% across the three generational cohorts. To protect against this threat,
the researcher invited all 1,578 individuals that had met the inclusion and exclusion criteria across
the three generational cohorts to participate in the study to ensure that the required sample size
would be secured. This meant that a response rate of approximately 16% was required. The
researcher was also conscious that of all the invited individuals, only those with a certain
personality type might be inclined to complete the survey. The researcher was hopeful that the
73
number of respondents would be significantly greater than 84 in each generational cohort, which
would significantly increase the accuracy and statistical power of the study.
Procedures
This section provides a detailed chronological description of all the steps incorporated into
each phase of this study (Heppner & Heppner, 2004). The major multi-national, multi-industry
corporation was selected (discussed in detail above), and an “Invitation to Participate” in the study
was sent via email to the President and Group Chief Executive Officer on July 14, 2017 (See
Appendix A). On July 18, 2017, an email was received from the SVP Human Resources agreeing
to participate in the study. Following initial discussions with the SVP Human Resources, the
industries were selected (discussed in greater detail above). A formal agreement to participate in
the study dated April 9, 2018 was received from The Massy Group of Companies (See Appendix
B). Having selected the corporation and the industries, the data collection process was initiated.
This will be discussed in detail below.
The final approval of the Institutional Review Board (IRB) of The Chicago School of
Professional Psychology (TCSPP) was received on June 4, 2018 (See Appendix C). Conduction of
pilot tests of the survey instrument and the data collection process was the next step. On June 7,
2018 a representative from the automotive division conveniently selected 10 employees that
qualified to participate in the study. An email including the Invitation to Participate (See Appendix
D) and the Consent document (Appendix E) was sent to each of these employees from Massy’s
SVP HR. After reviewing the documents, all 10 employees agreed to participate in the pilot test for
the study. At 8:00 a.m. on June 8, 2018, using the SuveyMonkey program and the SVP HR’s email
address, an email including the survey instrument was sent to each of the 10 employees (see
74
Appendix F). They were asked to complete the survey instrument and report to the IT Training
Room on the 1st floor at 10:00 am for a short focus group session.
The focus group session with the 10 participants began on schedule. The researcher took
the opportunity to commence the session with a brief explanation of the study, followed by the
purpose of the session, and then opened the floor for comments and feedback on the survey
instrument. Most of the participants indicated that the first section of the instrument (MWEP-SF)
was overly repetitive. Additionally, the negative questions had caught them off guard forcing them
to read the questions a couple of times to make sure that they answered correctly. Finally, none of
the participants indicated that the survey instrument was culturally insensitive or that they had
misunderstood any of the terminologies. The participants expressed a keen interest in the study and
spent the rest of the session discussing the significance of the study to the T&T work environment.
The session closed at 10:35 a.m. with the researcher having thanked the participants for their active
participation.
The issues that had been identified by the participants in the pilot test were deliberate design
strategies for minimizing extreme responses and eliminating respondents’ biases. No other
irregularities were identified. Therefore, no adjustments or revisions were made to the survey
instrument or procedures for the administering of the survey. The 10 individuals that had
participated in the pilot study were excluded from the mass email inviting the qualified individuals
to participate in the study.
On June 12, 2018 at 3:10 pm, using the SurveyMonkey program and the SVP HR email
address, the “Invitation to Participate in the Study” was emailed to 1,568 individuals. The email
contained the “Invitation to Participate” (Appendix D), which included an introduction to the
researcher and an explanation of the general purpose of the research study, as well as the expected
75
timeframe for completion of the survey instrument (30 minutes), the number of questions
comprising the survey (61 questions), Massy’s endorsement of the study, and the researcher’s
contact information. Participants were required to click the “Begin Survey” button at the end of the
email to access the survey.
After clicking the “Begin Survey” button, participants were first directed to the Consent
document (Appendix E), which included an introduction to the researcher and the study, a statement
that explained individuals’ participation was voluntary and that they could decide to stop at any
time without penalty, a detailed breakdown of the 61-item survey instrument, and the time they
would have to complete it (30 minutes). Participants were informed about the opportunity to
participate in an online draw to win one of three $500 gift vouchers to Buzo Osteria Italiana. Also
included were details on the risks involved with participating in the study, the researcher’s strategy
to minimize risks for respondents, the expected benefits to respondents, the accessibility of the
information, and the researcher’s contact information. The consent document ended with “I Agree”
and “I Disagree” boxes so that participants could select the appropriate box. Participants that
selected the “I Disagree” box were directed to the end of the survey. Participants that selected the “I
Agree” box gained access to complete the survey.
The survey instrument was self-administered through SurveyMonkey, an internet program
and online hosting website. SurveyMonkey is gaining its popularity across a number of different
disciplines in T&T, particularly in the field of marketing. This platform enabled the researcher to
use the internet to develop the survey and collect the data in a timely manner, thereby making it
more cost-effective (Buchanan & Hvizdak, 2009). It was also easy to use, as it facilitated effortless
data entry and eliminated the possibility of errors in inputting the data (Buchanan & Hvizdak,
2009).
76
Notwithstanding the advantages of the online surveys, the researcher was also aware of
some of the disadvantages. The response rates of online surveys are much lower than those of other
more traditional forms of data collection (Kittleson, 1997). To mitigate this threat, all 1,578
individuals that met the inclusion and exclusion criteria were invited to participate in the study. The
researcher was hopeful that this approach would assist in sufficiently accommodating for the
attrition in online surveys (Kittleson, 1997). Another disadvantage is that respondents who are not
sufficiently technologically competent may potentially create measurement errors (Granello &
Wheaton, 2004). For example, such respondents may not be able to effectively manipulate the
program to make adjustments to their responses. To mitigate this risk, the researcher ensured that
the process was simple, and detailed instructions were provided for each section.
The researcher noted the potential for demographic information and IP addresses to be
collected via Survey Monkey. Given this, the survey could not be considered anonymous. However,
the survey was confidential as no names were collected and respondents were therefore not
associated with their survey responses. All the data were password protected, and completed
surveys were stored on an external hard drive, and locked in a secured filing cabinet in the
researcher’s home office. However, in spite of all the researcher’s efforts to maintain
confidentiality, no online interaction can be completely secure as the risk of hackers is always
present (Buchanan & Hvizdak, 2009). To ensure that participants were informed of this risk prior
to consenting to participate in the study, the following statement was included in the Invitation to
Participate: ″ In spite of all the efforts to maintain confidentiality, there is really no completely
secure online interaction, as there is always the potential risk of hackers.″
Once participants agreed to participate in the study they were given access to complete the
survey instrument (see Appendix F), which is discussed in more detail in the next section. The first
77
two questions included two of the nine demographic items (generational cohort and industry).
These were followed by the MWEP-SF, CVQ, and MCM scales and the three open-ended
questions. The survey concluded with the other seven demographic statements, thereby making a
total of 61 questions/items.
The researcher was hopeful that the respondents would answer all the questions in the
survey instrument. However, the design of the questionnaire did not hinder participants from
skipping questions. The researcher was aware that requiring respondents to answer all questions
before the survey could be submitted would have been a violation of the participants’ rights
(Buchanan & Hvizdak, 2009).
To guarantee a higher response rate, the researcher employed a number of different
strategies, such as ensuring that the estimated time it would take to complete the survey was
included in the introductory information. The second strategy included a reward upon completion
of the online survey. The respondents were directed to participate in an online draw that qualified
them to be randomly selected to win one of three gift vouchers, each valued at
US$75.00/TT$500.00, for BUZO Osteria Italiano Restaurant, a popular restaurant located in Port-
of-Spain, Trinidad. Once respondents participated in the draw, they received an electronic Thank
You Note (see Appendix G). Weekly follow-up reminders (see Appendix H) were also used to
assist in motivating participants to complete the survey. Utilizing these three strategies
significantly improved the response rate of the study.
Upon completion of the study, a brief summary of the study, including the results, will be
presented to the conglomerate’s senior executive team. The presentation will be recorded and
uploaded to the company’s intranet for employees’ access.
78
This section provided a detailed, step by step description of how the data collection process
was conducted to enable easy replication of the study. Similar details on the survey instruments
that were utilized to collect the data required for this study are explored below.
Validity
Accuracy, meaning, and credibility should be every researcher’s concern when conducting a
research study (Babbie, 2013). Credibility and accuracy are determined by the extent to which the
instruments, or the study itself, measure what they claim to be measuring (Babbie, 2013). The
researcher may have the opportunity to draw inferences and defensible conclusions depending on
the validity of the study (Babbie, 2013).
An examination of this study revealed the potential for both internal and external threats to
validity. Threats to the internal validity create the possibility of the results of the study not
accurately reflecting what actually occurred in the experiment (Babbie, 2013). An internal threat
that has been identified for this study is the possibility of confounding variables. It is likely that
extraneous variables, other than generational cohort, work orientation, and the demographic
variables (gender, level of education, religion, ethnicity, industry, and income), may impact a
respondent’s work ethic. The respondent’s family values is one such variable.
Another threat to the internal validity was the participants’ freedom to decide the extent to
which they reported their true feelings, perceptions, and beliefs. Their responses might have been
influenced by their personal perspectives and/or what they thought was socially acceptable. Given
that the survey was to be administered online, the high possibility of a low response rate (Kittleson,
1997) posed a threat to the internal validity of the study. To maximize responses and mitigate these
internal threats, the researcher had ensured that the survey was short, easy to understand and could
have been completed within 25-30 minutes. As previously mentioned, weekly prompts had also
79
been sent out to remind the respondents to complete the survey. Additionally, those that completed
the survey had been promised a chance to win one of three gift certificates (value US$75/TT$500)
for Buzo Osteria Italiana.
Threats to external validity create the possibility of being unable to generalize the
conclusion of the study to a wider population (Babbie, 2013). The fact that the study was
conducted with individuals employed at a major multi-national, multi-industry corporation located
within the twin islands of T&T, presents an external threat to validity. The researcher is not
absolutely sure that the initial sample was representative of the T&T working population or any
other population of a wider geographic location. Therefore, it may not be possible to generalize the
results of the study to the wider T&T population or any other population of a wider geographic
location. However, during the construction phase of the MWEP-SF, the researchers had conducted
a number of studies that focused on generalizability to other real-world contexts (Miller et al.,
2001). It was expected that this study might present some threats to both internal and external
validity. However, the researcher ensured that strategies were implemented to mitigate these threats
so that a significant contribution could be made to the growing body of literature.
Instrumentation
This study was designed to be non-experimental. As such, the researcher relied on
interpretations, observations, and interactions to answer the research questions as opposed to
controlling, manipulating, or altering subjects. The study utilized a predictive design to answer the
research questions. The first research question included one independent variable (IV), which was
generational cohort. The three dependent variables were work ethic and the two variables
associated with work orientation (presence of a calling and experience of a calling), and the seven
covariates were gender, education, religion, ethnicity, position, income, and tenure in conglomerate.
80
The second research question had two parts, the first of which included the two independent
variables associated with work orientation (presence of a calling and experience of a calling), work
ethic as the dependent variable, and generational cohort as the covariate. The second part included
the two independent variables associated with work orientation (presence of a calling and
experience of a calling), work ethic as the dependent variable, and industry as the covariate.
To measure these variables, appropriate instruments were selected based on a number of
different criteria. The reliability and validity of the instruments were critical to the decision making
process. The validity of the instrument is determined by the extent to which it measures what it
claims it is measuring (Babbie, 2013), and the reliability of the measure refers to the quality of the
measurement method. Hence, each time a reliable instrument is used, the same data would be
collected and the same results would be expected (Babbie, 2013).
The three measurement scales were operationalized as uni-dimensional instruments. As
such, work ethic was measured by utilizing the composite score from the published MWEP-SF 28-
item instrument. Work orientation was measured using the composite score of the 12-items
representing the presence of a calling sub-scale in the CVQ instrument. Additionally, the
composite score of the MCM 9-item instrument was used to measure the experience of a calling.
Permission was obtained from each of the three original researchers to utilize their respective scales
(see Appendices I, J, and K for the emails requesting and granting permission). To delve deeper
into the survey instruments, three open-ended questions were included. To mitigate the risk of
participants abandoning the survey, the open ended questions were strategically included after the
49 instrument items (Granello & Wheaton, 2004). Two of the nine demographic questions
(generational cohort and industry) were included at the beginning of the survey instrument, and the
other seven (gender, education, religion, ethnicity, position, income, and tenure) were included at
81
the end of the survey. The responses to these demographic questions helped to provide more
information about the participants being surveyed. Detailed explanations of all the variables in the
study are provided in the section below. The section also includes how these variables are defined,
the instruments used to measure them, and the reliability and validity of those instruments.
Measurement Scales Variables
Generational cohort and industry, two independent variables in this research study, were
sourced from the company’s existing database and were used to determine each participant’s
membership in the generational cohort and industry. Generational cohort, defined as “an
identifiable group sharing birth years, age, location, and other significant life events at critical
developmental stages” (Kupperschmidt, 2000, p. 66), was measured using each participant’s year of
birth, which was one of the nine demographic questions. It was operationalized as a categorical
variable with three levels: Baby Boomers, individuals born between 1940 and 1959; Generation
Xers, individuals born between 1960 and 1980; and Generation Yers, individuals born between
1981 and 1993. Since this information was critical to the result of the study, it was the first
statement on the survey instrument, and participants were not allowed to skip responding to this
statement. The specific industry in which each individual was employed was the other independent
variable in the study. Based on the number of employees in each industry, three industries were
selected to participate in the study (automotive, retail, and technology).
Work ethic, a dependent variable in this research study, is defined as the reflection of an
individual’s attitude and belief toward work in general and not with reference to a specific job
Miller et al. (2001). This dependent variable required the use of the Multidimensional Work Ethic
Profile-SF (MWEP-SF) scale Meriac et al. (2013), a shortened version of the Multidimensional
Work Ethic Profile (MWEP) scale, by Miller et al. (2001), which is a 28-item instrument measuring
82
attitude towards work across seven dimensions (Wasted Time, Centrality of Work, Morality/Ethic,
Leisure, Gratification, Hard Work, and Self-Reliance; see Table 1).
The MWEP-SF instrument was selected by the researcher to collect data for this study. It
was selected based on six main reasons. Firstly, the MWEP –SF was grounded in Max Weber’s
Protestant Work Ethic theory framework. Secondly, it utilized more relevant and contemporary
vocabulary than the MWEP. Thirdly, the fact that the MWEP-SF survey instrument had 37
questions less than the MWEP, meant that utilizing it would have increased the likelihood of
respondents completing the survey in a much shorter time frame. Fourthly, findings from earlier
research studies concluded that response rates would increase if the survey instrument was short,
relevant and of interest to the target population (Ray & Tabor, 2003). Therefore, it was determined
that the MWEP-SF would assist in improving the response rate of the study, which was critical for
the findings of this study. Fifthly, with less items fewer opportunities for error exist thereby
reducing measurement error. Sixthly, the alpha levels were comparable for both instruments, with
high levels of correlations existing between the two. The researcher was therefore confident that
the reliability and validity of the study would not be affected by utilizing the MWEP-SF.
In the MWEP-SF, a five-point scale was used (“SA = Strongly Agree; A = Agree; N=
Neither Agree nor Disagree; D= Disagree; SD = Strongly Disagree”). While the scale used a
Likert-type scale to measure, which is considered an ordinal/categorical scale, the dependent
variable, work ethic, will be assumed to have been measured on a continuous scale. Sample
questions for the MWEP-SF include “It is important to stay busy at work and not waste time,” “I
would prefer a job that allowed me to have more leisure time,” and “I get more fulfillment from
items I had to wait for.” In spite of the fact that the MWEP-SF was designed as a multi-
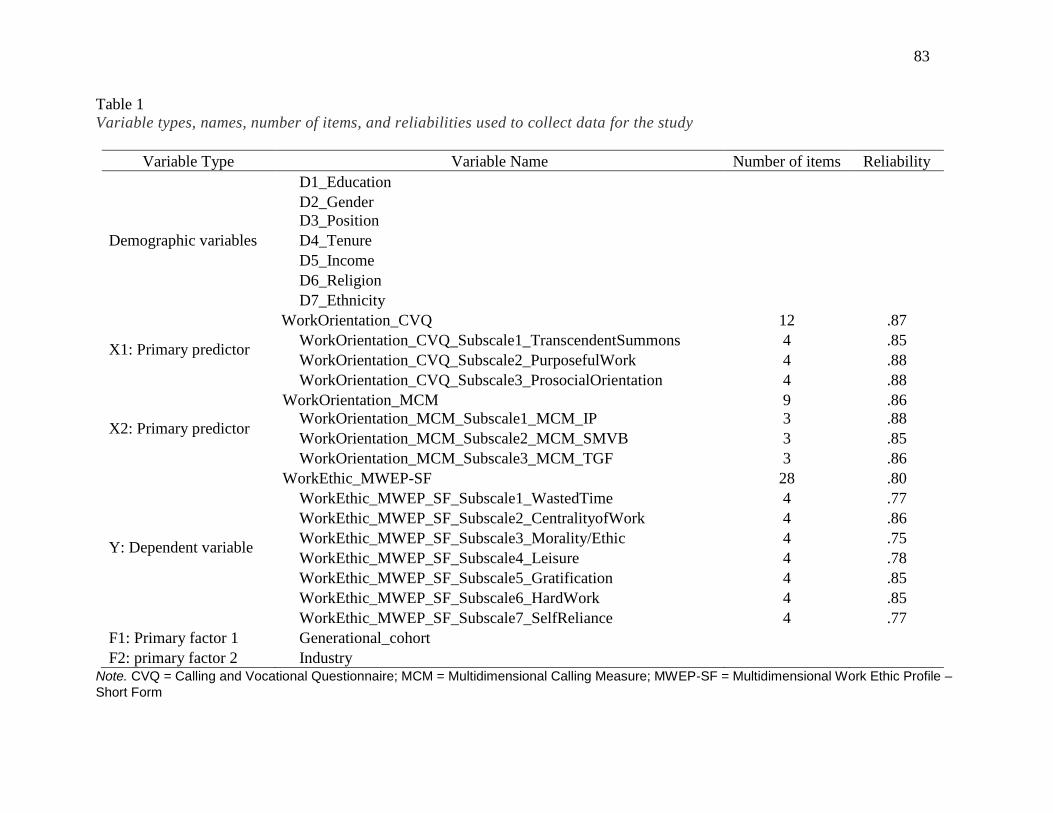
83
Table 1
Variable types, names, number of items, and reliabilities used to collect data for the study
Variable Type Variable Name Number of items Reliability
Demographic variables
D1_Education
D2_Gender
D3_Position
D4_Tenure
D5_Income
D6_Religion
D7_Ethnicity
X1: Primary predictor
WorkOrientation_CVQ 12 .87
WorkOrientation_CVQ_Subscale1_TranscendentSummons 4 .85
WorkOrientation_CVQ_Subscale2_PurposefulWork 4 .88
WorkOrientation_CVQ_Subscale3_ProsocialOrientation 4 .88
X2: Primary predictor
WorkOrientation_MCM 9 .86
WorkOrientation_MCM_Subscale1_MCM_IP 3 .88
WorkOrientation_MCM_Subscale2_MCM_SMVB 3 .85
WorkOrientation_MCM_Subscale3_MCM_TGF 3 .86
Y: Dependent variable
WorkEthic_MWEP-SF 28 .80
WorkEthic_MWEP_SF_Subscale1_WastedTime 4 .77
WorkEthic_MWEP_SF_Subscale2_CentralityofWork 4 .86
WorkEthic_MWEP_SF_Subscale3_Morality/Ethic 4 .75
WorkEthic_MWEP_SF_Subscale4_Leisure 4 .78
WorkEthic_MWEP_SF_Subscale5_Gratification 4 .85
WorkEthic_MWEP_SF_Subscale6_HardWork 4 .85
WorkEthic_MWEP_SF_Subscale7_SelfReliance 4 .77
F1: Primary factor 1 Generational_cohort
F2: primary factor 2 Industry Note. CVQ = Calling and Vocational Questionnaire; MCM = Multidimensional Calling Measure; MWEP-SF = Multidimensional Work Ethic Profile –
Short Form
84
dimensional instrument, in this study it was operationalized as a uni-dimensional instrument
because only a composite score for each of the respondents’ attitudes toward their work was needed
to answer the research questions.
The MWEP – SF, which was developed in 2013, is slowly gaining popularity. Since its
publication in the Journal of Vocational Behavior, it has been cited approximately 26 times, and
evidence suggest that it has been the MWEP-SF being used approximately five times in empirical
studies published in peer-reviewed journal. It has been used across student and non-student
populations, correctional officers, and also internationally (Gorman & Meriac, 2016; Meriac &
Gorman, 2016; Ryan & Tipu, 2016; Minneti, 2016; Tipu & Ryan, 2016).
Work orientation acted as both an independent and a dependent variable in this research
study. It was defined as the characteristic (job, career, or calling) that people attributed to the
meaning of their work activity (Peterson et al., 2009; Scott Morton & Podolny, 2002; Wrzesniewski
& Dutton, 2001). Since its introduction, five instruments have been developed to measure the work
orientation construct. The first instrument is the Calling Paragraphs introduced by Wrzesniewski et
al. (1997). More recently, two unidimensional scales and two multidimensional scales were
developed. The Brief Calling Scale (BCS), developed by Dik et al. (2012), and the Calling Scale
(CS), developed by Dobrow and Tosti-Kharas (2011), are the two unidimensional scales. The two
multidimensional scales are The Calling and Vocation Questionnaire (CVQ), developed by Dik et
al. (2012) and the Multidimensional Calling Measure (MCM), developed by Hagmaier and Abele
(2012). An assessment of these measures by Duffy et al. (2015) concluded that while the CVQ
most accurately represented the components that contributed to living a calling, it had much weaker
correlations to work-related outcomes than the other measures. In comparison to the CVQ, the
MCM, CS, and Calling Paragraphs were more effective at detecting work meaning than calling.
85
Based on the findings of the Duffy et al. (2015) study, this researcher made a decision to select both
the CVQ and MCM to measure the calling construct in this study. The CVQ was used to measure
the presence of a calling, and the MCM was used to measure the experience of a calling. A more
in-depth understanding of the suitability of these instruments for this study will be explored below.
The 12-item CVQ - Presence of a calling scale used a 4-point Likert-type scale (“1= Not at
all true for me; 2 = Somewhat true for me; 3= Mostly true for me; and 4=Absolutely true for me”),
considered an ordinal/categorical scale, to measure the presence of a calling across three
dimensions (Presence-Transcendent Summon, Presence Purposeful Work, and Presence Pro-Social
Orientation; see Table 1). It was assumed that the outcome variable, work orientation, was
measured on a continuous scale. Sample questions for the CVQ scale include “I believe that I have
been called to my current line of work,” “I’m searching for my calling in my career,” and “My
work helps me live out my life purpose” (Dik et al., 2012). In spite of the fact that the CVQ was
designed as a multi-dimensional instrument, in this study it was operationalized as a uni-
dimensional instrument because only a composite score for each of the respondents’ presence of a
calling was needed to answer the research questions.
In addition to providing solid reliability, the results of the multi-trait, multi-method analysis
revealed that, generally, support exists for both convergent and discriminant validity of the CVQ
scores. Comparing both presence of and search for a calling, convergent validity appeared to be
stronger for the presence of a calling (r=.51), than search for calling (r=.36). Some evidence of
predicted patterns of relationships appeared to support discriminant validity.
The CVQ instrument appears to be slowly gaining popularity. It has been cited
approximately 143 times, and it seems to have been used several times since its development in
2008, with alpha levels ranging from .87 to .92. Researchers have used the CVQ instrument to
86
examine religiosity and calling among working adults Horvath (2015), the relationship between
signature strength use and satisfaction Allan and Duffy (2014), the relationship between calling and
life satisfaction Duffy et al. (2012), calling and academic satisfaction Duffy et al. (2011a), whether
calling to a particular career translated to work-related outcomes Duffy, Dik and Steger (2011b),
and the relationships between spiritual resources, job resources and work engagement among
religious workers (Bickerton, Miner, Dowson, & Griffin, 2014). The main findings of these studies
indicated that calling was positively correlated to work/academic related outcomes and personal
well-being.
The MCM, a nine-item instrument, was developed to measure experience of a calling across
three dimensions (Identification & Person-Environment-Fit (IP), Transcendent Guiding Force
(TGF), and Sense and Meaning & Value-Driven-Behavior (SMVB; see Table 1). Responses to
each of the items were on a six-point Likert Scale ranging from Strongly Disagree to Strongly
Agree. It was assumed that the outcome variable work orientation – experience of a calling was
measured on a continuous scale. Sample questions for the MCM scale include “I am passionate
about my job,” “An inner voice is guiding me in doing my job,” and “My job helps me make the
world a better place” (Hagmaier & Abele, 2012). The MCM was developed on the assumption that
the calling construct was multifaceted and therefore required a multidimensional instrument to
measure calling. In spite of the fact that the MCM was designed as a multi-dimensional instrument,
in this study, it was operationalized as a uni-dimensional instrument because only a composite score
for each of the respondents’ experience of a calling was needed to answer the research questions.
Since the development of the MCM in 2012, it has been cited approximately 70 times.
However, it has only been used in one study that compared the calling instruments. The MCM has
not been utilized in a research study to measure the calling construct and make a conclusive
87
decision based on the analysis of the data. Notwithstanding this, the purpose of this study is to
predict and explain the work ethic of generational cohorts. Additionally, a number of previous
studies identified positive correlations between work ethic and work-related outcomes such as job
satisfaction and organization. Since the MCM has proven to be better at predicting factors
associated with experience of a calling, such as job satisfaction, this instrument has proven to be
appropriate for this study.
Demographic Variables
There were seven other demographic variables included in the survey instrument: level of
education, gender, position, tenure, income, religion, and ethnicity (see Table 1). The researcher
hopes to be able to explore the extent to which these seven intervening variables contribute to work
ethic. The researcher also hopes to identify any possible interactions between the variables,
generational cohort membership and work orientation and determine their combined effect on work
ethic.
Collecting data on gender may assist in clarifying some ambiguity within the work ethic
literature. Some studies have concluded that differences in work ethic exist between genders, while
others have concluded otherwise (Albee, 1977; Barnard, 1998; Buchholz, 1978; Burke, 1994;
Mirels & Garrett, 1971). These mixed results motivated the researcher to examine the relationship
between work ethic and gender with the hope of clarifying these ambiguous findings within the
T&T population.
The results of earlier research on work orientation revealed that, compared to job and career
respondents, calling respondents were paid significantly higher, were better educated, and had
occupations that were higher in both self-perceived status and objective prestige level
(Wrzesniewski et al., 1997). More recent studies concluded a substantial link between career
88
commitment and perceiving a calling (Duffy, Bott, Allan, Torrey, & Dik, 2012b; Duffy, Allan,
Autin, & Bott, 2013b). These findings motivated the researcher to use the T&T population to
collect data on the four demographic variables (level of education, position, tenure, and income).
In his PWE thesis Weber’s argument neglected to conclude that a non-Protestant society
cannot produce the spirit of capitalism. Instead, he concluded that Catholic and Islamic societies
failed to develop a spirit of capitalism (Weber, 1958). Since religion is intricately woven into the
fabric of the T&T society, the researcher was motivated to examine how religion impacts the work
ethic and work orientation of the T&T working population.
Additionally, T&T is often referred to as the melting pot of the Caribbean, with a wide
cross-section of cultural and ethnic groups extending from India, Africa, China, Europe, and the
Middle East. Given that this ethnic diversity is also prevalent in the T&T work environment, the
researcher decided to also include ethnicity in the data collection for this study so that the extent to
which ethnicity impacts the work ethic and work orientation of the T&T working population would
be examined.
Open-Ended Questions
The methodological approach of this study is quantitative in nature, hence diminishing the
opportunity to provide some rich data and explore in depth what the respondents meant by their
responses. To alleviate this limitation, the researcher developed three open-ended questions to
delve deeper into the three survey instruments. The first open-ended question, “Do you believe that
your level of work effort contributes to your success in life? Explain,” was developed from the
factor “Hard Work” on the MWEP-SF scale, which was used to measure participants’ work ethic.
Miller et al. (2001) explained hard work as an individual’s attitudes toward and beliefs about the
value of hard work.
89
The second open-ended question was “What do you consider to be your purpose in life?”
and “Describe how your current position relates to that purpose, if at all.” This was developed
from the factor “Presence Purposeful Work” on the CVQ scale, which was used to measure
participants’ presence of a calling. Dik et al. (2012) explained Presence-Purposeful Work as an
approach to a particular role in life to derive a sense of meaning and purpose.
The third open-ended question was “Do you believe that your current line of work
contributes to the overall satisfaction of your life? Explain.” This question was developed to
motivate the respondents to link their current line of work with their overall life satisfaction.
According to (Diener & Seligman, 2004), with the reduction of the contribution of salary increases
to well-being, more than ever, it is critical for individuals to consider other factors that lead to
satisfaction at work and life in general. Additionally, Wrzesniewski et al. (1997) indicated that
individuals experiencing a calling in their work should also enjoy high levels of general life
satisfaction.
Reverse Scoring
To minimize extreme responses and eliminate response bias, the researcher adapted two of
the items on the CVQ and two items on the MCM instruments to reflect reverse scoring. The
adapted items on the CVQ scale were #3 (I do not believe that a force beyond myself has helped
guide me to my career) and #9 (My career is not an important part of my life’s meaning). The
adapted items on the MCM scale were #2 (I am not passionate about doing my job) and #5 (My job
does not help to make the world a better place).
Having identified and explained in detail the instruments used to measure the main
variables in this section, the next section explains in detail how the data was collected.
90
Data Collection
The collection of data for this quantitative study was highly dependent on effective data
collection procedures. As such, all the standard protocol and procedures were followed, as
explained in an earlier section, which assisted with the reduction of potential biases (Creswell,
2008). A list was collated of all the individuals that qualified to participate in the study. They each
received an email through SurveyMonkey consisting of information explaining the title of the
study, the goals and purposes of the study, assurances of confidentiality and anonymity, and how
they were protected. They also received emails with the instructions to complete the survey. With
regards to informed consent and confidentiality, all subjects were treated in accordance with the
code of ethics of the American Psychological Association (2002) and the American Educational
Research Association (2011). To increase the response rate, weekly reminders were sent out.
Additionally, respondents had the option to participate in an online draw for one of three US$75.00
gift vouchers for BUZO Osteria Italiano Restaurant. Data was collected for the study over three
weeks. Information regarding the processing of the data is provided in the next section.
Data Processing
On completion of the data collection, which was conducted through SurveyMonkey, the
data was exported to SPSS (IBM SPSS Statistics Version 23). During the exporting process, the
data was automatically coded, and any identifying information was redacted prior to commencing
the analysis. This was the first step in the data processing phase.
The second step involved screening the data to ensure that it was complete, accurate,
consistent, relevant, uniform, and acceptable (Parten, 1966). Using SPSS, frequency tables and
graphic methods such as histograms and box plots were generated to identify any improbable scores
across the data set. Given that the data were imported from SurveyMonkey, no inaccurate data
91
were identified. Conducting this step ensured that the findings of the study were generalizable, that
error variance was reduced, and that statistical power was increased, thereby mitigating threats to
the reliability and validity of the study (Osborne, 2013).
The next step involved checking the data set for missing data. This is a common problem in
data analysis as it reduces the credibility of the data set. All cases with one or more missing values
on the demographic variables were deleted from the data set, hence reducing the sample (n = 291).
Little’s MCAR Test (Little, 1988) was conducted, and it was determined that the values missing on
the MWEP-SF, CVQ, and MCM scales were missing completely at random. Therefore, the
Expectation Maximization (EM) Algorithm method was utilized to replace these missing values.
This method proved to be the most feasible among the three (Mean Substitution and Multiple
Imputation by Chained Equations [MICE]).
Seven of the nine demographic variables in the study included a number of different
categories that contained n < 30. Given that group comparison methods require approximately n =
30 per group to satisfy the normality assumption, the categories that contained n < 30 were
combined meaningfully to ensure that categories were larger than n ≥ 30.
Using IBM SPSS AMOS Version 23, Confirmatory Factor Analysis (CFA) was performed
to determine the relationship between the latent factors of the three measurement scales (MEWP,
CVQ, and MCM) and the observed measures collected from the T&T sample (Brown, 2015).
Comparisons were conducted separately for each of the three scales that were obtained from
previous research that used EFA. After a number of different modifications, Table 2 explains a
detailed breakdown of the variables retained for the study after the CFA.
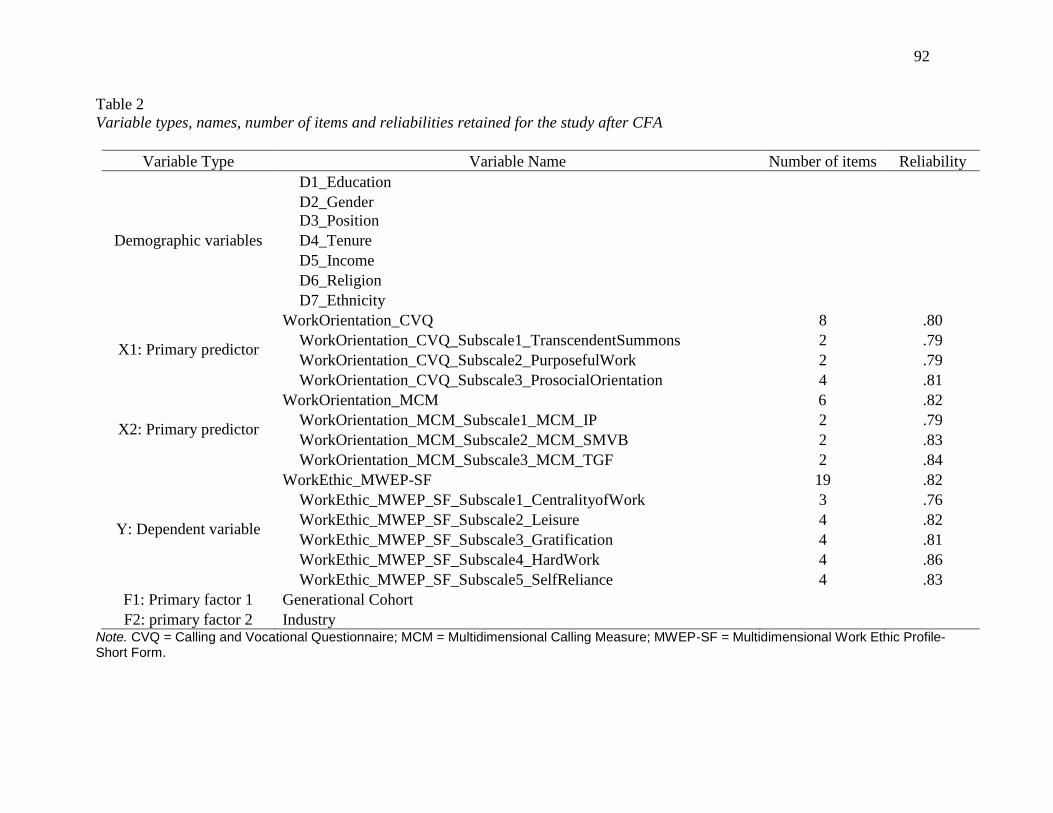
92
Table 2
Variable types, names, number of items and reliabilities retained for the study after CFA
Variable Type Variable Name Number of items Reliability
Demographic variables
D1_Education
D2_Gender
D3_Position
D4_Tenure
D5_Income
D6_Religion
D7_Ethnicity
X1: Primary predictor
WorkOrientation_CVQ 8 .80
WorkOrientation_CVQ_Subscale1_TranscendentSummons 2 .79
WorkOrientation_CVQ_Subscale2_PurposefulWork 2 .79
WorkOrientation_CVQ_Subscale3_ProsocialOrientation 4 .81
X2: Primary predictor
WorkOrientation_MCM 6 .82
WorkOrientation_MCM_Subscale1_MCM_IP 2 .79
WorkOrientation_MCM_Subscale2_MCM_SMVB 2 .83
WorkOrientation_MCM_Subscale3_MCM_TGF 2 .84
Y: Dependent variable
WorkEthic_MWEP-SF 19 .82
WorkEthic_MWEP_SF_Subscale1_CentralityofWork 3 .76
WorkEthic_MWEP_SF_Subscale2_Leisure 4 .82
WorkEthic_MWEP_SF_Subscale3_Gratification 4 .81
WorkEthic_MWEP_SF_Subscale4_HardWork 4 .86
WorkEthic_MWEP_SF_Subscale5_SelfReliance 4 .83
F1: Primary factor 1 Generational Cohort
F2: primary factor 2 Industry Note. CVQ = Calling and Vocational Questionnaire; MCM = Multidimensional Calling Measure; MWEP-SF = Multidimensional Work Ethic Profile-Short Form.
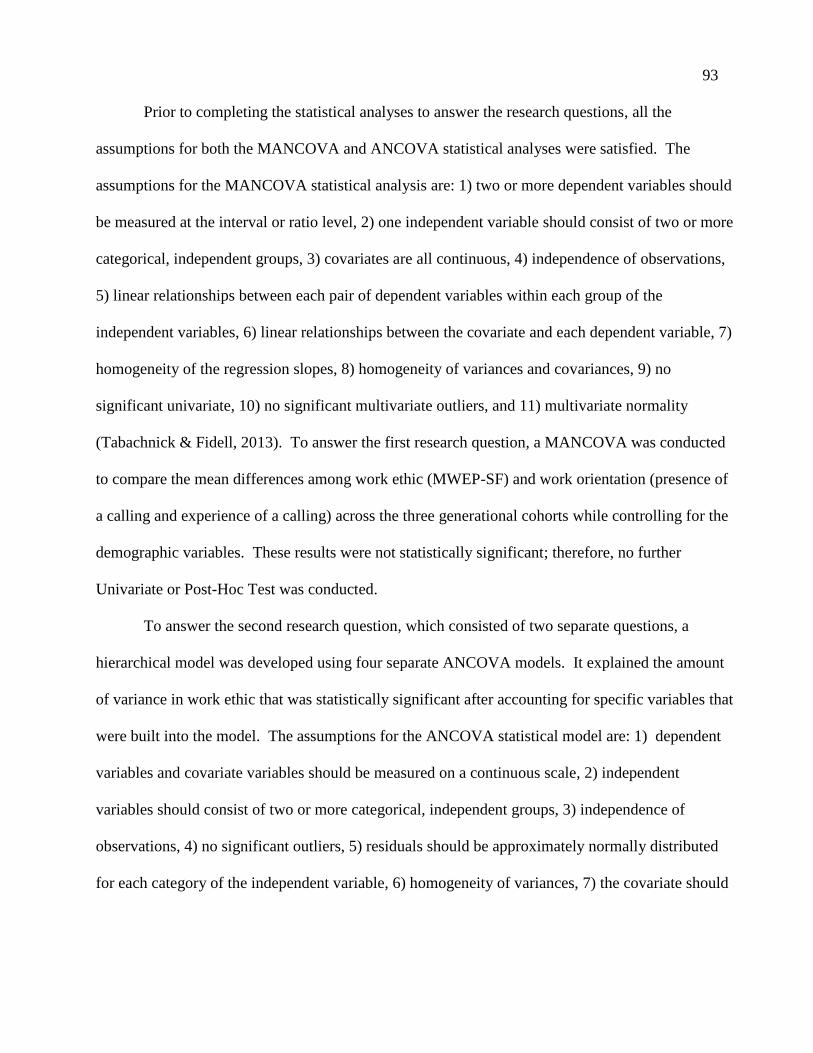
93
Prior to completing the statistical analyses to answer the research questions, all the
assumptions for both the MANCOVA and ANCOVA statistical analyses were satisfied. The
assumptions for the MANCOVA statistical analysis are: 1) two or more dependent variables should
be measured at the interval or ratio level, 2) one independent variable should consist of two or more
categorical, independent groups, 3) covariates are all continuous, 4) independence of observations,
5) linear relationships between each pair of dependent variables within each group of the
independent variables, 6) linear relationships between the covariate and each dependent variable, 7)
homogeneity of the regression slopes, 8) homogeneity of variances and covariances, 9) no
significant univariate, 10) no significant multivariate outliers, and 11) multivariate normality
(Tabachnick & Fidell, 2013). To answer the first research question, a MANCOVA was conducted
to compare the mean differences among work ethic (MWEP-SF) and work orientation (presence of
a calling and experience of a calling) across the three generational cohorts while controlling for the
demographic variables. These results were not statistically significant; therefore, no further
Univariate or Post-Hoc Test was conducted.
To answer the second research question, which consisted of two separate questions, a
hierarchical model was developed using four separate ANCOVA models. It explained the amount
of variance in work ethic that was statistically significant after accounting for specific variables that
were built into the model. The assumptions for the ANCOVA statistical model are: 1) dependent
variables and covariate variables should be measured on a continuous scale, 2) independent
variables should consist of two or more categorical, independent groups, 3) independence of
observations, 4) no significant outliers, 5) residuals should be approximately normally distributed
for each category of the independent variable, 6) homogeneity of variances, 7) the covariate should
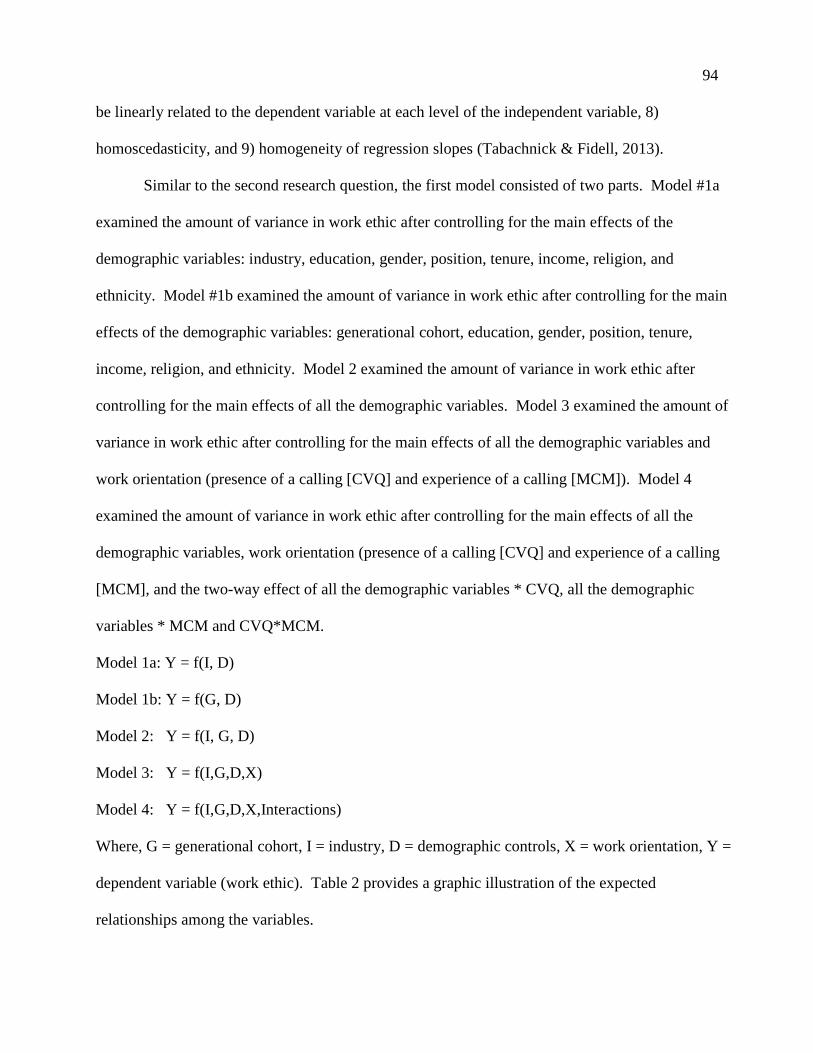
94
be linearly related to the dependent variable at each level of the independent variable, 8)
homoscedasticity, and 9) homogeneity of regression slopes (Tabachnick & Fidell, 2013).
Similar to the second research question, the first model consisted of two parts. Model #1a
examined the amount of variance in work ethic after controlling for the main effects of the
demographic variables: industry, education, gender, position, tenure, income, religion, and
ethnicity. Model #1b examined the amount of variance in work ethic after controlling for the main
effects of the demographic variables: generational cohort, education, gender, position, tenure,
income, religion, and ethnicity. Model 2 examined the amount of variance in work ethic after
controlling for the main effects of all the demographic variables. Model 3 examined the amount of
variance in work ethic after controlling for the main effects of all the demographic variables and
work orientation (presence of a calling [CVQ] and experience of a calling [MCM]). Model 4
examined the amount of variance in work ethic after controlling for the main effects of all the
demographic variables, work orientation (presence of a calling [CVQ] and experience of a calling
[MCM], and the two-way effect of all the demographic variables * CVQ, all the demographic
variables * MCM and CVQ*MCM.
Model 1a: Y = f(I, D)
Model 1b: Y = f(G, D)
Model 2: Y = f(I, G, D)
Model 3: Y = f(I,G,D,X)
Model 4: Y = f(I,G,D,X,Interactions)
Where, G = generational cohort, I = industry, D = demographic controls, X = work orientation, Y =
dependent variable (work ethic). Table 2 provides a graphic illustration of the expected
relationships among the variables.
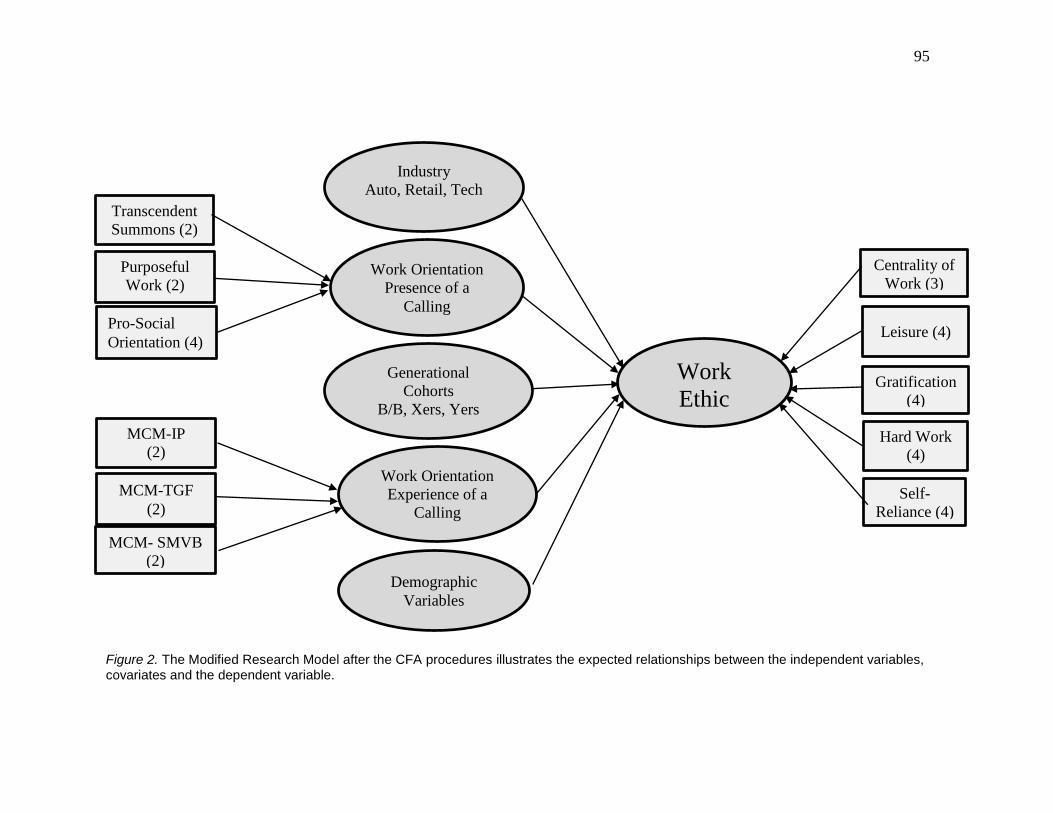
95
Figure 2. The Modified Research Model after the CFA procedures illustrates the expected relationships between the independent variables, covariates and the dependent variable.
Demographic
Variables
Industry
Auto, Retail, Tech
Generational
Cohorts
B/B, Xers, Yers
Work Orientation
Presence of a
Calling
Work Orientation
Experience of a
Calling
Transcendent
Summons (2)
Purposeful
Work (2)
Work
Pro-Social
Orientation (4)
MCM-IP
(2)
MCM-TGF
(2)
MCM- SMVB
(2)
Work
Ethic
Centrality of
Work (3)
Leisure (4)
Gratification
(4)
Hard Work
(4)
Self-
Reliance (4)
96
Assumptions
The researcher assumed that a quantitative study would produce sufficient information about
work orientation and work ethic among T&T generational cohorts. The researcher made the
assumption that the respondents would participate willingly, would be honest in their responses,
would complete the survey as instructed, and were capable of responding to the survey. In making
the choice to select the sample organization, the researcher assumed that its employees had
adequate opportunities in their working environment to sufficiently provide them with a perspective
of their work experiences. It is also assumed that employees who are at least 25 years would have
inculcated work attitudes and beliefs, which is critical for the success of this study. Finally, the
researcher assumed that individuals employed in full-time positions would engage in richer
experiences such as promotional opportunities, training and development, and employee benefits.
Ethical Assurances
All appropriate Institutional Review Board (IRB) of The Chicago School of Professional
Psychology (TCSPP) approvals were obtained prior to conducting the study. It was expected that
this study would involve minimal risk to the human subjects. Participants were informed of the
nature of the study, the researcher’s role, and how the data would be collected, used, and stored. On
completion of the study, the results will be presented to the conglomerate’s senior executive team
and the employees will have access to the study.
The completed surveys were stored on an external hard drive and locked in a secure file in
the researcher’s home office. As recommended by APA, all the data and information relating to the
study were stored on a safe, secure computer, and will be disposed of five years after the research
has been completed. The responses to the seven demographic questions that are integral to the
97
survey instrument, along with the researcher’s ability to access the respondents’ IP addresses, may
inhibit the researcher from protecting against the anonymity of the respondents.
The Oral Consent (see Appendix H) was included within the instrument. Prior to being
given access to the survey, participants were expected to agree to participate in the study by
selecting the “I Agree” option, which is a popular and acceptable practice. They were also
informed that they could have withdrawn from the study at any time without penalty. Additionally,
the questionnaire was not designed to inhibit participants from skipping any questions if they so
desired. However, since the responses to the first question, generational cohort, and the second
question, industry, were significant to the outcome of the study, respondents were not allowed to
skip these questions.
Conclusion
The objective of this chapter was to outline the details of the research methodology that the
researcher had engaged in to answer the study’s research questions. The best approach for testing
the non-experimental research design between work orientation and work ethic among Trinidad and
Tobago generational cohorts lies in the structured responses of quantitative research. This is a
predictive and causal comparison study utilizing MANCOVA and ANCOVA to analyze the work
ethic and work orientation of 291 employees from a major multi-national, multi-industry
corporation located in the twin islands of T&T.
The concept of work ethic is the primary element under investigation in this study. The
study focused on the manner in which members of each of the different generational cohorts in
T&T are oriented to their work. The results of this study provided insights that enabled the
researcher to explore work ethic from a much broader perspective. It is also expected that these
findings will make a significant contribution to the T&T work environment. Additionally, the
98
findings will assist organizational leaders in developing and implementing more sustainable hiring,
motivating, and retaining strategies. This will improve the overall performance of the organization,
thereby assisting in the elevation of the T&T economy.
99
Chapter 4: Findings
Introduction
This quantitative study used a non-experimental, predictive research design to examine the
composite work ethic and work orientation scores of 291 individuals across three generational
cohorts employed in a multi-national, multi-industry corporation located in the twin islands of T&T.
Data were collected from June 12, 2018, to July 3, 2018, via an online survey hosted by Survey
Monkey. The survey contained 49 items that were measured on a Likert Scale, three open-ended
items, and nine demographic variables. The primary objective of this study was to answer two
research questions that focused on predicting work ethic and work orientation across the three
generational cohorts existing in the T&T work environment.
This fourth chapter presents the results of the statistical analyses used to answer the research
questions developed in earlier chapters for this study. The questions are:
1. What are the differences in work ethic and work orientation among T&T generational
cohorts employed at a major multi-national, multi-industry corporation, controlling for the
demographic variables?
2.a. Does work orientation predict work ethic across all T&T generational cohorts employed
at a major multi-national, multi-industry corporation, controlling for demographic variables?
2.b. Does work orientation predict work ethic across all industries at a major multi-national,
multi-industry corporation in T&T, controlling for demographic variables?
The chapter commences with a brief explanation of the sampling technique used to recruit the
participants, as well as the description of the scales utilized to collect the data for the study. It
continues with the population and response rate for the study. Next, the strategies for addressing
missing values in both the demographic variables and the measurement scales are explained, and
100
the sample for the study is reported (n = 291). The next section provides descriptive statistics that
allowed for easy comparisons of the demographic variables and the three scales utilized to answer
the research questions. The chapter then proceeds with Confirmatory Factor Analyses (CFA)
procedures to determine the relationship between the latent factors of the three scales and the
observed measures collected from the sample (Brown, 2015). It continues with an examination of
the correlations among the three modified scales and the demographic variables. The chapter
concludes with a report of the MANCOVA and ANCOVA analyses that will be used to answer the
research questions and a detailed analysis of the three open-ended questions using NVivo.
Data Source and Sampling Approach
A non-probability criterion sampling technique was utilized to select the sample for the
study from a multi-national, multi-industry corporation. The study investigated the differences in
the composite scores of the three sub-scales that measured the association between the dependent
variables, work ethic (MWEP-SF) and work orientation (CVQ and MCM), and the independent
variable, generational cohort. The survey instrument used to collect data for this study included
three measurement scales, which consisted of 49 closed-ended items in a Likert-type scale, nine
demographic items, and three open-ended questions. Using Survey Monkey, the survey instrument
was emailed to all the individuals that qualified to participate in the study. A breakdown of the
response rate is explained in the following section.
Participants
The criterion sampling method was used to select the study’s population of 1,578
employees. An invitation to participate in the study was sent to the 1,578 employees that met the
criteria, to which 353 employees (22.4%) responded. Nine of the individuals (.57%) who initially
responded to the request to participate elected not to participate in the study, and 26 individuals
101
failed to complete the survey, so their responses were removed from the study. This led to a sample
size of 318 respondents, approximately 20.2% of the initial sample. With the sample size
determined, the next step was to examine the data for missing values and outliers, which could have
negative statistical impacts on the results.
Data Screening
Data screening is the first step in the data analysis process, and it is the most critical, as data
entry errors create dramatically different results during the data analyses. Data screening involves
five steps: checking the accuracy of the data entry, checking for missing data, checking for outliers,
examining the normality of distributions, and determining the appropriateness of data
transformations.
Prior to conducting the main data analyses, all the variables of interest were examined
through SPSS Version 23 program for accuracy of data entry, missing values, both univariate and
multivariate outliers, and the normality of distribution. There were no erroneous, inconsistent, or
inaccurate data identified; therefore, the next step involved examining the dataset for missing
values. The missing data for the demographic variables and the three measurement scales were
examined separately and used different methods. With respect to the nine demographic variables
(generational cohort, industry, education, gender, position, tenure, income, religion, and ethnicity),
a total of 27 cases (8.5% of the sample) were identified as having at least one missing value. Each
case containing a missing value was removed using the list-wise approach, which reduced the
sample from n = 318 to n = 291.
The three measurement scales (MWEP-SF, CVQ, and MCM) contained between 0.3% and
3.4% missing values. Little’s MCAR Test was conducted to determine whether the values were
missing randomly or non-randomly. Given that the p-values of the three subscales (MWEP-SF,
102
CVQ, and MCM) were between .13 and .89, this indicated that the missing values were likely
missing completely at random. Once this was determined the missing variables were replaced using
the Expectation Maximization Algorithm (EMA), an iterative approach to finding the maximum-
likelihood estimates for missing values. The EMA approach proved to be the most appropriate in
order to avoid further reducing the size of the Baby Boomer sample. Secondly, this approach
proved to be the best option for handling a small percentage of missing data in the measurement
variables (Gupta & Chen, 2010).
Checking the dataset for both univariate and multivariate outliers was the next step in the
data screening process. Outliers are scores that are different from other scores, which, among other
reasons, may have resulted from faking or deviant responses, and therefore distort the results of a
study (Heppner & Heppner, 2004). To identify the outliers in the dataset, each raw score was
converted into a Z score, and they were examined. A total of 38 cases across the three measurement
scales (MWEP-SF, CVQ, and MCM) were found to have extreme univariate outliers. Using
Mahalanobis distance statistics (Tabachnick & Fidell, 2013) with p < .001, 16 cases were identified
as multivariate outliers between the MWEP-SF, CVQ, and MCM measurement scales. Tabachnick
and Fidell, (2013) suggested two strategies to reduce the influence of outliers. The first was to
delete the entire case, and the second was to alter the case score by replacing it with the mean of all
the cases. To avoid further reducing the sample size of the study, both the univariate and
multivariate outliers were deleted and replaced by the mean score of all the cases on the variable;
hence, 291 cases were maintained for the analyses.
To ensure that all demographic categories had an adequate number of cases, those that were
n < 30 were increased by combining similar categories to form group sizes that were n > 30
(discussed in more detail in the Descriptive Statistic section below). This strategy also ensured that
103
the violation of the normality assumption would not cause any major problems (Mordkoff, 2016;
Pallant, 2007). According to Field (2009, p. 134), in samples such that n > 30 or n > 40, the
sampling distribution tends to be normal, irrespective of the distribution of the original data. Given
that all categories, with the exception of Baby Boomers, were n ≥ 30, it was expected that the
outcome variables for all groups would be normally distributed. The normality patterns are
examined in the descriptive section below.
Preliminary Analyses
Prior to conducting the statistical analyses, exploratory analyses were performed to describe
the characteristics of the data. These included reporting descriptive statistics, assessing the
reliability coefficients, and analyzing and reporting the correlations among variables. Descriptive
statistics were used to describe the main tendencies of the variables of interest. Mean (M) and
standard deviation (SD) were reported for the items on the measurement scales, and the frequencies
and percentages were reported for the demographic variables. The reliability coefficients of the
measurement scales were assessed to determine if they were above .70 and were comparable to
previous studies. Finally, the ability to identify unusual correlations among variables provided the
opportunity for the researcher to detect any other potential error/s in the dataset. The descriptive
statistics that follow commence the exploratory analysis of the dataset.
Descriptive Statistics
Demographic Variables
This section will describe the characteristics of the sample (n = 291) by generational cohort,
industry, and then generational cohort by industry. Figure 3 illustrates a breakdown of the sample
by generational cohort. A total of 6% (n =19) were Baby Boomers, born between 1940 and 1959;
51% (n = 148) were Generation Xers, born between 1960 and 1980; and 43% (n = 124) were
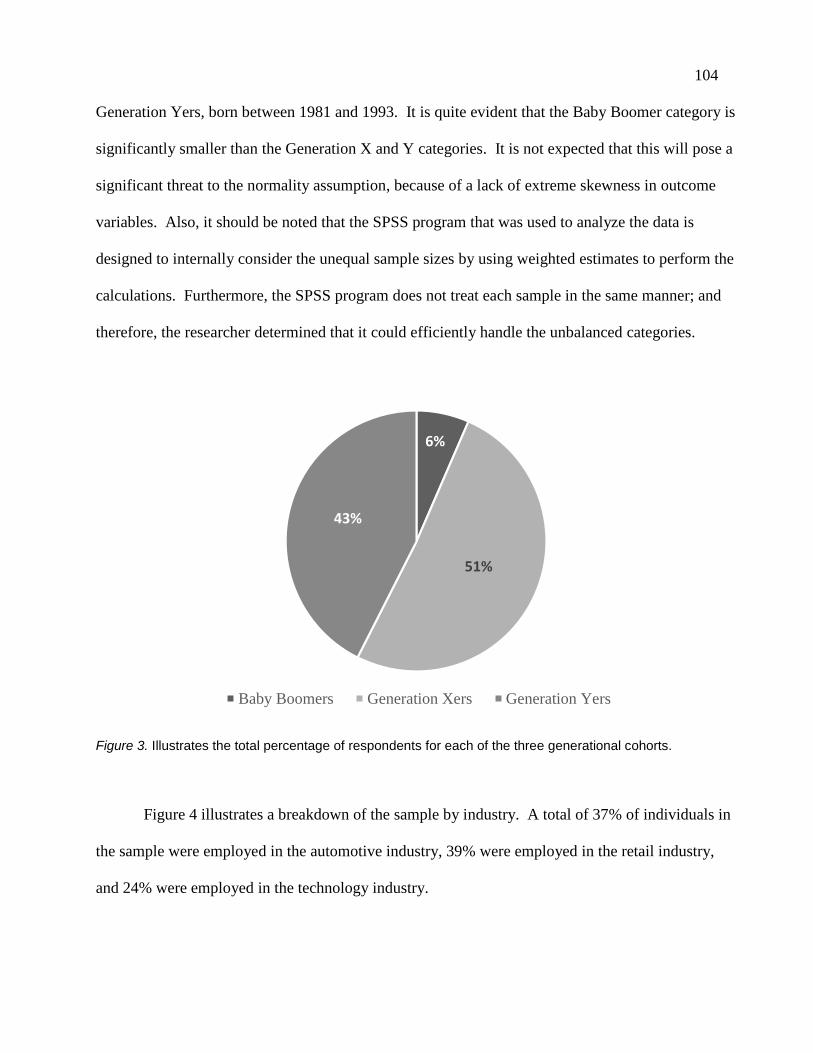
104
Generation Yers, born between 1981 and 1993. It is quite evident that the Baby Boomer category is
significantly smaller than the Generation X and Y categories. It is not expected that this will pose a
significant threat to the normality assumption, because of a lack of extreme skewness in outcome
variables. Also, it should be noted that the SPSS program that was used to analyze the data is
designed to internally consider the unequal sample sizes by using weighted estimates to perform the
calculations. Furthermore, the SPSS program does not treat each sample in the same manner; and
therefore, the researcher determined that it could efficiently handle the unbalanced categories.
Figure 3. Illustrates the total percentage of respondents for each of the three generational cohorts.
Figure 4 illustrates a breakdown of the sample by industry. A total of 37% of individuals in
the sample were employed in the automotive industry, 39% were employed in the retail industry,
and 24% were employed in the technology industry.
6%
51%
43%
Baby Boomers Generation Xers Generation Yers
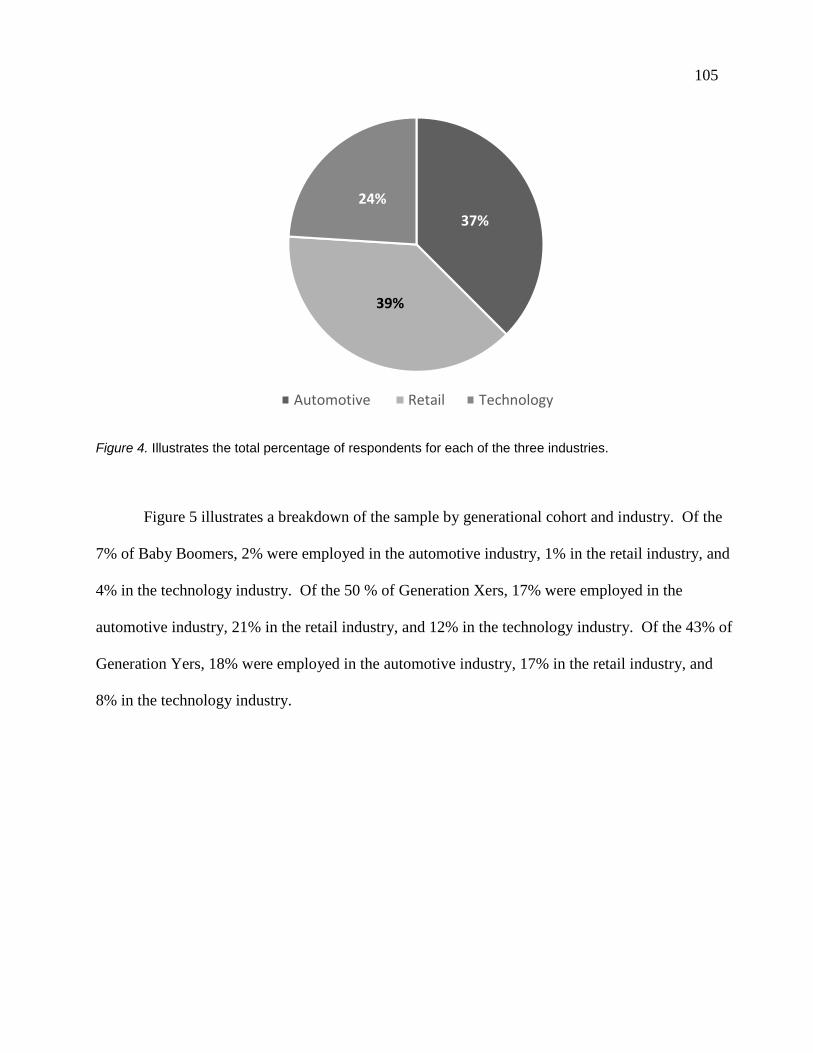
105
Figure 4. Illustrates the total percentage of respondents for each of the three industries.
Figure 5 illustrates a breakdown of the sample by generational cohort and industry. Of the
7% of Baby Boomers, 2% were employed in the automotive industry, 1% in the retail industry, and
4% in the technology industry. Of the 50 % of Generation Xers, 17% were employed in the
automotive industry, 21% in the retail industry, and 12% in the technology industry. Of the 43% of
Generation Yers, 18% were employed in the automotive industry, 17% in the retail industry, and
8% in the technology industry.
37%
39%
24%
Automotive Retail Technology
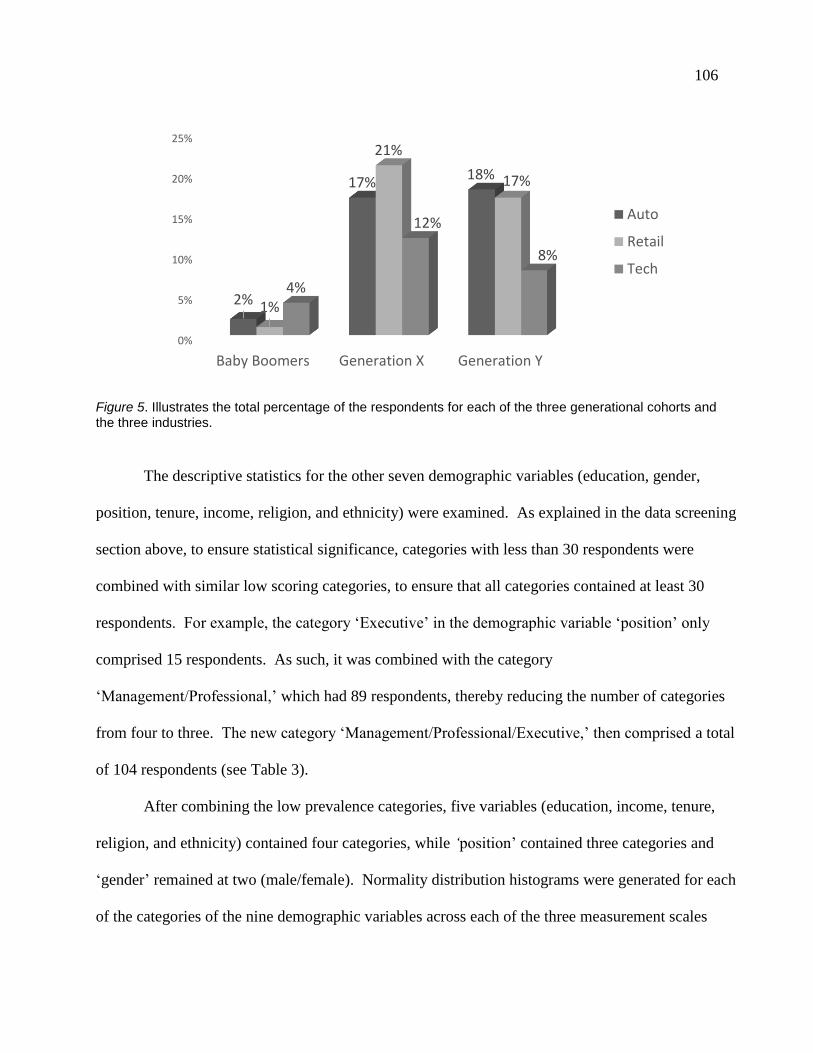
106
Figure 5. Illustrates the total percentage of the respondents for each of the three generational cohorts and the three industries.
The descriptive statistics for the other seven demographic variables (education, gender,
position, tenure, income, religion, and ethnicity) were examined. As explained in the data screening
section above, to ensure statistical significance, categories with less than 30 respondents were
combined with similar low scoring categories, to ensure that all categories contained at least 30
respondents. For example, the category ‘Executive’ in the demographic variable ‘position’ only
comprised 15 respondents. As such, it was combined with the category
‘Management/Professional,’ which had 89 respondents, thereby reducing the number of categories
from four to three. The new category ‘Management/Professional/Executive,’ then comprised a total
of 104 respondents (see Table 3).
After combining the low prevalence categories, five variables (education, income, tenure,
religion, and ethnicity) contained four categories, while ‘position’ contained three categories and
‘gender’ remained at two (male/female). Normality distribution histograms were generated for each
of the categories of the nine demographic variables across each of the three measurement scales
0%
5%
10%
15%
20%
25%
Baby Boomers Generation X Generation Y
2%
17%18%
1%
21%
17%
4%
12%
8%
Auto
Retail
Tech
107
(MWEP-SF, CVQ, and MCM; see Appendix L). Normality patterns were observed in most of the
histograms; however, a few minor inconsistencies were identified in some of the categories of the
demographic variables. These minor inconsistencies were expected due to sampling variability.
Table 3 reports the frequency distributions and percentages for the original and combined categories
of seven demographic variables.
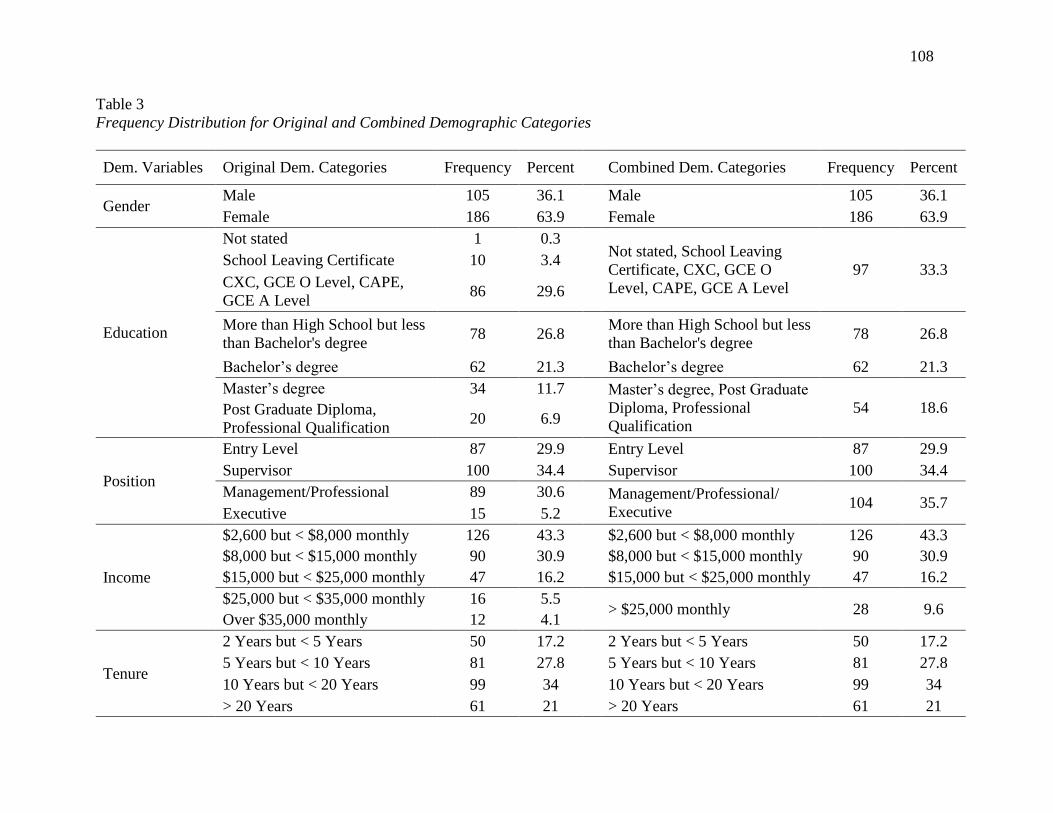
108
Table 3
Frequency Distribution for Original and Combined Demographic Categories
Dem. Variables Original Dem. Categories Frequency Percent Combined Dem. Categories Frequency Percent
Gender Male 105 36.1 Male 105 36.1
Female 186 63.9 Female 186 63.9
Education
Not stated 1 0.3 Not stated, School Leaving
Certificate, CXC, GCE O
Level, CAPE, GCE A Level
97 33.3 School Leaving Certificate 10 3.4
CXC, GCE O Level, CAPE,
GCE A Level 86 29.6
More than High School but less
than Bachelor's degree 78 26.8
More than High School but less
than Bachelor's degree 78 26.8
Bachelor’s degree 62 21.3 Bachelor’s degree 62 21.3
Master’s degree 34 11.7 Master’s degree, Post Graduate
Diploma, Professional
Qualification
54 18.6 Post Graduate Diploma,
Professional Qualification 20 6.9
Position
Entry Level 87 29.9 Entry Level 87 29.9
Supervisor 100 34.4 Supervisor 100 34.4
Management/Professional 89 30.6 Management/Professional/
Executive 104 35.7
Executive 15 5.2
Income
$2,600 but < $8,000 monthly 126 43.3 $2,600 but < $8,000 monthly 126 43.3
$8,000 but < $15,000 monthly 90 30.9 $8,000 but < $15,000 monthly 90 30.9
$15,000 but < $25,000 monthly 47 16.2 $15,000 but < $25,000 monthly 47 16.2
$25,000 but < $35,000 monthly 16 5.5 > $25,000 monthly 28 9.6
Over $35,000 monthly 12 4.1
Tenure
2 Years but < 5 Years 50 17.2 2 Years but < 5 Years 50 17.2
5 Years but < 10 Years 81 27.8 5 Years but < 10 Years 81 27.8
10 Years but < 20 Years 99 34 10 Years but < 20 Years 99 34
> 20 Years 61 21 > 20 Years 61 21
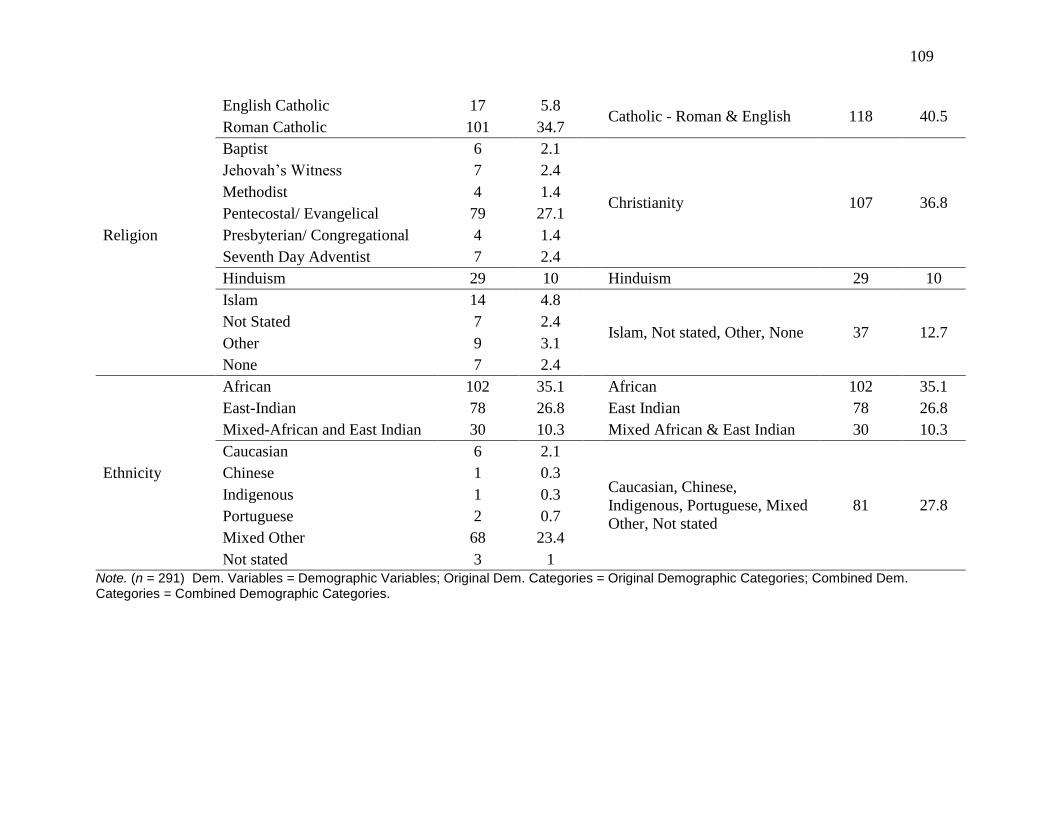
109
Religion
English Catholic 17 5.8 Catholic - Roman & English 118 40.5
Roman Catholic 101 34.7
Baptist 6 2.1
Christianity 107 36.8
Jehovah’s Witness 7 2.4
Methodist 4 1.4
Pentecostal/ Evangelical 79 27.1
Presbyterian/ Congregational 4 1.4
Seventh Day Adventist 7 2.4
Hinduism 29 10 Hinduism 29 10
Islam 14 4.8
Islam, Not stated, Other, None 37 12.7 Not Stated 7 2.4
Other 9 3.1
None 7 2.4
Ethnicity
African 102 35.1 African 102 35.1
East-Indian 78 26.8 East Indian 78 26.8
Mixed-African and East Indian 30 10.3 Mixed African & East Indian 30 10.3
Caucasian 6 2.1
Caucasian, Chinese,
Indigenous, Portuguese, Mixed
Other, Not stated
81 27.8
Chinese 1 0.3
Indigenous 1 0.3
Portuguese 2 0.7
Mixed Other 68 23.4
Not stated 3 1 Note. (n = 291) Dem. Variables = Demographic Variables; Original Dem. Categories = Original Demographic Categories; Combined Dem. Categories = Combined Demographic Categories.
110
A review of the results indicated that almost 64% of the participants were females, and 36%
were males. In comparison to the T&T labor force, this seems somewhat skewed. According to
the (Trinidad and Tobago Central Statistical Office Quarter 4 Report, 2017), the labor force
consisted of 42% females and 58% males.
As many as 33.3% of this study’s sample reported high school or less as their highest level
of education completed, while 26.8% reported less than bachelor’s as their highest level of
education completed. The three categories of positions reported somewhat similar results: 30% in
entry level 34.4% in supervisory, and 35.7% in management/professional positions. As many as
34% of individuals in the sample had been employed in the sample organization for between 10 and
20 years, and 27.8% had been employed for between five and 10 years. In terms of reported
income, almost 44% of the sample earned between TT$2,600 and TT$7,999 monthly, and 30.9%
earned betweenTT$8,000 and TT$14,999. In terms of religion, the majority of the individuals in
the sample reported that they were Roman and English Catholic. Christianity was the next most
popular religion.
As many as 35% of the individuals in the sample were African; 27.8% were a combination
of Caucasian, Chinese, Indigenous, Portuguese, Mixed Other, and not stated; 26.8% were East
Indian; and 10.3% were mixed African and East Indian. In comparison to the Trinidad and Tobago
2011 Population and Housing Census Demographic Report Central Statistical Office (2011), these
categories seem slightly skewed. According to the report, 34.2% of the population indicated they
were African; 35.4% were East Indian; 22.44% were a combination of Caucasian, Chinese,
Indigenous, Portuguese, Mixed Other, and not stated; and 7.66% were mixed African and East
Indian.
111
Measurement Scales
This section provides the descriptive statistics for the three measurement scales. The mean
score for each of the three measurement scales was computed. This non-refined method was
selected over the other methods as it provided the opportunity to foster the retention of the scale
metric. This allowed for easier interpretation (DiStefano, Zhu, & Mîndrilă, 2009).
The MWEP-SF uses a five-point Likert scale (1= Strongly disagree to 5 = Strongly agree),
to investigate the respondents’ attitudes and beliefs towards their work in general and not to a
specific job. The scale comprises seven factors (which were important for the CFA procedures
conducted below), each with four items, hence totaling 28 items. For the purpose of this study, the
MWEP-SF was operationalized as a uni-dimensional instrument. Therefore, the composite score of
the 28 items was calculated to conduct the statistical analyses below.
The overall mean reported for the MWEP – SF measurement scales was M = 3.86. This
indicates that most of the respondents agreed that they were demonstrating positive attitudes and
beliefs towards their work in general. Additionally, almost 70% of the sample agreed and strongly
agreed that they were demonstrating strong attitudes and beliefs towards their work in general and
not to a specific job. More specifically, the means for the seven factors assessing work ethic in the
study were: Wasted Time (M = 4.25), Centrality of Work (M = 4.26), Morality/Ethic (M = 4.70),
Leisure (M = 3.00), Gratification (M = 3.27), Hard Work (M = 4.04), and Self-Reliance (M = 3.53;
see Table 4). These results imply that, on average, respondents tended to strongly agree with
Morality/Ethic, and they agreed with Wasted Time, Centrality of Work, and Hard Work.
Additionally, they leaned towards agreeing with Self-Reliance. On average, they neither agreed nor
disagreed with Leisure, and they were inclined to have a neutral perspective towards Gratification
as well.
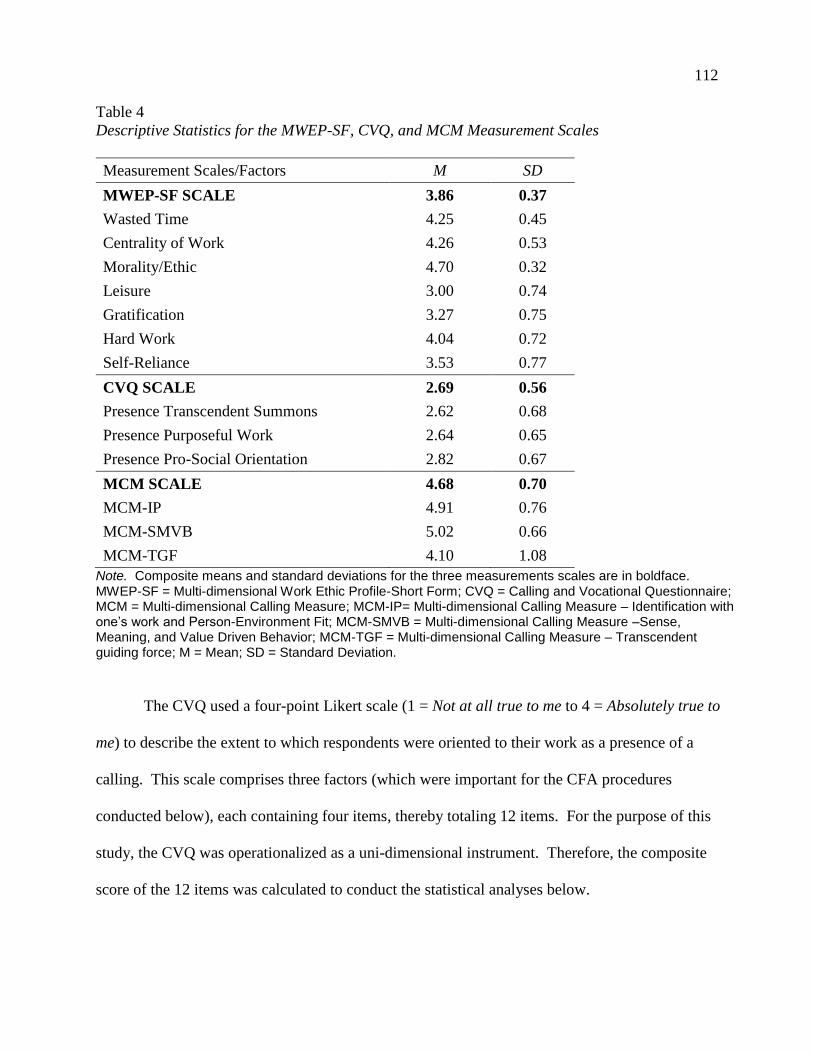
112
Table 4
Descriptive Statistics for the MWEP-SF, CVQ, and MCM Measurement Scales
Measurement Scales/Factors M SD
MWEP-SF SCALE 3.86 0.37
Wasted Time 4.25 0.45
Centrality of Work 4.26 0.53
Morality/Ethic 4.70 0.32
Leisure 3.00 0.74
Gratification 3.27 0.75
Hard Work 4.04 0.72
Self-Reliance 3.53 0.77
CVQ SCALE 2.69 0.56
Presence Transcendent Summons 2.62 0.68
Presence Purposeful Work 2.64 0.65
Presence Pro-Social Orientation 2.82 0.67
MCM SCALE 4.68 0.70
MCM-IP 4.91 0.76
MCM-SMVB 5.02 0.66
MCM-TGF 4.10 1.08
Note. Composite means and standard deviations for the three measurements scales are in boldface. MWEP-SF = Multi-dimensional Work Ethic Profile-Short Form; CVQ = Calling and Vocational Questionnaire; MCM = Multi-dimensional Calling Measure; MCM-IP= Multi-dimensional Calling Measure – Identification with one’s work and Person-Environment Fit; MCM-SMVB = Multi-dimensional Calling Measure –Sense, Meaning, and Value Driven Behavior; MCM-TGF = Multi-dimensional Calling Measure – Transcendent guiding force; M = Mean; SD = Standard Deviation.
The CVQ used a four-point Likert scale (1 = Not at all true to me to 4 = Absolutely true to
me) to describe the extent to which respondents were oriented to their work as a presence of a
calling. This scale comprises three factors (which were important for the CFA procedures
conducted below), each containing four items, thereby totaling 12 items. For the purpose of this
study, the CVQ was operationalized as a uni-dimensional instrument. Therefore, the composite
score of the 12 items was calculated to conduct the statistical analyses below.
113
The overall mean reported for the CVQ measurement scales was M = 2.69. These results
imply that, on average, respondents thought that their work activities were mostly explained as a
calling. Additionally, it was determined that 52% of individuals in the sample reported that having
a calling was mostly or absolutely true to them. The means for the three factors assessing presence
of a calling in the study were: Presence Transcendent Summons (M = 2.62), Presence Purposeful
Work (M = 2.64), and Presence Pro-Social Orientation (M = 2.82; see Table 4). These results imply
that, on average, respondents reported that it was mostly true for each of the three factors: Presence
Transcendent Summons, Presence Purposeful Work, and Presence Pro-Social Orientation.
The MCM used a six-point Likert scale (1 = Strongly disagree to 6 = Strongly agree) to
investigate the extent to which respondents experienced a calling when performing their work
activities. It comprises three factors (which were important for the CFA procedures conducted
below), each consisting of three items, hence totaling 9 items. For the purpose of this study, the
MCM was operationalized as a uni-dimensional instrument. Therefore, the composite score of the
nine items was calculated to conduct the statistical analyses below.
The overall mean reported for the MCM measurement scales was M = 4.68. This
suggests that respondents agreed that they experienced a calling when performing their work
activities. Almost 50% of individuals in the sample agreed and strongly agreed that they
experienced a calling as they performed their duties and functions. The means for the three factors
assessing experience of a calling were: Identification with one’s Work, Person Environment Fit (M
= 4.91); Sense and Meaning – Value Driven Behavior (M = 5.0); and Transcendent Guiding Force
(M = 4.10; see Table 4). These results imply that of the three factors, on average, most of the
respondents tended to agree with Identification with one’s Work, Person Environment Fit.
Furthermore, they agreed with Sense and Meaning – Value Driven Behavior, and somewhat agreed
114
with Transcendent Guiding Force. Overall, these initial results are encouraging and as such it can
be concluded that the constructs are salient for this sample (see Appendix M).
This section examined, in detail, the descriptive statistics for the nine demographic variables
and the three measurement scales used to answer the two research questions for this study. In the
next section, confirmatory factor analysis will be performed to determine whether a relationship
exists between the observed measures and the latent factors of the three measurement scales.
Confirmatory Factor Analysis (CFA)
Prior to embarking on the statistical analyses to answer the research questions, the
researcher conducted Confirmatory Factor Analyses (CFA) procedures to determine the relationship
between the latent factors of the three measurement scales (MEWP-SF, CVQ, and MCM) and the
observed measures collected from the T&T sample (Brown, 2015). Among other analytical
possibilities, the CFA provided the opportunity for the researcher to estimate the reliability of the
three measurement scales and the convergent and discriminant validity of the theoretical constructs
from the T&T sample (Brown, 2015). During the CFA procedures, if all the major correlations in
the dataset are accounted for, the dataset is considered a ‘good fit.’ However, if discrepancies are
identified between the correlations proposed and those observed, the dataset is considered a ‘poor
fit.’ Observed variables that are determined as ‘poor fit’ are eliminated from the study.
The MWEP-SF measurement scale consisted of seven factors (Wasted Time, Centrality of
work, Morality/Ethic, Leisure, Gratification, Hard Work, and Self-Reliance), each containing four
items, and thereby totaling 28 items. Using IBM SPSS AMOS, CFA was conducted on the MWEP-
SF Model-A. The results of the procedure indicated that χ2 (6, N = 291) = 1.80, p < .001, CFI =
0.91, GFI = 0.87, AGFI = 0.84, RMSEA = 0.05, and PCLOSE = 0.27 (see Table 5). This original
MWEP-SF Model-A did not meet the acceptable thresholds as suggested by Hu and Bentler (1999):
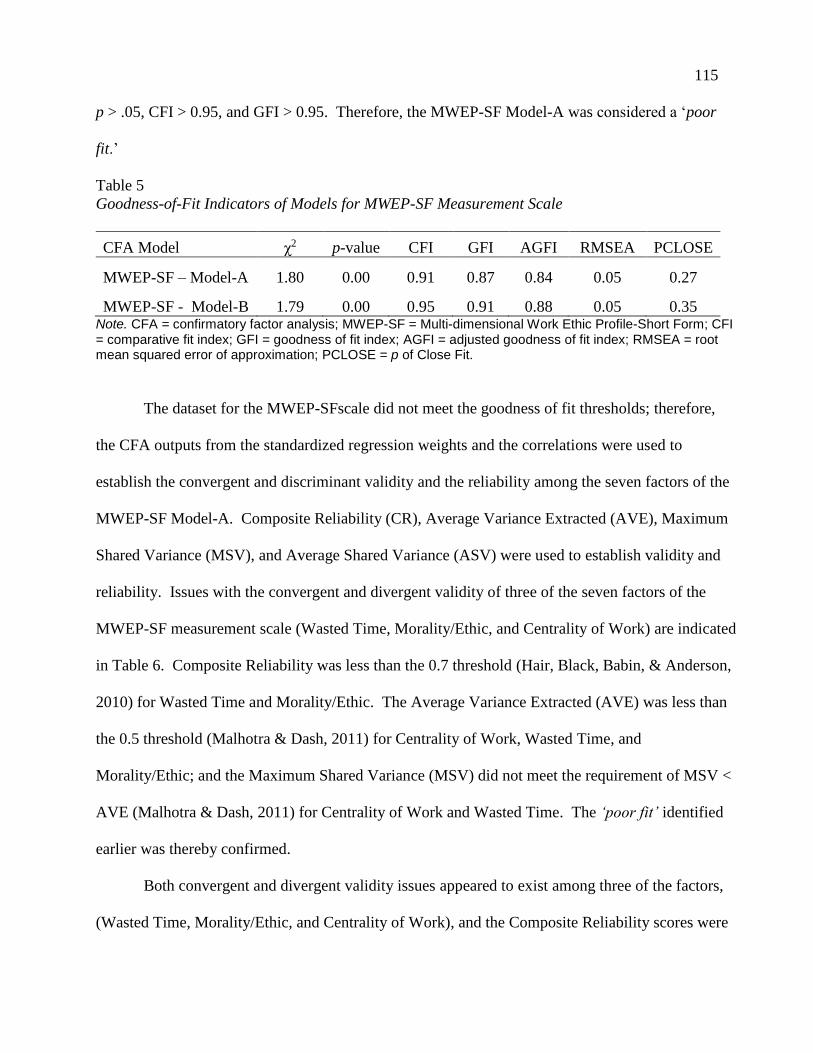
115
p > .05, CFI > 0.95, and GFI > 0.95. Therefore, the MWEP-SF Model-A was considered a ‘poor
fit.’
Table 5
Goodness-of-Fit Indicators of Models for MWEP-SF Measurement Scale
CFA Model χ2 p-value CFI GFI AGFI RMSEA PCLOSE
MWEP-SF – Model-A 1.80 0.00 0.91 0.87 0.84 0.05 0.27
MWEP-SF - Model-B 1.79 0.00 0.95 0.91 0.88 0.05 0.35 Note. CFA = confirmatory factor analysis; MWEP-SF = Multi-dimensional Work Ethic Profile-Short Form; CFI = comparative fit index; GFI = goodness of fit index; AGFI = adjusted goodness of fit index; RMSEA = root mean squared error of approximation; PCLOSE = p of Close Fit.
The dataset for the MWEP-SFscale did not meet the goodness of fit thresholds; therefore,
the CFA outputs from the standardized regression weights and the correlations were used to
establish the convergent and discriminant validity and the reliability among the seven factors of the
MWEP-SF Model-A. Composite Reliability (CR), Average Variance Extracted (AVE), Maximum
Shared Variance (MSV), and Average Shared Variance (ASV) were used to establish validity and
reliability. Issues with the convergent and divergent validity of three of the seven factors of the
MWEP-SF measurement scale (Wasted Time, Morality/Ethic, and Centrality of Work) are indicated
in Table 6. Composite Reliability was less than the 0.7 threshold (Hair, Black, Babin, & Anderson,
2010) for Wasted Time and Morality/Ethic. The Average Variance Extracted (AVE) was less than
the 0.5 threshold (Malhotra & Dash, 2011) for Centrality of Work, Wasted Time, and
Morality/Ethic; and the Maximum Shared Variance (MSV) did not meet the requirement of MSV <
AVE (Malhotra & Dash, 2011) for Centrality of Work and Wasted Time. The ‘poor fit’ identified
earlier was thereby confirmed.
Both convergent and divergent validity issues appeared to exist among three of the factors,
(Wasted Time, Morality/Ethic, and Centrality of Work), and the Composite Reliability scores were
116
also low for Wasted Time and Morality/Ethic. Model-A was modified by deleting the four items in
the Wasted Time factor: It is important to stay busy at work and not waste time, Time should not be
wasted, it should be used efficiently, I constantly look for ways to productively use my time, and I
try to plan out my workday so as not to waste time. The four items in the Morality/Ethic factor
were also deleted: One should always take responsibility for one’s actions, One should not pass
judgment until one has heard all of the facts, It is important to treat others as you would like to be
treated, and People should be fair in their dealings with others. The first item in the Centrality of
Work factor was also deleted: I feel content when I have spent the day working. Model-B illustrates
the CFA output for the modifications conducted. The only improvement was the CFI = 0.95
because, as suggested by Hu and Bentler (1999), CFI > 0.95. However, an examination of the
convergent and divergent validity and reliability on the modified model indicated that no validity
issues existed. The alpha levels ranged from .76 to .86, indicating that they were acceptable and
considered reliable (see Table 6). In this regard, the MWEP-SF Model-B was accepted as the best
fit to measure participants’ Work Ethic for this study. After removing the nine items that proved to
be problematic, the MWEP-SF scale moved from 28 items to 19 items.
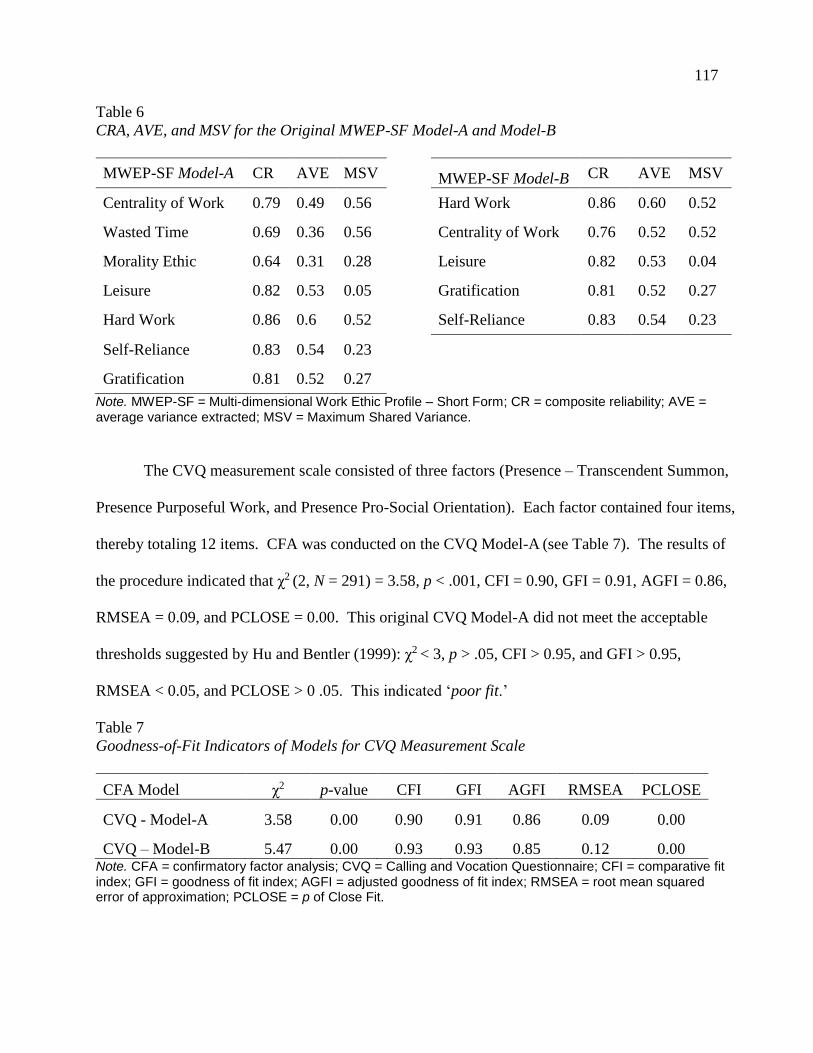
117
Table 6
CRA, AVE, and MSV for the Original MWEP-SF Model-A and Model-B
MWEP-SF Model-A CR AVE MSV MWEP-SF Model-B CR AVE MSV
Centrality of Work 0.79 0.49 0.56 Hard Work 0.86 0.60 0.52
Wasted Time 0.69 0.36 0.56 Centrality of Work 0.76 0.52 0.52
Morality Ethic 0.64 0.31 0.28 Leisure 0.82 0.53 0.04
Leisure 0.82 0.53 0.05 Gratification 0.81 0.52 0.27
Hard Work 0.86 0.6 0.52 Self-Reliance 0.83 0.54 0.23
Self-Reliance 0.83 0.54 0.23
Gratification 0.81 0.52 0.27
Note. MWEP-SF = Multi-dimensional Work Ethic Profile – Short Form; CR = composite reliability; AVE = average variance extracted; MSV = Maximum Shared Variance.
The CVQ measurement scale consisted of three factors (Presence – Transcendent Summon,
Presence Purposeful Work, and Presence Pro-Social Orientation). Each factor contained four items,
thereby totaling 12 items. CFA was conducted on the CVQ Model-A (see Table 7). The results of
the procedure indicated that χ2 (2, N = 291) = 3.58, p < .001, CFI = 0.90, GFI = 0.91, AGFI = 0.86,
RMSEA = 0.09, and PCLOSE = 0.00. This original CVQ Model-A did not meet the acceptable
thresholds suggested by Hu and Bentler (1999): χ2 < 3, p > .05, CFI > 0.95, and GFI > 0.95,
RMSEA < 0.05, and PCLOSE > 0 .05. This indicated ‘poor fit.’
Table 7
Goodness-of-Fit Indicators of Models for CVQ Measurement Scale
CFA Model χ2 p-value CFI GFI AGFI RMSEA PCLOSE
CVQ - Model-A 3.58 0.00 0.90 0.91 0.86 0.09 0.00
CVQ – Model-B 5.47 0.00 0.93 0.93 0.85 0.12 0.00 Note. CFA = confirmatory factor analysis; CVQ = Calling and Vocation Questionnaire; CFI = comparative fit index; GFI = goodness of fit index; AGFI = adjusted goodness of fit index; RMSEA = root mean squared error of approximation; PCLOSE = p of Close Fit.
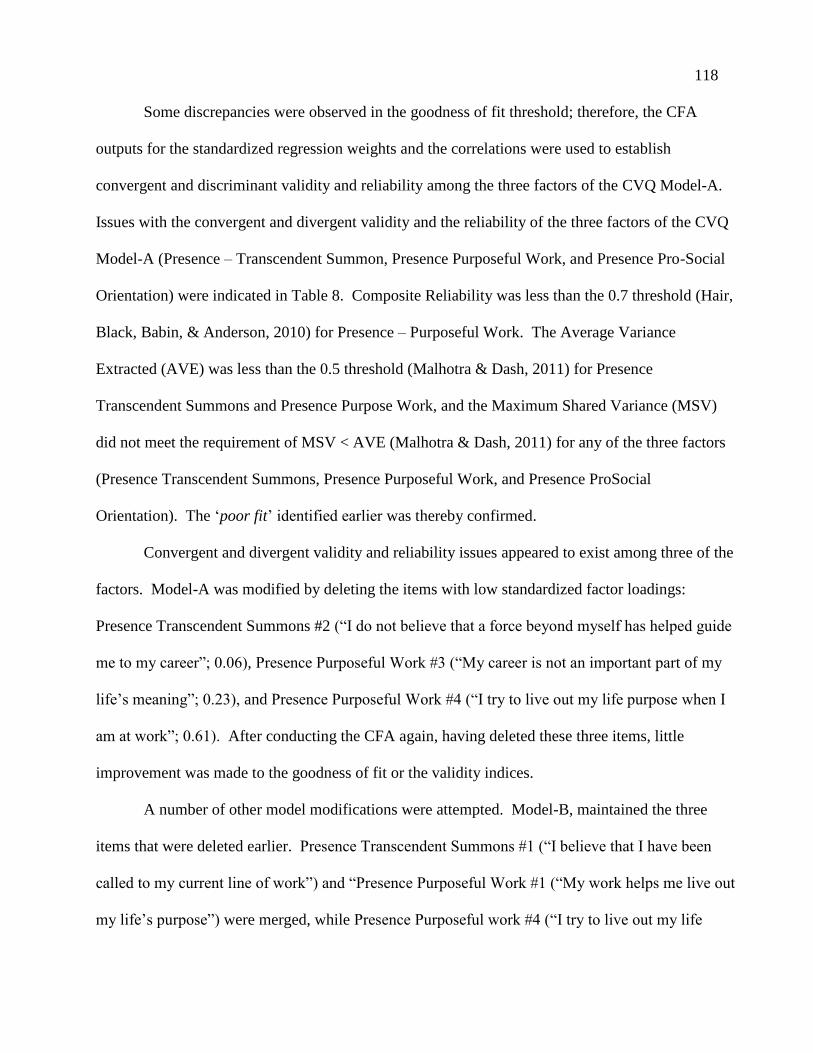
118
Some discrepancies were observed in the goodness of fit threshold; therefore, the CFA
outputs for the standardized regression weights and the correlations were used to establish
convergent and discriminant validity and reliability among the three factors of the CVQ Model-A.
Issues with the convergent and divergent validity and the reliability of the three factors of the CVQ
Model-A (Presence – Transcendent Summon, Presence Purposeful Work, and Presence Pro-Social
Orientation) were indicated in Table 8. Composite Reliability was less than the 0.7 threshold (Hair,
Black, Babin, & Anderson, 2010) for Presence – Purposeful Work. The Average Variance
Extracted (AVE) was less than the 0.5 threshold (Malhotra & Dash, 2011) for Presence
Transcendent Summons and Presence Purpose Work, and the Maximum Shared Variance (MSV)
did not meet the requirement of MSV < AVE (Malhotra & Dash, 2011) for any of the three factors
(Presence Transcendent Summons, Presence Purposeful Work, and Presence ProSocial
Orientation). The ‘poor fit’ identified earlier was thereby confirmed.
Convergent and divergent validity and reliability issues appeared to exist among three of the
factors. Model-A was modified by deleting the items with low standardized factor loadings:
Presence Transcendent Summons #2 (“I do not believe that a force beyond myself has helped guide
me to my career”; 0.06), Presence Purposeful Work #3 (“My career is not an important part of my
life’s meaning”; 0.23), and Presence Purposeful Work #4 (“I try to live out my life purpose when I
am at work”; 0.61). After conducting the CFA again, having deleted these three items, little
improvement was made to the goodness of fit or the validity indices.
A number of other model modifications were attempted. Model-B, maintained the three
items that were deleted earlier. Presence Transcendent Summons #1 (“I believe that I have been
called to my current line of work”) and “Presence Purposeful Work #1 (“My work helps me live out
my life’s purpose”) were merged, while Presence Purposeful work #4 (“I try to live out my life
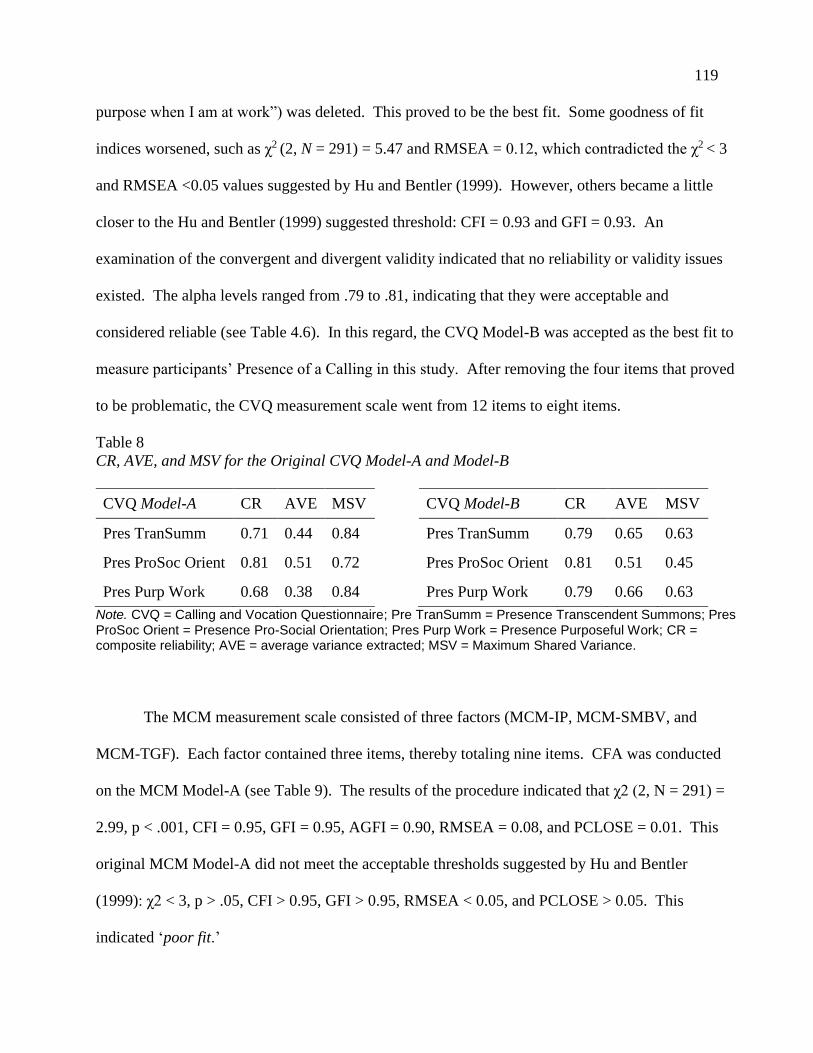
119
purpose when I am at work”) was deleted. This proved to be the best fit. Some goodness of fit
indices worsened, such as χ2 (2, N = 291) = 5.47 and RMSEA = 0.12, which contradicted the χ2 < 3
and RMSEA <0.05 values suggested by Hu and Bentler (1999). However, others became a little
closer to the Hu and Bentler (1999) suggested threshold: CFI = 0.93 and GFI = 0.93. An
examination of the convergent and divergent validity indicated that no reliability or validity issues
existed. The alpha levels ranged from .79 to .81, indicating that they were acceptable and
considered reliable (see Table 4.6). In this regard, the CVQ Model-B was accepted as the best fit to
measure participants’ Presence of a Calling in this study. After removing the four items that proved
to be problematic, the CVQ measurement scale went from 12 items to eight items.
Table 8
CR, AVE, and MSV for the Original CVQ Model-A and Model-B
CVQ Model-A CR AVE MSV CVQ Model-B CR AVE MSV
Pres TranSumm 0.71 0.44 0.84 Pres TranSumm 0.79 0.65 0.63
Pres ProSoc Orient 0.81 0.51 0.72 Pres ProSoc Orient 0.81 0.51 0.45
Pres Purp Work 0.68 0.38 0.84 Pres Purp Work 0.79 0.66 0.63
Note. CVQ = Calling and Vocation Questionnaire; Pre TranSumm = Presence Transcendent Summons; Pres ProSoc Orient = Presence Pro-Social Orientation; Pres Purp Work = Presence Purposeful Work; CR = composite reliability; AVE = average variance extracted; MSV = Maximum Shared Variance.
The MCM measurement scale consisted of three factors (MCM-IP, MCM-SMBV, and
MCM-TGF). Each factor contained three items, thereby totaling nine items. CFA was conducted
on the MCM Model-A (see Table 9). The results of the procedure indicated that χ2 (2, N = 291) =
2.99, p < .001, CFI = 0.95, GFI = 0.95, AGFI = 0.90, RMSEA = 0.08, and PCLOSE = 0.01. This
original MCM Model-A did not meet the acceptable thresholds suggested by Hu and Bentler
(1999): χ2 < 3, p > .05, CFI > 0.95, GFI > 0.95, RMSEA < 0.05, and PCLOSE > 0.05. This
indicated ‘poor fit.’
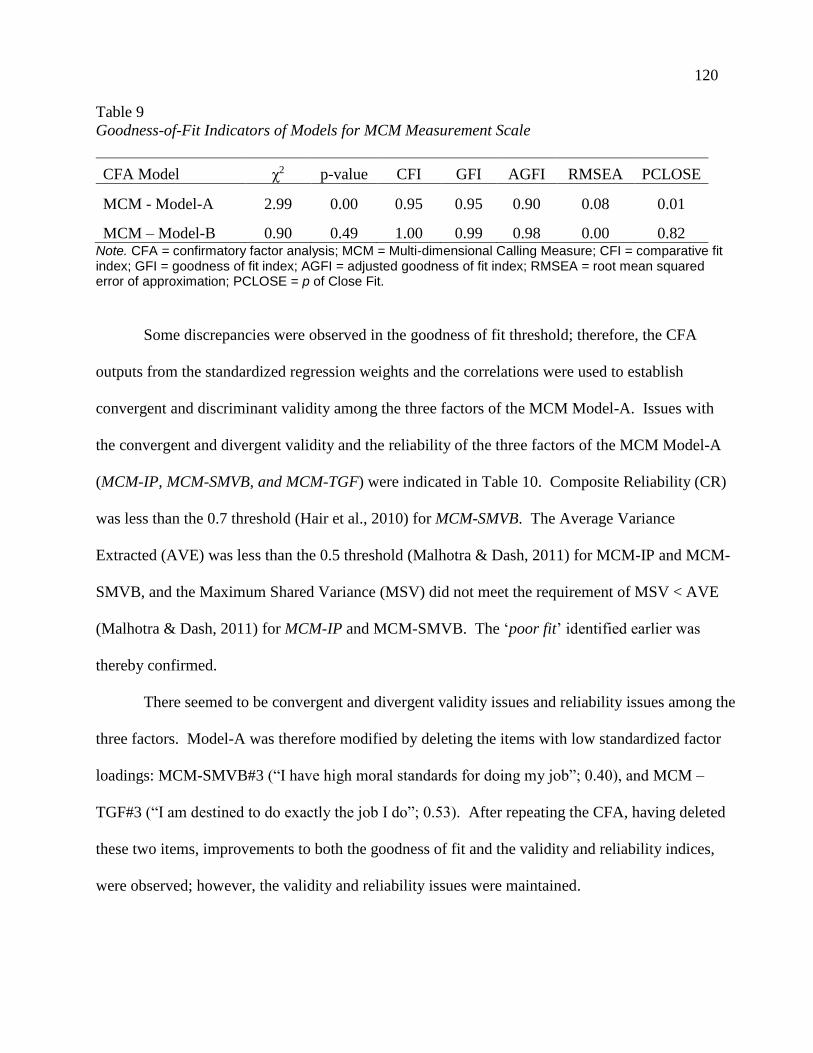
120
Table 9
Goodness-of-Fit Indicators of Models for MCM Measurement Scale
CFA Model χ2 p-value CFI GFI AGFI RMSEA PCLOSE
MCM - Model-A 2.99 0.00 0.95 0.95 0.90 0.08 0.01
MCM – Model-B 0.90 0.49 1.00 0.99 0.98 0.00 0.82 Note. CFA = confirmatory factor analysis; MCM = Multi-dimensional Calling Measure; CFI = comparative fit index; GFI = goodness of fit index; AGFI = adjusted goodness of fit index; RMSEA = root mean squared error of approximation; PCLOSE = p of Close Fit.
Some discrepancies were observed in the goodness of fit threshold; therefore, the CFA
outputs from the standardized regression weights and the correlations were used to establish
convergent and discriminant validity among the three factors of the MCM Model-A. Issues with
the convergent and divergent validity and the reliability of the three factors of the MCM Model-A
(MCM-IP, MCM-SMVB, and MCM-TGF) were indicated in Table 10. Composite Reliability (CR)
was less than the 0.7 threshold (Hair et al., 2010) for MCM-SMVB. The Average Variance
Extracted (AVE) was less than the 0.5 threshold (Malhotra & Dash, 2011) for MCM-IP and MCM-
SMVB, and the Maximum Shared Variance (MSV) did not meet the requirement of MSV < AVE
(Malhotra & Dash, 2011) for MCM-IP and MCM-SMVB. The ‘poor fit’ identified earlier was
thereby confirmed.
There seemed to be convergent and divergent validity issues and reliability issues among the
three factors. Model-A was therefore modified by deleting the items with low standardized factor
loadings: MCM-SMVB#3 (“I have high moral standards for doing my job”; 0.40), and MCM –
TGF#3 (“I am destined to do exactly the job I do”; 0.53). After repeating the CFA, having deleted
these two items, improvements to both the goodness of fit and the validity and reliability indices,
were observed; however, the validity and reliability issues were maintained.
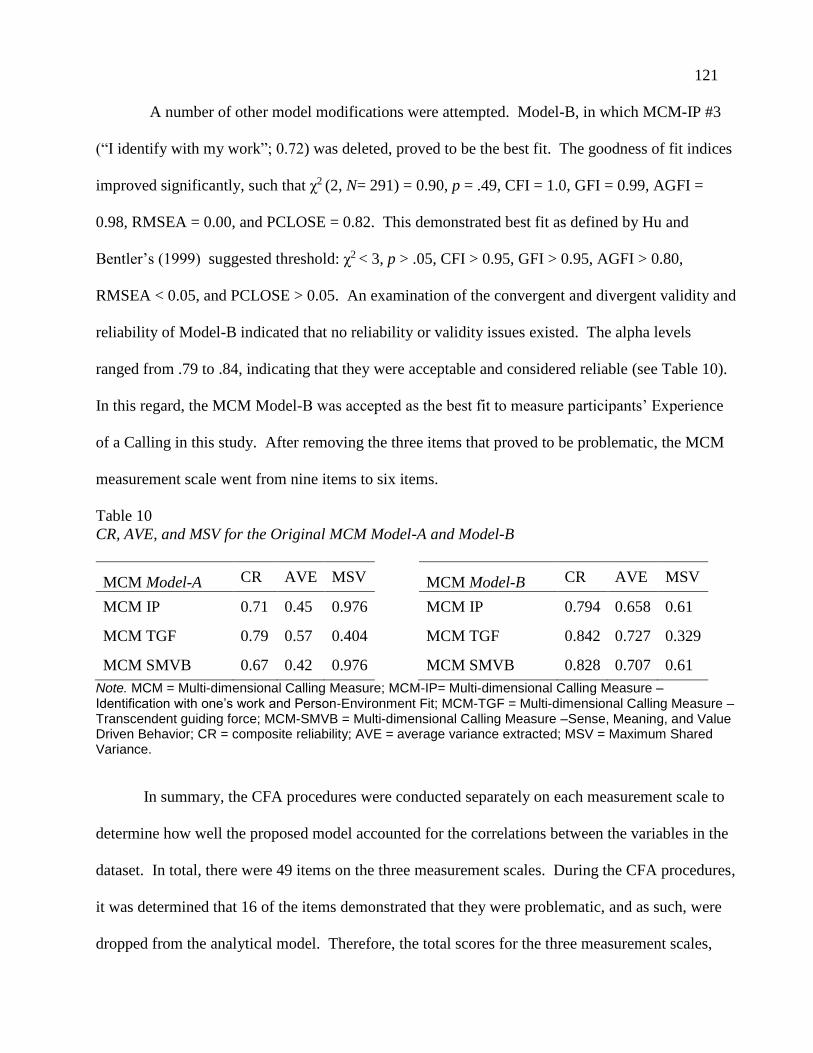
121
A number of other model modifications were attempted. Model-B, in which MCM-IP #3
(“I identify with my work”; 0.72) was deleted, proved to be the best fit. The goodness of fit indices
improved significantly, such that χ2 (2, N= 291) = 0.90, p = .49, CFI = 1.0, GFI = 0.99, AGFI =
0.98, RMSEA = 0.00, and PCLOSE = 0.82. This demonstrated best fit as defined by Hu and
Bentler’s (1999) suggested threshold: χ2 < 3, p > .05, CFI > 0.95, GFI > 0.95, AGFI > 0.80,
RMSEA < 0.05, and PCLOSE > 0.05. An examination of the convergent and divergent validity and
reliability of Model-B indicated that no reliability or validity issues existed. The alpha levels
ranged from .79 to .84, indicating that they were acceptable and considered reliable (see Table 10).
In this regard, the MCM Model-B was accepted as the best fit to measure participants’ Experience
of a Calling in this study. After removing the three items that proved to be problematic, the MCM
measurement scale went from nine items to six items.
Table 10
CR, AVE, and MSV for the Original MCM Model-A and Model-B
MCM Model-A CR AVE MSV MCM Model-B CR AVE MSV
MCM IP 0.71 0.45 0.976 MCM IP 0.794 0.658 0.61
MCM TGF 0.79 0.57 0.404 MCM TGF 0.842 0.727 0.329
MCM SMVB 0.67 0.42 0.976 MCM SMVB 0.828 0.707 0.61
Note. MCM = Multi-dimensional Calling Measure; MCM-IP= Multi-dimensional Calling Measure – Identification with one’s work and Person-Environment Fit; MCM-TGF = Multi-dimensional Calling Measure – Transcendent guiding force; MCM-SMVB = Multi-dimensional Calling Measure –Sense, Meaning, and Value Driven Behavior; CR = composite reliability; AVE = average variance extracted; MSV = Maximum Shared Variance.
In summary, the CFA procedures were conducted separately on each measurement scale to
determine how well the proposed model accounted for the correlations between the variables in the
dataset. In total, there were 49 items on the three measurement scales. During the CFA procedures,
it was determined that 16 of the items demonstrated that they were problematic, and as such, were
dropped from the analytical model. Therefore, the total scores for the three measurement scales,
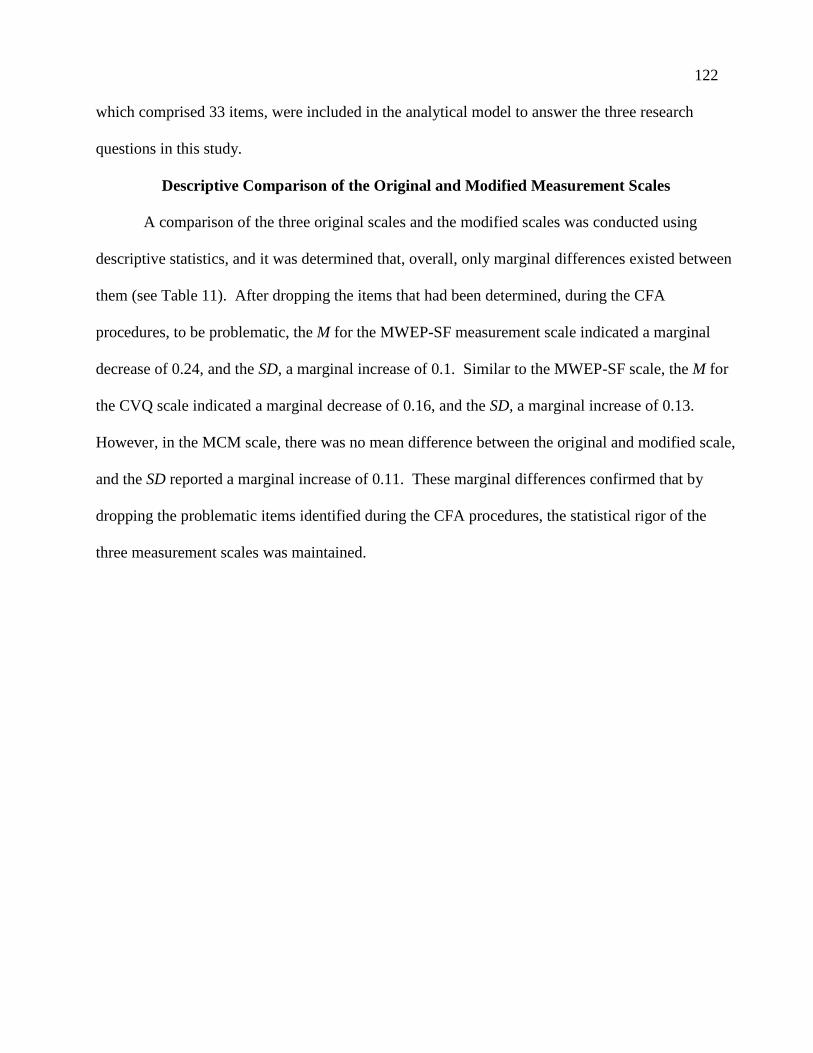
122
which comprised 33 items, were included in the analytical model to answer the three research
questions in this study.
Descriptive Comparison of the Original and Modified Measurement Scales
A comparison of the three original scales and the modified scales was conducted using
descriptive statistics, and it was determined that, overall, only marginal differences existed between
them (see Table 11). After dropping the items that had been determined, during the CFA
procedures, to be problematic, the M for the MWEP-SF measurement scale indicated a marginal
decrease of 0.24, and the SD, a marginal increase of 0.1. Similar to the MWEP-SF scale, the M for
the CVQ scale indicated a marginal decrease of 0.16, and the SD, a marginal increase of 0.13.
However, in the MCM scale, there was no mean difference between the original and modified scale,
and the SD reported a marginal increase of 0.11. These marginal differences confirmed that by
dropping the problematic items identified during the CFA procedures, the statistical rigor of the
three measurement scales was maintained.
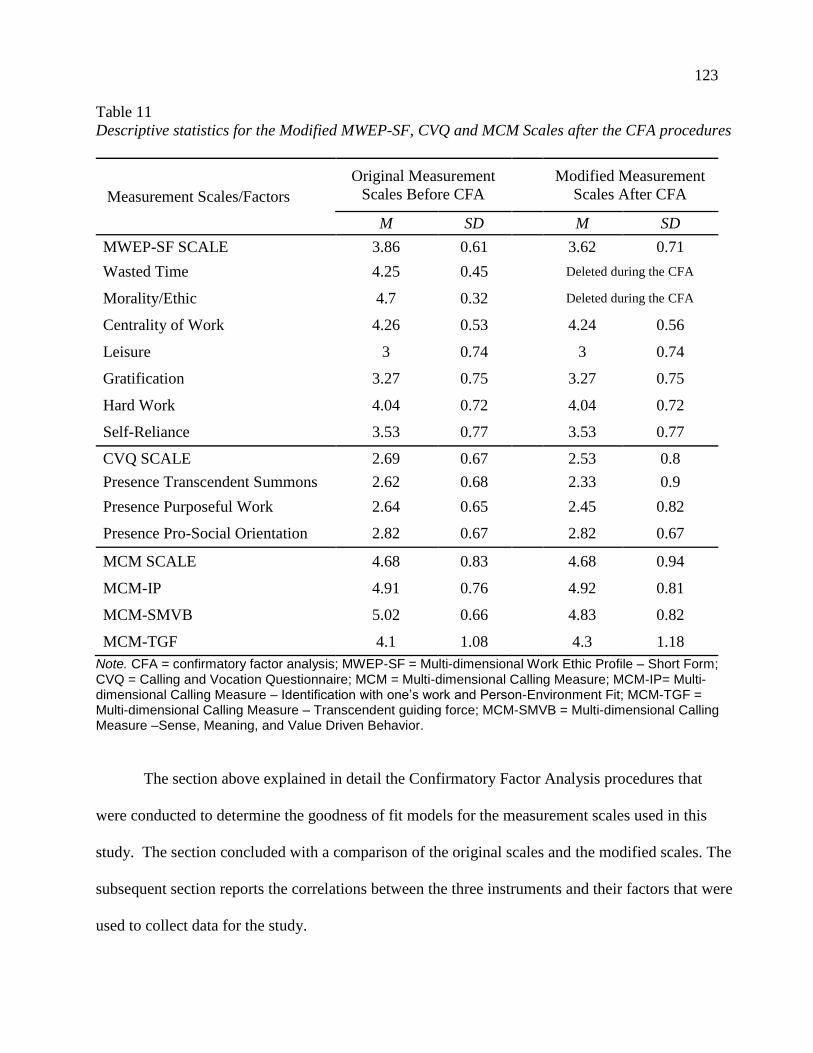
123
Table 11
Descriptive statistics for the Modified MWEP-SF, CVQ and MCM Scales after the CFA procedures
Measurement Scales/Factors
Original Measurement
Scales Before CFA
Modified Measurement
Scales After CFA
M SD M SD
MWEP-SF SCALE 3.86 0.61 3.62 0.71
Wasted Time 4.25 0.45 Deleted during the CFA
Morality/Ethic 4.7 0.32 Deleted during the CFA
Centrality of Work 4.26 0.53 4.24 0.56
Leisure 3 0.74 3 0.74
Gratification 3.27 0.75 3.27 0.75
Hard Work 4.04 0.72 4.04 0.72
Self-Reliance 3.53 0.77 3.53 0.77
CVQ SCALE 2.69 0.67 2.53 0.8
Presence Transcendent Summons 2.62 0.68 2.33 0.9
Presence Purposeful Work 2.64 0.65 2.45 0.82
Presence Pro-Social Orientation 2.82 0.67 2.82 0.67
MCM SCALE 4.68 0.83 4.68 0.94
MCM-IP 4.91 0.76 4.92 0.81
MCM-SMVB 5.02 0.66 4.83 0.82
MCM-TGF 4.1 1.08 4.3 1.18
Note. CFA = confirmatory factor analysis; MWEP-SF = Multi-dimensional Work Ethic Profile – Short Form; CVQ = Calling and Vocation Questionnaire; MCM = Multi-dimensional Calling Measure; MCM-IP= Multi-dimensional Calling Measure – Identification with one’s work and Person-Environment Fit; MCM-TGF = Multi-dimensional Calling Measure – Transcendent guiding force; MCM-SMVB = Multi-dimensional Calling Measure –Sense, Meaning, and Value Driven Behavior.
The section above explained in detail the Confirmatory Factor Analysis procedures that
were conducted to determine the goodness of fit models for the measurement scales used in this
study. The section concluded with a comparison of the original scales and the modified scales. The
subsequent section reports the correlations between the three instruments and their factors that were
used to collect data for the study.
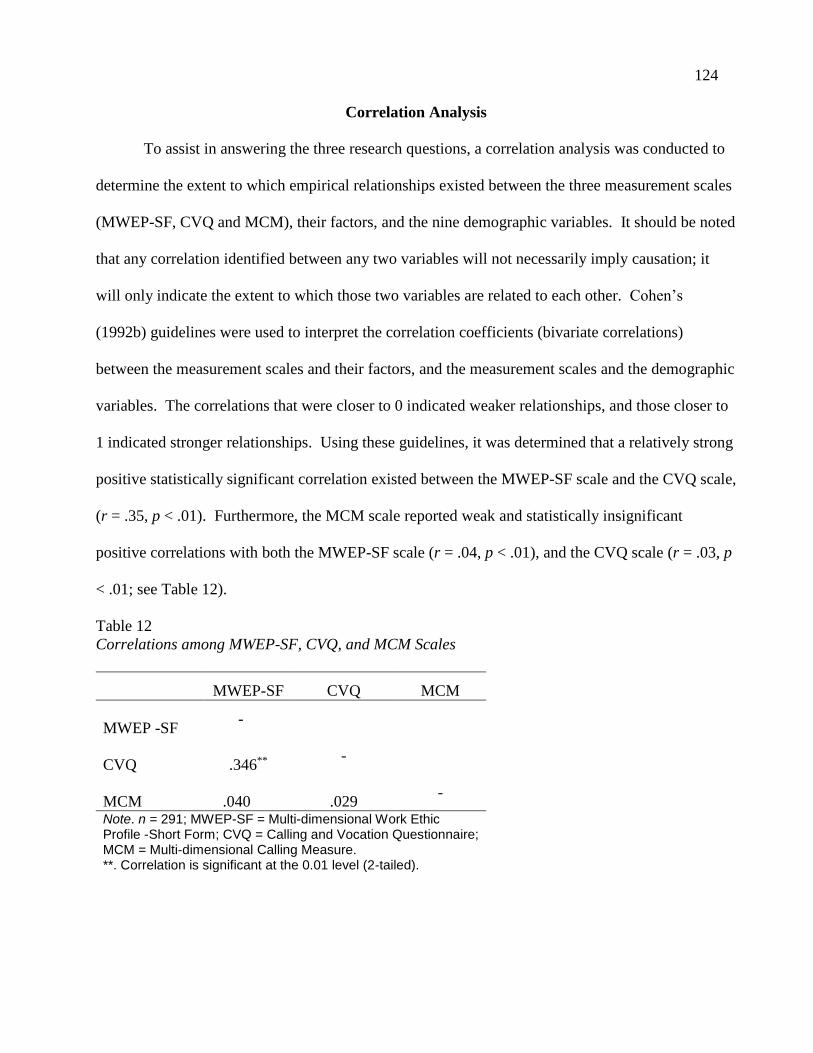
124
Correlation Analysis
To assist in answering the three research questions, a correlation analysis was conducted to
determine the extent to which empirical relationships existed between the three measurement scales
(MWEP-SF, CVQ and MCM), their factors, and the nine demographic variables. It should be noted
that any correlation identified between any two variables will not necessarily imply causation; it
will only indicate the extent to which those two variables are related to each other. Cohen’s
(1992b) guidelines were used to interpret the correlation coefficients (bivariate correlations)
between the measurement scales and their factors, and the measurement scales and the demographic
variables. The correlations that were closer to 0 indicated weaker relationships, and those closer to
1 indicated stronger relationships. Using these guidelines, it was determined that a relatively strong
positive statistically significant correlation existed between the MWEP-SF scale and the CVQ scale,
(r = .35, p < .01). Furthermore, the MCM scale reported weak and statistically insignificant
positive correlations with both the MWEP-SF scale (r = .04, p < .01), and the CVQ scale (r = .03, p
< .01; see Table 12).
Table 12
Correlations among MWEP-SF, CVQ, and MCM Scales
MWEP-SF CVQ MCM
MWEP -SF -
CVQ
.346** -
MCM
.040
.029 -
Note. n = 291; MWEP-SF = Multi-dimensional Work Ethic Profile -Short Form; CVQ = Calling and Vocation Questionnaire; MCM = Multi-dimensional Calling Measure. **. Correlation is significant at the 0.01 level (2-tailed).
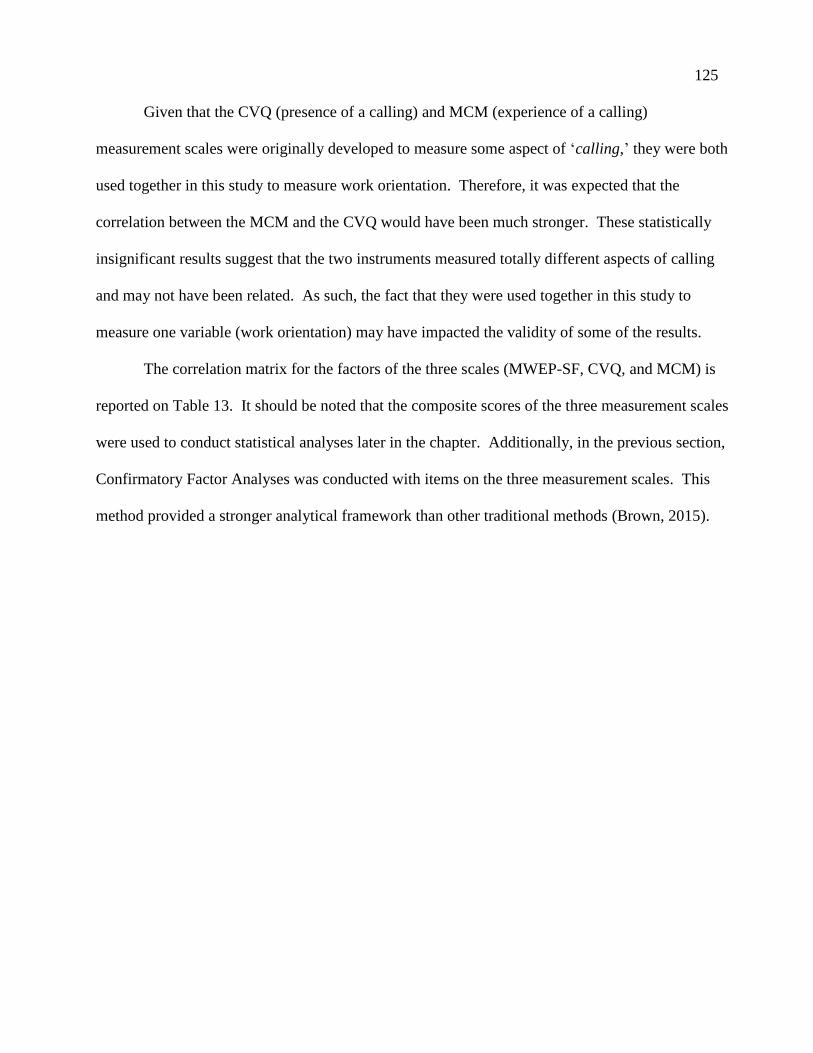
125
Given that the CVQ (presence of a calling) and MCM (experience of a calling)
measurement scales were originally developed to measure some aspect of ‘calling,’ they were both
used together in this study to measure work orientation. Therefore, it was expected that the
correlation between the MCM and the CVQ would have been much stronger. These statistically
insignificant results suggest that the two instruments measured totally different aspects of calling
and may not have been related. As such, the fact that they were used together in this study to
measure one variable (work orientation) may have impacted the validity of some of the results.
The correlation matrix for the factors of the three scales (MWEP-SF, CVQ, and MCM) is
reported on Table 13. It should be noted that the composite scores of the three measurement scales
were used to conduct statistical analyses later in the chapter. Additionally, in the previous section,
Confirmatory Factor Analyses was conducted with items on the three measurement scales. This
method provided a stronger analytical framework than other traditional methods (Brown, 2015).
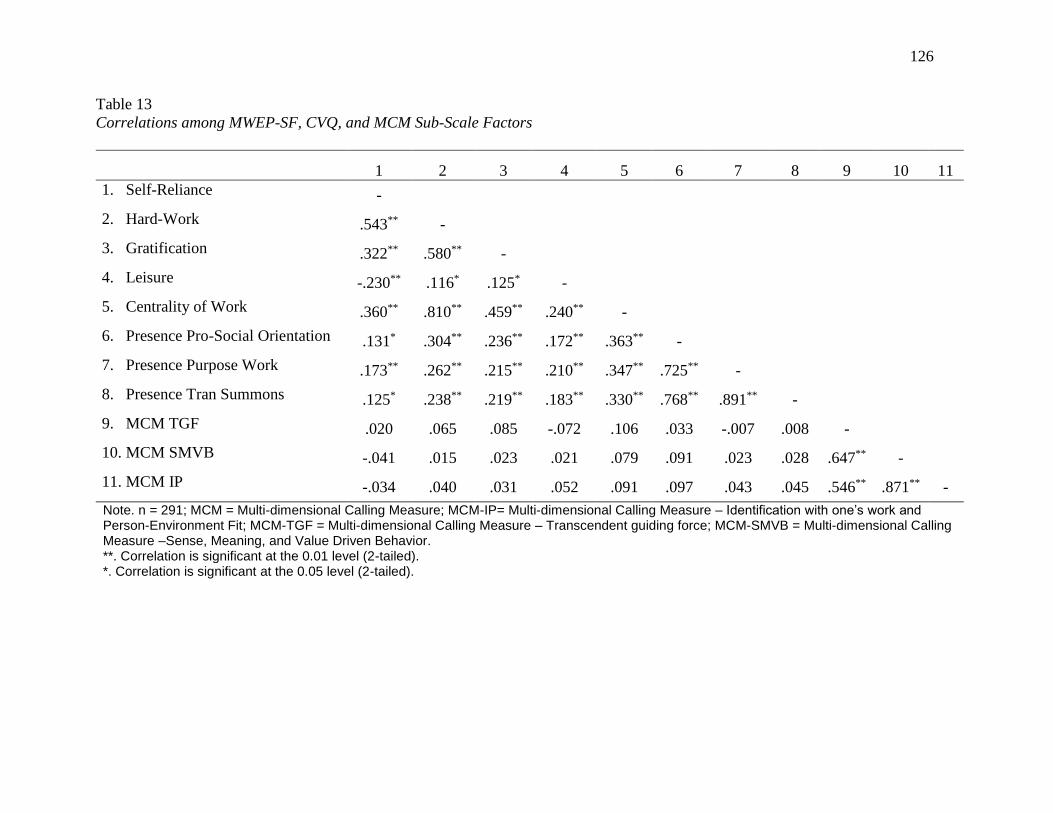
126
Table 13
Correlations among MWEP-SF, CVQ, and MCM Sub-Scale Factors
1 2 3 4 5 6 7 8 9 10 11
1. Self-Reliance -
2. Hard-Work .543** -
3. Gratification .322** .580** -
4. Leisure -.230** .116* .125* -
5. Centrality of Work .360** .810** .459** .240** -
6. Presence Pro-Social Orientation .131* .304** .236** .172** .363** -
7. Presence Purpose Work .173** .262** .215** .210** .347** .725** -
8. Presence Tran Summons .125* .238** .219** .183** .330** .768** .891** -
9. MCM TGF .020 .065 .085 -.072 .106 .033 -.007 .008 -
10. MCM SMVB -.041 .015 .023 .021 .079 .091 .023 .028 .647** -
11. MCM IP -.034 .040 .031 .052 .091 .097 .043 .045 .546** .871** -
Note. n = 291; MCM = Multi-dimensional Calling Measure; MCM-IP= Multi-dimensional Calling Measure – Identification with one’s work and Person-Environment Fit; MCM-TGF = Multi-dimensional Calling Measure – Transcendent guiding force; MCM-SMVB = Multi-dimensional Calling Measure –Sense, Meaning, and Value Driven Behavior. **. Correlation is significant at the 0.01 level (2-tailed). *. Correlation is significant at the 0.05 level (2-tailed).
127
A review of Table 13 indicated that, in general, weak to moderate statistically significant
positive correlations were identified among all the factors of the MWEP-SF scale and all the factors
of the CVQ scale. They ranged between r = .13, p <.05 (for MWEP-SF factor Self-Reliance and
Transcendent Summons) and r = .36, p < .01 (for MWEP-SF factor Centrality of Work and CVQ
factor Pro-Social Orientation). These results were expected as a relatively strong positive
correlation was also reported earlier for the MWEP-SF and CVQ measurement scales.
No statistically significant correlations were reported among any of the factors of the MCM
measurement scale and those of the MWEP-SF measurement scale, or any of the factors of the
MCM measurement scale and those of the CVQ measurement scale. Again, while these results
were surprising, they were consistent with the correlations of the measurement scales, as explained
earlier.
Separate correlation studies were also conducted among the ordinal and categorical
demographic variables and the three instruments. Spearman's rho was used to determine the
correlations among the five ordinal demographic variables (generational cohort, education, position,
tenure, and income) and the three instruments. No statistically significant results were obtained for
any of the five demographic variables and the three instruments (see Table 14).
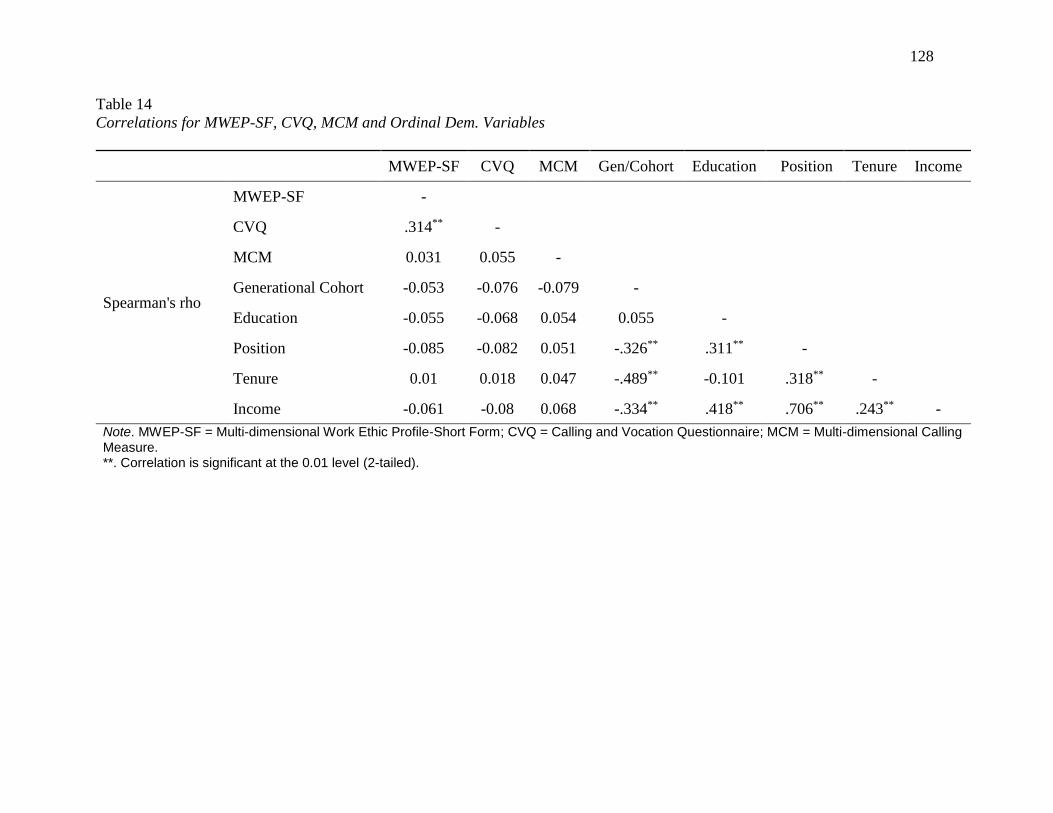
128
Table 14
Correlations for MWEP-SF, CVQ, MCM and Ordinal Dem. Variables
MWEP-SF CVQ MCM Gen/Cohort Education Position Tenure Income
Spearman's rho
MWEP-SF -
CVQ .314** -
MCM 0.031 0.055 -
Generational Cohort -0.053 -0.076 -0.079 -
Education -0.055 -0.068 0.054 0.055 -
Position -0.085 -0.082 0.051 -.326** .311** -
Tenure 0.01 0.018 0.047 -.489** -0.101 .318** -
Income -0.061 -0.08 0.068 -.334** .418** .706** .243** -
Note. MWEP-SF = Multi-dimensional Work Ethic Profile-Short Form; CVQ = Calling and Vocation Questionnaire; MCM = Multi-dimensional Calling Measure. **. Correlation is significant at the 0.01 level (2-tailed).
129
Pearson correlation was used to determine the correlations among the four categorical
variables (industry, gender, religion, and ethnicity) and the three measurement scales. Only one
relatively weak positive statistically significant correlation between the MWEP-SF measurement
scale and the “Other” category in the Religion factor was reported, (r = .13, p <.01). All the other
demographic variables reported no statistically significant results for any of the categories within
the four demographic variables, (see Table 15).
In conclusion, the only statistically significant results reported for this correlation study
were between work ethic and presence of a calling, and between all the factors of the MWEP-SF
scales and the CVQ scales. These results, along with the outcomes of the earlier sections, laid the
foundation that enabled the researcher to conduct the statistical analyses to answer the three
research questions. In the subsequent section, the quantitative statistical analyses are described.
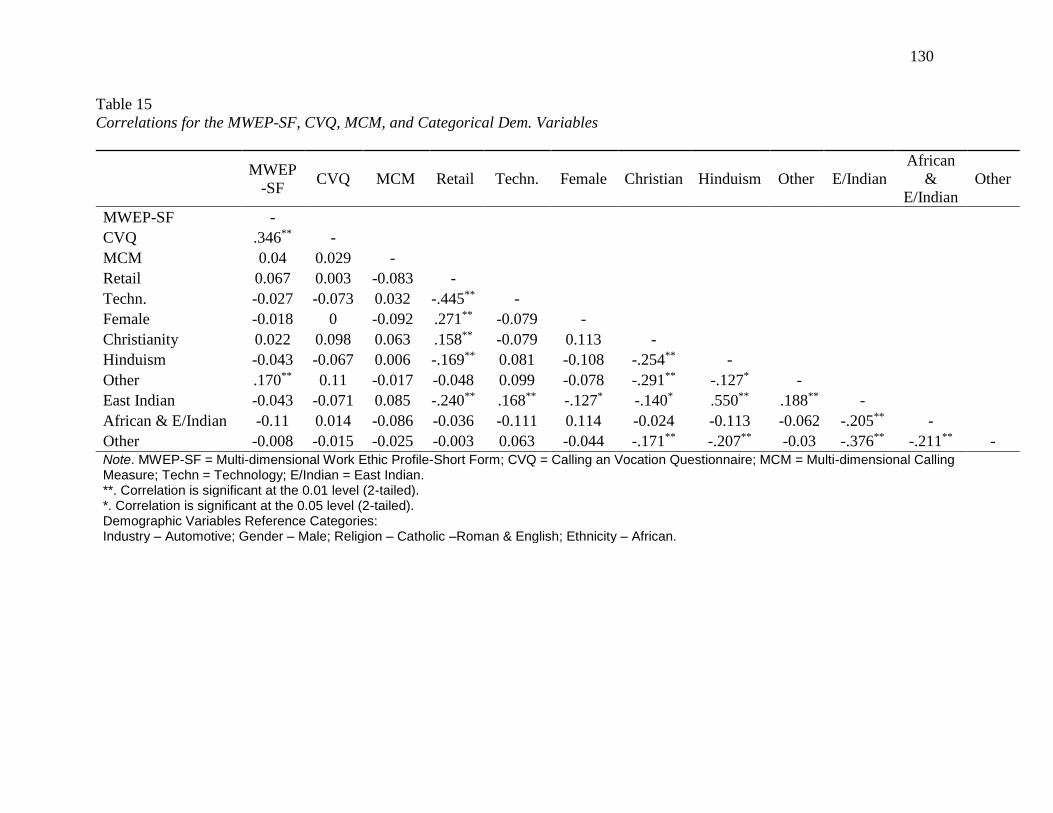
130
Table 15
Correlations for the MWEP-SF, CVQ, MCM, and Categorical Dem. Variables
MWEP
-SF CVQ MCM Retail Techn. Female Christian Hinduism Other E/Indian
African
&
E/Indian
Other
MWEP-SF -
CVQ .346** -
MCM 0.04 0.029 -
Retail 0.067 0.003 -0.083 -
Techn. -0.027 -0.073 0.032 -.445** -
Female -0.018 0 -0.092 .271** -0.079 -
Christianity 0.022 0.098 0.063 .158** -0.079 0.113 -
Hinduism -0.043 -0.067 0.006 -.169** 0.081 -0.108 -.254** -
Other .170** 0.11 -0.017 -0.048 0.099 -0.078 -.291** -.127* -
East Indian -0.043 -0.071 0.085 -.240** .168** -.127* -.140* .550** .188** -
African & E/Indian -0.11 0.014 -0.086 -0.036 -0.111 0.114 -0.024 -0.113 -0.062 -.205** -
Other -0.008 -0.015 -0.025 -0.003 0.063 -0.044 -.171** -.207** -0.03 -.376** -.211** - Note. MWEP-SF = Multi-dimensional Work Ethic Profile-Short Form; CVQ = Calling an Vocation Questionnaire; MCM = Multi-dimensional Calling Measure; Techn = Technology; E/Indian = East Indian. **. Correlation is significant at the 0.01 level (2-tailed). *. Correlation is significant at the 0.05 level (2-tailed). Demographic Variables Reference Categories: Industry – Automotive; Gender – Male; Religion – Catholic –Roman & English; Ethnicity – African.
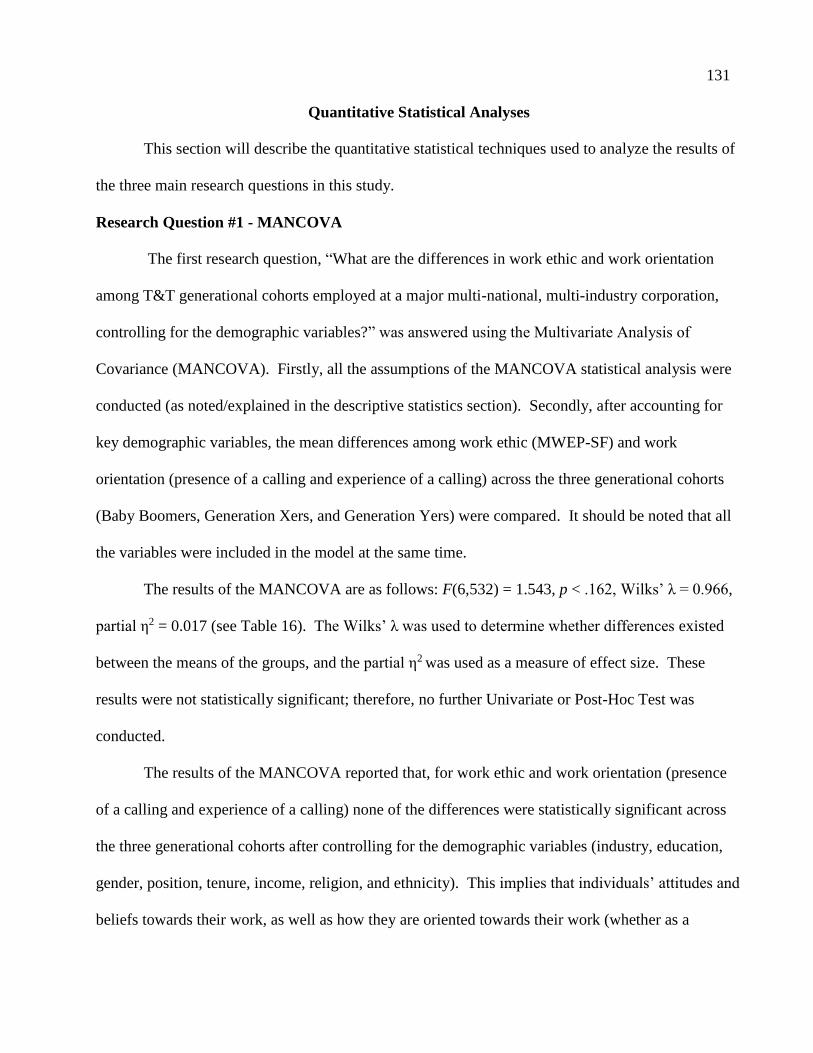
131
Quantitative Statistical Analyses
This section will describe the quantitative statistical techniques used to analyze the results of
the three main research questions in this study.
Research Question #1 - MANCOVA
The first research question, “What are the differences in work ethic and work orientation
among T&T generational cohorts employed at a major multi-national, multi-industry corporation,
controlling for the demographic variables?” was answered using the Multivariate Analysis of
Covariance (MANCOVA). Firstly, all the assumptions of the MANCOVA statistical analysis were
conducted (as noted/explained in the descriptive statistics section). Secondly, after accounting for
key demographic variables, the mean differences among work ethic (MWEP-SF) and work
orientation (presence of a calling and experience of a calling) across the three generational cohorts
(Baby Boomers, Generation Xers, and Generation Yers) were compared. It should be noted that all
the variables were included in the model at the same time.
The results of the MANCOVA are as follows: F(6,532) = 1.543, p < .162, Wilks’ λ = 0.966,
partial η2 = 0.017 (see Table 16). The Wilks’ λ was used to determine whether differences existed
between the means of the groups, and the partial η2 was used as a measure of effect size. These
results were not statistically significant; therefore, no further Univariate or Post-Hoc Test was
conducted.
The results of the MANCOVA reported that, for work ethic and work orientation (presence
of a calling and experience of a calling) none of the differences were statistically significant across
the three generational cohorts after controlling for the demographic variables (industry, education,
gender, position, tenure, income, religion, and ethnicity). This implies that individuals’ attitudes and
beliefs towards their work, as well as how they are oriented towards their work (whether as a
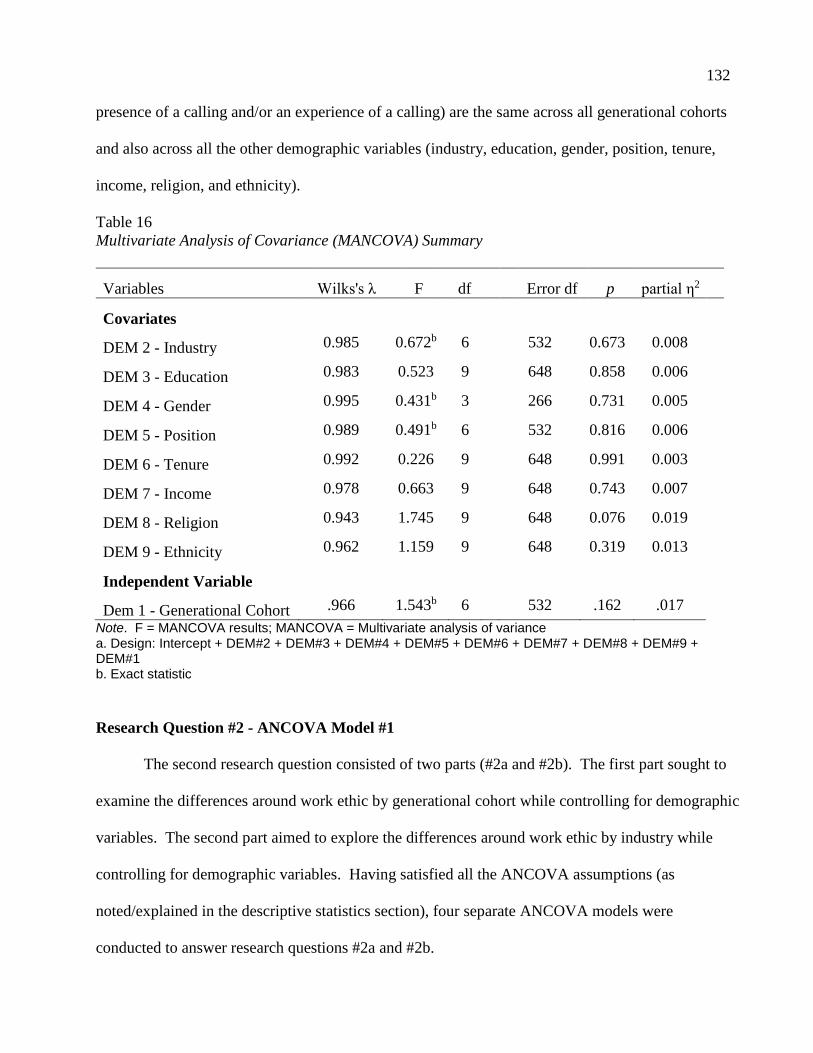
132
presence of a calling and/or an experience of a calling) are the same across all generational cohorts
and also across all the other demographic variables (industry, education, gender, position, tenure,
income, religion, and ethnicity).
Table 16
Multivariate Analysis of Covariance (MANCOVA) Summary
Variables Wilks's λ F df
Error df p partial η2
Covariates
DEM 2 - Industry 0.985 0.672b 6 532 0.673 0.008
DEM 3 - Education 0.983 0.523 9 648 0.858 0.006
DEM 4 - Gender 0.995 0.431b 3 266 0.731 0.005
DEM 5 - Position 0.989 0.491b 6 532 0.816 0.006
DEM 6 - Tenure 0.992 0.226 9 648 0.991 0.003
DEM 7 - Income 0.978 0.663 9 648 0.743 0.007
DEM 8 - Religion 0.943 1.745 9 648 0.076 0.019
DEM 9 - Ethnicity 0.962 1.159 9 648 0.319 0.013
Independent Variable
Dem 1 - Generational Cohort .966 1.543b 6 532 .162 .017
Note. F = MANCOVA results; MANCOVA = Multivariate analysis of variance a. Design: Intercept + DEM#2 + DEM#3 + DEM#4 + DEM#5 + DEM#6 + DEM#7 + DEM#8 + DEM#9 + DEM#1 b. Exact statistic
Research Question #2 - ANCOVA Model #1
The second research question consisted of two parts (#2a and #2b). The first part sought to
examine the differences around work ethic by generational cohort while controlling for demographic
variables. The second part aimed to explore the differences around work ethic by industry while
controlling for demographic variables. Having satisfied all the ANCOVA assumptions (as
noted/explained in the descriptive statistics section), four separate ANCOVA models were
conducted to answer research questions #2a and #2b.
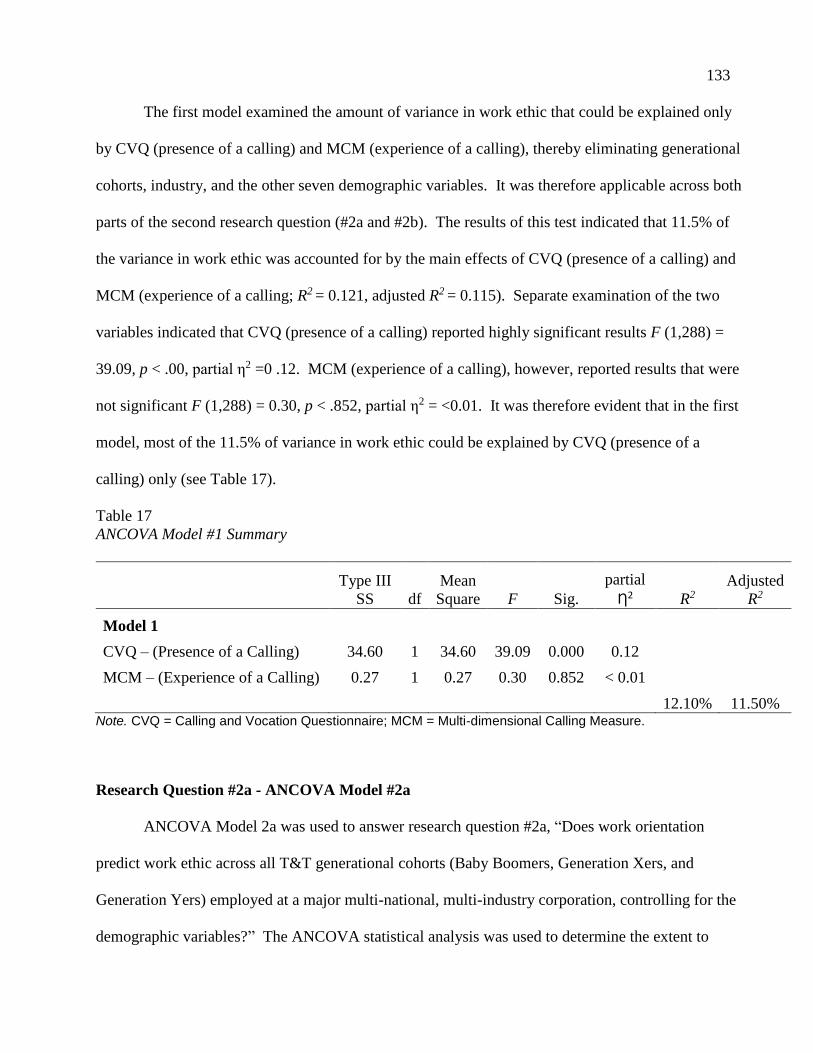
133
The first model examined the amount of variance in work ethic that could be explained only
by CVQ (presence of a calling) and MCM (experience of a calling), thereby eliminating generational
cohorts, industry, and the other seven demographic variables. It was therefore applicable across both
parts of the second research question (#2a and #2b). The results of this test indicated that 11.5% of
the variance in work ethic was accounted for by the main effects of CVQ (presence of a calling) and
MCM (experience of a calling; R2 = 0.121, adjusted R2 = 0.115). Separate examination of the two
variables indicated that CVQ (presence of a calling) reported highly significant results F (1,288) =
39.09, p < .00, partial η2 =0 .12. MCM (experience of a calling), however, reported results that were
not significant F (1,288) = 0.30, p < .852, partial η2 = <0.01. It was therefore evident that in the first
model, most of the 11.5% of variance in work ethic could be explained by CVQ (presence of a
calling) only (see Table 17).
Table 17
ANCOVA Model #1 Summary
Type III
SS df
Mean
Square F Sig.
partial
Ƞ2 R2
Adjusted
R2
Model 1
CVQ – (Presence of a Calling) 34.60 1 34.60 39.09 0.000 0.12
MCM – (Experience of a Calling) 0.27 1 0.27 0.30 0.852 < 0.01
12.10% 11.50% Note. CVQ = Calling and Vocation Questionnaire; MCM = Multi-dimensional Calling Measure.
Research Question #2a - ANCOVA Model #2a
ANCOVA Model 2a was used to answer research question #2a, “Does work orientation
predict work ethic across all T&T generational cohorts (Baby Boomers, Generation Xers, and
Generation Yers) employed at a major multi-national, multi-industry corporation, controlling for the
demographic variables?” The ANCOVA statistical analysis was used to determine the extent to
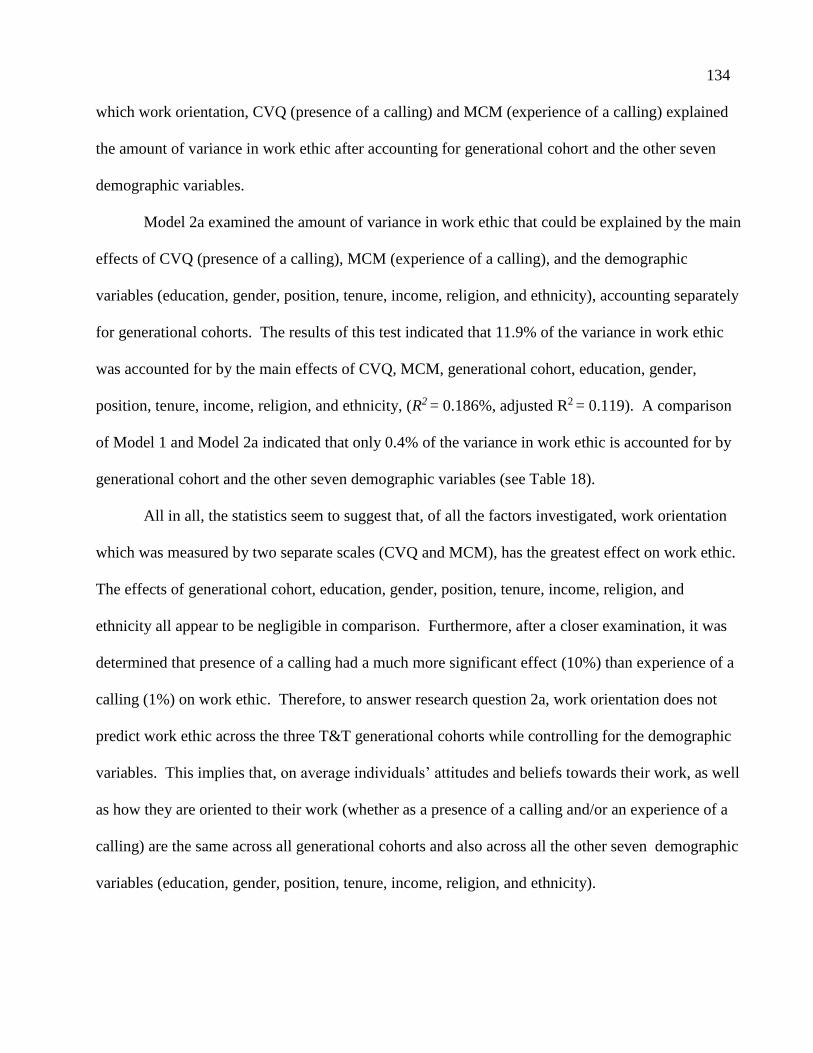
134
which work orientation, CVQ (presence of a calling) and MCM (experience of a calling) explained
the amount of variance in work ethic after accounting for generational cohort and the other seven
demographic variables.
Model 2a examined the amount of variance in work ethic that could be explained by the main
effects of CVQ (presence of a calling), MCM (experience of a calling), and the demographic
variables (education, gender, position, tenure, income, religion, and ethnicity), accounting separately
for generational cohorts. The results of this test indicated that 11.9% of the variance in work ethic
was accounted for by the main effects of CVQ, MCM, generational cohort, education, gender,
position, tenure, income, religion, and ethnicity, (R2 = 0.186%, adjusted R2 = 0.119). A comparison
of Model 1 and Model 2a indicated that only 0.4% of the variance in work ethic is accounted for by
generational cohort and the other seven demographic variables (see Table 18).
All in all, the statistics seem to suggest that, of all the factors investigated, work orientation
which was measured by two separate scales (CVQ and MCM), has the greatest effect on work ethic.
The effects of generational cohort, education, gender, position, tenure, income, religion, and
ethnicity all appear to be negligible in comparison. Furthermore, after a closer examination, it was
determined that presence of a calling had a much more significant effect (10%) than experience of a
calling (1%) on work ethic. Therefore, to answer research question 2a, work orientation does not
predict work ethic across the three T&T generational cohorts while controlling for the demographic
variables. This implies that, on average individuals’ attitudes and beliefs towards their work, as well
as how they are oriented to their work (whether as a presence of a calling and/or an experience of a
calling) are the same across all generational cohorts and also across all the other seven demographic
variables (education, gender, position, tenure, income, religion, and ethnicity).
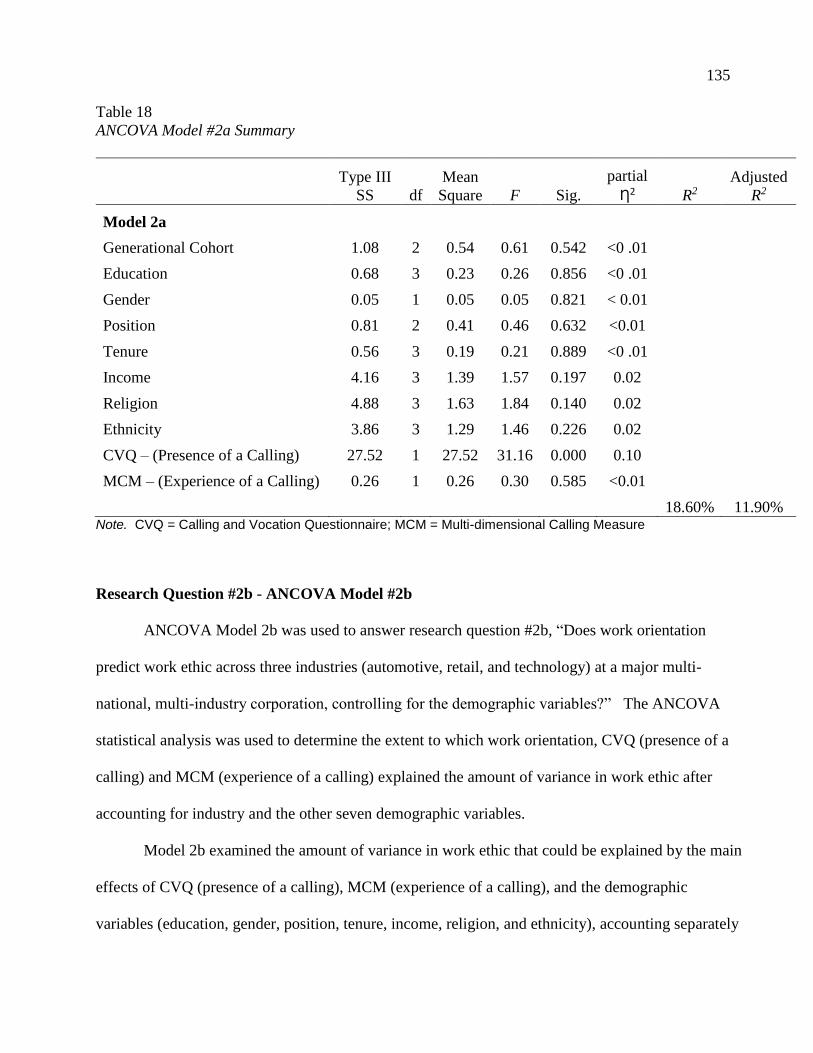
135
Table 18
ANCOVA Model #2a Summary
Type III
SS df
Mean
Square F Sig.
partial
Ƞ2 R2
Adjusted
R2
Model 2a
Generational Cohort 1.08 2 0.54 0.61 0.542 <0 .01
Education 0.68 3 0.23 0.26 0.856 <0 .01
Gender 0.05 1 0.05 0.05 0.821 < 0.01
Position 0.81 2 0.41 0.46 0.632 <0.01
Tenure 0.56 3 0.19 0.21 0.889 <0 .01
Income 4.16 3 1.39 1.57 0.197 0.02
Religion 4.88 3 1.63 1.84 0.140 0.02
Ethnicity 3.86 3 1.29 1.46 0.226 0.02
CVQ – (Presence of a Calling) 27.52 1 27.52 31.16 0.000 0.10
MCM – (Experience of a Calling) 0.26 1 0.26 0.30 0.585 <0.01
18.60% 11.90% Note. CVQ = Calling and Vocation Questionnaire; MCM = Multi-dimensional Calling Measure
Research Question #2b - ANCOVA Model #2b
ANCOVA Model 2b was used to answer research question #2b, “Does work orientation
predict work ethic across three industries (automotive, retail, and technology) at a major multi-
national, multi-industry corporation, controlling for the demographic variables?” The ANCOVA
statistical analysis was used to determine the extent to which work orientation, CVQ (presence of a
calling) and MCM (experience of a calling) explained the amount of variance in work ethic after
accounting for industry and the other seven demographic variables.
Model 2b examined the amount of variance in work ethic that could be explained by the main
effects of CVQ (presence of a calling), MCM (experience of a calling), and the demographic
variables (education, gender, position, tenure, income, religion, and ethnicity), accounting separately
136
for industry. The results of this test indicated that 11.7% of the variance in work ethic was
accounted for by the main effects of CVQ, MCM, industry, education, gender, position, tenure,
income, religion, and ethnicity, (R2 = 0.184, adjusted R2 = 0.117). A comparison of Model 1 and
Model 2b illustrated similar results; only 0.2% of the variance in work ethic could be accounted for
by industry and the other seven demographic variables (see Table 19).
As with Model 2a, the statistics obtained from Model 2b also support that work orientation,
which is a combination of presence of a calling and experience of a calling, is the prime influencer
of work ethic, regardless of industry or any of the other seven demographic variables. Additionally,
it should be noted that only a small change of 0.2% of variance in work ethic was observed between
Model 2a and Model 2b. This indicated the difference between the impact of generational cohort
and that of industry on work ethic was minor in this study. Therefore, to answer research question
2b, work orientation does not predict work ethic across the three industries (automotive, retail, and
technology) while controlling for the seven demographic variables. This suggests that, on average,
individuals’ attitudes and beliefs toward their work, as well as how they are oriented to their work
(whether as a presence of a calling and/or an experience of a calling) are the same across the three
industries and also across all the other seven demographic variables (education, gender, position,
tenure, income, religion, and ethnicity; see Table 19).
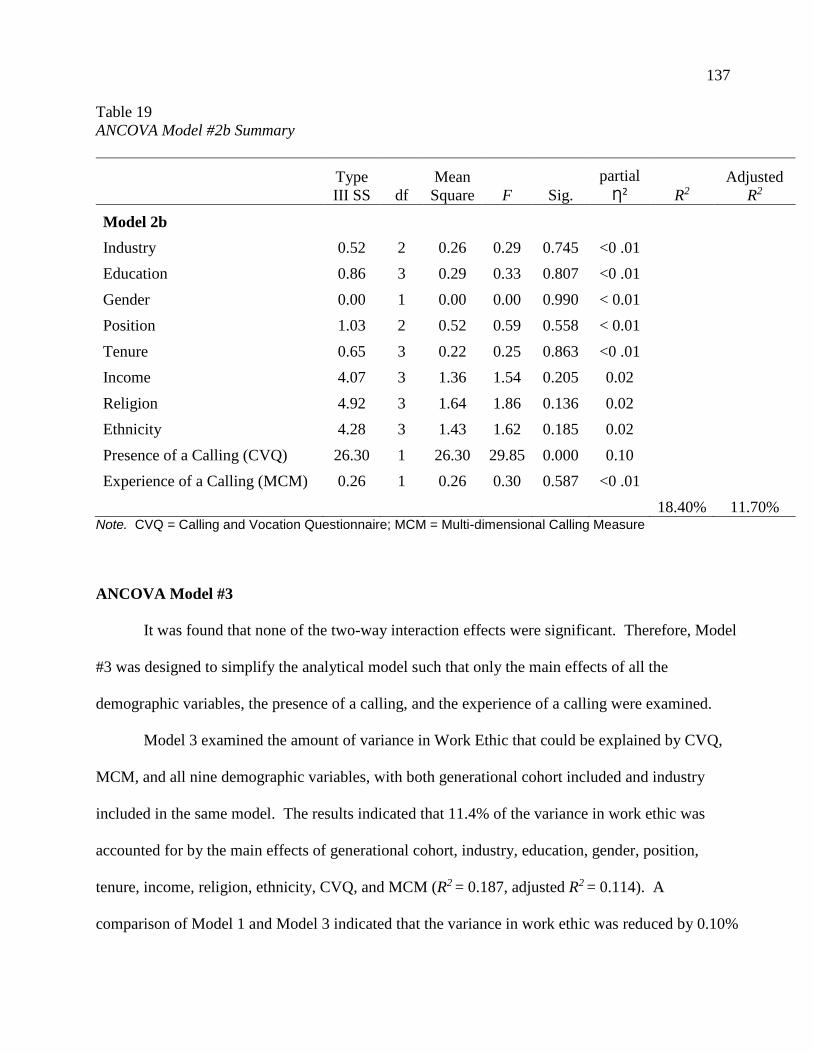
137
Table 19
ANCOVA Model #2b Summary
Type
III SS df
Mean
Square F Sig.
partial
Ƞ2 R2
Adjusted
R2
Model 2b
Industry 0.52 2 0.26 0.29 0.745 <0 .01
Education 0.86 3 0.29 0.33 0.807 <0 .01
Gender 0.00 1 0.00 0.00 0.990 < 0.01
Position 1.03 2 0.52 0.59 0.558 < 0.01
Tenure 0.65 3 0.22 0.25 0.863 <0 .01
Income 4.07 3 1.36 1.54 0.205 0.02
Religion 4.92 3 1.64 1.86 0.136 0.02
Ethnicity 4.28 3 1.43 1.62 0.185 0.02
Presence of a Calling (CVQ) 26.30 1 26.30 29.85 0.000 0.10
Experience of a Calling (MCM) 0.26 1 0.26 0.30 0.587 <0 .01
18.40% 11.70% Note. CVQ = Calling and Vocation Questionnaire; MCM = Multi-dimensional Calling Measure
ANCOVA Model #3
It was found that none of the two-way interaction effects were significant. Therefore, Model
#3 was designed to simplify the analytical model such that only the main effects of all the
demographic variables, the presence of a calling, and the experience of a calling were examined.
Model 3 examined the amount of variance in Work Ethic that could be explained by CVQ,
MCM, and all nine demographic variables, with both generational cohort included and industry
included in the same model. The results indicated that 11.4% of the variance in work ethic was
accounted for by the main effects of generational cohort, industry, education, gender, position,
tenure, income, religion, ethnicity, CVQ, and MCM (R2 = 0.187, adjusted R2 = 0.114). A
comparison of Model 1 and Model 3 indicated that the variance in work ethic was reduced by 0.10%
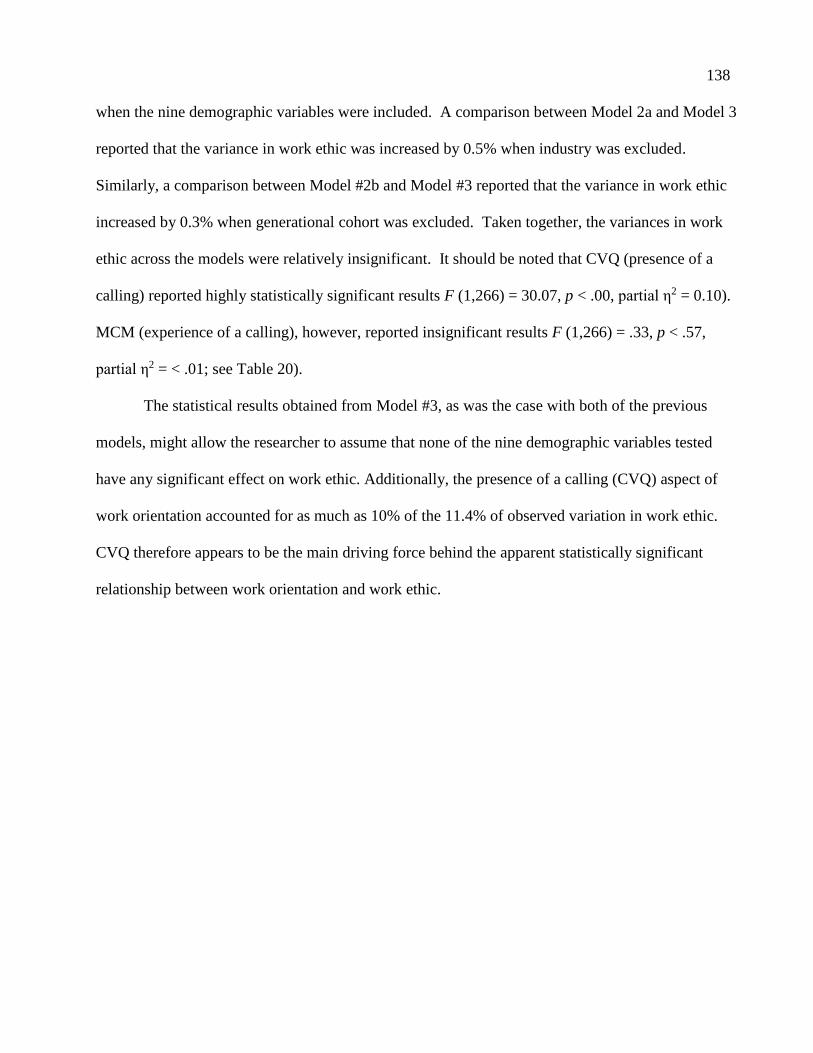
138
when the nine demographic variables were included. A comparison between Model 2a and Model 3
reported that the variance in work ethic was increased by 0.5% when industry was excluded.
Similarly, a comparison between Model #2b and Model #3 reported that the variance in work ethic
increased by 0.3% when generational cohort was excluded. Taken together, the variances in work
ethic across the models were relatively insignificant. It should be noted that CVQ (presence of a
calling) reported highly statistically significant results F (1,266) = 30.07, p < .00, partial η2 = 0.10).
MCM (experience of a calling), however, reported insignificant results F (1,266) = .33, p < .57,
partial η2 = < .01; see Table 20).
The statistical results obtained from Model #3, as was the case with both of the previous
models, might allow the researcher to assume that none of the nine demographic variables tested
have any significant effect on work ethic. Additionally, the presence of a calling (CVQ) aspect of
work orientation accounted for as much as 10% of the 11.4% of observed variation in work ethic.
CVQ therefore appears to be the main driving force behind the apparent statistically significant
relationship between work orientation and work ethic.
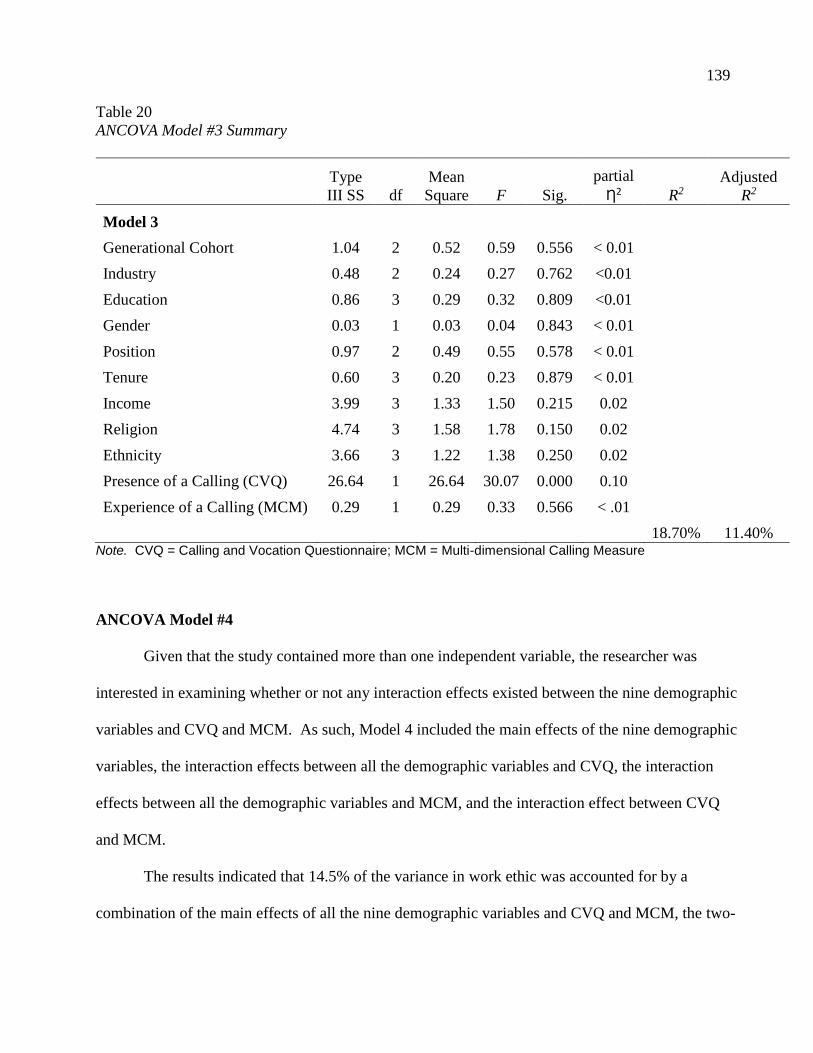
139
Table 20
ANCOVA Model #3 Summary
Type
III SS df
Mean
Square F Sig.
partial
Ƞ2 R2
Adjusted
R2
Model 3
Generational Cohort 1.04 2 0.52 0.59 0.556 < 0.01
Industry 0.48 2 0.24 0.27 0.762 <0.01
Education 0.86 3 0.29 0.32 0.809 <0.01
Gender 0.03 1 0.03 0.04 0.843 < 0.01
Position 0.97 2 0.49 0.55 0.578 < 0.01
Tenure 0.60 3 0.20 0.23 0.879 < 0.01
Income 3.99 3 1.33 1.50 0.215 0.02
Religion 4.74 3 1.58 1.78 0.150 0.02
Ethnicity 3.66 3 1.22 1.38 0.250 0.02
Presence of a Calling (CVQ) 26.64 1 26.64 30.07 0.000 0.10
Experience of a Calling (MCM) 0.29 1 0.29 0.33 0.566 < .01
18.70% 11.40% Note. CVQ = Calling and Vocation Questionnaire; MCM = Multi-dimensional Calling Measure
ANCOVA Model #4
Given that the study contained more than one independent variable, the researcher was
interested in examining whether or not any interaction effects existed between the nine demographic
variables and CVQ and MCM. As such, Model 4 included the main effects of the nine demographic
variables, the interaction effects between all the demographic variables and CVQ, the interaction
effects between all the demographic variables and MCM, and the interaction effect between CVQ
and MCM.
The results indicated that 14.5% of the variance in work ethic was accounted for by a
combination of the main effects of all the nine demographic variables and CVQ and MCM, the two-
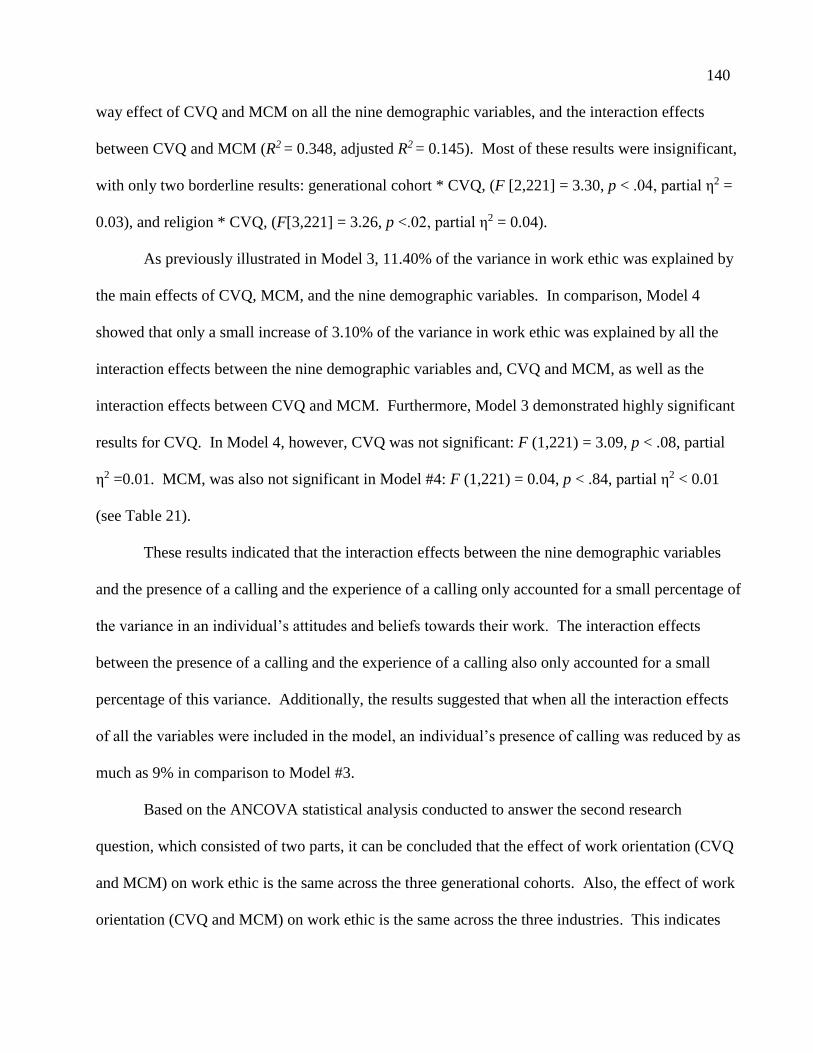
140
way effect of CVQ and MCM on all the nine demographic variables, and the interaction effects
between CVQ and MCM (R2 = 0.348, adjusted R2 = 0.145). Most of these results were insignificant,
with only two borderline results: generational cohort * CVQ, (F [2,221] = 3.30, p < .04, partial η2 =
0.03), and religion * CVQ, (F[3,221] = 3.26, p <.02, partial η2 = 0.04).
As previously illustrated in Model 3, 11.40% of the variance in work ethic was explained by
the main effects of CVQ, MCM, and the nine demographic variables. In comparison, Model 4
showed that only a small increase of 3.10% of the variance in work ethic was explained by all the
interaction effects between the nine demographic variables and, CVQ and MCM, as well as the
interaction effects between CVQ and MCM. Furthermore, Model 3 demonstrated highly significant
results for CVQ. In Model 4, however, CVQ was not significant: F (1,221) = 3.09, p < .08, partial
η2 =0.01. MCM, was also not significant in Model #4: F (1,221) = 0.04, p < .84, partial η2 < 0.01
(see Table 21).
These results indicated that the interaction effects between the nine demographic variables
and the presence of a calling and the experience of a calling only accounted for a small percentage of
the variance in an individual’s attitudes and beliefs towards their work. The interaction effects
between the presence of a calling and the experience of a calling also only accounted for a small
percentage of this variance. Additionally, the results suggested that when all the interaction effects
of all the variables were included in the model, an individual’s presence of calling was reduced by as
much as 9% in comparison to Model #3.
Based on the ANCOVA statistical analysis conducted to answer the second research
question, which consisted of two parts, it can be concluded that the effect of work orientation (CVQ
and MCM) on work ethic is the same across the three generational cohorts. Also, the effect of work
orientation (CVQ and MCM) on work ethic is the same across the three industries. This indicates

141
that neither generational cohort nor industry have any effect on the relationships between
individuals’ attitudes and beliefs toward their work and how they are oriented to their work (whether
as a presence of a calling and/or an experience of a calling).
Table 21
ANCOVA Model #4 Summary
Type
III SS df
Mean
Square F Sig.
partial
Ƞ2 R2
Adjusted
R2
Model 4
Generational Cohort 1.80 2 0.90 1.05 0.352 0.01
Industry 0.24 2 0.12 0.14 0.870 < 0.01
Education 1.62 3 0.54 0.63 0.595 0.01
Gender 0.01 1 0.01 0.01 0.922 < .01
Position 0.46 2 0.23 0.27 0.765 < .01
Tenure 0.52 3 0.17 0.20 0.896 < .01
Income 4.79 3 1.60 1.87 0.136 0.02
Religion 3.63 3 1.21 1.41 0.240 0.02
Ethnicity 5.27 3 1.76 2.06 0.107 0.03
Presence of Calling (CVQ) 2.64 1 2.64 3.09 0.080 0.01
Experience of Calling (MCM) 0.03 1 0.03 0.04 0.841 < 0.01
CVQ*MCM 0.00 1 0.00 0.00 0.990 <0 .01
Generational Cohort * CVQ 5.64 2 2.82 3.30 0.039 0.03
Industry *CVQ 0.42 2 0.21 0.24 0.785 < 0.01
Education *CVQ 2.22 3 0.74 0.87 0.460 0.01
Gender *CVQ 0.07 1 0.07 0.08 0.774 <0.01
Position *CVQ 2.05 2 1.03 1.20 0.30 0.01
Tenure * CVQ 0.59 3 0.20 0.23 0.877 < 0.01
Income *CVQ 0.59 3 0.20 0.23 0.875 < 0.01
Religion *CVQ 8.36 3 2.79 3.26 0.022 0.04
Ethnicity *CVQ 5.20 3 1.73 2.03 0.111 0.03
Generational Cohort *MCM 2.18 2 1.09 1.28 0.281 0.01
Industry *MCM 0.35 2 0.17 0.20 0.816 <0.01
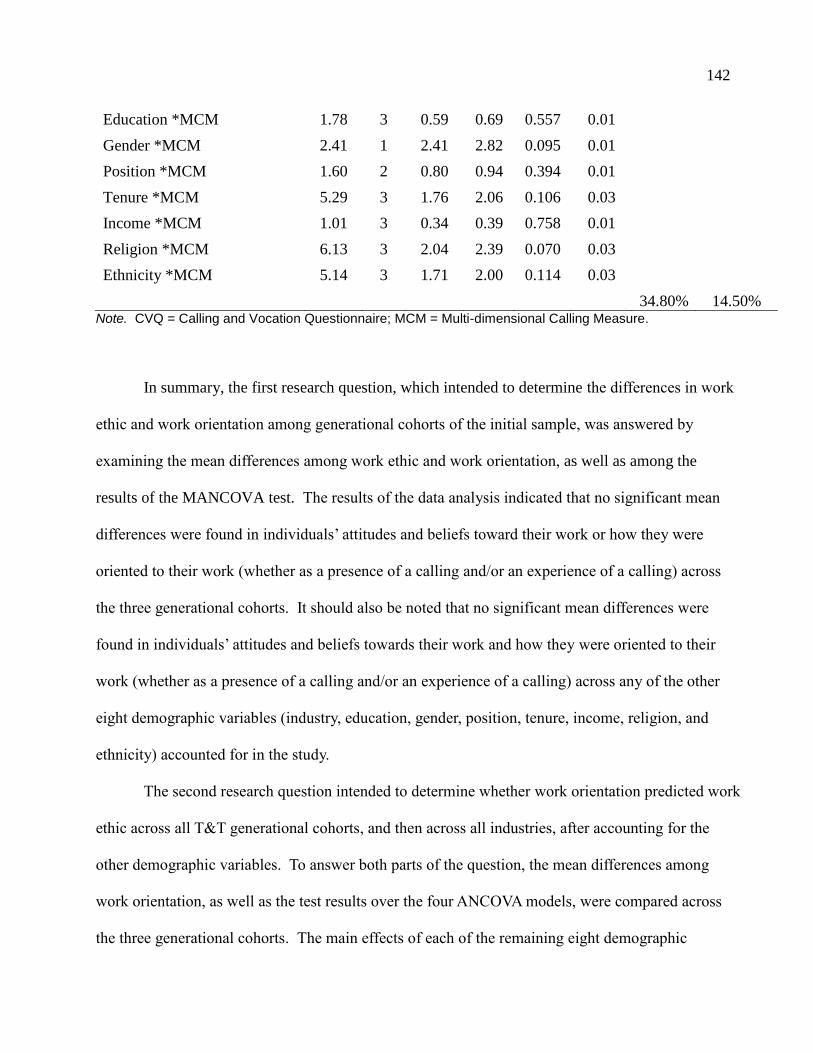
142
Education *MCM 1.78 3 0.59 0.69 0.557 0.01
Gender *MCM 2.41 1 2.41 2.82 0.095 0.01
Position *MCM 1.60 2 0.80 0.94 0.394 0.01
Tenure *MCM 5.29 3 1.76 2.06 0.106 0.03
Income *MCM 1.01 3 0.34 0.39 0.758 0.01
Religion *MCM 6.13 3 2.04 2.39 0.070 0.03
Ethnicity *MCM 5.14 3 1.71 2.00 0.114 0.03
34.80% 14.50% Note. CVQ = Calling and Vocation Questionnaire; MCM = Multi-dimensional Calling Measure.
In summary, the first research question, which intended to determine the differences in work
ethic and work orientation among generational cohorts of the initial sample, was answered by
examining the mean differences among work ethic and work orientation, as well as among the
results of the MANCOVA test. The results of the data analysis indicated that no significant mean
differences were found in individuals’ attitudes and beliefs toward their work or how they were
oriented to their work (whether as a presence of a calling and/or an experience of a calling) across
the three generational cohorts. It should also be noted that no significant mean differences were
found in individuals’ attitudes and beliefs towards their work and how they were oriented to their
work (whether as a presence of a calling and/or an experience of a calling) across any of the other
eight demographic variables (industry, education, gender, position, tenure, income, religion, and
ethnicity) accounted for in the study.
The second research question intended to determine whether work orientation predicted work
ethic across all T&T generational cohorts, and then across all industries, after accounting for the
other demographic variables. To answer both parts of the question, the mean differences among
work orientation, as well as the test results over the four ANCOVA models, were compared across
the three generational cohorts. The main effects of each of the remaining eight demographic

143
variables, the two-way interaction effects between each of the demographic variables and CVQ, and
between all the demographic variables and MCM, as well as the interaction effects between CVQ
and MCM, were all accounted for.
It was found that none of the two-way interaction effects were significant; therefore, the
analytical model was simplified such that only the main effects of all the demographic variables, the
presence of a calling, and the experience of a calling were examined (Model 3). The results obtained
indicated that the presence of a calling had a highly statistically significant effect on an individual’s
attitudes and beliefs toward his/her work, accounting for 10% of the observed variation. Therefore,
Model 3 was endorsed as the best model. Figure 4.4 graphically illustrates the relationships, or lack
thereof, that were established between work orientation (presence of a calling and experience of a
calling), work ethic, generational cohort, and industry.
144
Figure 6. Final Research Model illustrating the relationships that were identified between the independent variables, covariates and the dependent variable resulting from the statistical analyses.
Demographic
Variables
Industry
Auto, Retail, Tech
Generational
Cohorts
B/B, Xers, Yers
Work Orientation
Presence of a
Calling
Work Orientation
Experience of a
Calling
Transcendent
Summons (2)
Purposeful
Work (2)
Pro-Social
Orientation (4)
MCM-IP
(2)
MCM-TGF
(2)
MCM- SMVB
(2)
Work
Ethic
Centrality of
Work (3)
Leisure (4)
Gratification
(4)
Hard Work
(4)
Self-
Reliance (4)
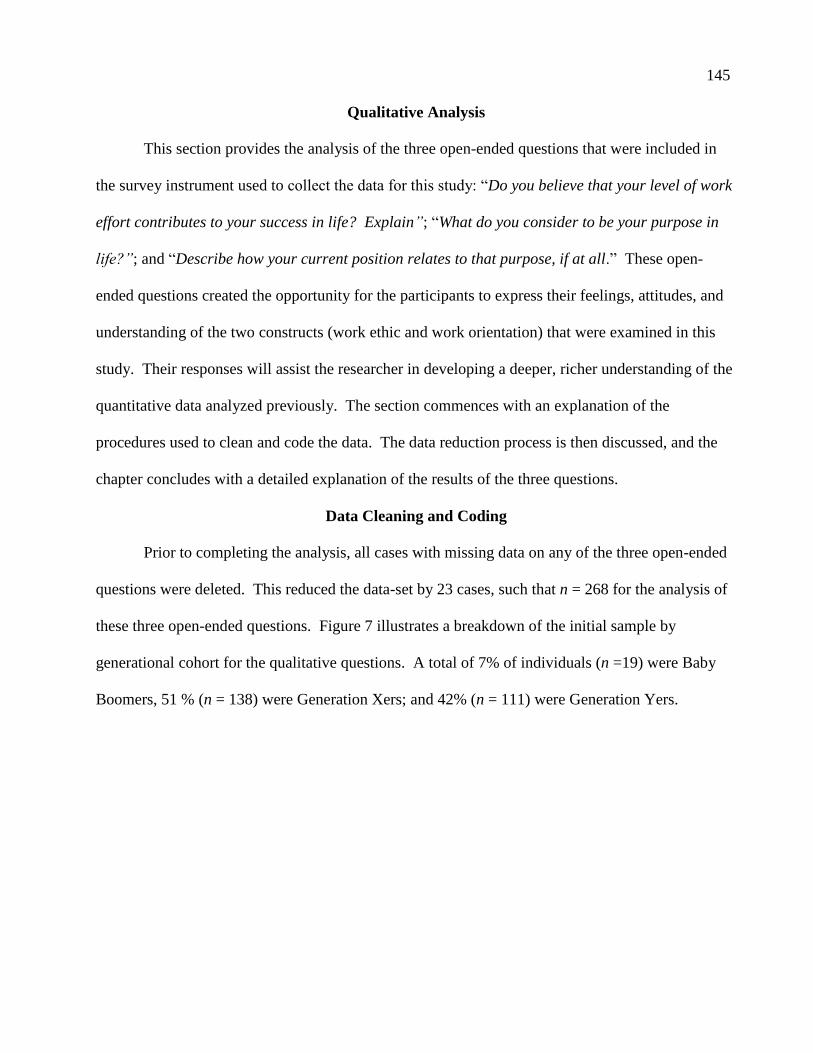
145
Qualitative Analysis
This section provides the analysis of the three open-ended questions that were included in
the survey instrument used to collect the data for this study: “Do you believe that your level of work
effort contributes to your success in life? Explain”; “What do you consider to be your purpose in
life?”; and “Describe how your current position relates to that purpose, if at all.” These open-
ended questions created the opportunity for the participants to express their feelings, attitudes, and
understanding of the two constructs (work ethic and work orientation) that were examined in this
study. Their responses will assist the researcher in developing a deeper, richer understanding of the
quantitative data analyzed previously. The section commences with an explanation of the
procedures used to clean and code the data. The data reduction process is then discussed, and the
chapter concludes with a detailed explanation of the results of the three questions.
Data Cleaning and Coding
Prior to completing the analysis, all cases with missing data on any of the three open-ended
questions were deleted. This reduced the data-set by 23 cases, such that n = 268 for the analysis of
these three open-ended questions. Figure 7 illustrates a breakdown of the initial sample by
generational cohort for the qualitative questions. A total of 7% of individuals (n =19) were Baby
Boomers, 51 % (n = 138) were Generation Xers; and 42% (n = 111) were Generation Yers.
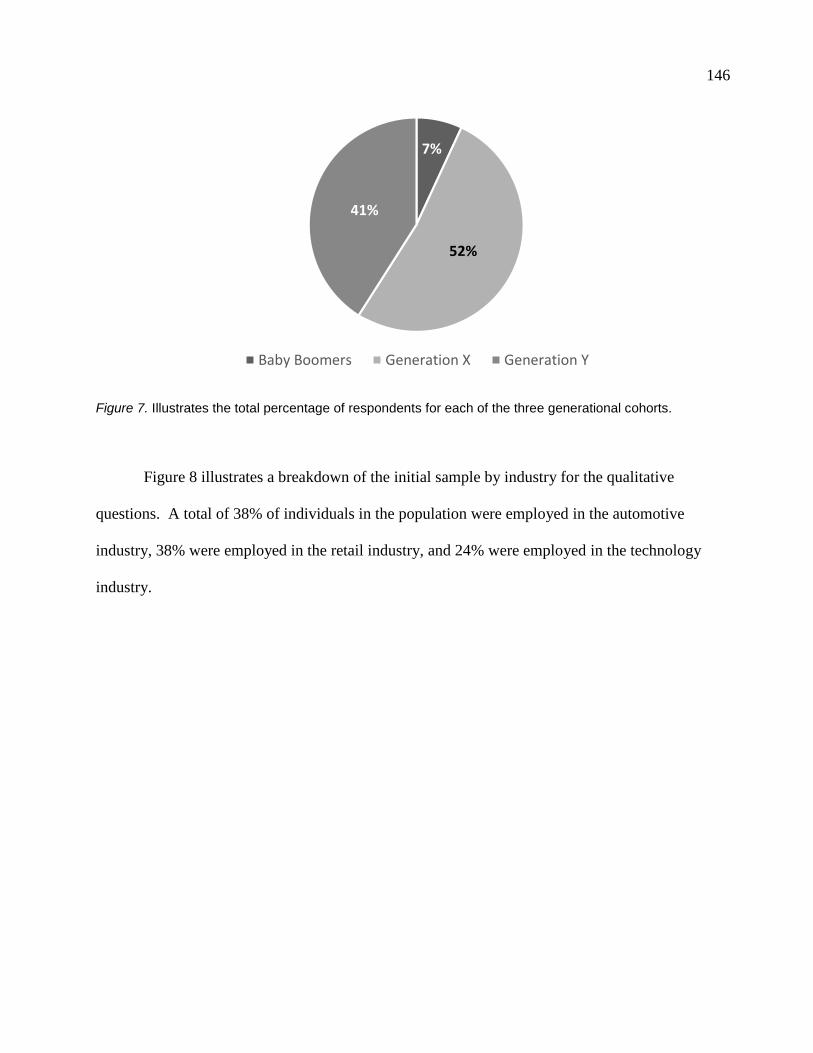
146
Figure 7. Illustrates the total percentage of respondents for each of the three generational cohorts.
Figure 8 illustrates a breakdown of the initial sample by industry for the qualitative
questions. A total of 38% of individuals in the population were employed in the automotive
industry, 38% were employed in the retail industry, and 24% were employed in the technology
industry.
7%
52%
41%
Baby Boomers Generation X Generation Y
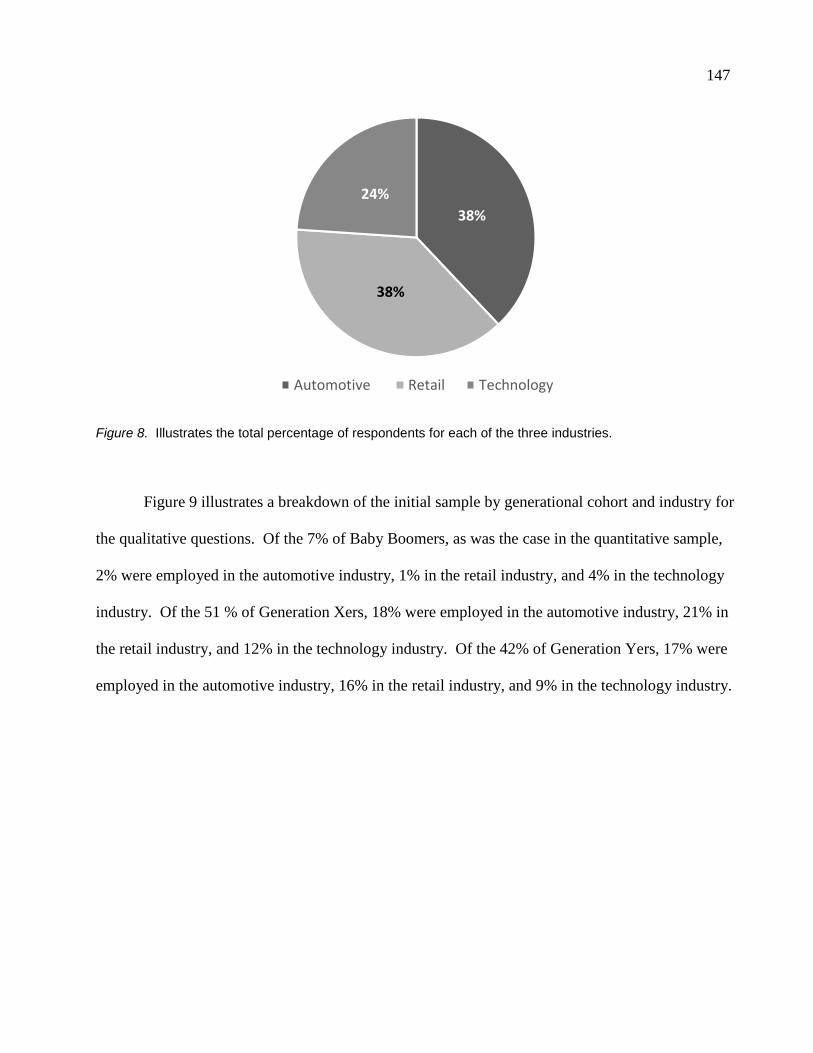
147
Figure 8. Illustrates the total percentage of respondents for each of the three industries.
Figure 9 illustrates a breakdown of the initial sample by generational cohort and industry for
the qualitative questions. Of the 7% of Baby Boomers, as was the case in the quantitative sample,
2% were employed in the automotive industry, 1% in the retail industry, and 4% in the technology
industry. Of the 51 % of Generation Xers, 18% were employed in the automotive industry, 21% in
the retail industry, and 12% in the technology industry. Of the 42% of Generation Yers, 17% were
employed in the automotive industry, 16% in the retail industry, and 9% in the technology industry.
38%
38%
24%
Automotive Retail Technology
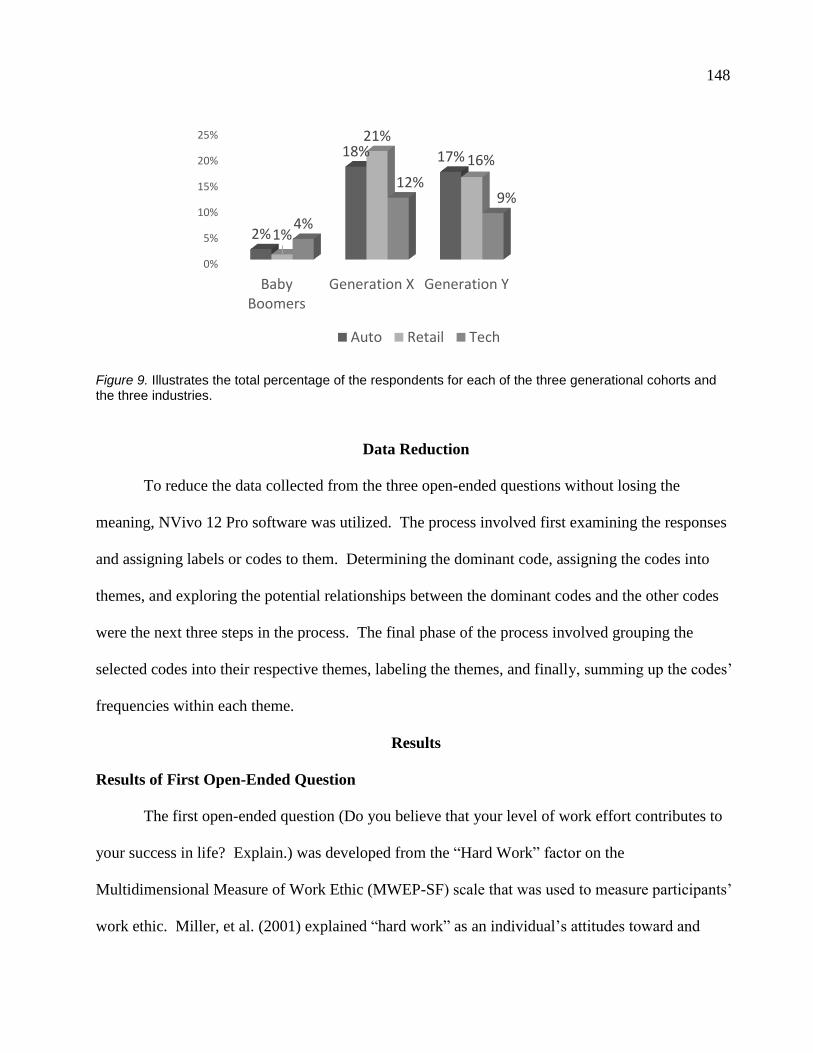
148
Figure 9. Illustrates the total percentage of the respondents for each of the three generational cohorts and the three industries.
Data Reduction
To reduce the data collected from the three open-ended questions without losing the
meaning, NVivo 12 Pro software was utilized. The process involved first examining the responses
and assigning labels or codes to them. Determining the dominant code, assigning the codes into
themes, and exploring the potential relationships between the dominant codes and the other codes
were the next three steps in the process. The final phase of the process involved grouping the
selected codes into their respective themes, labeling the themes, and finally, summing up the codes’
frequencies within each theme.
Results
Results of First Open-Ended Question
The first open-ended question (Do you believe that your level of work effort contributes to
your success in life? Explain.) was developed from the “Hard Work” factor on the
Multidimensional Measure of Work Ethic (MWEP-SF) scale that was used to measure participants’
work ethic. Miller, et al. (2001) explained “hard work” as an individual’s attitudes toward and
0%
5%
10%
15%
20%
25%
BabyBoomers
Generation X Generation Y
2%
18% 17%
1%
21%
16%
4%
12%9%
Auto Retail Tech
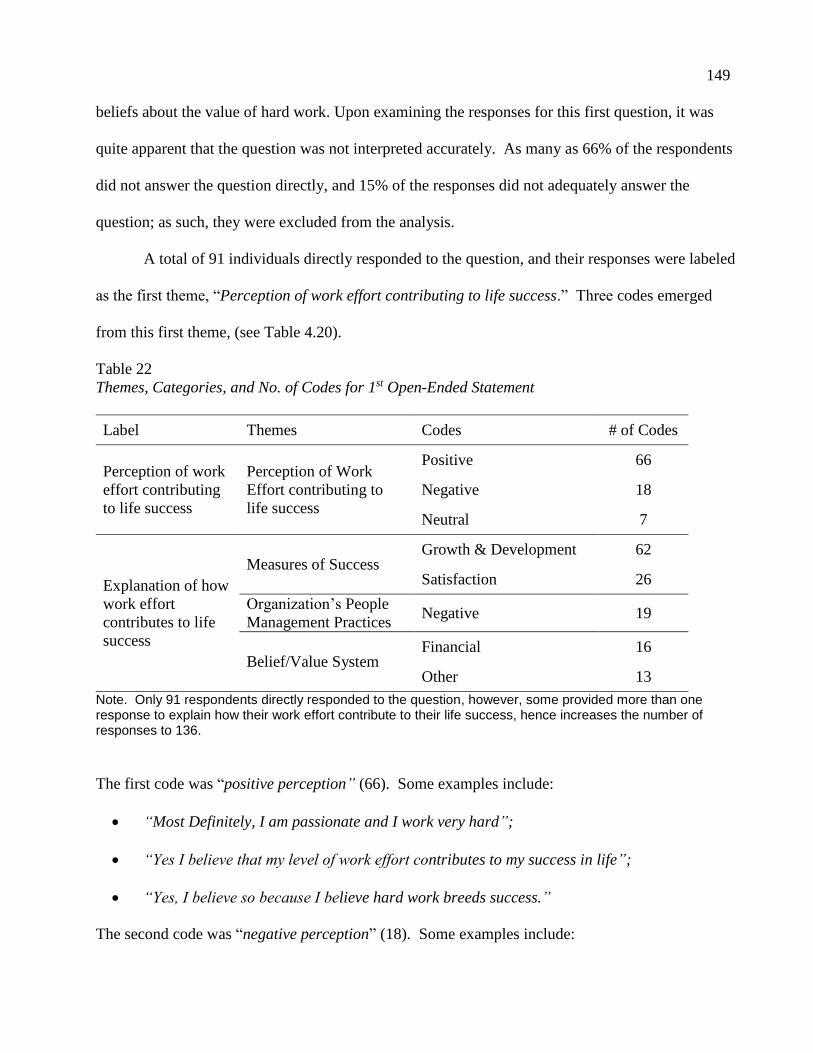
149
beliefs about the value of hard work. Upon examining the responses for this first question, it was
quite apparent that the question was not interpreted accurately. As many as 66% of the respondents
did not answer the question directly, and 15% of the responses did not adequately answer the
question; as such, they were excluded from the analysis.
A total of 91 individuals directly responded to the question, and their responses were labeled
as the first theme, “Perception of work effort contributing to life success.” Three codes emerged
from this first theme, (see Table 4.20).
Table 22
Themes, Categories, and No. of Codes for 1st Open-Ended Statement
Label Themes Codes # of Codes
Perception of work
effort contributing
to life success
Perception of Work
Effort contributing to
life success
Positive 66
Negative 18
Neutral 7
Explanation of how
work effort
contributes to life
success
Measures of Success Growth & Development 62
Satisfaction 26
Organization’s People
Management Practices Negative 19
Belief/Value System Financial 16
Other 13
Note. Only 91 respondents directly responded to the question, however, some provided more than one response to explain how their work effort contribute to their life success, hence increases the number of responses to 136.
The first code was “positive perception” (66). Some examples include:
“Most Definitely, I am passionate and I work very hard”;
“Yes I believe that my level of work effort contributes to my success in life”;
“Yes, I believe so because I believe hard work breeds success.”
The second code was “negative perception” (18). Some examples include:
150
“No, I do not. My job is only one part of my life”;
“No I don’t believe so”;
“No, because someone can work hard their whole life and if you don't know what you want
in life, all you do will mean nothing.”
The third code was “neutral perception” (7). Some examples include:
“Yes and no”;
“Yes but not always”;
“Somewhat.”
The 91 individuals that directly answered the first open-ended question provided deep, rich
explanations of how their “work efforts contributed to their life success.” Some of the individuals
provided more than one explanation, hence increasing the number of explanations by 45. A total of
136 responses were therefore obtained. Three themes were established to interpret these 136
responses. The first theme “measures of success” (88), consisted of two codes: “growth and
development” and “satisfaction.” A total of 62 responses explained success as “personal,
professional, or organizational growth and development.” (see Table 22). Some examples include:
“My success in life is how I use the work I do to grow as an individual in understanding
how things work and how to make it better”;
“By putting in extra effort I believe it will reflect in my caliber of work I produce which can
set me aside from other members of my team and help me grow within the organization
when the opportunity for a promotion arises”;
“My current level of work effort allows me to contribute to the overall success of my
company, which allows me to become more successful in my career.”
151
The second code, “satisfaction,” comprised 26 responses and used job satisfaction (15) and
customer satisfaction (11) to explain how work life contributed to success. Some examples of job
satisfaction responses include:
“Once you work and become fulfilled, you are satisfied - with this, you can help humanity”;
“I am fulfilled in the job”;
“I love to see persons achieve their goals and have a sense of purpose. My function allows
me to do this as a leader I allow others to see the greater good of doing their best always.”
Some examples of customer satisfaction responses include:
“I do believe that my work effort contributes to my success in life because I get a self-
gratifying feeling when I put a smile on a customer’s face, knowing I put my very best effort
into my work”;
“Yes, by going the extra mile to satisfy your customers”;
“Yes I believe it does seeing the line of work I am doing by making sure the customers
receive the best of service and quality contributes to my success in life.”
The second theme focused on how individuals rationalized their success. A total of 19
responses associated success, or lack thereof, with the “organization’s people management
practices” (see Table 22). Some examples include:
“No, I do not, the reason being is the workload and the standard which the work is done is
more than the rewards received”;
“No...some people with poor work ethic succeed whilst others with high work ethic struggle
for years”;
“Not necessarily...nepotism is a case in point and (here), there seems to be an epidemic of
slackers that don't get into trouble (and even promoted), despite not really contributing
152
anything valuable to the company.”
A total of 29 responses explained work ethic by exploring “belief systems,” which was the
third theme. Two codes were created to further explain the belief systems: financial security (16)
and other factors (13), such as spiritual (4), family (7), and moral beliefs (2; see Table 4.20). Some
examples of the financial security responses include:
“Yes, I do agree, it can provide the monetary rewards that I desire”;
“Since I have started working at (here), I was able to give my children a good education,
purchase my own home and vehicles for my wife and myself”;
“Yes: Hard work = financial gain which is used to make a better life for my family.”
Some examples of responses dealing with other factors include:
“Yes, whatever you accomplish in life is in direct proportion to the intensity and persistence
of your Faith”;
“I have thirty years of success at my job and live a comfortable and satisfying life with my
wife and children and the wider community and I have satisfaction to know those whom I
have 'touched' are successful”;
“To a point. However ones beliefs and moral values is what guides me.”
Results of Second Open-Ended Question
The second open-ended question (What do you consider to be your purpose in life?
Describe how your current position relates to that purpose, if at all) was developed from the
“Presence-Purposeful Work” factor on the Calling and Vocation Questionnaire (CVQ) that was
used in this study to measure respondents’ presence of a calling. Dik et al. (2012) explained
“Presence-Purposeful Work” as an approach to a particular role in life to derive a sense of meaning
and purpose. After reviewing the responses for this question, it was found that as many as 15% of
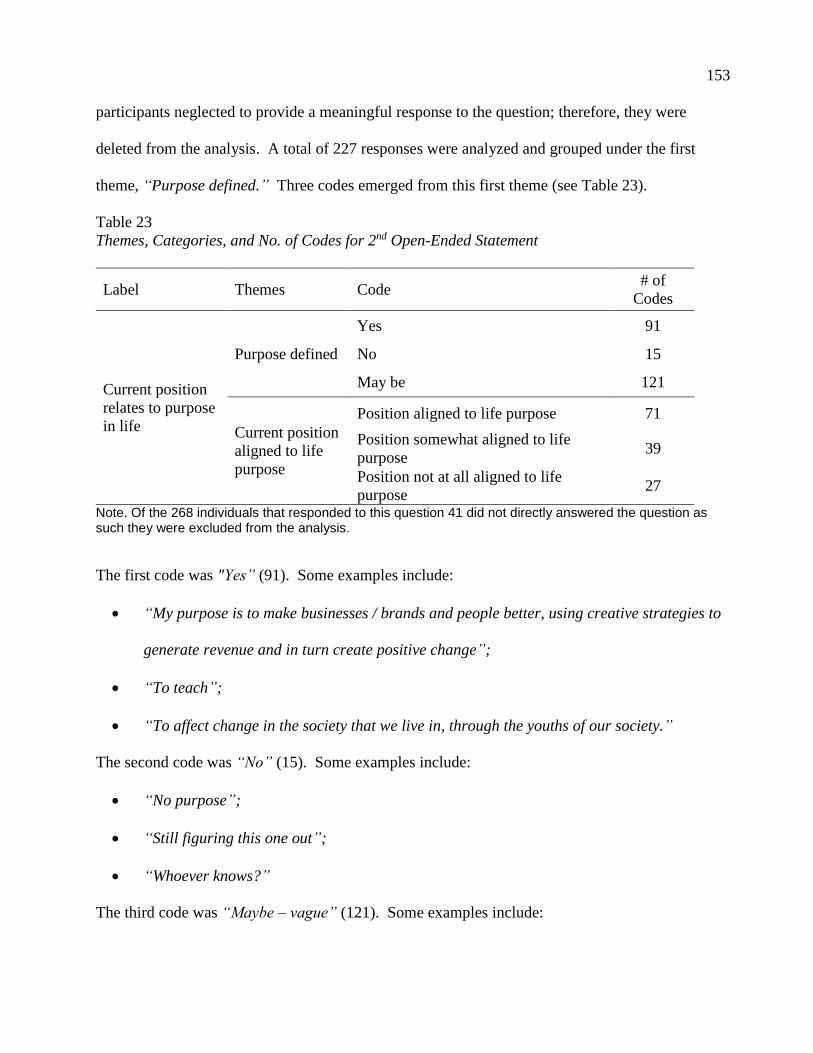
153
participants neglected to provide a meaningful response to the question; therefore, they were
deleted from the analysis. A total of 227 responses were analyzed and grouped under the first
theme, “Purpose defined.” Three codes emerged from this first theme (see Table 23).
Table 23
Themes, Categories, and No. of Codes for 2nd Open-Ended Statement
Label Themes Code # of
Codes
Current position
relates to purpose
in life
Purpose defined
Yes 91
No 15
May be 121
Current position
aligned to life
purpose
Position aligned to life purpose 71
Position somewhat aligned to life
purpose 39
Position not at all aligned to life
purpose 27
Note. Of the 268 individuals that responded to this question 41 did not directly answered the question as such they were excluded from the analysis.
The first code was "Yes” (91). Some examples include:
“My purpose is to make businesses / brands and people better, using creative strategies to
generate revenue and in turn create positive change”;
“To teach”;
“To affect change in the society that we live in, through the youths of our society.”
The second code was “No” (15). Some examples include:
“No purpose”;
“Still figuring this one out”;
“Whoever knows?”
The third code was “Maybe – vague” (121). Some examples include:
154
“I haven't determined my exact purpose, but I know it would involve helping people”;
“Service to others - helping others and making them happy in whatever way I can”;
“My purpose is to fulfill a higher purpose.”
Only 51% of the respondents were able to clearly articulate whether their current position
was aligned to their purpose. Of the 137 responses, three codes emerged. The first code was
“position aligned to life purpose” (71). Some examples include:
“My purpose in life is to help others and make life easier for others. My job allows me fulfill
that by giving me the opportunity to 'fix' issues customers may have”;
“My purpose in life is to help others achieve their goals. I find true satisfaction in seeing
persons become better individuals and achieving their dreams. My current position helps me
do that by helping customers fulfill their needs and assisting them in any way possible
bringing them satisfaction”;
“I have been exposed to the automotive industry from a very young age that exposure would
have shown the natural talent I exhibited in the field. It was also seen and noted in the
school I attended in the automotive field. It felt natural to me and my current position helps
me fulfill that sense of accomplishment.”
The second code was “position somewhat aligned to life purpose” (39). Some examples include:
“My purpose is to fulfill a higher purpose. My current position affords me the interactions
that can help in this journey”;
“I believe that I am called to do more than what I am doing in my current position and each
day that goes by leads me closer to my "purpose”;
“Working with persons may be my purpose in life. I currently do that but I sometimes feel
am not where I would like to be.”
155
The third code was “position not at all aligned to life purpose” (27). Some examples include:
“My current position does not give me purpose in life”;
“I have not discovered my purpose in life hence the current job does not relate to that
purpose”;
“My present position does not afford me to truly follow my purpose, it is merely a means to
satisfy my material needs.”
Results of Third Open-Ended Question
The third open-ended question (Do you believe that your current line of work contributes to
the overall satisfaction of your life? Explain”) was developed to motivate the respondents to
explore their current lines of work and determine whether it related to their overall life satisfaction.
According to Diener and Seligman (2004), with the reduction of the contribution of salary to well-
being, more than ever, a critical need exists for individuals to consider other factors that lead to
satisfaction at work and life in general. As was the case with the second question, a review of the
responses showed that as many as 34% of participants neglected to provide a meaningful response
to the question. As such, these responses were excluded. An analysis of the responses indicated
that participants provided positive (72), negative (70), neutral (36) reasons to explain whether their
current line of work contributes to the overall satisfaction of their lives. As such, these were the
three codes for the first theme “Respondents’ reactions to their current line of work contributing to
their life satisfaction” (see Table 24).
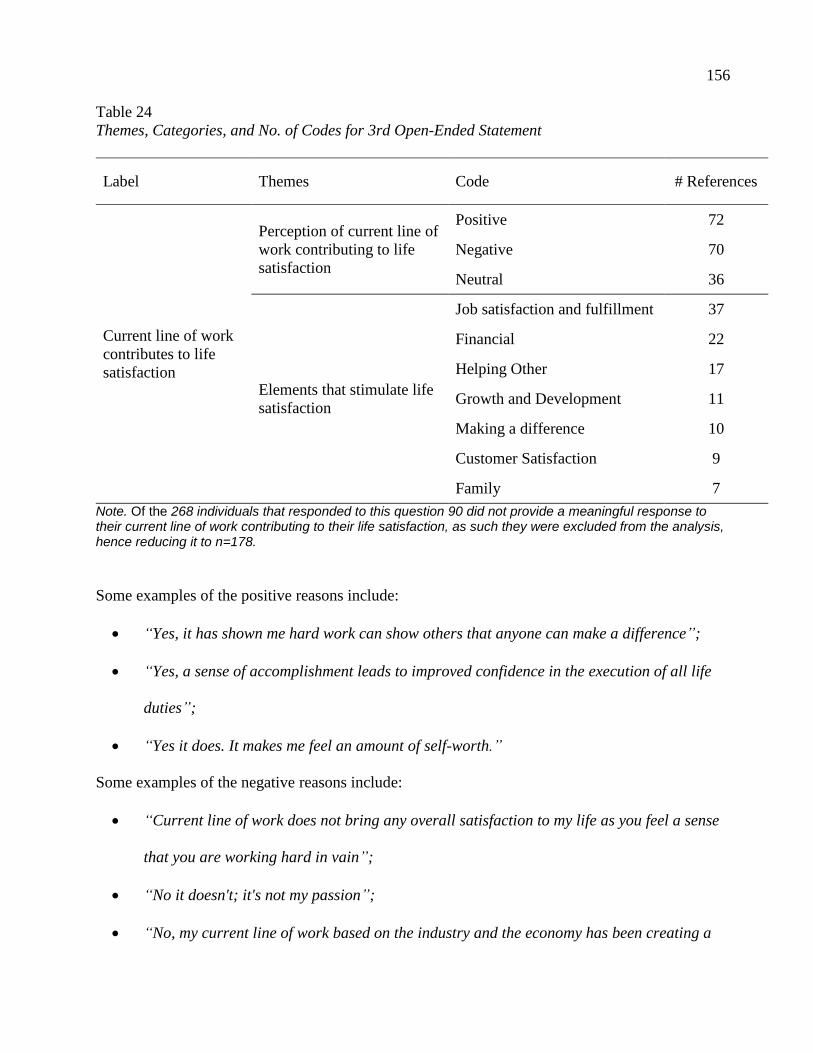
156
Table 24
Themes, Categories, and No. of Codes for 3rd Open-Ended Statement
Label Themes Code # References
Current line of work
contributes to life
satisfaction
Perception of current line of
work contributing to life
satisfaction
Positive 72
Negative 70
Neutral 36
Elements that stimulate life
satisfaction
Job satisfaction and fulfillment 37
Financial 22
Helping Other 17
Growth and Development 11
Making a difference 10
Customer Satisfaction 9
Family 7
Note. Of the 268 individuals that responded to this question 90 did not provide a meaningful response to their current line of work contributing to their life satisfaction, as such they were excluded from the analysis, hence reducing it to n=178.
Some examples of the positive reasons include:
“Yes, it has shown me hard work can show others that anyone can make a difference”;
“Yes, a sense of accomplishment leads to improved confidence in the execution of all life
duties”;
“Yes it does. It makes me feel an amount of self-worth.”
Some examples of the negative reasons include:
“Current line of work does not bring any overall satisfaction to my life as you feel a sense
that you are working hard in vain”;
“No it doesn't; it's not my passion”;
“No, my current line of work based on the industry and the economy has been creating a
157
stressful environment which in turn impacts the comforts of my life, (financially and
emotionally).”
Some examples of the neutral reasons include:
“To a limited extent, as my current career path does not fulfill or match my aspirations of
my original objectives”;
“No, not the overall satisfaction, but it has added some value. My overall satisfaction
comes from my external interest”;
“Yes and no.”
Only 67% of the individuals that provided meaningful responses to the first part of the
question further explained how they perceived that their current line of work contributed to the
overall satisfaction of their life (see Table 4.22). The first contributor was job satisfaction and
fulfillment (37). Some examples include:
“Yes I do, the sense of satisfaction I get from doing a good job”;
“My job, position, career was not my choice, but I have definitely been enjoying the
journey”;
“I believe my life is satisfied, by the self-accomplishment I gain from doing my job and am
able to live my life with confident and feel accomplish.”
Financial satisfaction (22) was the second contributor. Some examples include:
“Yes, it’s what I'm instinctively good at and I am able to earn and achieve my life goals
because of it”;
“Yes. I am satisfied that my income sustains me for now and the future”;
“My rewards/compensation from my job helps provide for my family.”
Helping others (17) was the third contributor. Some examples include:
158
“As I have seen within my overall career, I see how my impact has positively affected others
and helped them grow personally and professional”;
“Yes, it fulfilling when you help someone”;
“Helps me to apply the skills and knowledge that I have accumulated...so that I can help
others. Helping others is important to me.”
Growth and development (11) was the fourth contributor. Some examples include:
“It has also helped me grow and challenge myself in areas I would not have previously
pursued”;
“Grow as a person”;
“Every day I come to work is a fulfilling one where I try to learn and improve with each
interaction therefore making me a better person.”
Making a difference (10) was the fifth contributor. Some examples include:
“Yes, as I feel like I am making a difference, one person at a time”;
“Yes. I feel that I am making a difference. Solving problems, being content with my position,
doing something that interests me”;
“Yes. I am able to make a difference in the lives of others.”
Customer Satisfaction (9) was the sixth contributor. Some examples include:
“Yes I do believe it does contribute because I like interacting with customers and making
them happy and satisfied with our service hence I get satisfaction”;
“Customer service helps you see people's situation in a balanced way. It assists with
developing empathy, resilience and causes you to get creative”;
“By providing exceptional customer service makes me feel a sense of pride and
satisfaction.”
159
Family (7) was the seventh contributor. Some examples include:
“My work, job help me to better in life as a mother and a woman being independent”;
“Helps me support my family”;
“My rewards/compensation from my job provides for my family which is my ultimate goal.”
In summary, three open-ended questions were used to give a deeper, richer meaning to the
quantitative data collected to answer the research questions. It was evident that as many as 66% of
the respondents did not seem to interpret the questions accurately, and therefore did not adequately
answer the questions. As such, their responses were excluded from the analysis. Notwithstanding
this, as many as 66 individuals indicated a positive perception with regard to their work effort
contributing to their life success. Sixty-two individuals used personal, professional, and
organizational growth and development to measure their level of work effort to their life success,
and 19 individuals attributed the organization’s unfair people management practices for their lack of
success. In exploring the themes from work orientation, we saw that a total of 60% of the
individuals were able to clearly define their purpose. This seems to somewhat match the
quantitative statistics which reported that 52% of the sample claimed to have a calling. Seventy-
two individuals had a positive perception of their current line of work contributing to their life
satisfaction. As many as 37 respondents identified job satisfaction and fulfillment as the element
that stimulated their life satisfaction, while 22 attributed their life satisfaction to financial gain.
Conclusion
This chapter presented the findings of the statistical analyses used to answer the research
questions as it related to work ethic and work orientation across T&T generational cohorts in a
multi-national, multi-industry corporation. The results of the study revealed a lack of statistically
significant evidence to support the existence of mean differences among individuals’ attitudes and
160
beliefs towards their work across the generational cohorts. The same was revealed about how
individuals across generational cohorts made meaning of their work. Also, no statistical evidence
existed to indicate that the ways in which individuals make meaning of their work predicted their
attitudes and beliefs towards their work across the generational cohorts or industries. However,
while no statistical evidence existed to support the research questions for this study, strong
statistical evidence was present to support that individuals in the site of study who make meaning of
their work as a presence of a calling inculcated stronger attitudes and beliefs towards their work in
general. The responses to the second open-ended question indicated that 49% of the respondents
were able to clearly define their purpose, and 26% were able to link their current position to their
life purpose. Chapter five contains further discussions of these results, which include conclusions
drawn, implications, and recommendations for future research.
161
Chapter 5: Discussion and Conclusions
Introduction
The purpose of this post-positivistic quantitative research study was to predict how the work
orientation and generational cohorts of 291 individuals, employed at a major multi-national, multi-
industry corporation in the twin islands of T&T, influence their work ethic. This chapter provides
an overview of the findings and interpretations of the three theories and constructs (work ethic,
generational cohort, and work orientation) used to answer the research questions. The chapter later
presents and interprets the conclusions drawn from the research findings, and explains how these
findings converge with or diverge from previous work ethic, work orientation, and generational
cohort literature. Additionally, the researcher demonstrates how the findings apply to the
scholarship; bridge the work ethic, generational cohort, and work orientation gaps in the literature;
and contribute to the literature on the T&T work environment. The chapter concludes with the
limitations of the study and the recommendations for future research.
Summary of the Findings
The purpose of this study was to predict individuals’ attitudes and beliefs towards their work
and how they make meaning of their work across generations in the twin islands of Trinidad and
Tobago. Individuals’ attitudes and beliefs towards their work (work ethic) were measured by using
the MWEP-SF measurement scale. Together, the CVQ (‘presence of a calling’) and the MCM
(‘experience of a calling’) measurement scales were used in this study to measure how respondents
make meaning of their work (work orientation). This section will provide a summary of the
findings presented in Chapter 4, commencing with the correlations of the measurement scales used
in the study. The results of the correlation analysis conducted on the three measurement scales
reported a relatively strong positive statistically significant correlation between the MWEP-SF and
162
the CVQ scales, (r = .346, p < .01). However, the MCM scale reported weak positive correlations
that were not statistically significant with both the MWEP-SF scale, (r = .040, p < .01), and the
CVQ scales, (r = .029, p < .01).
Interpretation of the Findings
Findings
The first research question was designed to examine the generational differences in
individuals’ attitudes and beliefs toward their work and how they make meaning of their work,
while controlling for the effects of the key demographic variables, in a major multi-national
corporation in T&T. The results of this first question reported no significant generational
differences in individuals’ attitudes and beliefs towards their work, and also in how they make
meaning of their work: F(6,532) = 1.543, p < .162, Wilks’ λ = 0.966, partial η2 = 0.017.
The second research question consisted of two parts. The first part examined the meaning
that generational cohorts made of their work and the extent to which it predicted their attitudes and
beliefs towards their work in general and not to a specific job. The second part of the question
examined the meaning that individuals across different industries made of their work and whether it
predicted their attitudes and beliefs to their work in general. No statistical evidence existed to
support that the ways in which individuals made meaning of their work, whether as a presence of a
calling, (F[1,221] = 3.09, p < .08, partial η2 =0.01, or an experience of a calling, (F[1,221] = 0.04, p
< .84, partial η2 < 0.01, predicted their attitudes and beliefs towards their work, across generational
cohorts or industry in the sample organization located in T&T. The researcher was not able to find
any differences across any of the generational or industrial groups in this study. However, strong
statistical evidence existed to support that individuals who made meaning of their work as a
presence of a calling (F[1,266] = 30.07, p < 0.00, partial η2 = 0.10) inculcated stronger attitudes and
163
beliefs towards their work in general. The interpretation of these results within the Generational
and Protestant Work Ethic Theoretical frameworks presented in Chapter 2, and their convergence
with and divergence from earlier findings will be discussed in detail in the subsequent section.
Interpretation
A plethora of earlier literature examined different constructs and concepts and developed the
Generational and the Protestant Work Ethic theoretical frameworks, which were used to interpret
the findings of this study. The results of the correlational analyses conducted on the three scales
used in this study reported that there was a relatively strong positive statistically significant
correlation between the MWEP-SF and the CVQ measurement scales. In contrast, a weak positive
correlation was reported between the MWEP-SF and the MCM measurement scales. One possible
explanation for these results is that the items on the CVQ measurement scale may have resonated
more than the items on the MCM measurement scale with the work culture of the individuals in the
T&T working environment. Another possible explanation is that the CVQ measurement scale is a
better predictor of work ethic than the MCM measurement scale. .
Furthermore, the MCM and CVQ measurement scales reported weak positive correlations
that were not statistically significant. These results were consistent with an earlier study that
assessed the five calling instruments and reported that the MCM measurement scale strongly
correlated with the Brief Calling Scale only. The study also failed to report a correlation between
the MCM and CVQ measurement scales, possibly indicating a lack of correlation between them
(Duffy et. al., 2015). These results suggest that while the CVQ and MCM measurement scales were
both initially developed to measure work orientation, they may be measuring totally different
aspects of work orientation and are therefore not correlated.
164
Taken together, the two research questions in this study reported insignificant results. The
first research question reported no generational differences in the ways in which individuals made
meaning of their work and their attitudes and beliefs toward their work in general. These results
converged with some earlier studies that reported no generational differences on job satisfaction,
organizational commitment, intent to turnover, and work ethic, (Costanza et al., 2012; Zabel et al.,
2016). In direct contrast, generational differences were identified across work commitment and
attitude toward work and career (Davis et al., 2006; Macky, Gardner, & Forsyth, 2008). Some
small generational differences were reported across work values (Hansen & Leuty, 2012).
Generational differences were reported across four dimensions of work: leisure, morality/ethic, hard
work, and delay of gratification (Meriac et al., 2010; Jobe, 2014; Van der Walt et al., 2016).
In the studies highlighted above, work ethic was the dependent variable for four of the eight
studies. The dependent variables for the other four studies were synonymous to work ethic: work
commitment; work values; work; and job satisfaction, organizational commitment, and intent to
turnover. Notwithstanding the variation in the dependent variables, the differences span from no
differences to small significant differences to statistically significant differences. In spite of
scholars’ and practitioners’ efforts over the last two decades to improve organizational performance
by increasing their understanding of the impact of generational differences in the workplace, their
efforts seem to produce inconsistent results. A possible explanation for these inconsistent results
may be that five of the eight studies discussed above used different instruments to measure work
ethic. These instruments were operationalized differently, hence the significantly different results.
The other three studies used the MWEP-SF measurement instrument, operationalized it as a multi-
dimensional scale, and reported somewhat similar results. This study, however, used the multi-
dimensional MWEP-SF measurement instrument and operationalized it as a uni-dimensional
165
instrument. This was because only the composite scores of the respondents’ attitudes and beliefs
toward their work were needed to determine the mean differences across the generational cohorts.
No significant mean differences were reported across the generations. If the MWEP-SF
measurement scale had been operationalized multi-dimensionally as opposed to uni-dimensionally,
different results might have been obtained. Another plausible explanation for the statistically
insignificant results is that the differences across the generational cohorts may have been specific to
the U.S. work culture. Therefore, they may not have been applicable to the work culture of the
T&T working population, given the unique history and evolution of its work environment. Another
possible explanation for the statistically insignificant results is that both the generational differences
theory and the MWEP-SF measurement scale were established in the U.S.A., a developed nation,
while this study was conducted in T&T, a developing nation. Comparisons of earlier studies that
used the MWEP-SF measurement scale and operationalized it as a multi-dimensional instrument,
across both developed (U.S.A.) and developing (South Africa) nations, reported somewhat similar
results. Across the U.S.A. sample, Jobe (2014) reported generational differences in leisure, hard
work, and delay of gratification. Meriac et al., (2010) reported these differences in morality/ethic,
hard work, and delay of gratification. However, across the South African sample, differences were
reported in hard work and delay of gratification (Van der Walt et al., 2016). An examination of
these results revealed that the two dimensions (hard work and delay of gratification) were consistent
across both developed and developing nations. However, in the U.S.A. only, leisure was unique to
the nursing sample, while morality/ethic was unique to a student/employee sample. These results
suggest that while some inconsistencies may exist, consistencies are also present within the seven
dimensions used to measure work ethic across the developed and developing nations.
166
In their study, Czerw and Grabowski (2015) concluded that individuals’ motivation towards
their work is significantly subjective and may be determined more by their psychological traits.
The researcher used these findings to present another plausible explanation for these inconsistences.
It is suggested that individuals’ motivation towards their work is determined more by their
psychological traits than by any demographic variable such as generational cohort. Czerw and
Grabowski (2015) used three attitudes of work to emphasize an individual’s psychological traits:
punitive (work is perceived as an imposed way of behavior and performance linked to a feeling of
unfair treatment and exploitation), instrumental (work is appreciated because of material
advantages), and autotelic (work is perceived as a purpose and a foundation for personal
development, which to some extent appears to be synonymous with presence of a calling). These
three attitudes were clearly articulated in the participants’ responses to the first open-ended
question. One of the responses that illustrated an individual’s punitive attitude was, “I do not, what
I have been exposed to is that you work hard and you don't get promoted, so it kills the idea work
hard and you will become successful.” A response that was consistent with an individual’s
instrumental attitude was, “I have thirty years of success at my job and live a comfortable and
satisfying life with my wife and children and the wider community. I am satisfied to know those
whom I have touched are successful.” Finally, one response that demonstrated an individual’s
autotelic attitude was, “Yes, work makes me efficient and more disciplined. I am forced to find
ingenuous ways to get things done.” (See Appendix N for more of the open-ended responses).
It is quite evident that the responses to the first open-ended question demonstrated Czerw
and Grabowski’s (2015) three attitudes of work that emphasize the psychological traits of
individuals. Taken together, these findings suggest that individuals’ attitudes and beliefs towards
work may be determined more by their psychological traits than by their generational cohort.
167
The result of this first research question can stimulate the decision makers in the sample
organization to begin exploring other variables, such as psychological traits, that may be more
influential to their employees’ attitudes and beliefs towards their work in general. In this regard,
scholars and practitioners are guided to also include psychological traits in the psychometric tests
that are used in their recruitment processes.
The findings of the second research question indicated no generational or industrial
differences in how individuals made meaning of their work and the extent to which it predicted
their attitudes and beliefs towards their work in general. These results are somewhat consistent
with some earlier studies that examined the differences across key demographic variables such as
gender, industry, and cross-cultural differences. These studies reported no significant differences in
individuals’ attitudes and beliefs towards their work (Woehr et al., 2007; Meriac et al., 2009; Van
Ness et al., 2010).
Similar to generational cohorts discussed earlier, these statistically insignificant results may
suggest that individuals’ attitudes and beliefs toward their work are determined more by their
psychological traits and attitudes than by any of the demographic variables (Czerw & Grabowski,
2015). Also, as mentioned earlier, these results can be used as a guide to the decision makers in the
sample organization that they should begin exploring other variables, such as psychological traits,
that may be more influential on their employees’ work ethic. This is because differences across
generational cohort, industry, education, position, gender, income, tenure, ethnicity, and religion
have been deemed insignificant. Scholars and practitioners are therefore guided to also include
psychological traits in the psychometric tests used in their recruitment processes.
In direct contrast to the three demographic variables (gender, industry, and cross-cultural
differences) discussed earlier, Pogson, Cober, Doverspike, and Rogers (2003) reported that
168
individuals in their early career scored significantly higher on hard work and delay gratification.
However, later career participants scored significantly higher on morality/ethic, wasted time, and
leisure. These results diverge from the results reported in this study that no statistically significant
differences exist across the three positions (entry level, supervisor, and
managerial/professional/executive). As discussed earlier, one possible explanation for these
inconsistent results is the way in which the MWEP-SF scale was operationalized. In the earlier
study, it was operationalized as a multi-dimensional scale. In this study, however, it was
operationalized as a uni-dimensional scale because only the composite scores of the respondents’
attitudes and beliefs toward their work were needed to answer the research question. If the MWEP-
SF scale had been operationalized as multi-dimensional, generational differences might have been
reported over some of the seven dimensions.
All in all, the most statistically significant finding of this study indicated that employee at
the sample organization that make meaning of their work as a presence of a calling inculcated
stronger attitudes and beliefs toward their work in general and not to a specific job. These results
are somewhat consistent with earlier findings. While no evidence existed of any earlier studies that
specifically examined work orientation and work ethic together, previous research on work
orientation indicated that individuals with higher levels of work orientation reported higher levels of
individual and work-related outcomes (Duffy et al., 2011a). For example, five studies concluded
that individuals perceiving their work as a ‘calling’ reported greater job satisfaction, higher levels
of well-being, career decidedness, work satisfaction, perceived organization duty, and occupational
identification, (Davidson & Caddell, 1994; Wrzesniewski et al., 1997; Duffy & Sedlacek, 2007;
Peterson et al., 2009; Bunderston & Thompson, 2009). A plausible explanation for these results is
that individuals who are orientated to their work as a ‘calling’ are likely to have the innate talent
169
and competencies necessary to excel at the core functions of their jobs, enjoy what they do, and
understand their contributions to society. Such individuals will therefore inculcate and demonstrate
stronger attitudes and beliefs toward work in general and not to specific jobs. These findings can
also explain that while the concept of a ‘calling’ is a relatively new phenomenon, it is gaining
significant ground in the business psychology discipline.
Furthermore, this study reported that the meaning individuals make of their work is
positively correlated with their attitudes and beliefs toward their work in general. Earlier studies
concluded that individuals who made positive meaning of their work reported higher levels of
individual well-being and work-related outcomes (Davidson & Caddell, 1994; Wrzesniewski et al.,
1997; Duffy & Sedlacek, 2007; Peterson et al., 2009; Bunderston & Thompson, 2009). In this
regard, it can be explained that individuals who also report higher levels of well-being and work
related outcomes will also inculcate and demonstrate stronger attitudes and beliefs toward their
work.
Finally, the work ethic of the individuals participating in the study was reported as very
strong (M = 3.86) in comparison to other published samples in the U.S.A. that reported means
ranging from M = 2.03 to M = 3.89 (Gorman & Meriac, 2016; Miller et al., 2001; Pogson et al.,
2003; Woehr et al., 2007). As reported in the Global Competitiveness Index (2012 - 2017), work
ethic was the most problematic factor for doing business in Trinidad and Tobago. In spite of this,
the work ethic of the employees at the sample organization was very strong in comparison to work
ethic reports in the U.S.A. The first plausible explanation for these results is that the work ethic
measure in this study is a self-assessment and allow for inflation, while the measures in the Global
Competitiveness Index are an assessment by business leaders. A second plausible explanation is
that the sample for the study was taken from the private sector, and the work ethic of the individuals
170
in the public sector may be different to those in the private sector. A third plausible explanation is
that respondents may have had inflated perceptions of their work ethic, and the subjectivity of the
reporting method allowed these inflated perceptions to skew the results of the study.
Summary
In summary, over the last two decades, scholars and practitioners made deliberate efforts to
improve organizational performance by increasing their understanding of the influences on
generational differences in the workplace. However, their efforts seem to produce only inconsistent
results. A possible explanation for these inconsistent results is that the studies used different
instruments and were therefore operationalized differently, producing significantly different results.
Furthermore, the results of this study indicated that none of the demographic variables, including
generational cohort, were significant influencers of an individuals’ attitudes and beliefs toward their
work. In this regard, the researcher explained that individuals’ attitudes and beliefs toward their
work may be determined more by their psychological traits and attitudes than by any demographic
variables (Czerw & Grabowski, 2015).
Additionally, across all the nine key demographic variables and the two constructs used to
measure work orientation (presence of a calling and experience of a calling), the results of this
study indicated that presence of a calling was by far the most influential variable on work ethic. A
possible explanation for this result is that individuals who are orientated to their work as a ‘calling’
are likely to have the innate talent and competencies to excel at the core functions of their jobs,
enjoy what they do, and understand their contribution to society. Such individuals will therefore
inculcate and demonstrate stronger attitudes and beliefs toward work in general. Finally, in
comparison to some U.S. samples, the work ethic of the employees at the sample organization was
reported as very strong. These results conflict with reports from the Global Competitiveness Index
171
that, during the period 2012 – 2017, work ethic had become the most problematic factor for doing
business in T&T. The first plausible explanation is that the measure in this study is a self-
assessment and may allow for inflation, while the measure in the GCI is an assessment by business
leaders. Another plausible explanation for these conflicting results is that the sample for the study
was taken from the private sector, and the work ethic of individuals in the T&T public sector may
be different to those of the private sector.
Some findings identified in this study have both theoretical and practical implications that
can address how employees are orientated to their work and their attitudes and beliefs toward their
work in general. These implications are discussed in the next section.
Implications
Prior to diving into the specific implications for this research, it is important to revisit the
influence of the work ethic of a country’s working population on its economic climate. In a
turbulent economic environment, the work ethic of a country’s working population is economically
and socially significant (Ali, 2013). While the work ethic may not always explain the economic ills
of a society, it does differentiate those with the leading economies from those with the lagging
economies (Ali, 2013). A Gallup Poll (2012) reported the work culture of the U.S. employees and
managers, stating that they were engaged in their work and viewed hard work as an essential
ingredient for success (Yu, Harter, & Agrawal, 2013). This may be one plausible explanation of
how the U.S.A. recovered from the 2008 economic crisis (Ali, 2013). Similarly, in contrast to other
European countries experiencing economic turmoil, Germany was able to inculcate a work culture
of productivity and engagement, hence allowing for economic revival and its emergence as the
largest national economy in Europe (Ali, 2013).

172
A plethora of research has been conducted to examine the relevance of an individual’s work
ethic and work orientation to the work environment. The prevalent message that emerged from the
literature is that individuals who are oriented to their work as a ‘calling’ have demonstrated better
work related outcomes (Davidson & Caddell, 1994; Wrzesniewski et al., 1997; Duffy & Sedlacek,
2007; Peterson et al., 2009; Bunderston & Thompson, 2009). Additionally, a number of scholars
have examined work ethic across generational cohorts in a number of different settings. No
consistent message emerged from the literature. Some concluded that significant differences
existed, while others concluded that little differences existed. Others rejected the existence of any
differences in work ethic whatsoever across generational cohorts. However, hard work and delay of
gratification are two of seven work ethic dimensions that are consistent across both developed and
developing nations.
To address the problem discussed in Chapter 1, the findings of this study focused on both
theoretical and practical implications that will urge organization leaders to design and implement
recruitment, selection, motivation, and retention programs in the T&T work environment. The
researcher also hopes that the findings of the study will inspire the establishment of career guidance
programs within T&T high school curricula to possibly assist with the recovery of the threatened
T&T economy.
Implications for Theory
The results of this study have three theoretical implications for understanding how T&T
generational cohorts are oriented to their work and how it influences their attitudes and beliefs
towards their work in general. The first theoretical objective of this study was to examine the
influence of an individual’s orientation to his/her work as a presence of calling and/or an experience
of a calling, on his/her attitudes and beliefs toward his/her work in general. The results reported
173
that individuals’ orientation to their work only as a presence of a calling significantly influences
their attitudes and beliefs toward their work. This study therefore extends the current literature and
theoretical conceptualization of work ethic as it provides a new insight that explains presence of a
calling as a major and significant contributor to work ethic.
The second theoretical objective of this study was to examine generational differences in
individuals’ attitudes and beliefs toward their work and how they are oriented to their work in T&T,
a developing nation. The results of this study reported no generational differences in individuals’
attitudes and beliefs toward their work and how they are oriented to their work in a developing
nation. This study extends the current literature and theoretical conceptualization of work ethic and
generational cohorts. It provides some evidence that explains that generational differences do not
appear to be influencers of work ethic in T&T, a developing nation.
The third theoretical objective of this study was to examine differences across key
demographic variables such (industry, education, position, gender, tenure, ethnicity, and religion) in
how individuals are oriented to their work, and in their attitudes and beliefs toward their work in
general. The results of this study indicated no differences across key demographic variables
(industry, education, position, gender, tenure, ethnicity, and religion) in how individuals are
oriented to their work or in their attitudes and beliefs toward their work. This study extends the
current literature and theoretical conceptualization of work ethic and work orientation. It provides
evidence to explain that, similar to generational cohorts, these key demographic variables (industry,
education, position, gender, tenure, ethnicity, and religion) may not be influencers of work ethic.
Implications for Practice
The findings of this study, in context with past research, also have significant practical
implications to the work ethic of the T&T work environment. Taken as a whole, the results of this
174
study indicated that individuals who are oriented to their work as a presence of a calling inculcated
and demonstrated stronger attitudes and beliefs toward their work in general. These results clearly
demonstrated that of all the variables examined in this study (work orientation – presence of a
calling and experience of a calling, generational cohort, industry, education, gender, position,
tenure, income, religion, and ethnicity), presence of a calling has the greatest and most statistically
significant influence on an individual’s attitudes and beliefs towards his/her work.
These results are encouraging as they will provide organizational leaders with a deeper
understanding of how their employees’ orientation to their work influences their attitudes and
beliefs toward their work in general. In this regard, the first and most obvious implication is that
organizational leaders in the T&T work environment should concentrate on developing and
implementing recruitment, selection, motivation, and retention programs designed to identify and
guide employees with a presence of a calling.
Additionally, it should also be enlightening for employees as it will introduce them to the
concept of ‘calling’ and encourage them to engage in finding and living their ‘calling’ to ensure a
better quality of life. Therefore, the second implication is that organizational leaders develop
programs to guide and coach employees to find their ‘calling.’ Engaging in these initiatives should
result in a larger percentage of high-performing, engaged employees. This will reduce the
organization’s turnover rate, hence increasing its levels of productivity and overall profitability.
Thirdly, in spite of the conflicting perspectives of earlier studies that examined individuals’
attitudes and beliefs towards their work across generational cohorts, the results of this study
reported that individuals’ attitudes and beliefs towards their work were no different across the
generations. In this regard, scholars and practitioners in the T&T work environment, can focus on
175
identifying other factors, such as psychological traits, that may have a more profound influence on
individuals’ attitudes and beliefs towards their work.
Fourthly, the insignificant results reported on individuals’ attitudes and beliefs towards their
work and how they are oriented to their work across generations should also assist in alleviating
some of the conflicting perspectives that currently prevail among the generational cohorts in the
T&T work environment. This will increase the overall performance of the individual, team, and
organization, ultimately increasing the profitability of the organization.
Fifthly, the concept of ‘calling’ should be incorporated into high schools career guidance
curricula. It is critically important that the concept of ‘calling’ be introduced to high school
students to enable them to select the appropriate course of study that will prepare each of them to
pursue their ‘calling.’ This approach will more efficiently prepare the high school students to enter
the world of work as high-performing, engaged employees. This will positively influence both their
overall well-being and the performance of the organization.
Limitations
Although measures were taken to ensure an empirically solid study, two sampling
limitations, six instrumental limitations, and one methodological limitation were identified. The
first and most significant sampling limitation was the scope of the study, which was restricted to the
sample organization. The participants may not have been a representative sample of the individuals
in the T&T work environment; hence, the results cannot be generalized beyond the stated
population. The second sampling limitation was the initial sample of the Baby Boomers (n=19),
which was much smaller than what was calculated for statistical power (n=84). Furthermore, it was
not a representative sample of the Baby Boomer population in the sample organization. Therefore,
176
it was not sufficient to make conclusions that could be applied to all the Baby Boomers in the
sample organization, or all the Baby Boomers in the T&T work environment.
Six limitations were identified with respect to the instruments used for the study. Firstly, the
instrument used to measure work ethic was operationalized as a uni-dimensional measurement scale
in spite of the fact that it was designed as a multi-dimensional scale. This approach prohibited the
comparisons of the different dimensions, which may have limited the results of the study.
Secondly, the theories and instruments used to form the theoretical framework were developed from
studies conducted in the U.S.A. and other developed nations, and were also fairly limited.
However, during the Confirmatory Factor Analyses process conducted, nine of the 28 items on the
MWEP-SF measurement scale, four of the 12 items on the CVQ measurement scale, and three of
the nine items on the MCM were identified as problematic for the Trinidad and Tobago sample
used in this study. All 16 items were therefore removed from the analysis. The unique history and
evolution of the T&T work environment may have influenced the work culture of its working
population, thereby limiting the results of the study.
Thirdly, the self-report measures used to collect the data could have inflated the correlations
found among the variables in the study that may have resulted from common method variance.
Fourthly, the use of self-report measures may have limited the participants from reporting their true
feelings, perceptions, and beliefs, as they may have been influenced by what is considered socially
desirable behavior. Fifthly, it also limited the researcher from knowing the extent to which the
participants’ responses were truthful. Sixthly, varying perspectives exist within the generational
theory literature on the categorization of generations and the ability to predict each generation’s
beliefs and behaviors. Additionally, the generational theories were developed from a North

177
American perspective, and while their use in this study was justifiable, it may have also presented
some limitations. These instrumental limitations could affect the validity of the study.
The body of literature on generational theory has varying perspectives, particularly with
respect to the validity of the categorization of generations and the ability to predict the generations’
behaviors and beliefs. Some generational theorists articulated their concerns over changes in the
work attitudes and beliefs of Generational Xers and Yers, but others are optimistic, describing the
Generation Yers as “a good news revolution” (Howe & Strauss, 2000, p. 7).
One limitation was identified with regards to the methodological approach. The quantitative
methodological approach that was utilized hindered the researcher from fully exploring in depth
what the participants meant by their responses. This may have impacted the validity of the study.
Recommendations for Future Research
Eight recommendations are presented for further research based on the results and the
limitations of this study. Over the last 40 years, the T&T economy has continued to be volatile, in
spite of T&T being considered one of the wealthiest countries in the Caribbean. Notwithstanding
this, the work ethic of its working population seems to have deteriorated significantly. In this
regard, the first recommendation suggests that future studies utilize a qualitative or mixed method
approach. This is due to the fact that no other empirical studies were conducted on work ethic and
work orientation in the T&T work environment. The quantitative methodological approach seemed
to have hindered the development of a deeper, richer understanding of how work orientation
predicted work ethic in the T&T work environment. The qualitative approach will enable the
researcher to delve deeper into the views and perspectives of members of the T&T working
population’s attitudes and behaviors towards their work.
178
Secondly, it is recommended that findings from qualitative studies be used to design valid
and reliable quantitative instruments to measure work ethic and work orientation specific to the
population of the T&T work environment, given its unique history. .
Thirdly, it is recommended for this study to be replicated using a sample from the T&T
public sector. In comparison to the work ethic of the U.S. sample, the work ethic of the respondents
in this study, who work in the private sector, appear to be very strong. However, the Global
Competitiveness Index, over the period 2012 – 2017, reported a significant decline of the work
ethic of the T&T working population. These results suggest that differences in work ethic may
exist across the private and public sectors in the T&T work environment and should be examined.
Replicating the study in the public sector will provide scholars and practitioners with a deeper
understanding of the work ethic across the T&T working population. It will also provide scholars
and practitioners with the opportunity to explore the interactive role of work orientation and work
ethic across the entire T&T work environment.
The fourth recommendation for this study is, when replicating the study, the two variables in
the CVQ measurement scale, presence of a calling and search for a calling, be used and the MCM
measurement scale that examined experience of a calling be removed. Comparing and contrasting
the work ethic of the individuals who were oriented to their work as a presence of a calling as
opposed to those who were searching for a calling may produce findings that are enlightening to
organizational decision makers.
The fifth recommendation is that, when replicating the study, consideration be given to
operationalize the MWEP-SF as a multi-dimensional instrument. While the measurement scale was
originally conceptualized and operationalized as a multi-dimensional measurement scale, it was
179
operationalized as uni-dimensional in this study. In operationalizing the measurement scale as
multi-dimensional, significant differences may be identified across the dimensions.
Sixthly, it is recommended for this study to be replicated using a larger Baby Boomer
sample size. Given that only 19 Baby Boomers participated in the study, the sample was neither
large enough to provide the statistical power needed for the study nor was it representative of the
population of Baby Boomers in the sample industries. It is important for this study to be replicated
as soon as possible, because the official retirement age in T&T is 60 years. Based on the definition
used in this study for Baby Boomers (born between 1940 and 1959), it is expected that most of
them will be exiting the workforce by December 2019. If differences are identified across the
generational cohorts, it will be crucial for researchers to gain a deeper insight into the positive
attributes that contributed to the Baby Boomers’ work ethic. This insight will help to develop
programs to inculcate these attributes into the Generation Xers and Yers’ work environment.
It is also recommended that consideration be given to replicate this study using a more
contemporary theoretical framework for work ethic. Max Weber’s (1958) work ethic theory was
utilized for the theoretical framework for this study. Given the evolution of the work environment,
more specifically with the influence of technology and social media, the development of a more
contemporary theoretical framework for work ethic is recommended. This framework should be
more consistent with the current work environment.
Finally, it is recommended that this study be replicated to investigate how individuals’ work
ethic is influenced by their personal constructs, such as personality traits (punitive, instrumental,
and autotelic), as opposed to their year of birth or any other demographic variable. The results of
this study indicated that individuals’ orientation to their work significantly influence their work
ethic. However, demographic variables were not seen to significantly impact work ethic.
180
Additionally, the responses to the second open-ended question were aligned to the Czerw and
Grabowski (2015) personality traits. In this regard, the researcher is interested in exploring, in
more detail, the influence of individuals’ personal constructs on their work ethic.
Conclusion
During the period 2013 – 2016, work ethic had become the most problematic factor for
doing business in Trinidad &Tobago (Global Competitiveness Index Report, 2012-2017). These
discouraging results have been a major concern for both scholars and practitioners (Bissessar, 2012;
Charles, 2016). An in-depth review of the existing literature revealed no evidence of any empirical
studies conducted to provide guidance on this phenomenon. This study, novel to the business
psychology field, was designed to bridge the gap by examining the differences in individuals’
attitudes and beliefs towards their work, and also how they are oriented to their work, across three
generational cohorts and three industries in a major multi-national, multi-industry corporation
located in T&T.
The results of the first research question reported no generational differences in individuals’
attitudes and beliefs towards their work and how they are oriented to their work. The results of the
second research question reported no statistical evidence to support that the ways in which
individuals made meaning of their work predicted their attitudes and beliefs towards their work
across the three generational cohorts of the three industries at the sample organization. In spite of
these statistically insignificant results, it was determined that there were strong statistically
significant evidence to support the notion that individuals at the sample organization who made
meaning of their work as a presence of a calling inculcated stronger attitudes and beliefs towards
their work in general.
181
Three theoretical implications have emerged from the findings of this study, which extends
the existing literature and theoretical understanding of: 1) work ethic, work orientation, and
generational cohorts in general and in a developing nation; 2) the influence of having a ‘calling’ on
an employee’s work ethic; and 3) the influence of age cohorts (and other demographic variables) on
work orientation and work ethic.
Furthermore, three practical implications have emerged from the significant results of this
study. Two of the three implications will guide organizational leaders in the T&T work
environment. The first, to concentrate on developing and implementing recruitment, selection,
motivation, and retention programs that will identify employees who are oriented to their work as a
‘calling.’ The second, to focus on identifying other significant factors (other than generational
differences) that have a profound influence on their employees’ attitudes and beliefs towards work.
Taken together, these suggestions should alleviate some of the conflicting perspectives that
currently prevail among the generational cohorts in the T&T work environment. They should also
increase the performance and overall well-being of the individuals, teams, and organizations in the
T&T work environment. This will increase the organizations’ productivity and profitability,
ultimately revitalizing the T&T economy.
The third practical implication from the results of this study is that the concept of
‘calling’ should be incorporated in the high school career guidance curriculum to enable students to
select appropriate courses that will prepare them to pursue their ‘calling.’ This approach will
nurture and inculcate stronger work ethic in the young adults entering the T&T work environment,
hence improving their overall well-being and work-related outcomes.
Employees make the single largest contribution to the success of an organization. In this
regard, the researcher is urging organizational leaders to seriously consider investing in hiring

182
employees with a strong work ‘callings’ and also to assist others in finding their ‘calling.’ The
opportunity gained from engaging in this initiative will definitely supersede the opportunity cost of
not engaging in it.
183
References
Albee, G. W. (1977). The Protestant ethic, sex, and psychopathology. American Psychologist, 32,
150-151.
Ali, A. J. (2013). Rethinking work ethics. International Journal of Commerce and Management,
23(3), 180-183. doi:10.1108/IJCoMa-06-2013-0053.
Ali, A. J., & Azim, A. (1995). Work ethic and loyalty in Canada. Journal of Social Psychology,
135, 31-37.
Allan, B. A., & Duffy, R. D. (2014). Examining moderators of signature strengths use well-being:
Calling and signature strengths level. Journal of Happiness Studies: An Interdisciplinary
Forum on Subjective Well-Being, 15(2), 323-337.
Allerton, H. (1994). Working Life: Work versus family. Training and Development Journal, 48, 72-
80.
Arbnor, I., & Bjerke, B. (1997). Methodology for creating business knowledge (2nd ed.). Thousand
Oaks, CA: Sage Publication, Inc.
Arnett, J. J. (2000). High hopes in a grim world: Emerging adults’ views of their futures and of
Generation X. Youth & Society, 31, 267-286.
Artana, D., Auguste, S., Moya, R., Sookram , S., & Watson, P. (2007). Trinidad & Tobago:
Economic Growth in a Dual Economy. An Inter-American Development Bank (IDB)
Research Project. Retrieved December 30, 2017, from
https://sta.uwi.edu/salises/pubs/workingpapers/16.pdf
Ashforth, B. E., & Mael, F. (1989). Social identity theory and the organization. Academy of
Management Review, 14(1), 20-31. doi:10.2307/258189
184
Babbie, E. (2013). In The Practice of Social Research (13th ed.). Belmont, CA: Wadsworth,
Cengage Learning.
Bandura, A. (1989). Human agency in social cognitive theory. American Psychologist, 44, 1175-
1184.
Barnard, C. A. (1998). Work values of generation X students. Doctoral Disstertation. ProQuest
Dissertations & Theses Global.
Baumeister, R. F. (1991). Work, work, work, work. Meaning of life. New York, NY: The Guilford
Press.
Beit-Hallahmi, B. (1979). Personal and social components of the Protestant ethic. Journal of Social
Psychology, 109, 263-267.
Bellah, R. N., Madsen, R., Sullivan, W. M., Swidler, A., & Tipton, S. M. (1985). Habits of the
heart. Berkeley, CA: University of California Press.
Berg, B. L., & Lune , H. (2012). Qualitative research methods for the social science. Boston, MA:
Pearson.
Berg, J. M., Grant, A. M., & Johnson , Y. (2010). When calling are calling: Crafting work and
leisure in pursuit of unanswered occupational callings. Organization Science, 21, 973-994.
Bickerton, G. R., Miner, M. H., Dowson, M., & Griffin, B. (2014). Spiritual resources and work
engagement among religious workers: A three wave longitudinal study. Journal of
Occupational and Organizational Psychology, 82(2), 370-391.
Bissessar, A. M. (2012, February 5). Poor work ethic in T&T reaches Crisis Proportion. Trinidad
and Tobago Guardian. Retrieved June 12, 2017, from
http://www.guardian.co.tt/columnist/2012-02-05/poor-work-ethic-tt-reaches-crisis-
proportion
185
Blood, M. R. (1969). Work values and job satisfaction. Journal of Applied Psychology, 53, 456-
459.
Bono, J. E., & Judge, T. A. (2003). Self-concordance at work: Toward understanding the
motivational effects of transformational leaders. Academy of Management Journal, 46(5),
554-571.
Brett Lockard, C., & Wolf, M. (2012). Employment outlook: 2010-2020. Monthly Labor Review,
84-108. Retrieved May 7, 2017, from Bureau of Labor Statistics:
https://www.bls.gov/opub/mlr/2012/01/art5full.pdf
Brief, A., & Nord, W. (1990). Meanings of occupational work. Lexington, MA: Lexington Books.
Brown, T. A. (2015). Confirmatory Factor Analysis for Applied Research (2nd ed.). New York,
NY: Guilford Publications.
Buchanan, E. A., & Hvizdak, E. E. (2009). Online survey tools: Ethical and methodological
concerns of human research ethics committees. Journal of Empirical Research on Human
Research Ethics, 37- 48.
Buchholz, R. A. (1978). An empirical study of contemporary beliefs about work in American
society. Journal of Applied Psychology, 53, 219-277.
Bunderston, J. S., & Thompson, J. A. (2009). The call of the wild: Zookeeper, callings, and the dual
edges of deeply meaningful work. Administrative Science Quarterly, 54, 32-57.
Burke, R. J. (1994). Generation X: Measures, sex, and age differences. Psychological Reports, 74,
555-562.
Cameron, P. (1969). Attitudes toward capitalism among Protestants and Catholics. Journal for the
Scientific Study of Religion, 8, 165-166.
186
Cardador, M. T., Pratt, M. G., & Dane, E. I. (2006). Do callings matter in medicine?: The influence
of callings versus careers on domain specific work outcomes. Paper presented at the
Positive Organizational Scholarship Conference.
Carver, C. S. (1989). How should multifaceted personality constructs be tested? Journal of
Personality and Social Psychology, 56, 577-585.
Central Statistical Office. (2011). Trinidad and Tobago 2011 Population and Housing Census
Demographic Report. Government of the Republic of Trinidad and Tobago Ministry of
Planning and Sustainable Development. Port-of-Spain: Central Statistical Office. Retrieved
April 15, 2019, from
http://www.tt.undp.org/content/trinidad_tobago/en/home/library/crisis_prevention_and_reco
very/publication_1.html
Charles, K. (2016, January 21). Improving worker productivity and work ethic in a recession.
Trinidad and Tobago Guardian. Retrieved June 11, 2017, from
guardian.co.tt/custompages/TheTrinidadGuardian/login.aspx#folio=98
Cherrington, D. J. (1980). The work ethic: Working values and values that work. New York, NY:
Amacom.
Christopher, A. N., Zabel, K. L., & Jones, J. R. (2008a). Conscientiousness and work ethic
ideology: A facet-level analysis. Journal of Individual Differences, 29, 189-198.
doi:10.1027/1614-0001.29.4.189.
Christopher, A. N., Zabel, K. L., Jones, J. R., & Marek, P. (2008). Protestant ethic ideology: Its
multifaceted relationships with just world beliefs, social dominance orientation, and right
wing-authoritarianism. Personality and Individual Differences, 45, 473-477.
187
Clegg, S. R., Hardy, C., & Nord, W. R. (2002). Handbook of organization studies. Thousand Oaks,
CA: Sage Publications.
Codrington, G. (2004). Mind the Gap: Generations @ work. Journal for Convergence, 5(4), 12-17.
Cohen, J. (1992a). Quantitative methods in Psychology: A power primer. Psychological Bulletin,
112(1), 155-159. doi:10.1037/0033-2909. 112.1.155
Cohen, J. (1992b). Statistical power analysis. Current Directions in Psychological Science, 1(3),
98–101. doi:10.1111/1467-8721.ep10768783
Cohen, J. (2002). I/Os in the know offer insights on Generation X workers. Monitor on Psychology,
33, 66-67.
Competing in a global setting – poor work ethic. (2016, January 7). Retrieved November 25, 2017,
from Trinidad and Tobago Chamber of Industry and Commerce:
https://www.facebook.com/TTCIC/posts/competing-in-a-global-setting-poor-work-ethica-
few-weeks-ago-the-tt-chamber-prov/1123003207717815/
Corbo, S. A. (1997). The X-er files. Hospitals and Health Networks, 71, 58-60.
Costanza, D. P., Badger, J. M., Fraser, R. L., Severt, J. B., & Gade, P. A. (2012). Generational
difference in work-related attitudes: A meta-analysis. Journal of Business Psychology, 27,
375-394. doi:10.1007/s10869-012-9259-4
Crespi, I. (1963). Occupational status and religion. American Sociological Review, 28, 131.
Creswell, J. W. (2014). A Concise Introduction to Mixed Method Research. Thousand Oaks, CA:
Sage Publications, Inc.
Czerw, A. (2013). Co ludzie myślą o pracy zawodowej? Konstrukcja metody diagnozującej
postawy wobec pracy [What do people think about work? The construction of attitudes to
work diagnosing methods]. Psychologia Społeczna, 8(2), 219–233.
188
Czerw, A., & Grabowski, D. (2015). Work attitude and work ethic as predictors of work
engagement among polish employees. Polish Psychological Bulletin, 46(4), 503-512.
Dabydeen, D. (1995, Summer). A passage from India. Caribbean Beat Magazine, 14. Retrieved
from https://www.caribbean-beat.com/issue-14/passage-india#axzz5uWyFA75t
Davidson, J. C., & Caddell, D. P. (1994). Religion and the meaning of work. Journal for the
Scientific Study of Religion, 33, 135-147.
Davis, J. B., Pawlowski, S. D., & Houston, A. (2006). Work commitments of Baby Boomers and
Gen Xers in the IT profession: Generational differences or myth? Journal of Computer
Information Systems, 46, 43-49.
Dawn, S. (2004). From one generation to the next: there is plenty of potential for misunderstanding
and communication breakdown between baby boomers and the youngsters coming up
behind them. NZ Business, 18, 40-41.
Demas, W. G. (1983). The Imperatives of Adjustment Draft Development Plan 1983 - 1986. Report
of the Task Force appointed by Cabinet to formulate a multi-sectoral development plan for
the Republic of Trinidad and Tobago, Caribbean Development Bank.
Dencker, J. C., Joshi, A., & Martocchio, J. J. (2008). Towards a theoretical framework linking
generational memories to workplace attitudes and behaviors. Human Resource Management
Review, 18(3), 180-187. doi:10.1016/jhrmr.2008.07.007
Desjardins, F. J. (2010). Theoretical Framework. Retrieved August 12, 2017, from
https://www.youtube.com/watch?v=EcnufgQzMjc.
Diener, E., & Seligman, M. E. (2004). Beyond money: Towards an economy of well-being.
Psychological Science in the Public Interest, 5(1), 1-31. doi:10.1111/j.0963-
7214.2004.00501001.x.
189
Dik, B. J., & Duffy, R. D. (2009). Calling and vocation at work: Definitions and prospects for
research and practice. The Counseling Psychologist, 37(3), 424-450.
doi:10.1177/0011000008316430.
Dik, B. J., Eldridge, B. M., Steger, M. F., & Duffy, R. D. (2012). Development and validation of
the Calling and Vocation Questionnaire (CVQ) and Brief Calling Scale (BCS). Journal of
Career Assessment, 20(3), 242-263.
Dik, B. J., Sargent, A. M., & Steger, M. F. (2008). Career development striving: Assessing goals
and motivation in career decision-making and planning. Journal of Career Development, 35,
23-41. doi:10.1177/0894845308317934
DiStefano, C., Zhu, M., & Mîndrilă, D. (2009). Understanding and Using Factor Scores:
Considerations for the Applied Researcher. Practical Assessment Research & Evaluation,
14(20), 1-11. Retrieved from https://pareonline.net/getvn.asp?v=14&n=20
Dobrow, S. R. (2004). Extreme subjective career success: A new integrated view of having a
Calling. Academy of Management Proceedings, B1- B6.
Dobrow, S. R. (2007). The development of calling: A longitudinal study of musicians. Best Paper
Proceedings of the Academy of Management Conference. Philadelphia.
Dobrow, S. R., & Tosti-Kharas, J. (2011). Calling: The development of a scale measure. Personnel
Psychology, 64, 1001 – 1049.
Duffy, R. D., & Dik, B. J. (2013a). Research on calling: What have we learned and where are we
going? Journal of Vocational Behavior, 83, 428-436.
Duffy, R. D., & Sedlacek, W. E. (2007). The presence of and search for a calling. Connections to
career development. Journal of Vocational Behavior, 70, 590-601.
190
Duffy, R. D., & Sedlacek, W. E. (2010). The salience of a career calling among college students:
Exploring group differences and links to religiousness, life meaning, and life satisfaction.
The Career Development Quarterly, 59, 27-41.
Duffy, R. D., Allan, B. A., & Bott, E. M. (2012). Calling and Life Satisfaction Among
Undergraduate Students: Investigating Mediators and Moderators. Journal of Happiness
Studies, 13, 469–479.
Duffy, R. D., Allan, B. A., & Dik, B. J. (2011a). The presence of a calling and academic
satisfaction: Examining potential mediators. Journal of Vocational Behavior, 79(1), 74-80.
Duffy, R. D., Allan, B. A., Autin, K. L., & Bott, E. M. (2013b). Calling and life satisfaction. It’s not
about having it, it’s about living it. Journal of Counseling Psychology, 60, 42-52.
Duffy, R. D., Autin, K. L., Allan, B. A., & Douglass, R. P. (2015). Assessing work as a calling: An
evaluation of instruments and practice recommendations. Journal of Career Assessment,
23(3), 351-366.
Duffy, R. D., Bott, E. M., Allan, B. A., Torrey, C. L., & Dik, B. J. (2012b). Perceiving a calling,
living a calling, and job satisfaction. Testing a moderated, multiple mediator model. Journal
of Counselling Psychology, 59, 50 -59.
Duffy, R. D., Dik, B. J., & Steger, M. F. (2011b). Calling and work-related outcomes: Career
commitment as a mediator. Journal of Vocational Behavior, 78, 210-218.
Eisenberger, R. (1989). Blue Monday: The Loss of the Work Ethic in America. New York, NY.:
Paragon House .
Elangovan, A. R., Pinder, C. C., & McLean, M. (2010). Calling and organizational behavior.
Journal of Vocational Behavior, 76, 428-440. doi:10.1016/j.jvb.2009.10.009
Fajana, O. (2006). Human resource management: An Introduction. Lagos: Labofin and Company.
191
Featherman, D. L. (1971). The socioeconomic achievement of white religio-ethnic subgroups:
Social and psychological explanations. American Sociologist Review, 36, 207-222.
Field, A. (2009). Discovering statistics using SPSS (3rd ed.). London: SAGE publications Ltd.
Franklin, B. (1732). Poor Richard's Almanac.
Furnham, A. (1984). The Protestant work ethic: A review of the psychological literature. European
Journal of Social Psychology, 14, 87-104.
Furnham, A. (1987). Predicting Protestant work ethic beliefs. European Journal of Personality, 1,
93-106.
Furnham, A. (1990). A content, correlational, and factor analytic study of seven questionnaire
measures of the Protestant work ethic. Human Relations, 43, 383-399.
Ganster, D. (1980). Individual differences and task design: A laboratory experiment.
Organizational Behavior and Human Performance, 26, 557-565.
Ganster, D. (1981). Protestant ethic and performance: A re-examination. Psychological Reports, 48,
335-338.
Giorgi, L., & Marsh, C. (1990). The Protestant work ethic as a cultural phenomenon. European
Journal of Social Psychology, 20, 499-517.
Glass, A. (2007). Understanding generational differences for competitive success. Industrial and
Commercial Training, 39(2), 98-103.
Glenn, N. D., & Hyland, R. (1967). Religious preference and worldly success: Some evidence from
national surveys. American Sociological Review, 32, 73-85.
Goldstein, B., & Eichhorn, R. (1961). The changing protestant ethic. Rural patterns in health, work
and leisure. American Sociological Review, 26, 557-565.
192
Gorman, C. A., & Meriac, J. P. (2016). Examining the work ethic of correctional officers using a
short form of the multidimensional work ethic profile. The Prison Journal, 96(2), 258-278.
Granello, D. H., & Wheaton, J. E. (2004). Online data collection: Strategies for research. Journal of
Counseling & Development, 82(4), 387-393.
Greeley, A. (1964). The Protestant ethic: Time for a moratorium. Sociological Analysis, 25, 20-33.
Gupta, M., & Chen, Y. (2010). Theory and Use of the EM Algorithm. Foundations and Trends in
Signal Processing, 4(3), 223–296. doi:10.1561/2000000034
Hackman, J. R., & Oldham, G. R. (1980). Work design. Reading, MA: Addison-Wesley.
Hagmaier, T., & Abele, A. E. (2012). The multidimensionality of calling: Conceptualization,
measurement and a bicultural perspective. Journal of Vocational Behavior, 81, 39 -51.
Hair, J. F., Black, W. C., Babin, B. J., & Anderson, R. E. (2010). Multivariate data analysis: A
Global perspective (Vol. 7). Upper Saddle River: Pearson.
Hall, D. T., & Chandler, D. E. (2005). Psychological success: When a career is a calling. Journal of
Organizational Behavior, 26, 155-176.
Hammond , P., & Williams, R. (1976). The Protestant ethic thesis: A social psychological
assessment. Social Forces, 54, 579-589.
Hankin, H. (2004). The new workforce: Five sweeping trends that will shape your company’s
future. New York, NY: American Management Association.
Hansen, J. C., & Leuty, M. E. (2012). Work values across generations. Journal of Career
Assessment, 20(1), 34-52.
Harpaz, I. (1990). The meaning of work in Israel, its nature and consequences. New York, NY:
Prager.
193
Harpaz, I. (1999). Work values in Israel: Stability and change over time. Monthly Labor Review,
122, 46-50.
Heppner, P. P., & Heppner, M. J. (2004). Writing and Publishing Your Thesis, Dissertation &
Research. A guide for students in the helping professions. Belmont, CA: Thomson
Brooks/Cole.
Hesselbein, F., Goldsmith, M., & Beckhard, R. (1997). The organization of the future. San
Francisco, CA: Jossey-Bass.
Hesselbein, F., Goldsmith, M., & Beckhard, R. (1996). The leader of the future. San Francisco, CA:
Jossey-Bass.
Hirschi, A. (2012). Callings and work engagement: Moderated mediation model of work
meaningfulness, occupational identity, and occupational self-efficacy. Journal of
Counseling Psychology, 59, 479-485.
Historical Facts on the Petroleum Industry of T&T. (n.d.). Retrieved June 19, 2017, from
Government of the Republic of Trinidad and Tobago Ministry of Energy and Energy
Affairs: http://www.energy.gov.tt/historical-facts-petroleum/
Historical Settings of T & T. (2003, July 23). Retrieved June 19, 2017, from Trinidad and Tobago
News : http://www.trinidadandtobagonews.com/historical.html
Hite, D. M., Daspit, J. J., & Dong, X. (2015). Examining the influence of transculturation on work
ethic in the United States. Cross Cultural Management, 22(1), 145-162. doi:10.1108/CCM-
12-2013-0190
Ho, R., & Lloyd, J. I. (1984). Development of an Australian work ethic scale. Australian
Psychologist, 19, 321-332.
194
Horvath, M. (2015). Predicting work outcomes from religiosity and perceived calling. The Career
Development Quarterly, 63(2), 141-155.
Howard, A. (1982). Leadership in a declining work ethic. California Management Review, 24(4),
33-46.
Howe, N., & Strauss, W. (2000). Millennials Rising: The Next Great Generation. New York, NY:
Vintage Books.
Howe, N., & Strauss, W. (2007). The next 20 years: How customers and workforce attitudes will
evolve. Harvard Business Review, 85(7/8), 42-52.
Hu, L., & Bentler, P. (1999). Cutoff criteria for fit indexes in covariance structure analysis.
Conventional criteria versus new alternatives. Structural Equation Modeling: A
Multidisciplinary Journal, 6(1), 1-55. doi:10.1080/10705519909540118
Huberts, L. W., Kaptein, M., & Lasthuizen, K. (2007). A study of the impact of three leadership
styles on integrity violation committed by police officers. Policing: The International
Journal of Police Strategies and Management, 30(4), 586-607.
Jobe, L. L. (2014). Generational differences in work ethic among 3 generations of registered nurses.
Journal of Nursing Administration, 44, 303-308. doi:10.1097/NNA.0000000000000071*
Jokhan, M. (2017). Exploring the “Barrel Children” Cycle: Parent-Child Separation Due to
Migration. (Childhood Education International ) Retrieved December 30, 2017, from
Childhood Explorer: https://www.childhoodexplorer.org/exploring-the-barrel-children-
cycle-parentchild-separation-due-to-migration
Jones, H. (1997). The Protestant Work Ethic: Weber’s model and the empirical literature. Human
Relations, 50, 757-778.
195
Kanungo, R. N. (1982). Measurement of job and work involvement. Journal of Applied Psychology,
67(3), 341-349.
Kaplan, H. R., & Tausky, C. (1974). The meaning of work among the hard-core unemployed.
Pacific Sociological Review, 17, 185-98.
Khosravi, J. Y. (2014). Generational differences in work-family balance: A quantitative and
qualitative assessment. Doctoral Dissertation. ProQuest Dissertations & Theses Global.
Kiiru-Weatherly, P. (2016). Multigenerational workforce: Relationship between generational
cohorts and employee engagement. Doctoral Dissertation. ProQuest Dissertations & Theses
Global.
Kim, H. C. (1977). The relationship of Protestant ethic beliefs and values to achievement. Journal
for the Scientific Study of Religion, 16, 255-262.
Kittleson, M. (1997). Determining effective follow-up of email surveys. American Journal of
Health Behavior, 21, 193-196.
Klebnikov, P. (1993). The Swedish disease. Forbes, pp. 78-80.
Koontz, H. (1961). The management theory jungle. The Journal of the Academy of Management,
4(3), 174-188.
Kuper, A., & Kuper, J. (1996). The Social Sciences Encyclopedia. London: Routledge, Taylor and
Francis Group.
Kupperschmidt, B. R. (2000). Multigenerational employees: Strategies for effective management.
Health Care Manager, 19(1), 65-76.
Lancaster, L. C., & Stillman, D. (2002). When generations collide: Who they are. Why they clash.
How to solve the generational puzzle at work. New York, NY: Harper Collins.
196
Lasch, C. (1979). The culture of Narcissism: American Life in an Age of Diminishing Expectations.
New York, NY: Harper & Row.
Laurie, B. (1979). "Nothing on Complusion": Lifestyles of Philadelphia Artisans, 1920-1950. In M.
Cantor, American Workingclass Culture: Explorations in American Labor and Social
History. Westport, CT: Greenwood Press.
Leedy, P. D., & Ormrod, J. E. (2001). Practical Research: Planning and Design (7th ed.). Upper
Saddle River, NJ: Merrill Prentice Hall.
Lenski, G. (1961). The religious factor: A sociological study of religious impact on politics,
economics, and family life. Garden City, NY: Doubleday.
Little, R. J. (1988). A Test of Missing Completely at Random for Multivariate Data with Missing
Values. Journal of the American Statistical Association, 83, 1198-1202.
Losyk, B. (1997). Generation X: What they think and what they plan to do. The Futurist, 31, 39-44.
Macky, K., Gardner, D., & Forsyth, S. (2008). Generational differences at work: Introduction and
overview. Journal of Managerial Psychology, 23 (8).
Malhotra , N. K., & Dash, S. (2011). Marketing Research an Applied Orientation. London: Pearson
Publishing.
Malloy, D. C. (2003). Understanding the nature of ethics and purposes of business health care and
law. The Sport We Want. Canadian Centre for Ethics in Sport, 59-79.
Mannheim, K. (1952). The problem of generations. In K. Mannheim, Essays on the sociology of
knowledge (pp. 276 – 322). London: Routledge.
Maslow, A. H. (1968). Toward a psychology of being. New York, NY: Van Nostrand Reinhold.
McClelland, D. C. (1961). The Achieving Society. Princeton, NJ: Van Nostrand.
197
McHoskey, J. W. (1994). Factor structure of the Protestant work ethic scale. Personality and
Individual Differences, 17, 49-52.
Meriac, J. P., & Gorman, C. A. (2016). Work ethic and work outcomes in an expanded criterion
domain. Journal of Business Psychology, Spring 2016, Spring. doi:10. 1007/s 10869-016-
9460-y
Meriac, J. P. (2012). Work ethic and academic performance: Predicting citizenship and
counterproductive behavior. Learning & Individual Differences, 22, 549 – 553.
doi:10.1016/j.lindif.2012.03.015
Meriac, J. P., Poling, T. L., & Woehr, D. J. (2009). Are there gender differences in work ethic? An
examination of the measurement equivalence of the multidimensional work ethic profile.
Personality and Individual Differences, 47, 209-213. doi:10.1016/j.paid.2009.03.001
Meriac, J. P., Thomas, A. L., & Milunski, M. (2015). Work ethic as a predictor of task persistence
and intensity. Learning and Individual Differences, 249-254. Retrieved from
http://dx.doi.org/10.1016/j.lindif.2014.11.06 1041-6080/
Meriac, J. P., Woehr, D. J., & Banister, C. (2010). Generational differences in work ethic: An
examination of measurement equivalence across three cohorts. Journal of Business and
Psychology, 25, 315-324. doi:10.1007/s10869-010-9164-7
Meriac, J. P., Woehr, D. J., Gorman, C. A., & Thomas, A. L. (2013). Development and validation
of a short form for the multidimensional work ethic profile. Journal of Vocational Behavior,
82, 155-164. doi:10.1016/j.jvb.2013.01.007
Merrens, M. R., & Garrett, J. B. (1975). The protestant ethic scale as a predictor of repetitive work
performance. Journal of Applied Psychology, 60, 125-127.
198
Miller, M. J., Woehr, D. J., & Hudspeth, N. (2001). The meaning and measurement of work ethic:
Construction and initial validation of a multidimensional inventory. Journal of Vocational
Behavior, 59, 1-39. doi:10.1006/jvbe.2001.1838
Minneti, J. (2016). Work Drive Matters: An Assessment of the relationship between law students'
work-related preferences and academic performance. Mitchell Hamline Law Review, 42(1),
150-184.
Mirels, H. L., & Garrett, J. B. (1971). The Protestant ethic as a personality variable. Journal of
Consulting and Clinical Psychology, 36, 40-44. doi:10.1037/h0030477
Mordkoff, T. (2016). The assumption(s) of normality. Retrieved from
http://www2.psychology.uiowa.edu/faculty/mordkoff/GradStats/part%201/I.07%20normal.p
df
Morse, N. L., & Weiss, R. S. (1955). The function and meaning of work and job. American
Sociological Review, 20, 191-8.
MOW International Research Team. (1987). The meaning of work. New York, NY: Academic
Press.
Neill, E. (2016, February 22). Delimitations and Limitations. Retrieved August 19, 2017, from
https://www.youtube.com/watch?v=78WpdSaZxSE&t=423s.
Noble, S. M., & Schewe, C. D. (2003). Cohort segmentation: An exploration of its validity. Journal
of Business Research, 56(12), 979 – 987. doi:10.1016/S0148-2963(02)00268-0
Nord, W., Brief, A., Atieh, J., & Doherty, E. (1990). Studying meaning of work: the case of work
values. In A. Brief, & W. Nord, Meaning of occupational work (pp. 21-64). Lexington, MA:
Lexington Books.
199
Osborne, J. W. (2013). Best Practices in Data Cleaning: A Complete Guide to Everything You Need
to do Before and After Collecting You Data. Thousand Oaks, CA: Sage Publication, Inc.
Osibanjo, A. O., Akinbode, J. O., Falola, H. O., & Oludayo, A. O. (2015). Work ethic and
employees' job performance. Journal of Leadership, Accountability and Ethics, 12(1), 107-
117.
Pallant, J. (2007). SPSS survival manual, a step by step guide to data analysis using SPSS for
windows (3rd ed.). Berkshire: Open University Press.
Parker, S. R. (1971). The future of work and leisure. London: MacGibbon and Kee.
Parkhurst, J. T., Fleisher, M. S., Skinner, C. H., Woehr, D. T., & Hawthorne-Embree, M. L. (2011).
Assignment choice, effort, and assignment completion: Does work ethic predict those who
choose higher-effort assignments? Learning and Individual Differences, 21, 575-579.
Parry, E., & Urwin, P. (2010). Generational differences in work values: A review of theory and
evidence. International Journal of Management Reviews, 13, 79-96. doi:10.1111/j.1468-
2370.2010.00285.x
Parten, M. (1966). Surveys, Polls, and Samples: Practical Procedures. New York, NY: Cooper
Square Publishers, Inc.
Patton, M. (2002). Qualitative Evaluation and Research Methods (3rd ed.). Thousand Oaks, CA:
Sage Publication Inc.
Peart, J. (2004). Time to bridge the generations. Journal of Newcastle, 16, 1-3. Retrieved June 10,
2017, from
https://tcsedsystem.idm.oclc.org/login?url=https://search.proquest.com/docview/3
Peterson, C., Park, N., Hall, N., & Seligman, M. E. (2009). Zest and work. Journal of
Organizational Behavior, 30, 161 – 172.
200
Pew Research Center. (2010). Millennials: A portrait of generation next. Retrieved June 16, 2017,
from http://www.pewsocialtrends.org/2010/02/24/millennials-confident-connected-open-to-
change/.
Pogson, C. E., Cober, A. B., Doverspike, D., & Rogers, J. R. (2003). Differences in self-reported
work ethic across three career stages. Journal of Vocational behavior, 62, 189-201.
doi:10.1016/S0001-8791(02)00044-1
Pojam, L. P. (2006). Ethics: Discovering right and wrong (5th ed.). Portland, OR: Wadsworth
Publishing Co.
Porter, G. (2004). Work, work ethic, work excess. Journal of Organizational Change Management,
17(5), 424-439. doi:10.1108/09534810410554461
Porter, G. (2010). Work ethic and ethical work: Distortions in the American Dream. Journal of
Business Ethics, 96, 535-550. doi:10.1007/s10551-010-0481-6
Praskova, A., Creed, P. A., & Hood, M. (2015). The development and initial validation of a career
calling scale for emerging adults. Journal of Career Assessment, 23(1), 91-106.
Pratt, M. G., & Ashforth, B. E. (2003). Fostering meaningfulness in working and at work. In K. S.
Cameron , J. E. Dutton, & R. E. Quinn , Positive organizational scholarship (pp. 309-327).
San Francisco, CA: Berrett-Koehler Publishers, Inc.
Premdas, R. (2007). Trinidad and Tobago Ethnic Conflict, Inequality and Public Sector
Governance. New York, NY: Palgrave Macmillan.
Rahim, A. (2004, July). National labour law profile: Trinidad and Tobago. Retrieved December 16,
2017, from International Labour Organization: http://www.ilo.org/ifpdial/information-
resources/national-labour-law-profiles/WCMS_158855/lang--en/index.htm
Ray, J. J. (1982). The Protestant ethic in Australia. Journal of Social Psychology, 116, 127-138.

201
Ray, N. M., & Tabor, S. W. (2003). Cyber surveys come of age. Marketing Research, Spring, 32-
37.
Real, K., Mitnick, K. D., & Maloney, W. F. (2010). More similar than different: Millennials in the
U.S. building trades. Journal of Business and Psychology, 25, 303-313.
doi:10.1080/00224545.1982.9924402
Reykowski, J. (1998). Belief systems and collective action: Changes in Poland from the
psychological perspective. Applied Psychology: An International Review, 47(1), 89-108.
Roberson, L. (1990). Functions of work meanings. In A. Brief, & W. Nord, Meanings of
occupational work (pp. 107-134). Lexington, MA: Lexington Books.
Rodgers, D. T. (1974). The work ethic in Industrial America 1850-1920. Chicago, IL: University of
Chicago Press.
Rogers, C. R. (1961). On becoming a person. Boston, MA: Houghton Mifflin.
Ros, M., Schwartz, S. H., & Surkiss, S. (1999). Basic individual values, work values, and the
meaning of work. Applied Psychology: An International Review, 48(1), 49-71.
Rosenberg, M. (1979). Conceiving the self. New York, NY: Basic Books.
Rosso, B. D., Dekas, K. H., & Wrzesniewski, A. (2010). On the meaning of work: A theoretical
integration and review. Research in Organizational Behavior, 30, 91-127.
doi:10.1016/j.riob.2010.09.001
Ryan, A. B. (2006). Post-Positivist Approaches to Research. In Researching and Writing your
thesis: a guide for postgraduate students (pp. 12-26). Kildare, Ireland: Maynooth Adult and
Community Education.
202
Ryan, J. C., & Tipu, S. A. (2016). An Empirical Alternative to Sidani and Thornberry’s (2009)
Current Arab Work Ethic: Examining the Multidimensional Work Ethic Profile in an Arab
Context. Journal of Business Ethics, 135(1), 177-198.
Ryan, J. J. (2002). Work values and organizational citizenship behaviors: Values that work for
employees and organizations. Journal of Business and Psychology, 17, 123-132.
Ryder, N. (1965). The cohort as a concept in the study of social change. American Sociological
Review, 30(6), 843-861.
Sacks, P. (1998). No….generation X is not ok. American Enterprise, 9, 46-48.
Scheef, D., & Thiefoldt, D. (2004). Generation X and the Millennials: What you need to know
about mentoring the new generations. 5-7. The Learning Cafe. Retrieved June 15, 2017,
from http://www.managingpartnerforum.org/tasks/sites/mpf/assets/image/TRR%20-
%20Mentoring%20the%20New%20Generations%20-%20Scheef-Thielfoldt%20-%2010-9-
071.pdf
Schwartz, B. (1986). The battle for human nature: Science, morality, and modern life. New York,
NY: Norton.
Schwartz, B. (1994). The costs of living: How market freedom erodes the best things in life. New
York, NY: Norton.
Scott Morton, F. M., & Podolny, J. M. (2002). Love or money? The effects of owner motivation in
the California wine industry. Journal of Industrial Economics, 50(4), 431-456.
Seashore, C. E. (1923). Introduction to Psychology. New York, NY: MacMillan Co.
Shamir, B. (1991). Meaning, self and motivation in organizations. Organization Studies, 12(3), 405-
424.
Sheehy, J. W. (1990). New work ethic is frightening. Personnel Journal, 28-36.
203
Shimko, B. W. (1992). Pre-hire assessment of the New York force: Finding wheat (and work ethic)
among the chaff. Business Horizons, 60-65.
Smrt, D. L., & Karau, S. L. (2011). Protestant work ethic moderates social loafing. Group
Dynamics: Theory, Research, and Practice, 15, 267-274.
Spiegler, M. (1997). Slack attack. American Demographics, 19, 35-36.
Stanton, J. M., Sinar, E. F., Balzer, W. K., & Smith, P. C. (2002). Issues and strategies for reducing
the length of self-report scales. Personnel Psychology, 55, 167-194.
Steger, M. F., Pickering, N. K., Shin, J. Y., & Dik, B. J. (2010). Calling in Work Secular or Sacred?
Journal of Career Assessment, 18(1), 82-96. doi:10.1177/1069072709350905
Strauss, W., & Howe, N. (1991). Generations: The history of America’s Future, 1584 to 2069. New
York, NY: Quill William Morrow.
Super, D. E., & Sverko, B. (1995). Life roles, values, and careers. San Francisco, CA: Jossey-Bass.
Tabachnick, B. G., & Fidell, L. S. (2013). Using multivariate statistics. New York, NY: Pearson
Education, Inc.
Teddlie, C., & Tashakkori , A. (2009). Foundations of Mixed Methods Research: Integrating
Quantitative and Qualitative Approaches in the Social and Behavioral Sciences. Thousand
Oaks, CA: Sage Publications, Inc.
Terjesen, S., Vinnicombe, S., & Freeman, C. (2007). Attracting Generation Y graduates,
organizational attributes likelihood to apply and sex differences. Career Development
International, 12(6), 504-522.
The Abolition Project. (2009). Retrieved June 20, 2017, from
http://abolition.e2bn.org/slavery_40.html
204
The World Bank. (n.d.). The World Bank in the Caribbean - Trinidad and Tobago. Retrieved June
15, 2017, from https://www.worldbank.org/en/country/caribbean/overview
Tipu, S. A., & Ryan, J. C. (2016). Predicting entrepreneurial intentions from work values:
Implications for stimulating entrepreneurship in UAE national youth. Management
Decision, 54(3), 610-629.
Trinidad and Tobago Central Statistical Office Quarter 2 Report. (2015). Retrieved May 16, 2017,
from Trinidad and Tobago Central Statistical Office: http://cso.gov.tt/data/?productID=20-
Labour-Force-by-Employment-Status-and--Age
Trinidad and Tobago Central Statistical Office Quarter 4 Report. (2017). Retrieved from Trinidad
and Tobago Central Statistical Office.
Triola, M. F. (2001). Elementary statistics (8th ed.). New York, NY: Addison Wesley Longman.
Twenge, J. M. (2000). The age of anxiety? Birth cohort change in anxiety and neuroticism, 1952 -
1993. Journal of Personality and Social Psychology, 79(6), 1007-1021. doi:10.1037/0022-
3514.79.6.1007
United States Department of Labor Bureau of Labor Statistics . (2012, September 20). Retrieved
from Employees Tenure in 2012 : https://www.bls.gov/opub/ted/2012/ted_20120920.htm
Van der Walt, F., Jonck, P., & Sobayeni, N. C. (2016). Work ethic of different generational cohorts
in South Africa. African Journal of Business Ethics, 10(1), 52-66. doi:10.15249/10-1-101
Van Ness, R. K., Melinsky, K., Buff, C. L., & Seifer, C. F. (2010). Work ethic: Do new employees
mean new work values? Journal of Managerial Issues, 22(1), 10-34.
Warner-Lewis, M. (2007, March 13). TriniSoca.com. Retrieved June 17, 2017, from African
Heritage in the Caribbean: http://www.trinisoca.com/features/130307.html
205
Warr, P. N. (1982). A national study of non-financial employment commitment. Journal of
Occupational Psychology, 55, 297-312.
Weber, M. (1958). The Protestant Ethic and the spirit of capitalism. New York, NY: T. Parson,
Trans.
Williams, E. E. (1994). Capitalism and Slavery. Chapel Hill, NC: The University of North Carolina
Press.
Woehr, D. J., Arciniega, L. M., & Lim, D. H. (2007). Examining work ethic across populations: A
comparison of the multidimensional work ethic profile across three diverse cultures.
Educational and Psychological Measurement, 67, 154-168.
doi:10.1177/0013164406292036
World Economic Forum. (2012 - 2017). Global Competitiveness Index Report. Geneva.
World Economic Forum. (2015-2016). Global Competitiveness Index Report. Geneva.
Wrzesniewski, A. (1999). Jobs, careers, and callings: Work orientation and job transitions.
University of Michigan, Unpublished Doctoral Dissertation. ProQuest Dissertations &
Theses Global.
Wrzesniewski, A. (2003). Finding positive meaning in work. In K. S. Camerson, J. E. Dutton, & R.
E. Quinn, Positive organizational scholarship: Foundations of a new discipline (pp. 296-
308). San Francisco, CA: Barrett-Koehler.
Wrzesniewski, A. (2011). Callings. In K. K. Cameron, & G. Spreitzer, Handbook of positive
organizational scholarship. New York: Oxford University Press.
Wrzesniewski, A., & Dutton, J. E. (2001). Crafting a job: Revisioning employees as active crafters
of their work. Academy of Management Review, 26(2), 179-201.
206
Wrzesniewski, A., Dutton , J. E., & Debebe, G. (2003). Interpersonal sensemaking and the meaning
of work. Research in Organizational Behavior, 25, 93-135.
Wrzesniewski, A., McCauley, C., Rozin, P., & Schwartz, B. (1997). Jobs, careers, and callings:
People’s relations to their work. Journal of Research in Personality, 31, 21-33.
Yandle, B. (1992). Does anyone still care? Supervision, 14-16.
Yankelovich, D. (1974). The meaning of work. In J. M. Rosow, The Worker and the Job: Coping
with Change. Englewood Cliffs, NJ: Prentice-Hall.
Yu, D., Harter, J., & Agrawal, S. (2013, April 26). US managers boast best work engagement:
managers also show greatest improvement in engagement. Gallup. Retrieved May 15, 2017,
from https://news.gallup.com/poll/162062/managers-boast-best-work-engagement.aspx
Zabel, K. L., Biermeier-Hanson, B. B., Shepard, A., Early, B. J., & Shepard, A. (2016).
Generational differences in work ethic: Fact of fiction? Journal of Business Psychology,
32(3), 301-315. doi:10.1007/s10869-016-9466-5.
Zuboff, S. (1983). The work ethic and work organization. In J. Barbash, R. J. Lampman, S. A.
Levitan, & G. Tyle, The Work Ethic – a Critical Analysis. Madison, WI: Industrial Relations
Research Association.
207
Appendix A – Invitation to Massy Group of Companies to Participate in the Study
PAULA THOMAS
Doctoral Student,
The Chicago School of Professional Psychology
Washington D.C. USA
Email: [email protected]
Local Contact: 868-480-9493.
July 14th 2017
MR. GERVASE WARNER
President & Group Chief Executive Officer
Massy Holdings Ltd.
63 Park Street, Port-of-Spain.
Dear Mr. Warner:
I am currently a registered student at The Chicago School of Professional Psychology pursuing a Ph.D. in
Business Psychology and am presently conducting research to complete my dissertation, a partial requirement for
completion of the program. The purpose of the research study is to: “Explore the relationship between work orientation
and work ethic among T&T generational cohorts.” (See White Paper attach).
To achieve the objectives of this study, selecting the most appropriate participants for data collection is integral.
An evaluation of my options in Trinidad and Tobago deemed the Massy Group of Companies as the most appropriate,
due to:
The wide cross-section of industries that is incorporated in your group
The large number of employees, thereby making the study more statistically significant.
Wide diversity of the employee population, making it much easier to generalise the results of the study
to the Trinidad and Tobago population.
It is within this context that I am inviting the Massy Group of Companies to participate in the data collection
phase of this study. Agreeing for the Massy Group of Companies to participate in this study will not only provide some
critical information that will assist your team in making some critical people management decisions, but it will also
contribute to wider social and economic problems that are currently plaguing our twin island of Trinidad.
I look forward to a favourable response and meeting with you to discuss your companies’ involvement in more
detail. I can be contacted at 868-480-9493.
Sincerely,
Paula Thomas
Doctoral Student
The Chicago School of Professional Psychology
208
Appendix B – Massy’s Consent to Participate
209
210
Appendix C- Institution Review Board Exempt Determination
04-Jun-2018
INSTITUTIONAL REVIEW BOARD
Exempt Determination
IRB #: IRB-18-04-0022
Study Title: Work ethic and work orientation across Trinidad and Tobago generational cohorts
Principal Investigator: Thomas, Paula B
Study Team: Thomas, Paula B~Wanner, Kristy~
Dear Investigator,
This notification certifies that the above referenced study has been reviewed by The Chicago School of
Professional Psychology IRB. The committee has determined that the study meets the requirements for the
exemption under category [2].
Research involving the use of educational tests (cognitive, diagnostic, aptitude, achievement), survey
procedures, interview procedures or observation of public behavior, unless:
(i) information obtained is recorded in such a manner that human subjects can be identified, directly or through
identifiers linked to the subjects; and (ii) any disclosure of the human subjects' responses outside the research
could reasonably place the subjects at risk of criminal or civil liability or be damaging to the subjects' financial
standing, employability, or reputation.
Please note that investigators and study personnel must comply with all applicable Federal, State, and local laws
regarding the protection of human subjects in research, as well as all TCSPP policies and procedures.
Any proposed changes to this study or related documents that may affect the exemption determination or
increase the potential risk to study participants must be reviewed by the IRB prior to implementation. Failure to
obtain prior approval could result in suspension of the study and additional action as necessary.
In addition, all researchers are required to always follow the American Psychological Association’s ethical
principles and code of conduct, especially in regards to Section 8 of the ethical code (“research and publication”).
Failure to conform to the APA ethical code may result in revocation of IRB approval.
Please keep this notification in your study records. You may contact the IRB office with any questions or concerns
via the department mailbox [email protected].

211
Appendix D – Invitation to Participate
Dear Participant:
We will like to take this opportunity to introduce you to Paula Thomas, a registered student
at The Chicago School of Professional Psychology. She is pursuing a Ph.D. in Business
Psychology and is presently conducting research to complete her dissertation, a partial requirement
for completion of the program. The purpose of her research is to predict and explain work ethic
(individual’s attitude towards work) and work orientation (individual’s meaning attributed to their
work activities) across generational cohorts employed in the Massy Group of Companies, Trinidad
and Tobago.
The results obtained from a 30-minute questionnaire administered online, in which we are
asking you to participate, will enable her to observe work ethic and work orientation trends from a
generational context. Your consent to be a research subject is completely voluntarily. If you decline
to participate or drop out at any time during the study, there will be no adverse effects for you
personally or professionally. Should you accept the invitation to participate in this research, you will
be asked to respond to a sixty-one (61) item survey instrument, which includes some demographic
items such as generational cohort, gender, income, and religion. It will also include some items and
open-ended questions that are designed to examine your attitude towards work, and the meaning that
you attribute to your work activities.
It should be noted that while we embrace and support her study, we are not sponsoring it, and
therefore will not have access to any information pertaining to this study. If you are willing to
participate, please click on the link below and it will guide you to a Consent document and Survey
Instrument. On completion, it will be submitted directly to her. Also, you have the option to submit
your email address to participate in a draw to win one of three gift vouchers value
US$75.00/TT$500.00 for Buzo Osteria Italiana, #6 Warner Street, Newtown, Port-of-Spain.
Your willingness to participate is greatly appreciated, as it will assist further research and
practitioners in the field. Should you have any questions, please contact Paula Thomas at 868-480-
9493 or [email protected] and she will be very happy to answer any questions or
concerns.
Yours truly,
Julie Avey
SVP Human Resources
Massy Group of Companies
212
Appendix E – Oral Consent
Hello, my name is Paula Thomas. I am a student at The Chicago School of Professional
Psychology. I am conducting a research study to predict and explain work ethic (attitude towards
work) and work orientation (an individual’s meaning associated with their work activity) across
generational cohorts employed in the Massy Group of Companies, Trinidad and Tobago.
I am conducting this research as part of my studies in the Business Psychology Department. After I
have told you more about the project, you can decide whether or not you wish to participate. Your
participation is completely voluntary and you can decide to stop participating at any time during
this project without penalty.
You will be expected to complete a sixty-one (61) item survey instrument, administered online. It
will consist of:
Nine (9) demographic statement such as generational cohort, gender, income, and religion.
Twenty-eight (28) Multi-Dimensional Work Ethic Profile-SF (MWEP-SF) items that
investigates your attitude and belief towards your work in general and not with reference to
a specific job.
Twelve (12) Calling & Vocational Questionnaire (CVQ) items and nine (9) Multi-
Dimensional Calling Measures (MCM) items that will examine the meaning that you
attribute to your work activities.
Three (3) open-ended questions that will delve deeper into your attitude toward work and
the meaning that you attribute to your work activities.
You must agree to participate in the study before you can proceed to complete the survey
instrument.
Your participation in this study should take you no more than thirty (30) minutes. On completion,
the survey instrument will be submitted directly to me. Additionally, you have the option to submit
your email address to participate in a draw, to win one of three US$75.00/TT$500.00 gift vouchers
to Buzo Osteria Italiana, #6 Warner Street, Newtown, Port-of-Spain. The draw will be conducted
one week after the completion of the Survey. The researcher will send an email, blind copying the
three winners, informing them that they have won one of the three gift vouchers, and schedule a
time to hand deliver the gift vouchers to the three winners.
Since the data collection for this study will be conducted through an online platform, breach of your
confidentiality is the only foreseeable risk that you may be exposed to as a subject in the study. In
spite of all the efforts to maintain confidentiality, there is really no completely secure online
interaction, as there is always the potential risk of hackers.
Therefore, to minimize the breach of your confidentiality, identifying information such as your
name will not be collected, thereby, eliminating the possibility of connecting your name to your
responses. Additionally, if you submit your email address to participate in the draw, it will not be
possible for the researcher to connect your email address with your survey responses.
It is not expected that you will yield any direct benefits from participating in this study. However,
it is expected that the results of this study will provide deeper insights to enable the scholars in the
213
field to improve the knowledge of work orientation and work ethic, thereby improving the
performance of both the individual and the organization. It will provide the practitioners in the field
with the insights that should assist them in developing and implementing programs designed to
improve the overall work experiences of the working population. Additionally, it should be
valuable in understanding the working relations, diversity, and inclusion across generations,
particularly where one generation supervises another.
During the study, we will collect information on work ethic and work orientation across
generational cohorts in Trinidad and Tobago. This information will be accessible and used by the
researcher only, for the purpose of this study. Your responses will be confidential and Massy
Group of Companies will not have any access to any identifiable information pertaining to this
study.
If you have any questions, please feel free to contact Paula Thomas at:
5B9 The Meadows, Dibe Road,
Long Circular, St.James, Trinidad and Tobago.
868-480-9493
If you have any questions about your rights as a participant in this research, you can contact
The Chicago School of Professional Psychology Institutional Review Board at:
325 N.Wells
Chicago, II 60654
312-467-2343
I Agree: I Disagree:
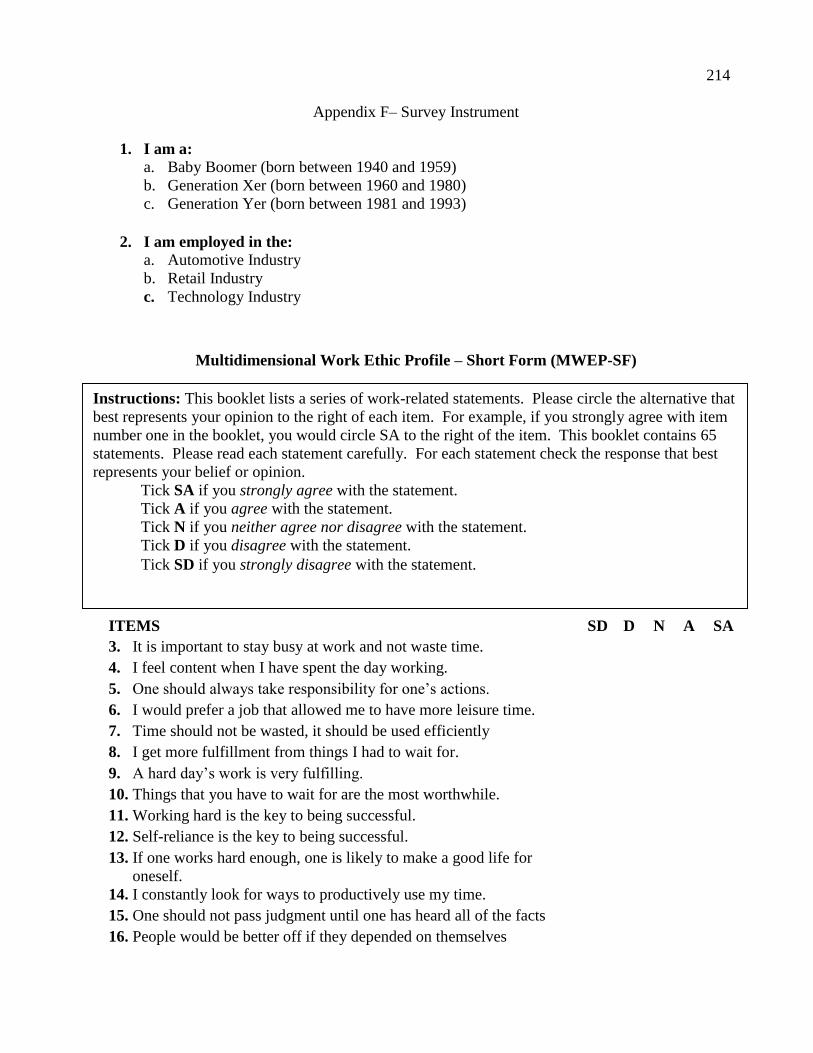
214
Appendix F– Survey Instrument
1. I am a:
a. Baby Boomer (born between 1940 and 1959)
b. Generation Xer (born between 1960 and 1980)
c. Generation Yer (born between 1981 and 1993)
2. I am employed in the:
a. Automotive Industry
b. Retail Industry
c. Technology Industry
Multidimensional Work Ethic Profile – Short Form (MWEP-SF)
ITEMS SD D N A SA
3. It is important to stay busy at work and not waste time.
4. I feel content when I have spent the day working.
5. One should always take responsibility for one’s actions.
6. I would prefer a job that allowed me to have more leisure time.
7. Time should not be wasted, it should be used efficiently
8. I get more fulfillment from things I had to wait for.
9. A hard day’s work is very fulfilling.
10. Things that you have to wait for are the most worthwhile.
11. Working hard is the key to being successful.
12. Self-reliance is the key to being successful.
13. If one works hard enough, one is likely to make a good life for
oneself.
14. I constantly look for ways to productively use my time.
15. One should not pass judgment until one has heard all of the facts
16. People would be better off if they depended on themselves
Instructions: This booklet lists a series of work-related statements. Please circle the alternative that
best represents your opinion to the right of each item. For example, if you strongly agree with item
number one in the booklet, you would circle SA to the right of the item. This booklet contains 65
statements. Please read each statement carefully. For each statement check the response that best
represents your belief or opinion.
Tick SA if you strongly agree with the statement.
Tick A if you agree with the statement.
Tick N if you neither agree nor disagree with the statement.
Tick D if you disagree with the statement.
Tick SD if you strongly disagree with the statement.
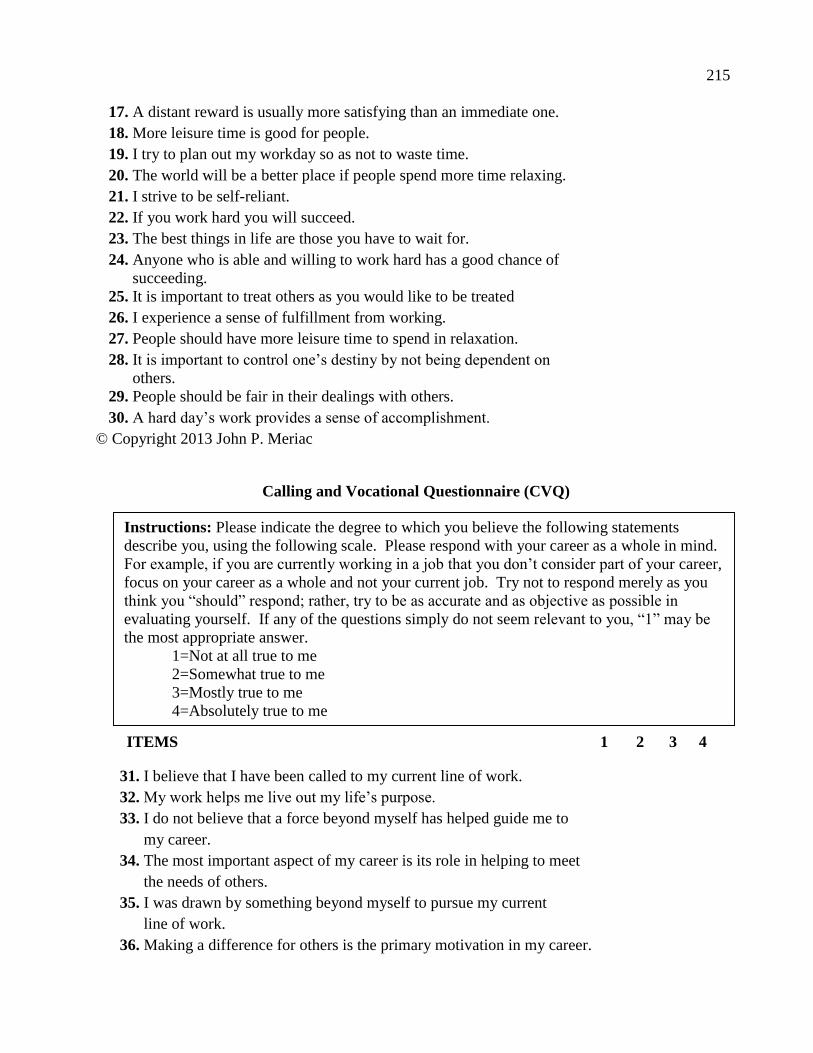
215
17. A distant reward is usually more satisfying than an immediate one.
18. More leisure time is good for people.
19. I try to plan out my workday so as not to waste time.
20. The world will be a better place if people spend more time relaxing.
21. I strive to be self-reliant.
22. If you work hard you will succeed.
23. The best things in life are those you have to wait for.
24. Anyone who is able and willing to work hard has a good chance of
succeeding.
25. It is important to treat others as you would like to be treated
26. I experience a sense of fulfillment from working.
27. People should have more leisure time to spend in relaxation.
28. It is important to control one’s destiny by not being dependent on
others.
29. People should be fair in their dealings with others.
30. A hard day’s work provides a sense of accomplishment.
© Copyright 2013 John P. Meriac
Calling and Vocational Questionnaire (CVQ)
ITEMS 1 2 3 4
31. I believe that I have been called to my current line of work.
32. My work helps me live out my life’s purpose.
33. I do not believe that a force beyond myself has helped guide me to
my career.
34. The most important aspect of my career is its role in helping to meet
the needs of others.
35. I was drawn by something beyond myself to pursue my current
line of work.
36. Making a difference for others is the primary motivation in my career.
Instructions: Please indicate the degree to which you believe the following statements
describe you, using the following scale. Please respond with your career as a whole in mind.
For example, if you are currently working in a job that you don’t consider part of your career,
focus on your career as a whole and not your current job. Try not to respond merely as you
think you “should” respond; rather, try to be as accurate and as objective as possible in
evaluating yourself. If any of the questions simply do not seem relevant to you, “1” may be
the most appropriate answer.
1=Not at all true to me
2=Somewhat true to me
3=Mostly true to me
4=Absolutely true to me
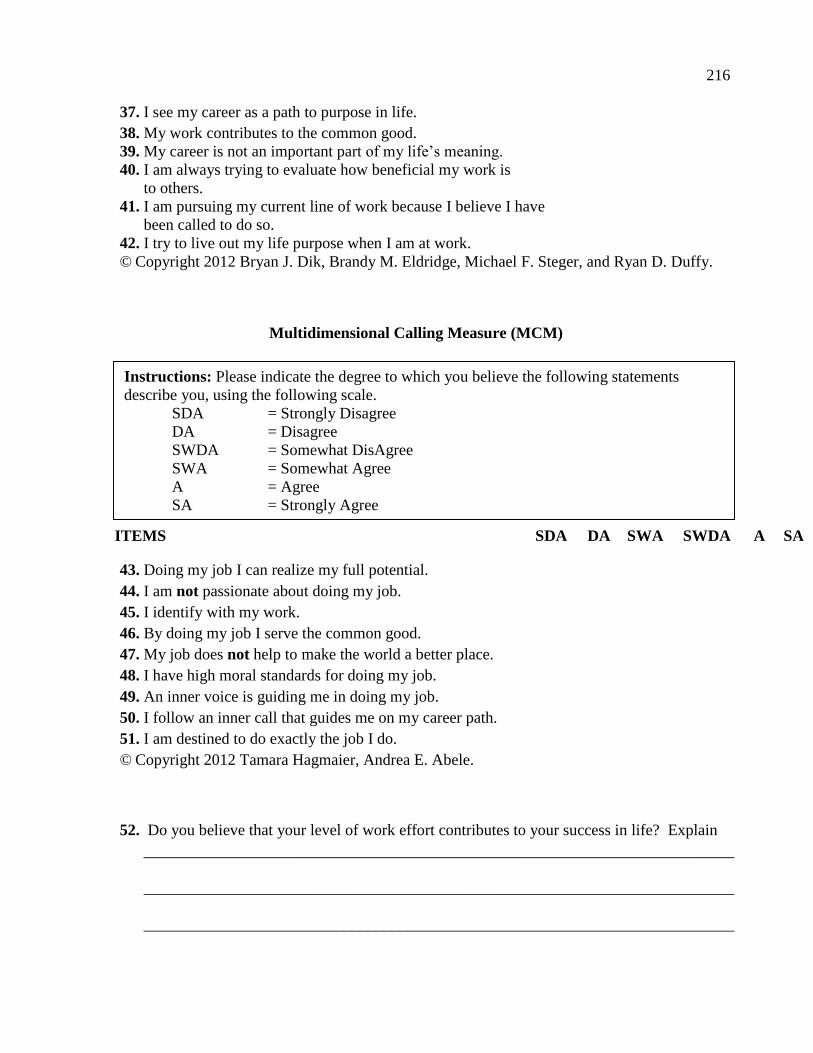
216
37. I see my career as a path to purpose in life.
38. My work contributes to the common good.
39. My career is not an important part of my life’s meaning.
40. I am always trying to evaluate how beneficial my work is
to others.
41. I am pursuing my current line of work because I believe I have
been called to do so.
42. I try to live out my life purpose when I am at work.
© Copyright 2012 Bryan J. Dik, Brandy M. Eldridge, Michael F. Steger, and Ryan D. Duffy.
Multidimensional Calling Measure (MCM)
ITEMS SDA DA SWA SWDA A SA
43. Doing my job I can realize my full potential.
44. I am not passionate about doing my job.
45. I identify with my work.
46. By doing my job I serve the common good.
47. My job does not help to make the world a better place.
48. I have high moral standards for doing my job.
49. An inner voice is guiding me in doing my job.
50. I follow an inner call that guides me on my career path.
51. I am destined to do exactly the job I do.
© Copyright 2012 Tamara Hagmaier, Andrea E. Abele.
52. Do you believe that your level of work effort contributes to your success in life? Explain
__________________________________________________________________________
__________________________________________________________________________
__________________________________________________________________________
Instructions: Please indicate the degree to which you believe the following statements
describe you, using the following scale.
SDA = Strongly Disagree
DA = Disagree
SWDA = Somewhat DisAgree
SWA = Somewhat Agree
A = Agree
SA = Strongly Agree
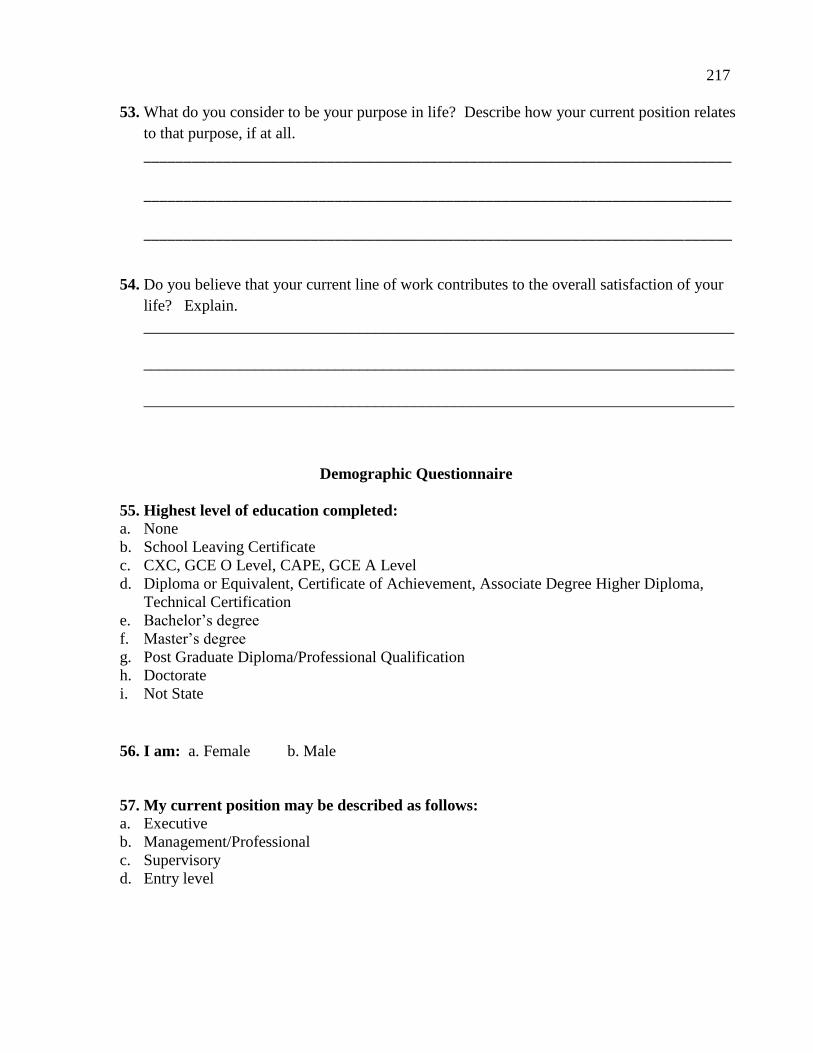
217
53. What do you consider to be your purpose in life? Describe how your current position relates
to that purpose, if at all.
__________________________________________________________________________
__________________________________________________________________________
__________________________________________________________________________
54. Do you believe that your current line of work contributes to the overall satisfaction of your
life? Explain.
__________________________________________________________________________
__________________________________________________________________________
__________________________________________________________________________
Demographic Questionnaire
55. Highest level of education completed:
a. None
b. School Leaving Certificate
c. CXC, GCE O Level, CAPE, GCE A Level
d. Diploma or Equivalent, Certificate of Achievement, Associate Degree Higher Diploma,
Technical Certification
e. Bachelor’s degree
f. Master’s degree
g. Post Graduate Diploma/Professional Qualification
h. Doctorate
i. Not State
56. I am: a. Female b. Male
57. My current position may be described as follows:
a. Executive
b. Management/Professional
c. Supervisory
d. Entry level
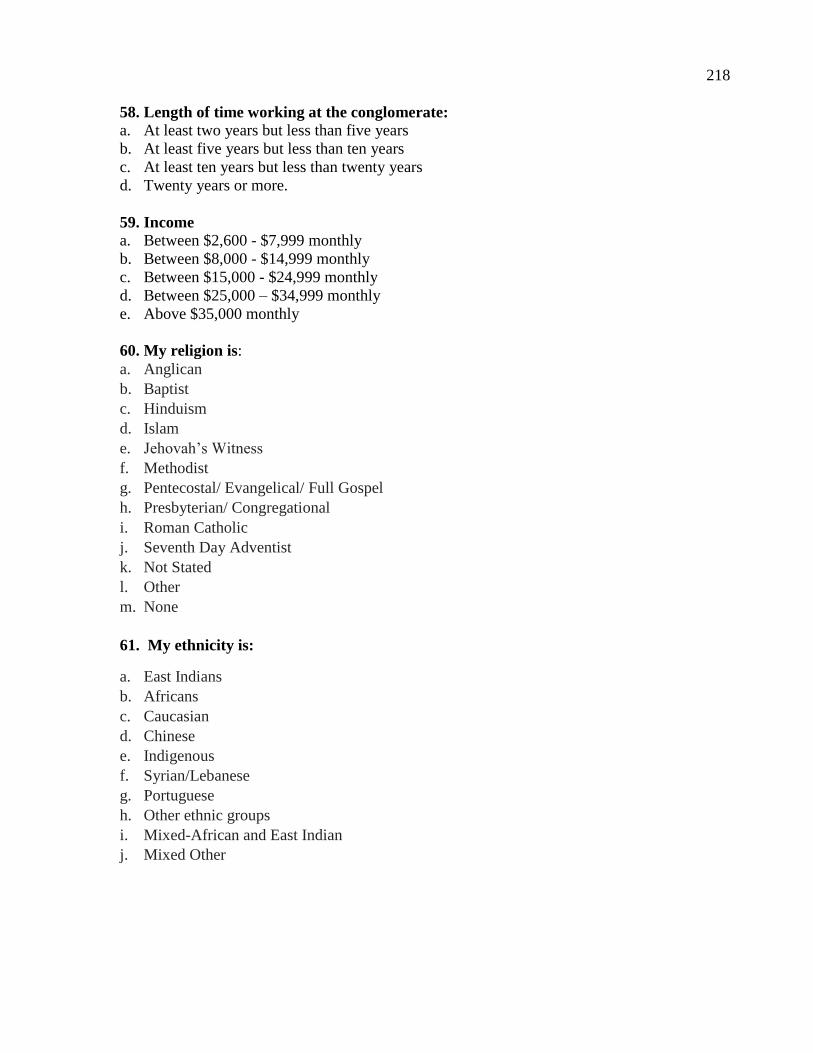
218
58. Length of time working at the conglomerate:
a. At least two years but less than five years
b. At least five years but less than ten years
c. At least ten years but less than twenty years
d. Twenty years or more.
59. Income
a. Between $2,600 - $7,999 monthly
b. Between $8,000 - $14,999 monthly
c. Between $15,000 - $24,999 monthly
d. Between $25,000 – $34,999 monthly
e. Above $35,000 monthly
60. My religion is:
a. Anglican
b. Baptist
c. Hinduism
d. Islam
e. Jehovah’s Witness
f. Methodist
g. Pentecostal/ Evangelical/ Full Gospel
h. Presbyterian/ Congregational
i. Roman Catholic
j. Seventh Day Adventist
k. Not Stated
l. Other
m. None
61. My ethnicity is:
a. East Indians
b. Africans
c. Caucasian
d. Chinese
e. Indigenous
f. Syrian/Lebanese
g. Portuguese
h. Other ethnic groups
i. Mixed-African and East Indian
j. Mixed Other
219
Appendix G – Thank you Note
Dear Participant,
Thank you for taking the time to complete this survey. We truly value the information you have
provided. Your responses will contribute to a deeper understanding of the work ethic issues that are
currently being experienced across the generational cohorts in the Trinidad and Tobago work
environment. Additionally, it will assist in developing some solutions.
On completion, we will be happy to share a summary of the results with you.
If you have any questions or comments, please don’t hesitate to contact the researcher Paula
Thomas directly at 868-480-9493.
Thanks again!
220
Appendix H – Follow-up Reminder
Dear Participant,
Did you see receive our email inviting you to participate in our research study on Tuesday 12, June
2018? You qualified to participate in this study that is focusing on work orientation and work ethic
among generational cohorts. We thank you if you have received and completed the survey. We
greatly appreciate your prompt response.
If you have not yet completed the survey, we urge you to please take a moment and complete, so that
you can be part of this very important study. It will only take 25 to 30 minutes to complete, and so
we wish to remind you to generously give the time needed. Please use the link below to get started,
and don’t forget to register for one of three chances to win a $500 gift voucher for Buzo Osteria
Italiana. The survey closes on Sunday, July 1st at midnight. Thanks again for your time.
Yours truly,
____________________
Paula B. Thomas
The Chicago School of Professional Psychology
Dr. Kristy Wanner
Chairman, Dissertation Committee
221
Appendix I – Permission and Consent to use the MWEP – SF Scale
Paula Thomas - Student
Reply all| Sat 05/08, 11:52 PM
Permission for the MWEP Scale - Short Form.docx23 KB
Paula Thomas - Student
Sat 05/08, 11:52 PM
Permission for the MWEP Scale - Short Form.docx23 KB
Good Morning Assistant Professor Meriac: I am currently a student at The Chicago School of Professional Psychology and am pursuing a Ph.D. in Business Psychology. For my dissertation research, I intend to explore the relationship between work orientation and work ethic among Trinidad and Tobago's generational cohorts. I am attaching a request for permission to utilize your Multidimensional Work Ethic Profile-SF to assist me to collect data to answer my research question.
Thanking you and I look forward to your decision. Sincerely, Paula Thomas Ph.D. Student, The Chicago School of Professional Psychology.
222
PAULA THOMAS
Doctoral Student,
The Chicago School of Professional Psychology
Washington D.C. USA
August 5, 2017
ASSISTANT PROFESSOR JOHN P. MERIAC
University of Missouri, St. Louis
425 Stadler Hall,
One University Boulevard,
St. Louis, MO 63121-4499.
Dear Assistant Professor Meriac:
I am writing to request permission to utilize The Multidimensional Work Ethic Profile – Short
Form discussed in your article “Development and Validation of a Short Form for the
Multidimensional Work Ethic Profile.”
I am currently a student at The Chicago School of Professional Psychology pursuing a Ph.D. Business
Psychology. For my dissertation research, I intend to explore the relationship between work
orientation and work ethic among Trinidad and Tobago generational cohorts. It is expected that the
proposed study will be conducted in a large conglomerate, consisting of over 60 companies located
on the twin island of Trinidad and Tobago.
Copyright information will be clearly outlined in the study conveying appropriate credit to you and
your associates. If you desire, I will be happy to forward the results of my investigation to you as
well.
Chair of my dissertation committee is Dr. Kristy Wanner ([email protected]);
committee members are Dr. Jehanzeb Cheema ([email protected]); and Dr. Kwame
Charles ([email protected]). I can also be reached at (pbt
[email protected]) or by telephone, 868-480-9493.
Thank you and I look forward to your decision.
Sincerely
______________________
Paula Thomas
Doctoral Student
223
The Chicago School of Professional Psychology
MJ
Meriac, John <[email protected]>
|
Today, 02:26 PM
Hi Paula, Sure, you have permission to use the MWEP-SF for research purposes. The items and scoring key should be accessible in the appendix of the article, but let me know if you have trouble accessing it or need a copy. If you would be willing to send me a copy of your dissertation or a write-up of the results in some other form when they are complete I would be very interested to know more about your findings. Good luck with your research! --JM -------------------------------------------------------------- John P. Meriac, Ph.D. Department of Psychological Sciences University of Missouri - St. Louis 425 Stadler Hall One University Boulevard St. Louis, MO 63121-4499 Phone: 314-516-5467 Fax: 314-516-5392 Email: [email protected]
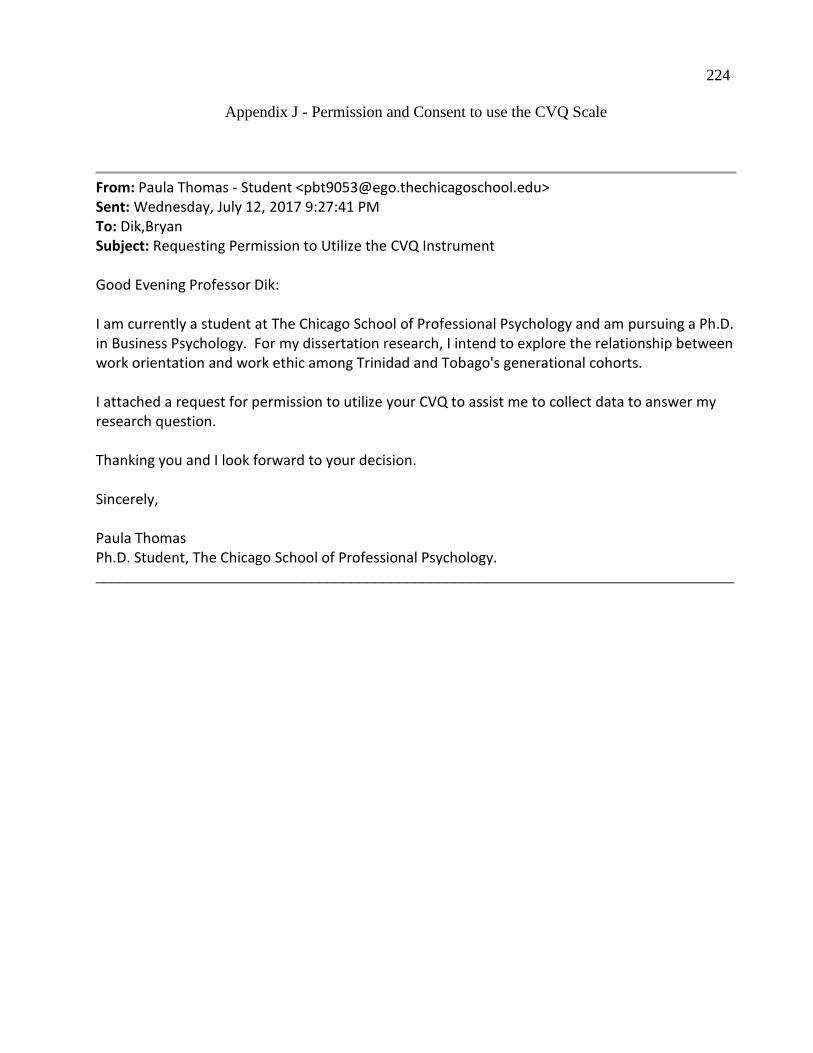
224
Appendix J - Permission and Consent to use the CVQ Scale
From: Paula Thomas - Student <[email protected]> Sent: Wednesday, July 12, 2017 9:27:41 PM To: Dik,Bryan Subject: Requesting Permission to Utilize the CVQ Instrument
Good Evening Professor Dik:
I am currently a student at The Chicago School of Professional Psychology and am pursuing a Ph.D. in Business Psychology. For my dissertation research, I intend to explore the relationship between work orientation and work ethic among Trinidad and Tobago's generational cohorts.
I attached a request for permission to utilize your CVQ to assist me to collect data to answer my research question.
Thanking you and I look forward to your decision. Sincerely, Paula Thomas Ph.D. Student, The Chicago School of Professional Psychology. ________________________________________________________________________________
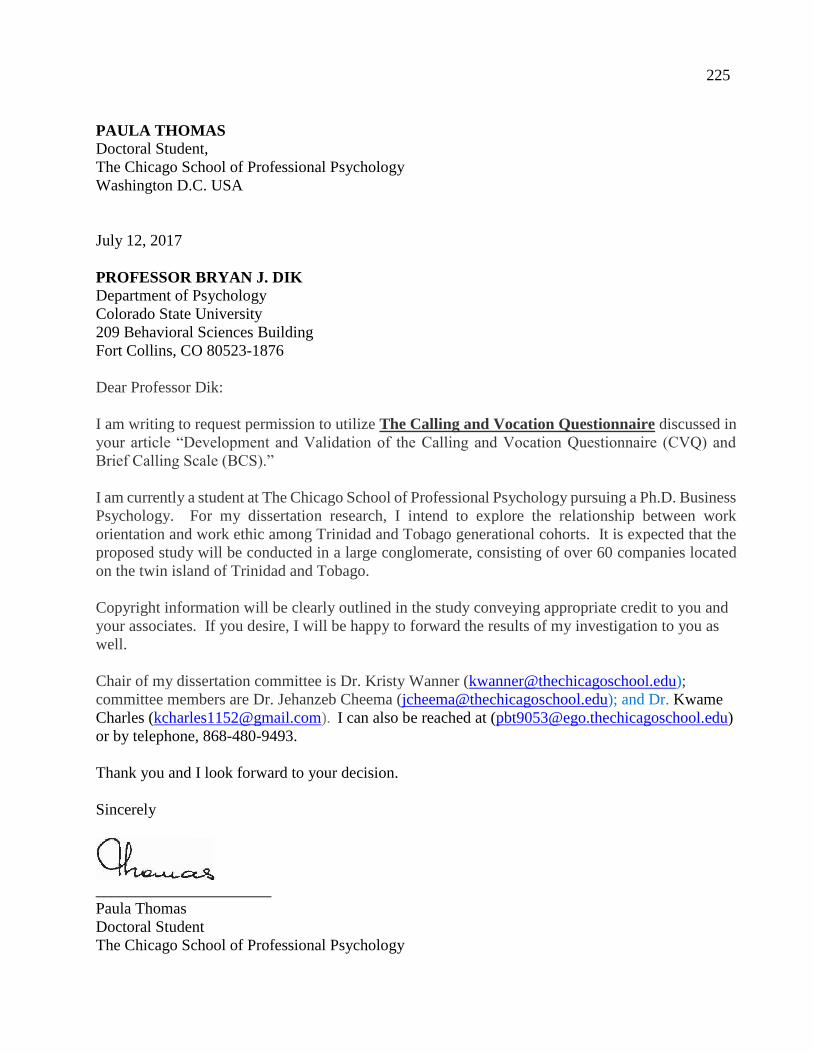
225
PAULA THOMAS
Doctoral Student,
The Chicago School of Professional Psychology
Washington D.C. USA
July 12, 2017
PROFESSOR BRYAN J. DIK
Department of Psychology
Colorado State University
209 Behavioral Sciences Building
Fort Collins, CO 80523-1876
Dear Professor Dik:
I am writing to request permission to utilize The Calling and Vocation Questionnaire discussed in
your article “Development and Validation of the Calling and Vocation Questionnaire (CVQ) and
Brief Calling Scale (BCS).”
I am currently a student at The Chicago School of Professional Psychology pursuing a Ph.D. Business
Psychology. For my dissertation research, I intend to explore the relationship between work
orientation and work ethic among Trinidad and Tobago generational cohorts. It is expected that the
proposed study will be conducted in a large conglomerate, consisting of over 60 companies located
on the twin island of Trinidad and Tobago.
Copyright information will be clearly outlined in the study conveying appropriate credit to you and
your associates. If you desire, I will be happy to forward the results of my investigation to you as
well.
Chair of my dissertation committee is Dr. Kristy Wanner ([email protected]);
committee members are Dr. Jehanzeb Cheema ([email protected]); and Dr. Kwame
Charles ([email protected]). I can also be reached at ([email protected])
or by telephone, 868-480-9493.
Thank you and I look forward to your decision.
Sincerely
______________________
Paula Thomas
Doctoral Student
The Chicago School of Professional Psychology
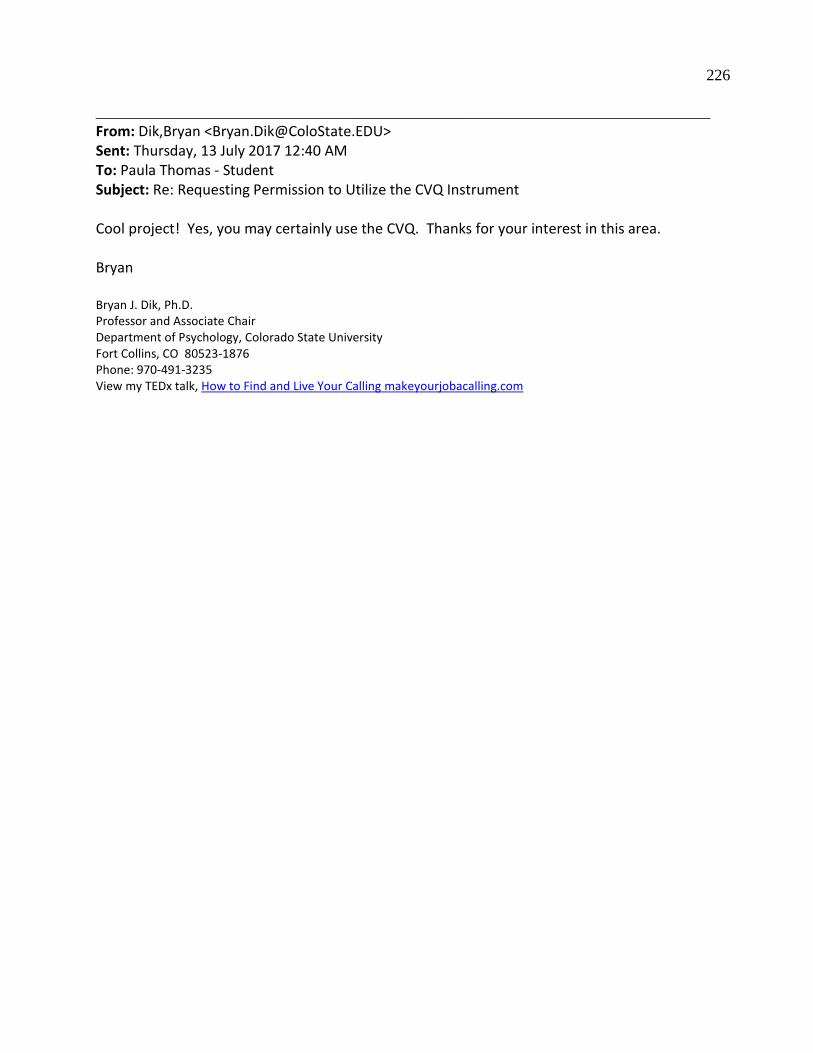
226
_____________________________________________________________________________
From: Dik,Bryan <[email protected]> Sent: Thursday, 13 July 2017 12:40 AM To: Paula Thomas - Student Subject: Re: Requesting Permission to Utilize the CVQ Instrument
Cool project! Yes, you may certainly use the CVQ. Thanks for your interest in this area. Bryan Bryan J. Dik, Ph.D. Professor and Associate Chair Department of Psychology, Colorado State University
Fort Collins, CO 80523-1876
Phone: 970-491-3235
View my TEDx talk, How to Find and Live Your Calling makeyourjobacalling.com
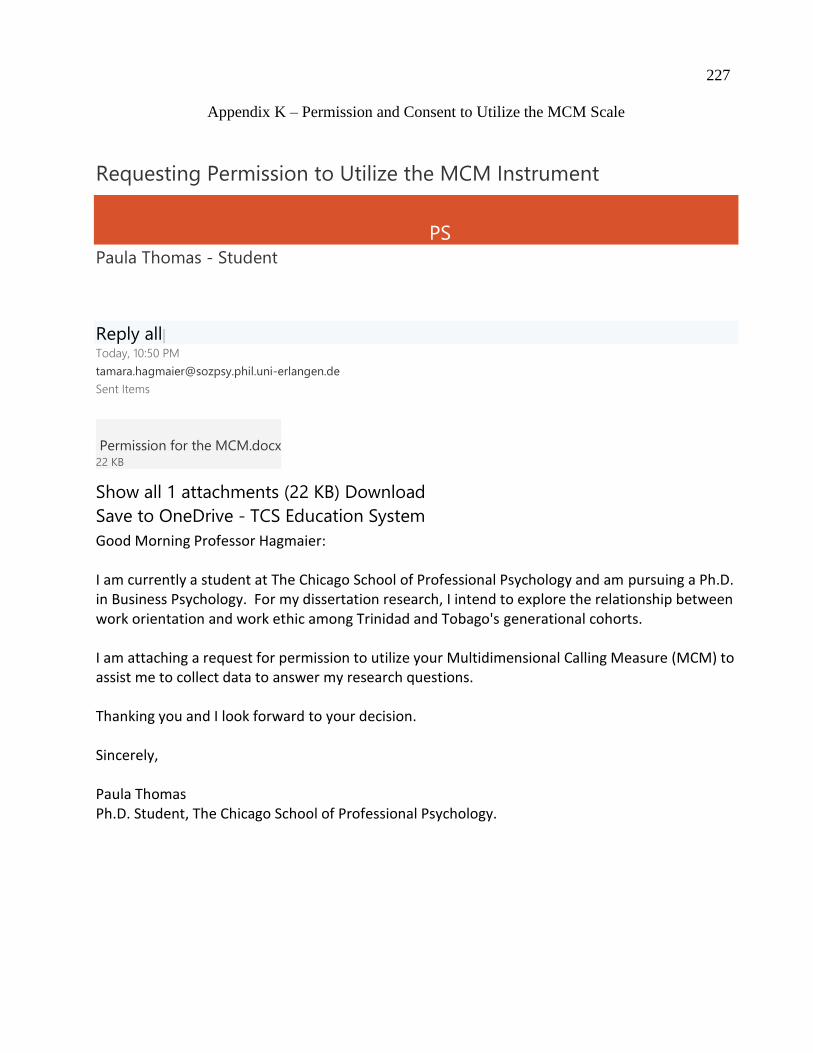
227
Appendix K – Permission and Consent to Utilize the MCM Scale
Requesting Permission to Utilize the MCM Instrument
PS
Paula Thomas - Student
Reply all| Today, 10:50 PM
Sent Items
Permission for the MCM.docx 22 KB
Show all 1 attachments (22 KB) Download
Save to OneDrive - TCS Education System
Good Morning Professor Hagmaier: I am currently a student at The Chicago School of Professional Psychology and am pursuing a Ph.D. in Business Psychology. For my dissertation research, I intend to explore the relationship between work orientation and work ethic among Trinidad and Tobago's generational cohorts. I am attaching a request for permission to utilize your Multidimensional Calling Measure (MCM) to assist me to collect data to answer my research questions. Thanking you and I look forward to your decision. Sincerely,
Paula Thomas Ph.D. Student, The Chicago School of Professional Psychology.
228
PAULA THOMAS
Doctoral Student,
The Chicago School of Professional Psychology
Washington D.C. USA
November 27, 2017
PROFESSOR TAMARA HAGMAIER
Social Psychology Group,
University of Erlangen-Nuremberg,
Bismarckstr, 6, D-91054
Erlangen, Germany
Dear Professor Hagmaier:
I am writing to request permission to utilize the Multidimensional Calling Measure (MCM)
discussed in your article “The multidimensionality of calling: Conceptualization, measurement and
a bicultural perspective.”
I am currently a student at The Chicago School of Professional Psychology pursuing a Ph.D. Business
Psychology. For my dissertation research, I intend to explore the relationship between work
orientation and work ethic among Trinidad and Tobago generational cohorts. It is expected that the
proposed study will be conducted in a large conglomerate, consisting of over 60 companies located
on the twin island of Trinidad and Tobago.
Copyright information will be clearly outlined in the study conveying appropriate credit to you and
your associates. If you desire, I will be happy to forward the results of my investigation to you as
well.
Chair of my dissertation committee is Dr. Kristy Wanner ([email protected]);
committee members are Dr. Jehanzeb Cheema ([email protected]); and Dr. Kwame
Charles ([email protected]). I can also be reached at (pbt
[email protected]) or by telephone, 868-480-9493.
Thank you and I look forward to your decision.
Sincerely
______________________
Paula Thomas
Doctoral Student
The Chicago School of Professional Psychology
229
AW: Requesting Permission to Utilize the MCM Instrument
HT
Hagmaier-Göttle, Tamara <[email protected]>
Reply all| Today, 06:06 AM
Paula Thomas - Student
Inbox
Dear Mrs. Thomas, yes, you may use the MCM for your thesis. Greetings from Germany, Tamara
--------------------------------------------------------------- Dr. Tamara Hagmaier-Göttle
Lehrstuhl für Sozialpsychologie
Friedrich-Alexander-Universität Erlangen-Nürnberg
Bismarckstr. 6
91054 Erlangen
Fon: + 49 09131 – 85 22307
Fax: +49 09131 – 85 24731
E-Mail: [email protected]
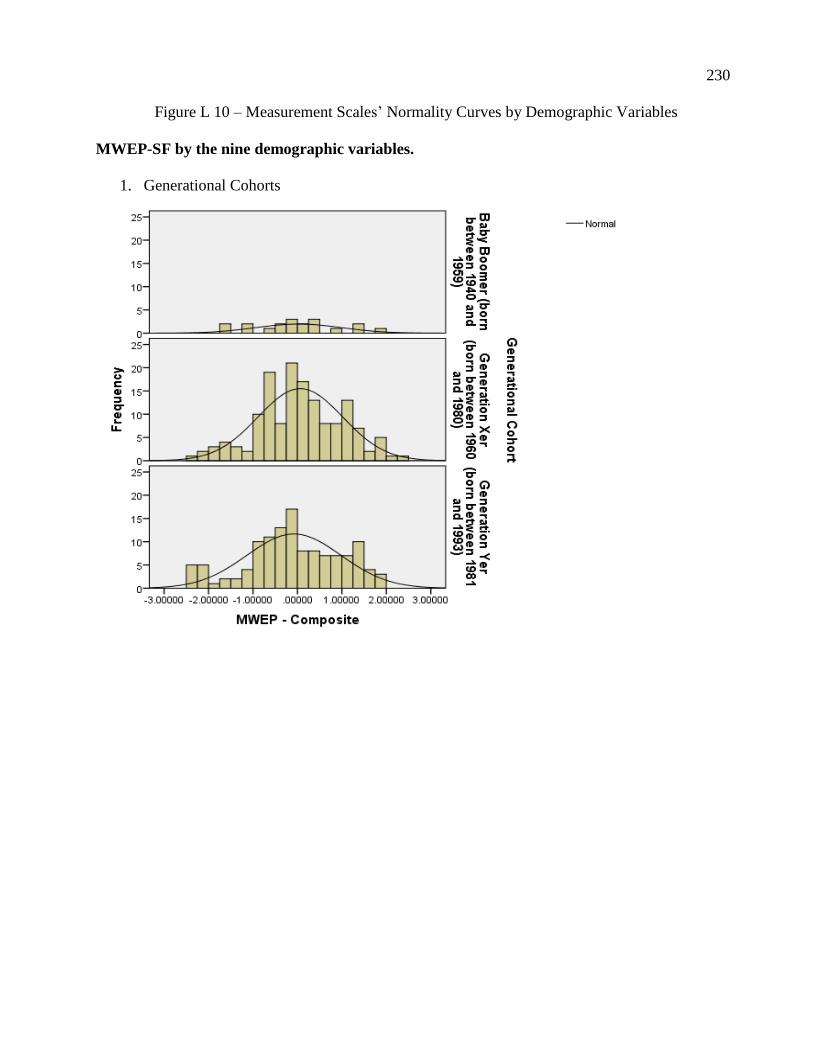
230
Figure L 10 – Measurement Scales’ Normality Curves by Demographic Variables
MWEP-SF by the nine demographic variables.
1. Generational Cohorts
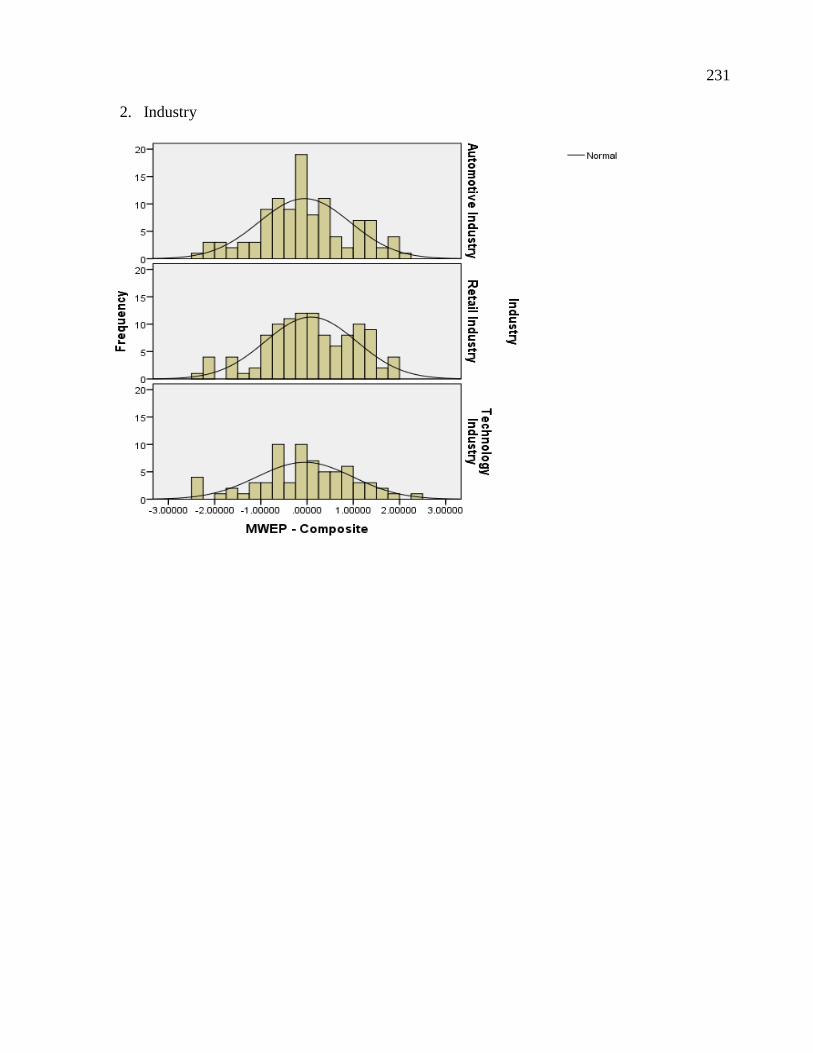
231
2. Industry
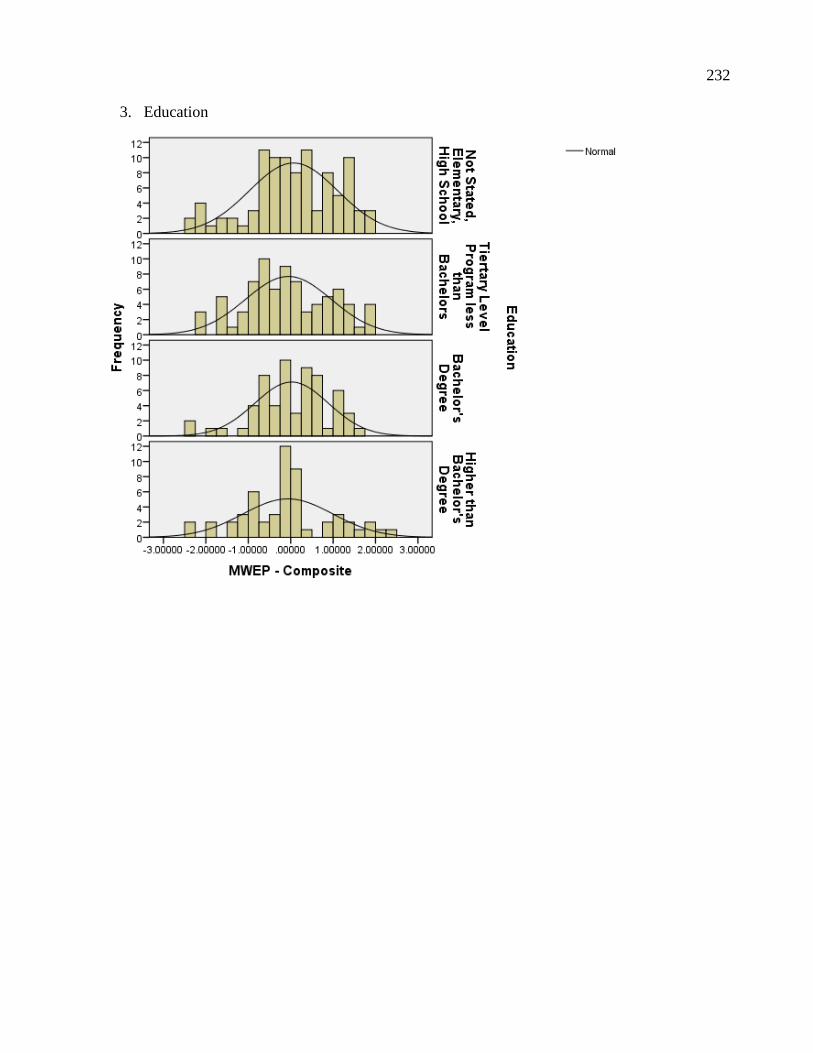
232
3. Education
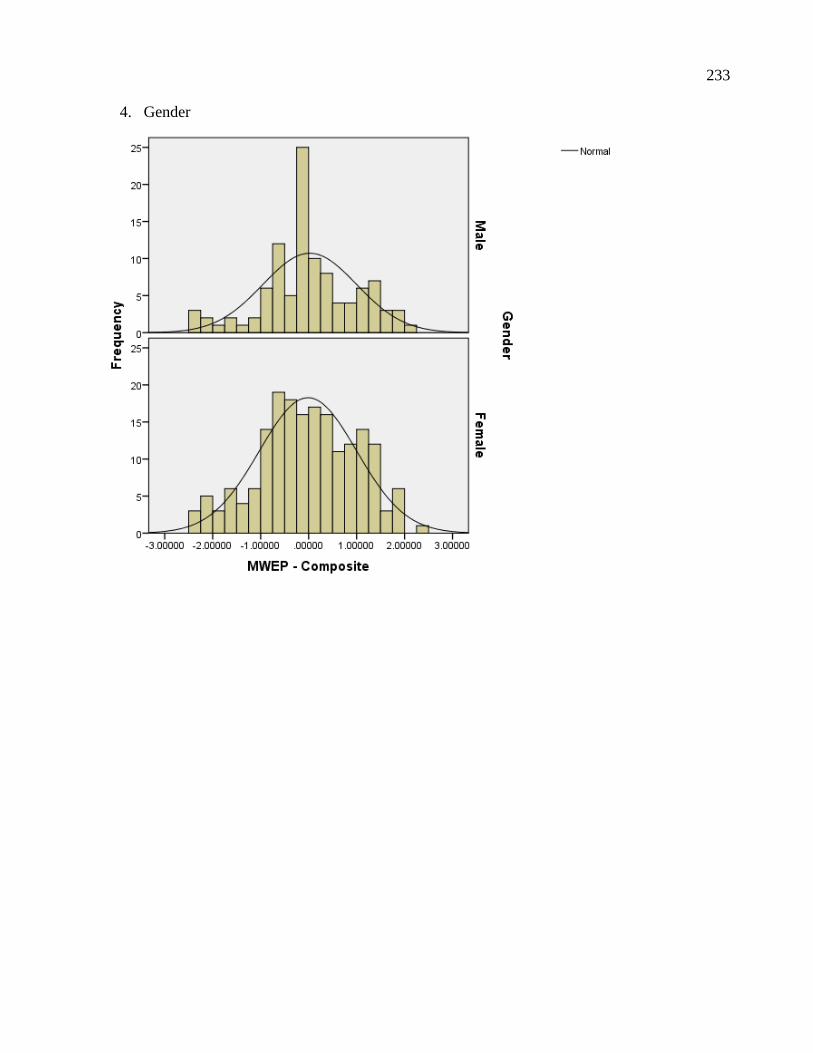
233
4. Gender
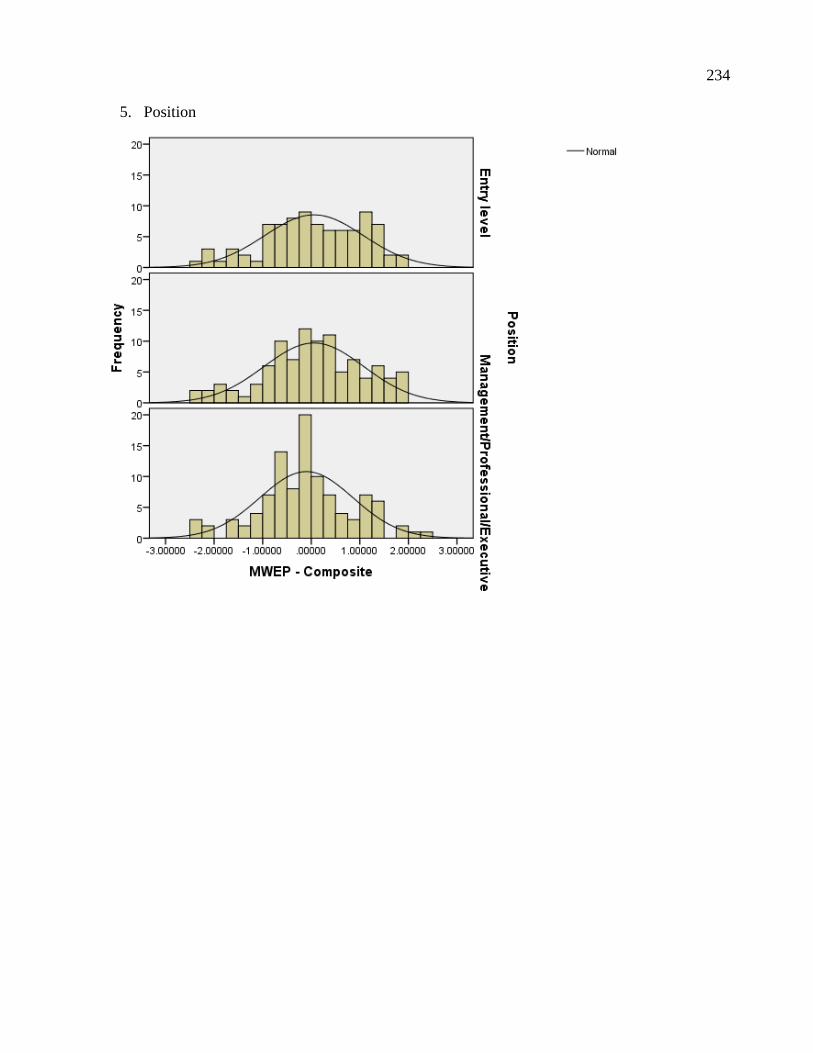
234
5. Position
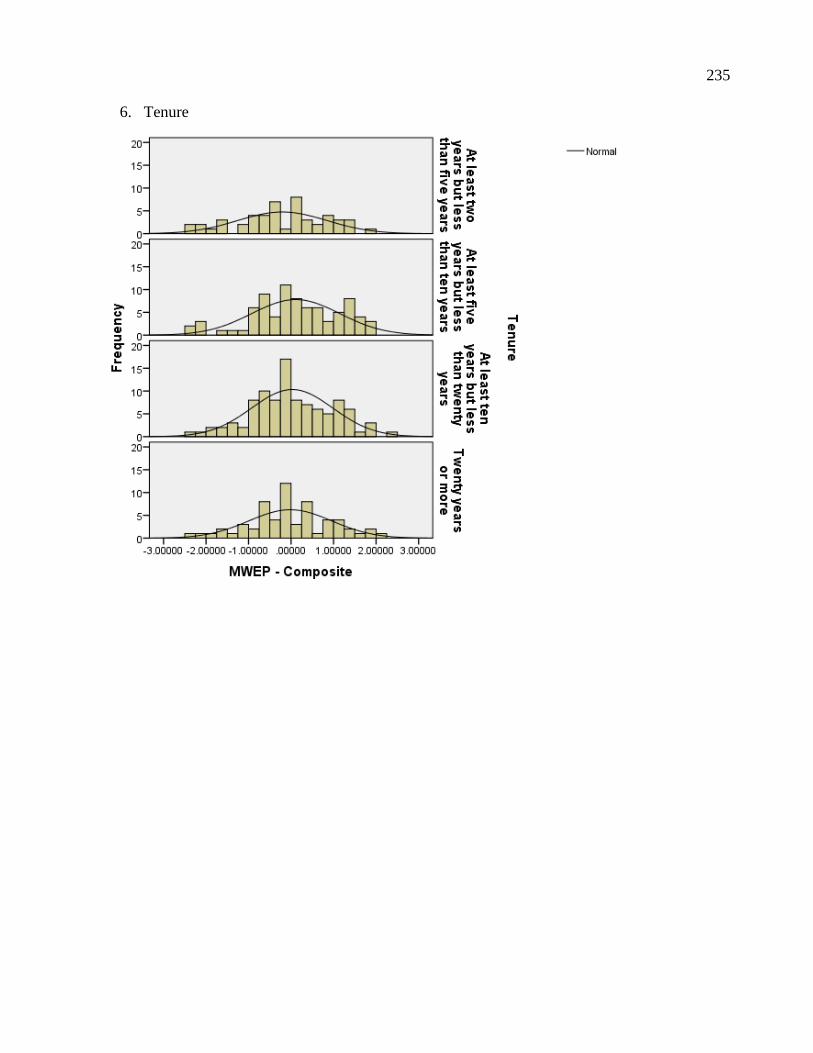
235
6. Tenure

236
7. Income
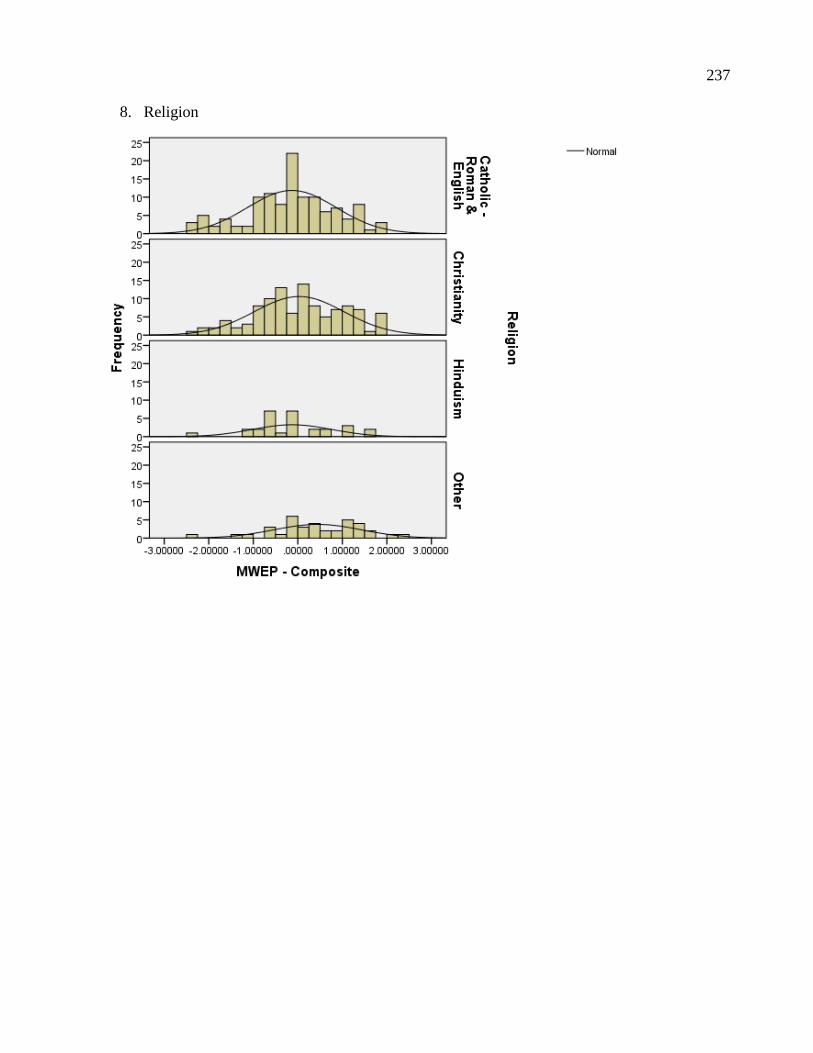
237
8. Religion
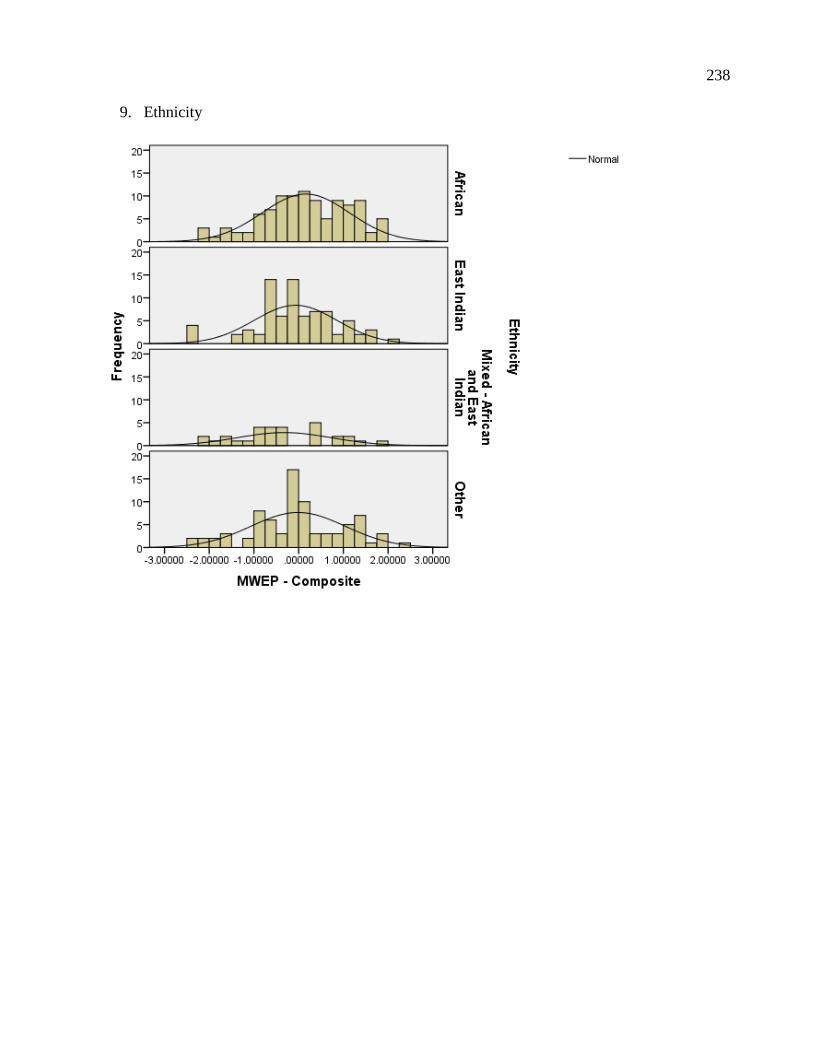
238
9. Ethnicity

239
WORK ORIENTATION - CVQ by the nine demographic variables
1. Generational Cohorts
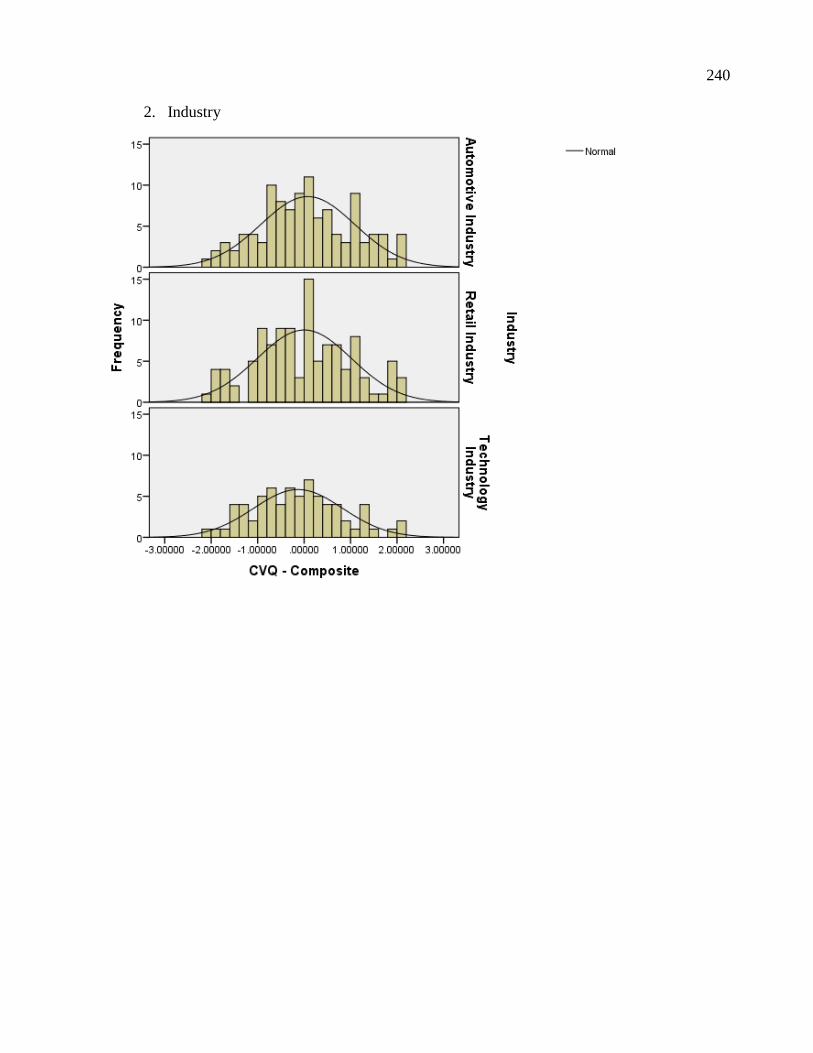
240
2. Industry
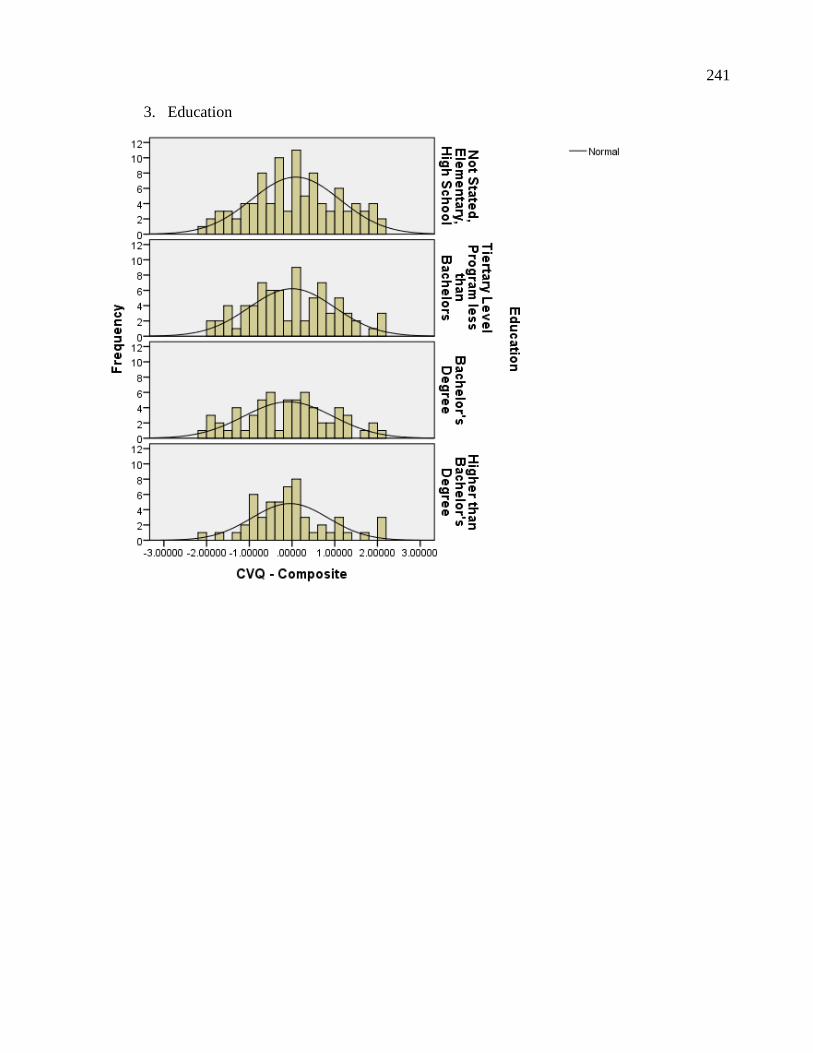
241
3. Education
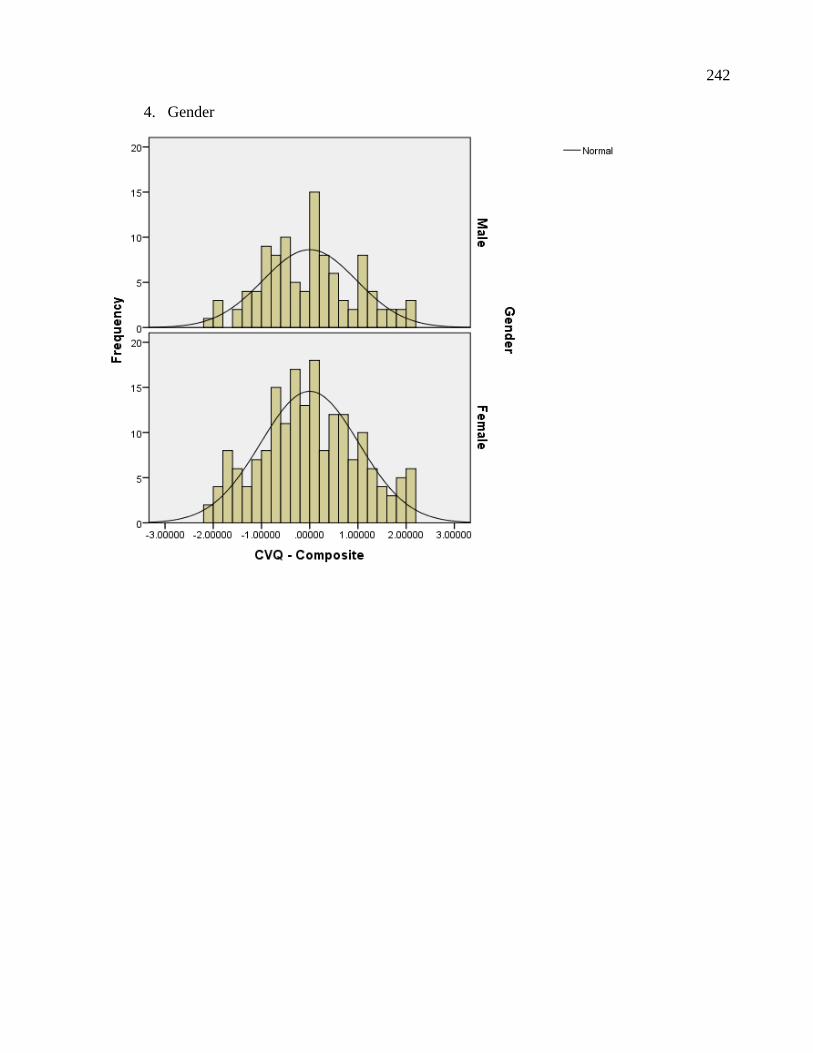
242
4. Gender
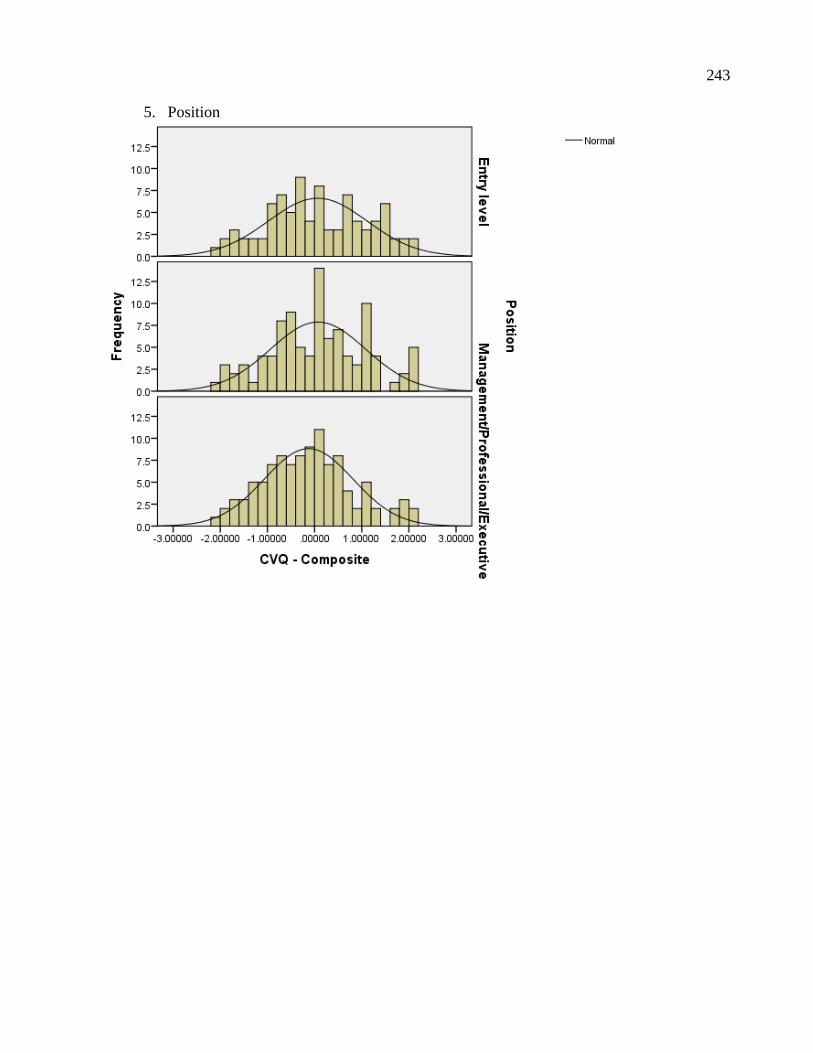
243
5. Position

244
6. Tenure

245
7. Income
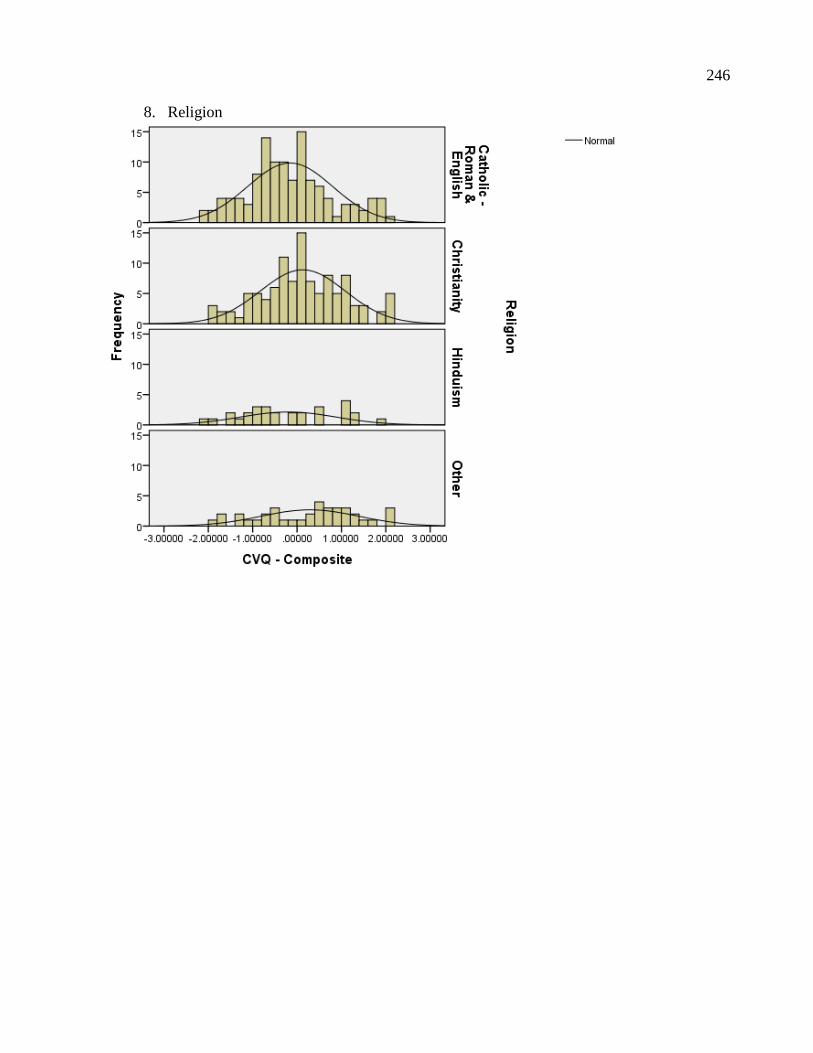
246
8. Religion
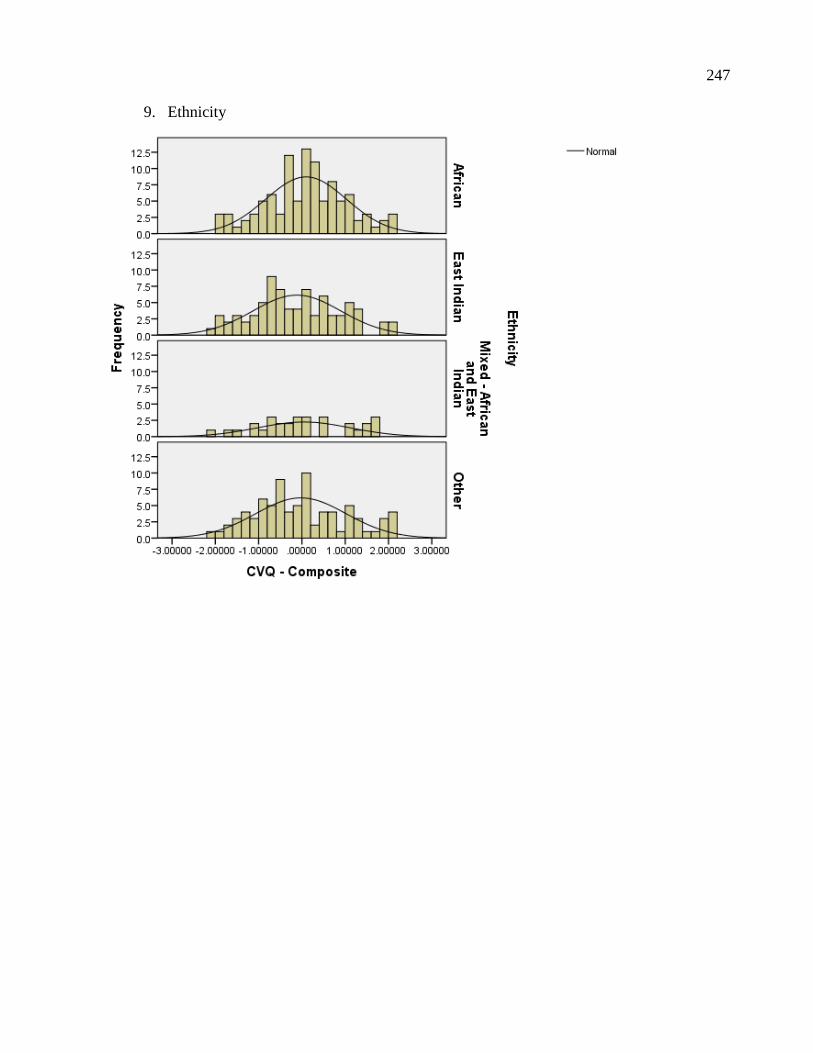
247
9. Ethnicity
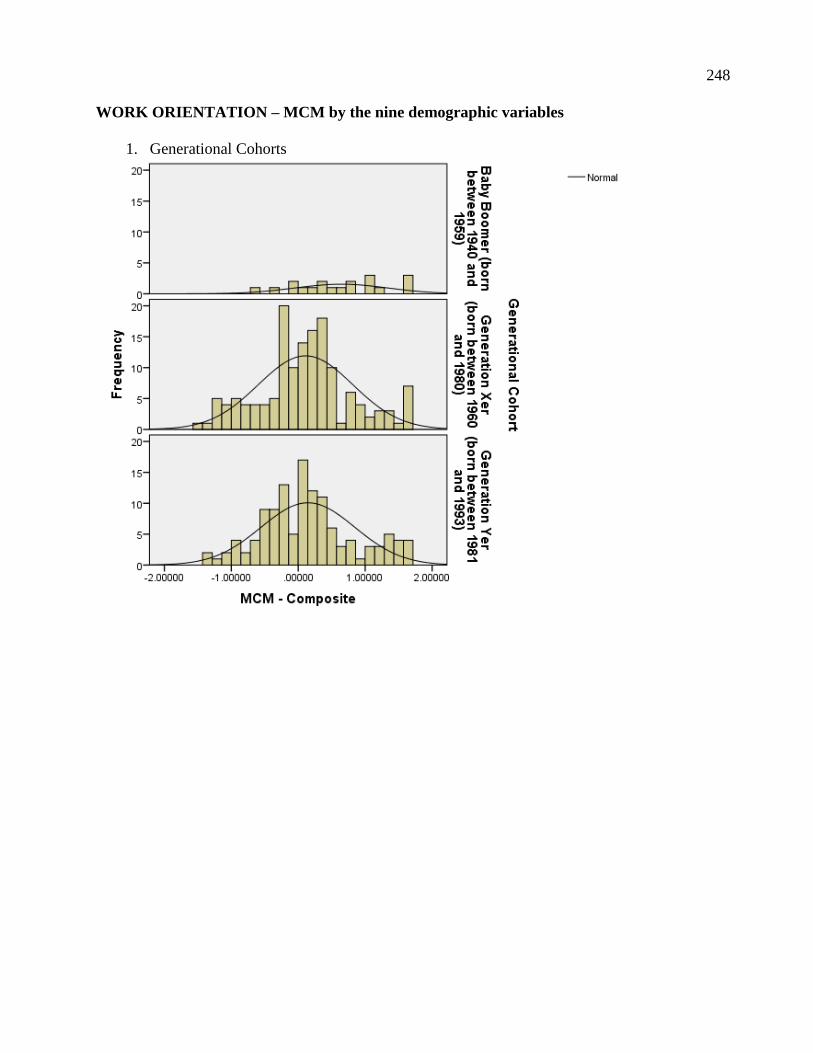
248
WORK ORIENTATION – MCM by the nine demographic variables
1. Generational Cohorts
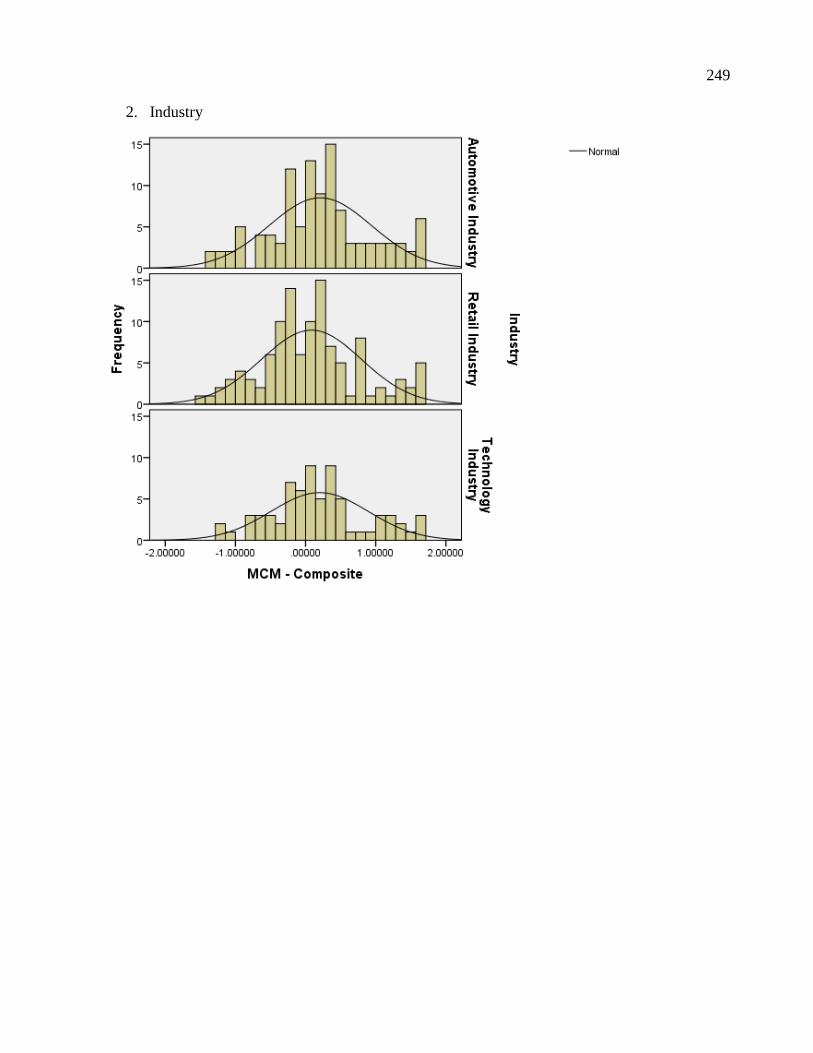
249
2. Industry
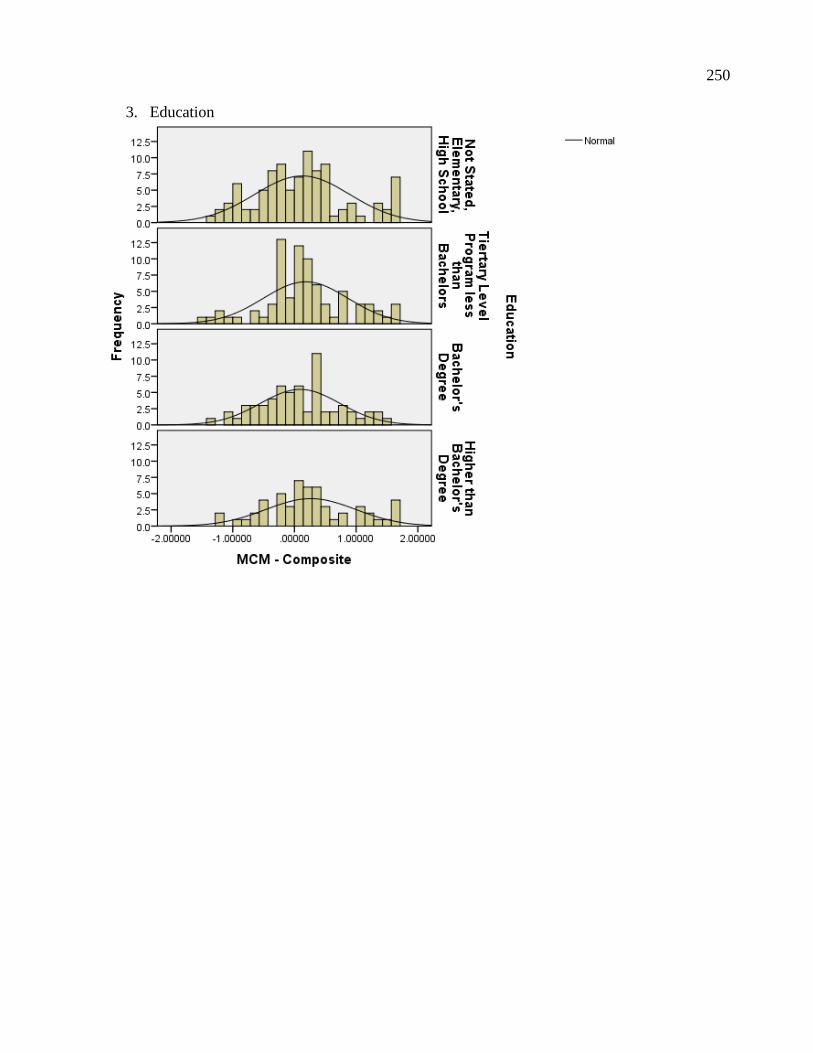
250
3. Education
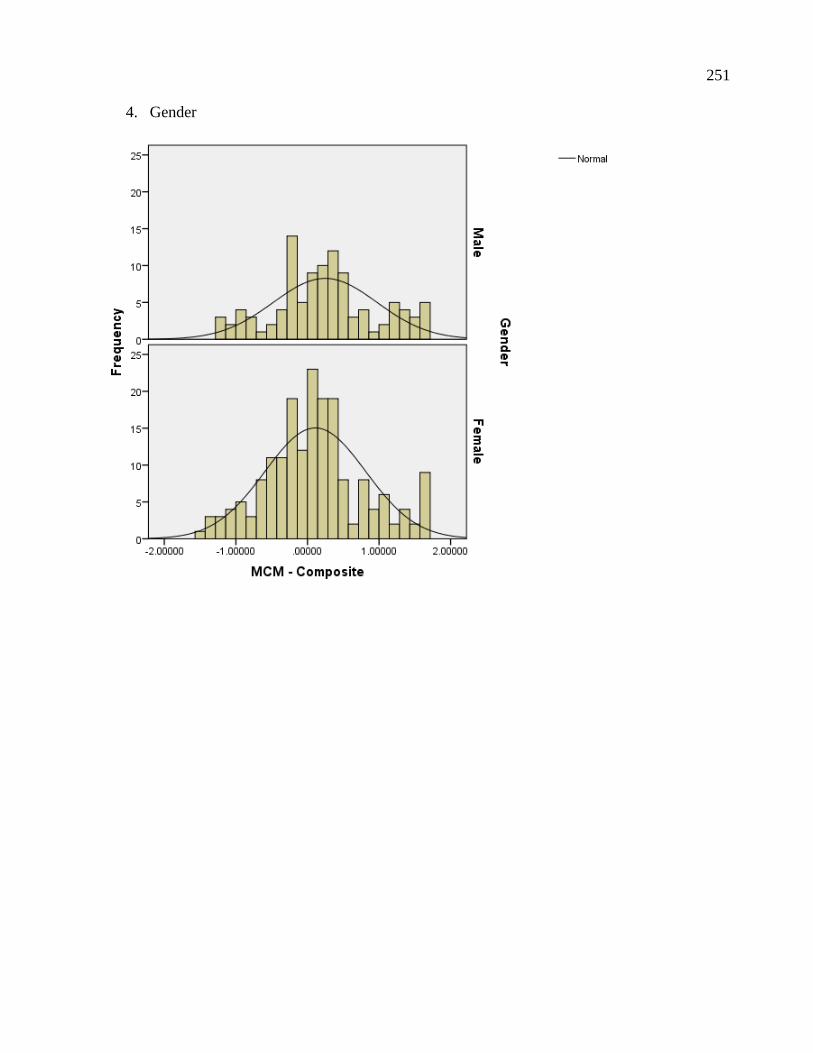
251
4. Gender
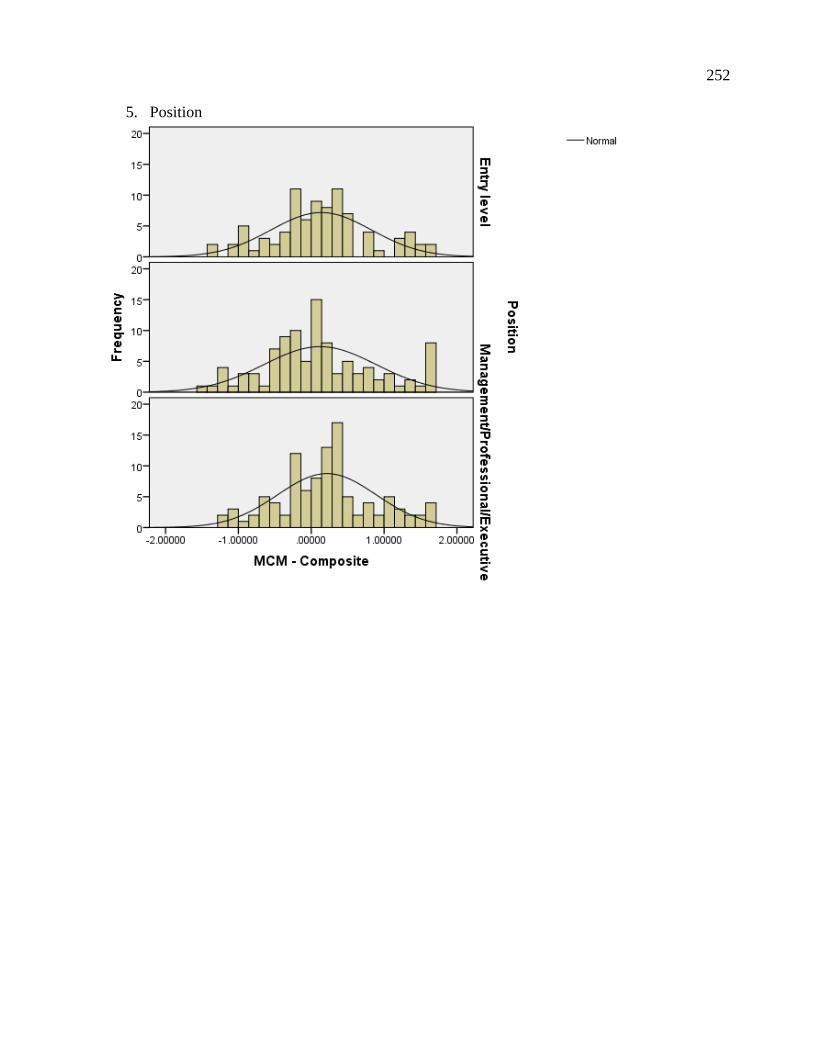
252
5. Position
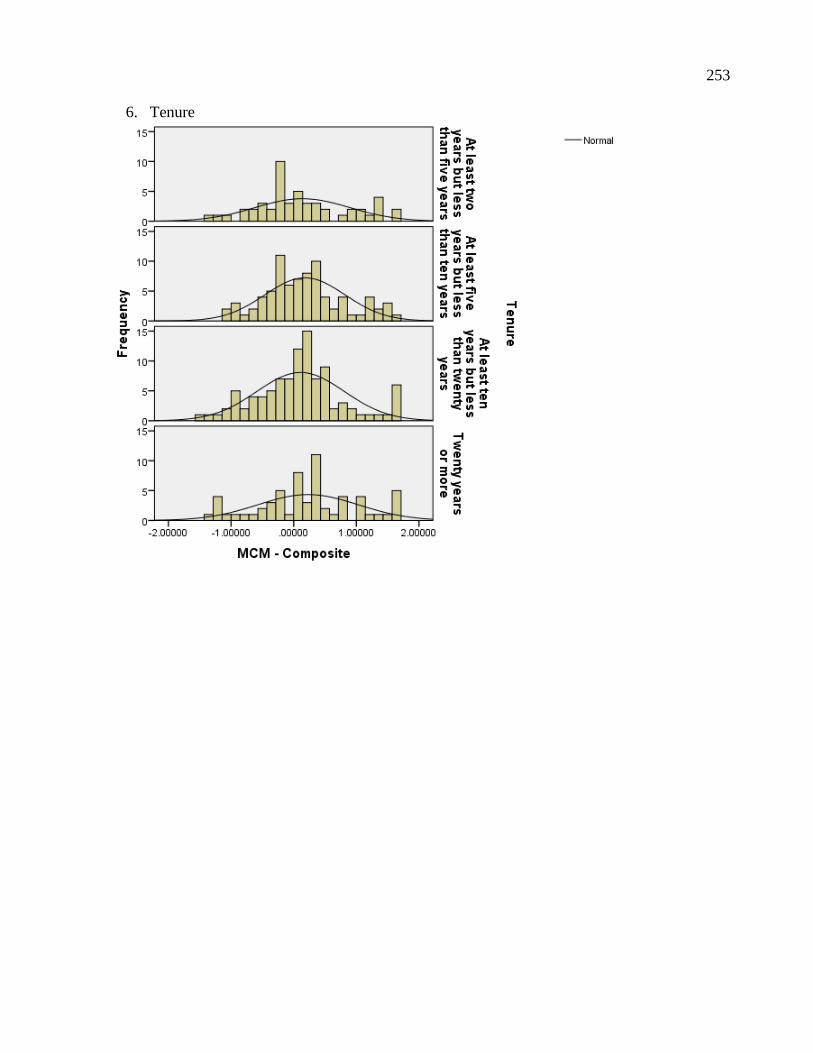
253
6. Tenure
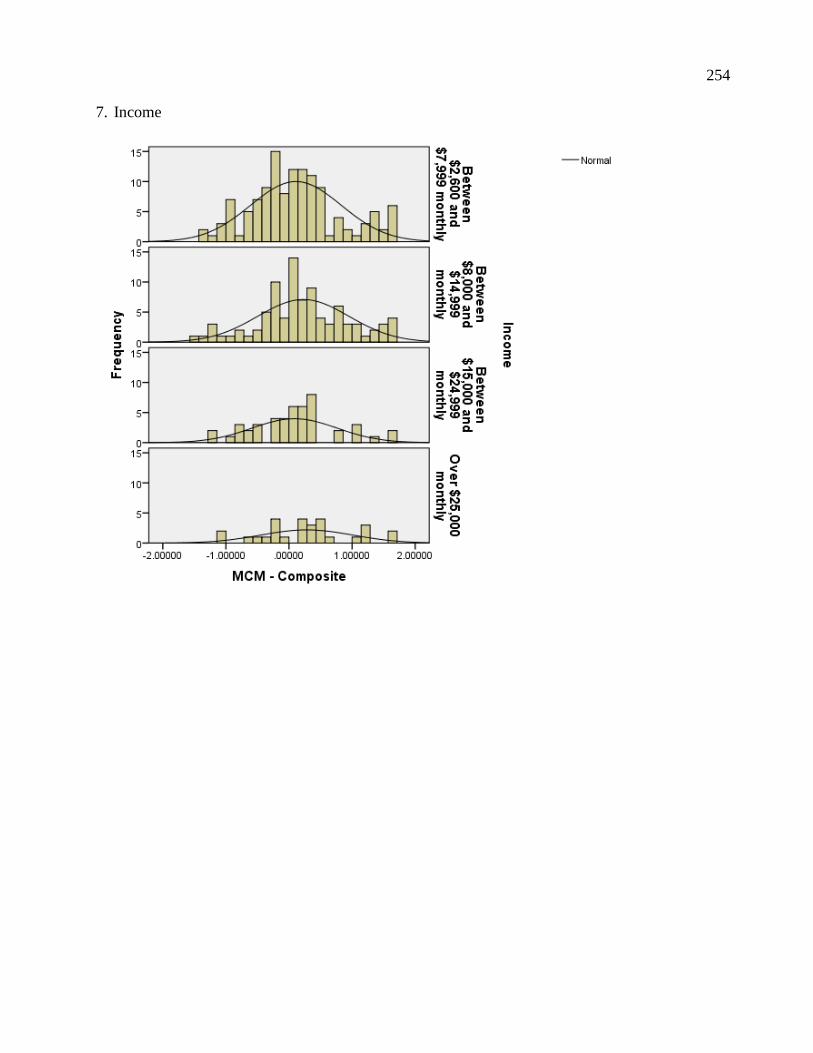
254
7. Income
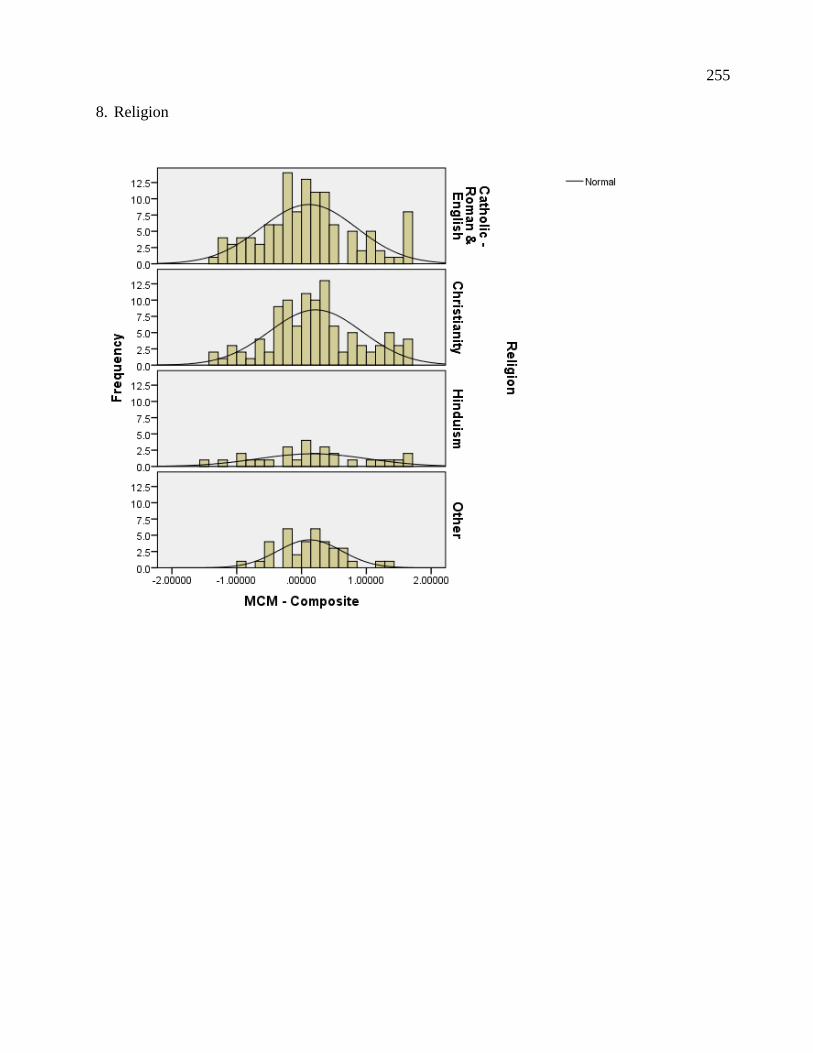
255
8. Religion
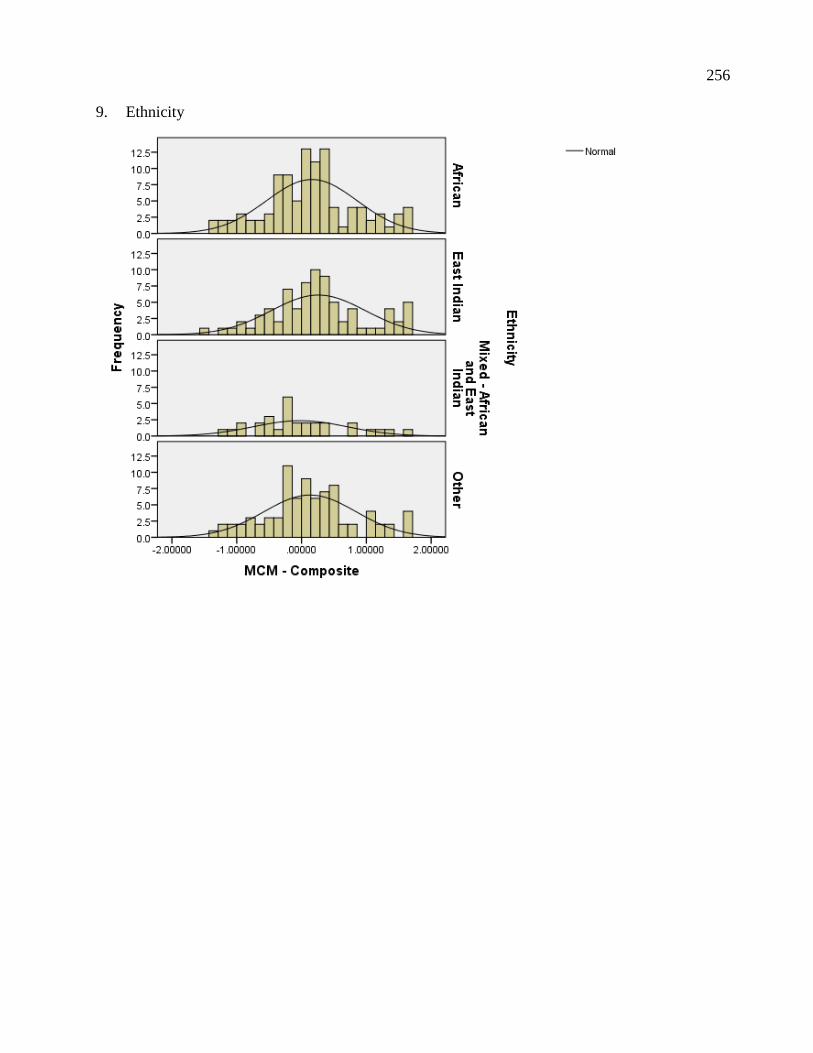
256
9. Ethnicity
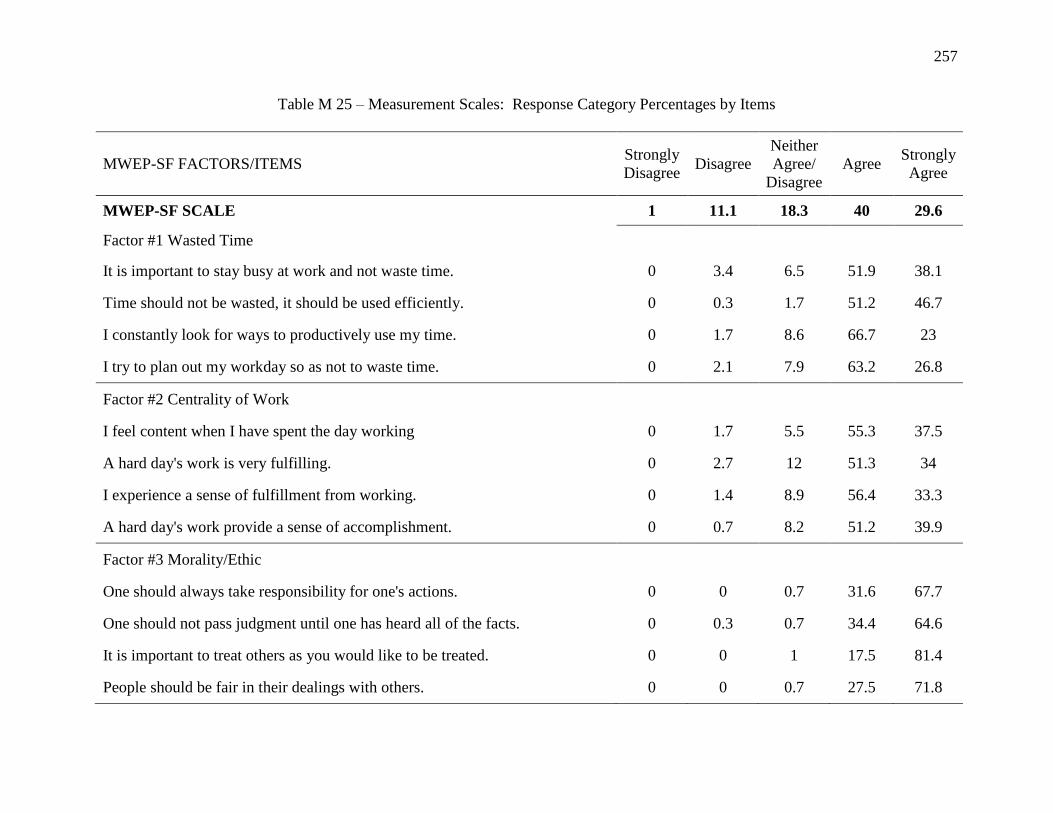
257
Table M 25 – Measurement Scales: Response Category Percentages by Items
MWEP-SF FACTORS/ITEMS Strongly
Disagree Disagree
Neither
Agree/
Disagree
Agree Strongly
Agree
MWEP-SF SCALE 1 11.1 18.3 40 29.6
Factor #1 Wasted Time
It is important to stay busy at work and not waste time. 0 3.4 6.5 51.9 38.1
Time should not be wasted, it should be used efficiently. 0 0.3 1.7 51.2 46.7
I constantly look for ways to productively use my time. 0 1.7 8.6 66.7 23
I try to plan out my workday so as not to waste time. 0 2.1 7.9 63.2 26.8
Factor #2 Centrality of Work
I feel content when I have spent the day working 0 1.7 5.5 55.3 37.5
A hard day's work is very fulfilling. 0 2.7 12 51.3 34
I experience a sense of fulfillment from working. 0 1.4 8.9 56.4 33.3
A hard day's work provide a sense of accomplishment. 0 0.7 8.2 51.2 39.9
Factor #3 Morality/Ethic
One should always take responsibility for one's actions. 0 0 0.7 31.6 67.7
One should not pass judgment until one has heard all of the facts. 0 0.3 0.7 34.4 64.6
It is important to treat others as you would like to be treated. 0 0 1 17.5 81.4
People should be fair in their dealings with others. 0 0 0.7 27.5 71.8
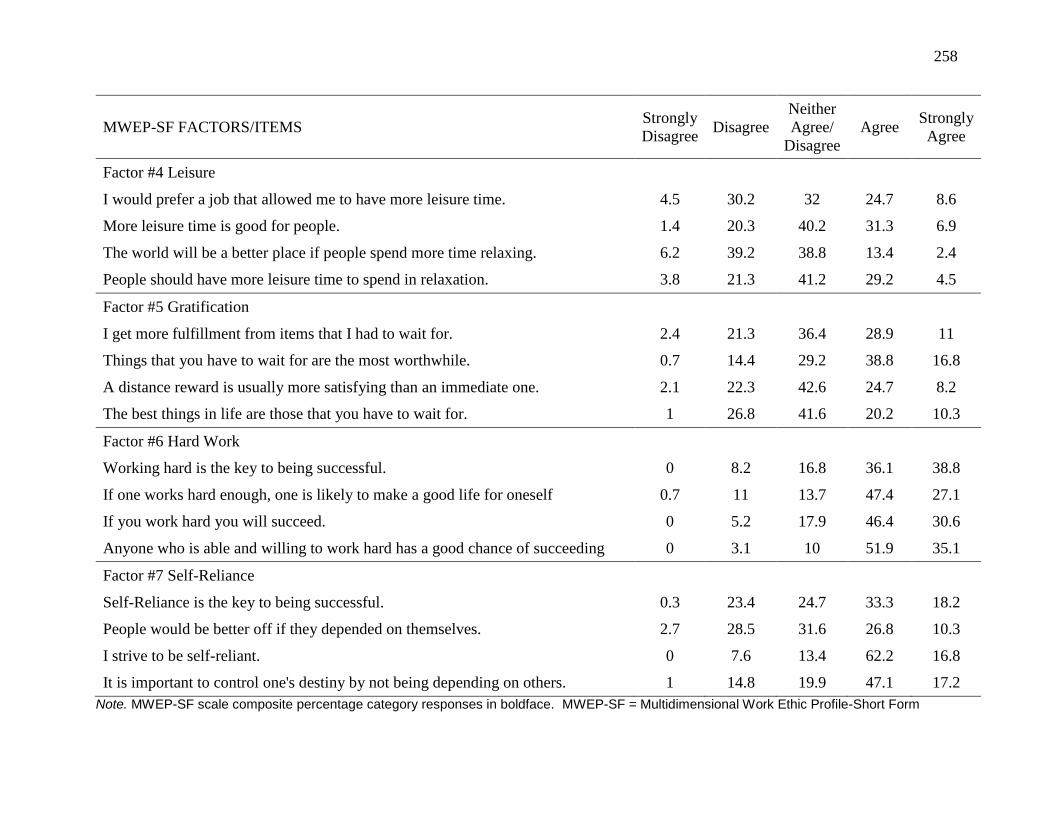
258
MWEP-SF FACTORS/ITEMS Strongly
Disagree Disagree
Neither
Agree/
Disagree
Agree Strongly
Agree
Factor #4 Leisure
I would prefer a job that allowed me to have more leisure time. 4.5 30.2 32 24.7 8.6
More leisure time is good for people. 1.4 20.3 40.2 31.3 6.9
The world will be a better place if people spend more time relaxing. 6.2 39.2 38.8 13.4 2.4
People should have more leisure time to spend in relaxation. 3.8 21.3 41.2 29.2 4.5
Factor #5 Gratification
I get more fulfillment from items that I had to wait for. 2.4 21.3 36.4 28.9 11
Things that you have to wait for are the most worthwhile. 0.7 14.4 29.2 38.8 16.8
A distance reward is usually more satisfying than an immediate one. 2.1 22.3 42.6 24.7 8.2
The best things in life are those that you have to wait for. 1 26.8 41.6 20.2 10.3
Factor #6 Hard Work
Working hard is the key to being successful. 0 8.2 16.8 36.1 38.8
If one works hard enough, one is likely to make a good life for oneself 0.7 11 13.7 47.4 27.1
If you work hard you will succeed. 0 5.2 17.9 46.4 30.6
Anyone who is able and willing to work hard has a good chance of succeeding 0 3.1 10 51.9 35.1
Factor #7 Self-Reliance
Self-Reliance is the key to being successful. 0.3 23.4 24.7 33.3 18.2
People would be better off if they depended on themselves. 2.7 28.5 31.6 26.8 10.3
I strive to be self-reliant. 0 7.6 13.4 62.2 16.8
It is important to control one's destiny by not being depending on others. 1 14.8 19.9 47.1 17.2
Note. MWEP-SF scale composite percentage category responses in boldface. MWEP-SF = Multidimensional Work Ethic Profile-Short Form
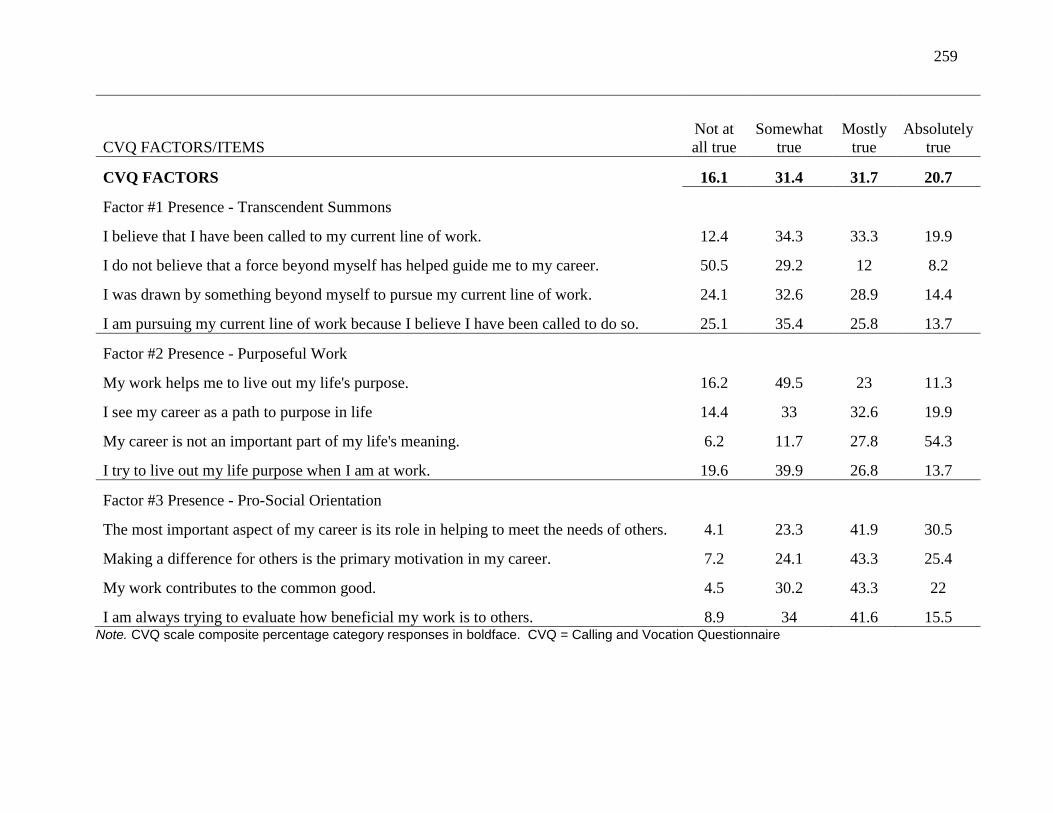
259
CVQ FACTORS/ITEMS
Not at
all true
Somewhat
true
Mostly
true
Absolutely
true
CVQ FACTORS 16.1 31.4 31.7 20.7
Factor #1 Presence - Transcendent Summons
I believe that I have been called to my current line of work. 12.4 34.3 33.3 19.9
I do not believe that a force beyond myself has helped guide me to my career. 50.5 29.2 12 8.2
I was drawn by something beyond myself to pursue my current line of work. 24.1 32.6 28.9 14.4
I am pursuing my current line of work because I believe I have been called to do so. 25.1 35.4 25.8 13.7
Factor #2 Presence - Purposeful Work
My work helps me to live out my life's purpose. 16.2 49.5 23 11.3
I see my career as a path to purpose in life 14.4 33 32.6 19.9
My career is not an important part of my life's meaning. 6.2 11.7 27.8 54.3
I try to live out my life purpose when I am at work. 19.6 39.9 26.8 13.7
Factor #3 Presence - Pro-Social Orientation
The most important aspect of my career is its role in helping to meet the needs of others. 4.1 23.3 41.9 30.5
Making a difference for others is the primary motivation in my career. 7.2 24.1 43.3 25.4
My work contributes to the common good. 4.5 30.2 43.3 22
I am always trying to evaluate how beneficial my work is to others. 8.9 34 41.6 15.5 Note. CVQ scale composite percentage category responses in boldface. CVQ = Calling and Vocation Questionnaire
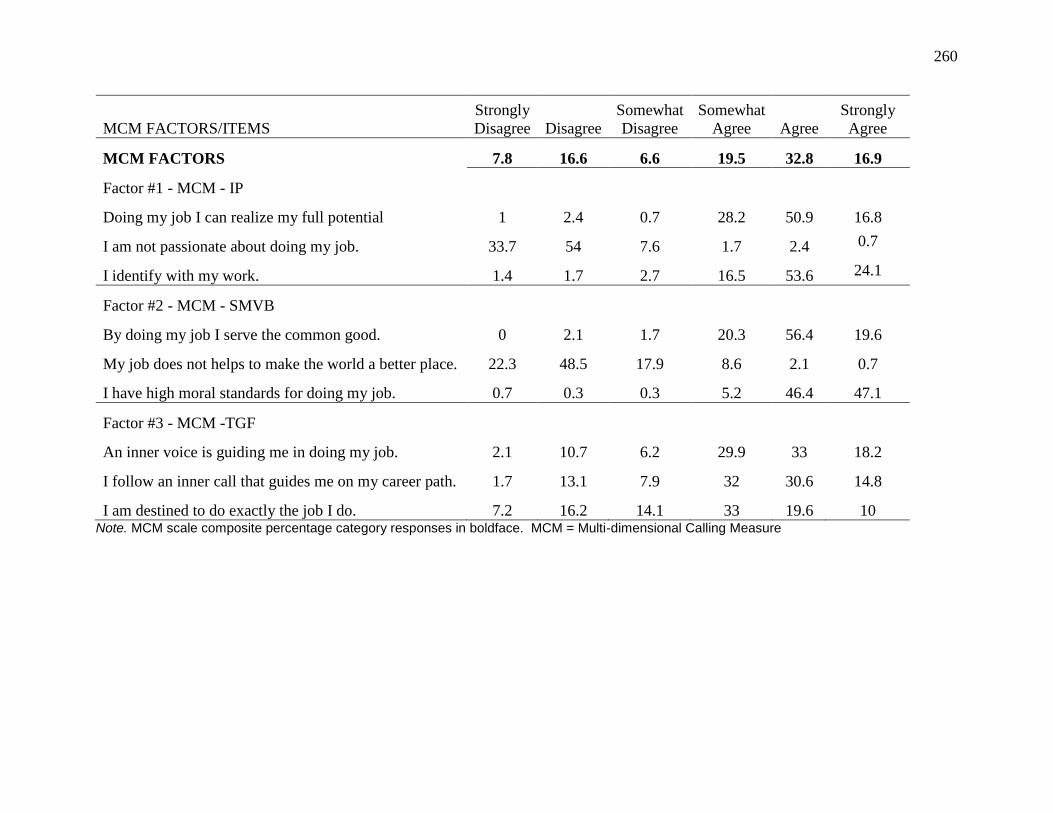
260
MCM FACTORS/ITEMS
Strongly
Disagree Disagree
Somewhat
Disagree
Somewhat
Agree Agree
Strongly
Agree
MCM FACTORS 7.8 16.6 6.6 19.5 32.8 16.9
Factor #1 - MCM - IP
Doing my job I can realize my full potential 1 2.4 0.7 28.2 50.9 16.8
I am not passionate about doing my job. 33.7 54 7.6 1.7 2.4 0.7
I identify with my work. 1.4 1.7 2.7 16.5 53.6 24.1
Factor #2 - MCM - SMVB
By doing my job I serve the common good. 0 2.1 1.7 20.3 56.4 19.6
My job does not helps to make the world a better place. 22.3 48.5 17.9 8.6 2.1 0.7
I have high moral standards for doing my job. 0.7 0.3 0.3 5.2 46.4 47.1
Factor #3 - MCM -TGF
An inner voice is guiding me in doing my job. 2.1 10.7 6.2 29.9 33 18.2
I follow an inner call that guides me on my career path. 1.7 13.1 7.9 32 30.6 14.8
I am destined to do exactly the job I do. 7.2 16.2 14.1 33 19.6 10 Note. MCM scale composite percentage category responses in boldface. MCM = Multi-dimensional Calling Measure
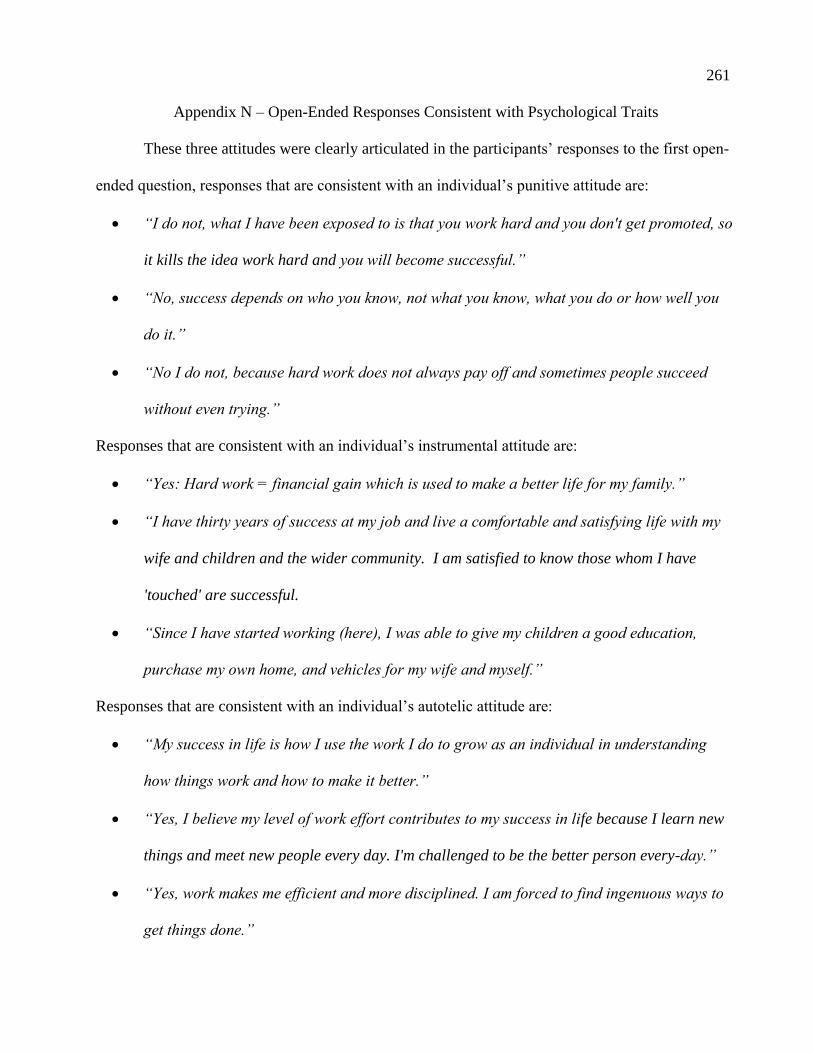
261
Appendix N – Open-Ended Responses Consistent with Psychological Traits
These three attitudes were clearly articulated in the participants’ responses to the first open-
ended question, responses that are consistent with an individual’s punitive attitude are:
“I do not, what I have been exposed to is that you work hard and you don't get promoted, so
it kills the idea work hard and you will become successful.”
“No, success depends on who you know, not what you know, what you do or how well you
do it.”
“No I do not, because hard work does not always pay off and sometimes people succeed
without even trying.”
Responses that are consistent with an individual’s instrumental attitude are:
“Yes: Hard work = financial gain which is used to make a better life for my family.”
“I have thirty years of success at my job and live a comfortable and satisfying life with my
wife and children and the wider community. I am satisfied to know those whom I have
'touched' are successful.
“Since I have started working (here), I was able to give my children a good education,
purchase my own home, and vehicles for my wife and myself.”
Responses that are consistent with an individual’s autotelic attitude are:
“My success in life is how I use the work I do to grow as an individual in understanding
how things work and how to make it better.”
“Yes, I believe my level of work effort contributes to my success in life because I learn new
things and meet new people every day. I'm challenged to be the better person every-day.”
“Yes, work makes me efficient and more disciplined. I am forced to find ingenuous ways to
get things done.”