Embed Size (px)
Citation preview
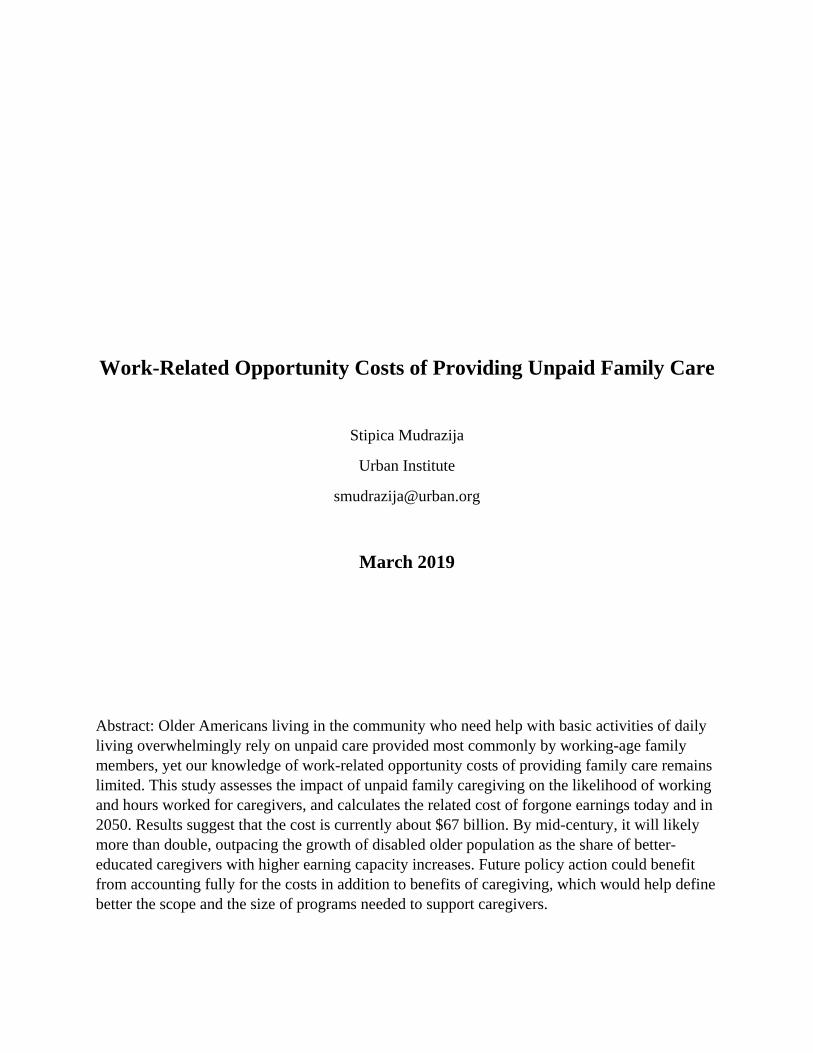
Work-Related Opportunity Costs of Providing Unpaid Family Care
Stipica Mudrazija
Urban Institute
March 2019
Abstract: Older Americans living in the community who need help with basic activities of daily living overwhelmingly rely on unpaid care provided most commonly by working-age family members, yet our knowledge of work-related opportunity costs of providing family care remains limited. This study assesses the impact of unpaid family caregiving on the likelihood of working and hours worked for caregivers, and calculates the related cost of forgone earnings today and in 2050. Results suggest that the cost is currently about $67 billion. By mid-century, it will likely more than double, outpacing the growth of disabled older population as the share of better-educated caregivers with higher earning capacity increases. Future policy action could benefit from accounting fully for the costs in addition to benefits of caregiving, which would help define better the scope and the size of programs needed to support caregivers.
Acknowledgments
This working paper was made possible by the US 2050 project, supported by the Peter G. Peterson Foundation and the Ford Foundation. The statements made and views expressed are solely the responsibility of the author.
This working paper uses output from the Urban Institute’s Dynamic Simulation of Income Model 4 (DYNASIM4). Karen Smith and Melissa Favreault direct DYNASIM4 development. Douglas Murray was DYNASIM4’s lead programmer from 1998 through 2017, and Damir Cosic has been lead programmer since 2018. Current and recent funders of DYNASIM4 include the US Department of Labor, AARP, Alfred P. Sloan Foundation, Andrew W. Mellon Foundation, Ford Foundation, Kaiser Family Foundation, National Institute on Aging, Office of the Assistant Secretary for Planning and Evaluation at the US Department of Health and Human Services, Rockefeller Foundation, SCAN Foundation, and the Social Security Administration.
1
Introduction
As the US population ages, the nation faces an unprecedented increase in the number of
older people with long-term health problems and related care needs. Currently, about 10 million
Americans aged 65 and older living in the community need help with basic activities of daily
living, such as bathing, walking, or eating, and increasing number of older adults suffer from
cognitive impairments such as Alzheimer’s disease and other dementias (Freedman and Spillman
2014). These individuals overwhelmingly rely on unpaid help and care provided by family and
friends, most commonly by working-age children (Spillman et al 2014). In 2011, for example,
about 95 percent of noninstitutionalized older adults with long-term services and supports
(LTSS) needs received at least some unpaid help and care, and such support accounted for
roughly three-quarters of all help and care time received by this population (Spillman et al 2014).
Over the next 50 years, the number of older Americans with disabilities is projected to
increase by about two and a half times (Favreault and Dey 2015). The increase will likely be
particularly strong for advanced old-age adults; their number will rise at a faster pace than for
any other age group and their LTSS needs are higher than among the younger population. On the
other hand, the number of potential caregivers will increase more slowly (Redfoot et al 2013).
These demographic trends, coupled with older adults’ preference to age in place and receive care
from family and friends (Reinhard 2010), suggest that we can expect a substantial increase in the
share of working-age adults providing essential care to their frail parents and other family
members. Recent analysis shows that, after declining in the 1980s and 1990s, the propensity to
provide informal family care may already be increasing, although only modestly so far (Janus
and Doty 2018).
2
While the majority of caregivers finds satisfaction in the fact that they are able to take
care of their family member or a friend in need (Spillman et al 2014), they may also experience
various adverse consequences of providing care. Caregivers are more likely to be in poorer
physical and mental health and experience emotional and financial difficulties than non-
caregivers (National Alliance for Caregiving and AARP Public Policy Institute 2015; Pinquart
and Sorensen 2003; Wolff et al 2016). Economic impacts of caregiving on caregivers primarily
stem from work-related implications of providing informal care as it raises the prospect for
caregivers to either stop working, reduce work hours, or change jobs, often accepting lower pay.
Apart from earning less, these caregivers may also suffer other consequences such as loss of
employer-sponsored health insurance.
Previous analyses of the economic impacts of family caregiving, however, have mostly
focused on estimating its economic benefits because unpaid family care limits the demand for
costly nursing facilities and reduces expenses paid by Medicaid and other government programs.
The limited literature focused on informal caregivers’ work-related outcomes reports some
adverse impact of providing family care on labor market participation and, to a lesser extent,
hours worked and productivity. Due to data and methodological limitations, however, the
economic valuation of the work-related impact of caregiving on caregivers remains largely
unknown.
Even if the negative impacts of providing family care have been limited thus far, they
may increase over time as the number of older adults in need of support grows and declining
family sizes reduce the availability of family caregivers. To the extent that caregivers are at least
in part selected on their ability to work and their earning capacity, this implies that future cohorts
of family caregivers will likely include a higher share of workers and people with higher earning
3
capacity. Insofar as some of them stop working or scale back their work effort due to caregiving
activities, future level of related forgone earnings, that is, work-related opportunity costs, might
increase substantially.
This paper addresses the following research questions:
1. What is the impact of family caregiving on the likelihood of working and hours worked
among working-age family caregivers?
2. What is the work-related opportunity cost of providing family care in the United States
now, and how will it change by 2050?
Given rising demand for LTSS in the coming years, improving our knowledge of these issues has
important policy implications. While federal and state governments faced with fiscal challenges
may rely on families to provide much of the necessary additional care for the growing population
of older adults, such care imposes an economic cost on caregivers and, by extension, the
government, because caregivers earn less and pay less taxes. As the share of the working-age
population required to provide care to older adults increases, the economic cost of doing so may
increase more than proportionately, making it increasingly important for governments to
carefully weigh the costs and benefits of informal caregiving and the appropriate types and levels
of public support for family caregivers.
Literature Review
Research consistently shows that unpaid family caregiving provides important economic
benefits to society by reducing public and private spending on LTSS (e.g., Charles and Sevak
2005; Lo Sasso and Johnson 2002). However, the estimates of the total value of such care for the
society vary substantially, primarily due to two factors: 1) different definitions of who should be
4
counted as a caregiver, and 2) different valuations of caregiving time. For example, due to issues
such as various survey sampling frames, reference periods, respondents’ role (i.e., caregiver or
care recipient), and treatment of non-primary caregivers, estimates over the past two decades of
the number of caregivers for adults ages 65 and older from nationally representative data have
varied from less than 3 million to more than 36 million (Giovannetti and Wolff 2010).1 How
caregiving time is valued—most commonly at wage levels ranging from the legal minimum
wage to caregivers’ actual or assumed market wage, and wages implied by replacing unpaid care
with skilled nursing home care—can substantially impact the estimates. For example, Chari and
colleagues (2015) estimate the value of family caregiving to be $522 billion, with the cost of
replacing it with paid care ranging from $221 to $642 billion. Reinhard et al.’s (2015) estimate of
the total value of informal care in 2013 for persons with activities of daily living (ADL)
limitations of $470 billion falls within this range.
Beyond the already cited issues, however, these studies fail to account for several
additional important elements for the correct calculation, or at least approximation, of the net
economic benefits of informal caregiving. These include the possible higher efficiency of paid
caregivers and the reduced time they need to provide the same level of care, care recipients’
possible decision to consume less care if they had to pay for it (but only to the extent that it
would not compromise the adequacy of care), and the negative effects of care provision on
caregivers’ employment and health outcomes, which in turn adversely impact government tax
receipts and outlays for various social programs. Accounting for these different costs of
providing unpaid family care might substantially reduce the estimated net benefit of such care, at
1 The data source used in this research, National Study of Caregiving, puts the estimate of the number of unpaid informal caregivers who provided care to Medicare-eligible adults aged 65 and older in the month prior to the interview at 18 million in 2011 (Spillman et al 2014).
5
least for some categories of caregivers, such as those who provide intensive caregiving (Jacobs et
al 2013). However, reliable estimates of these costs of unpaid caregiving are still very limited,
and this study is among the first to attempt to partly address this knowledge gap by providing
economic valuation of work-related costs of unpaid caregiving and assessing how they may
change in the coming decades. One prior study that addressed this issue estimated a fairly modest
impact of caregiving on caregivers’ earnings of less than $30 billion annually (Mudrazija and
Johnson forthcoming). However, this estimate did not directly compare outcomes of caregivers
with non-caregivers of similar characteristics, but rather relied on a number of assumptions based
on the findings from the literature for relevant parameters used in the calculations. It was also not
able to account fully for the possible impact of caregiving on the hours of work for employed
caregivers.
While the economic valuations of costs of unpaid family caregiving are limited, previous
research has focused more on assessing the negative impact of providing care on employment, in
particular with respect to the likelihood of working and hours worked. Much of the research
focuses on establishing whether the observed lower likelihood of working and fewer hours
worked for caregivers can be attributed to their caregiving activities or if they are related to other
characteristics of caregivers such as possible self-selection based on weaker labor-force
attachment or lower earning potential. Overall, the literature mostly supports the conclusion that
caregiving adversely impacts the likelihood of working, although the findings vary for different
groups of caregivers and there is no general agreement on the magnitude of the effect. Estimates
range from a 3.4 percentage point lower likelihood of work for women in the United States aged
51-70 who provide intensive care (Butrica and Karamcheva 2014) to a 12 percentage point
difference for both women and men aged 25-64 who are primary caregivers in Australia (Nguyen
6
and Connelly 2014). The adverse impact appears to be stronger for primary than secondary
caregivers (Wakabayashi et al 2005) and intensive than non-intensive caregivers (Jacobs et al
2014), whereas a gender difference is not consistently found (Bolin et al 2008; Butrica and
Karamcheva 2014; Nguyen and Connelly 2014).
With respect to hours worked, findings are less conclusive, although there is some
tentative evidence of a possible negative impact of caregiving. For example, Van Houtven et al.
(2013) estimate that women aged 51-70 work between 3 and 10 hours per week less when
providing care, while Johnson and Lo Sasso (2006) find an annual decrease of 174 hours of work
for women aged 57-67 providing care to their parents, which is consistent with a weekly
reduction of almost 3.5 hours. Other studies, however, find no statistically significant effect on
hours worked (Bolin et al 2008; Butrica and Karamcheva 2014), or find them to be limited to
certain groups such as men providing intensive care (e.g., Lilly et al 2010).
Beyond the likelihood of working and hours worked, the literature on the work-related
impact of caregiving is much more limited. Work productivity may be adversely impacted by
caregiving, given that the majority of employed caregivers report having had to make some type
of work adjustments (e.g., change their work schedule or take time off or a leave of absence),
although relatively few report having received negative feedback regarding their work
performance (National Alliance for Caregiving and AARP Public Policy Institute 2015). In cases
where caregiving may be particularly challenging, such as caring for somebody with advanced
cancer, work productivity is likely to decline substantially (Mazanec et al 2011). However, there
is still no sufficient evidence to claim that caregiving more broadly has a negative impact on
productivity. Similarly, studies exploring the impact of caregiving on earnings of caregivers find
little or no evidence that caregiving negatively impacts earnings beyond the impact on hours of
7
work, controlling for personal characteristics (e.g. Butrica and Karamcheva 2014; Heitmeuller
and Inglis 2007; Van Houtven et al 2013).
Data and Methods
Data
Data on family caregivers come from the 2011 and 2015 waves of the National Study of
Caregiving (NSOC), a nationally representative supplement to the National Health and Aging
Trends Study (NHATS), which collects information on family caregivers to Medicare
beneficiaries aged 65 and older.2 The survey includes data on the type, duration and intensity of
help caregivers provided, possible effects of caregiving on caregivers, support services they may
have used, and basic demographic and socioeconomic data, including work-related information.
Caregivers are identified by the NHATS respondents during the interview and subsequently
contacted. If a respondent identifies more than five caregivers, the survey randomly selects five
caregivers for interview. In 2011 and 2015, the NSOC collected information on 2,007 and 2,204
caregivers, respectively. Sample weights account for survey non-response as well as differential
probabilities of selection into the sample. While the NHATS is an annual longitudinal survey
that by design follows the same persons over time (adding new persons only to keep the sample
nationally representative), the NSOC was not designed as a longitudinal survey. Therefore, the
NSOC has information on 3,881 unique caregivers of whom only a small fraction was
interviewed at both waves. The analytic sample for this survey includes a pooled sample of 2,385
2 Medicare covers all adults aged 65 and older (as well as people with disabilities), except those who did not meet the program’s work requirement and are not married to someone who met the work requirement, and foreign-born people who are neither US citizens nor permanent residents.
8
caregivers aged 20-64 with available information on their labor force status and hours worked for
those who are working.3,4 The NSOC data is supplemented with the relevant information on care
recipients from the NHATS, including their age, race/ethnicity, and education.
Data on non-caregivers come from the 2013 wave of the Panel Study of Income
Dynamics (PSID), a nationally representative longitudinal panel survey of US families. The key
information on the provision of time support to parents comes from the 2013 Rosters and
Transfers module and is supplemented with sociodemographic and health information from the
main survey, including information on labor force status and hours worked.5 6 The final sample
includes 7,020 heads and spouses aged 20-64 who reported no provision of help to parents.7 8
3 For 205 caregivers who were interviewed in both waves, I use information reported in 2011. As a sensitivity test, I repeat the analysis replacing their 2011 with 2015 information. Results remain consistent. 4 Thirty-eight individuals, including 21 adult children, are missing information on the outcomes of interest. I do not impute this information, but impute information on other variables of interest when missing using multiple imputations by chained equations. Except for the household income variable that has about one fifth of observations missing, other variables of interest have either no or only a small number of observations missing. The only variable that is handled differently is race/ethnicity. In 2011, the survey did not elicit this information from caregivers, but only care recipients. Therefore, I use 2015 information for all caregivers interviewed at that wave and otherwise assume that biological children and siblings share the NHATS respondents’ race/ethnicity. For the remaining 2011 caregivers, such as spouses and non-kin, the values are imputed following the same procedure as for other predictors with imputed values. 5 The reference periods in the two surveys are somewhat different. While the NSOC asks about working in the prior week, PSID asks about working at the time of the interview. Similarly, the NSOC asks about hours worked in the prior week, whereas PSID asks about average hours worked in the prior year. Given that the NSOC does not make any explicit reference to overtime hours, the analysis in this study relies on a more conservative PSID measure of hours worked that leaves out any overtime hours worked. 6 While the design of the PSID questionnaire allows identifying non-helpers, it is not appropriate for identifying helpers to parents (or other family members) for health or functioning reasons as it does not distinguish this type of help from other types of practical help. Therefore, it is not possible to analyze work-related impacts of caregiving using the PSID data only. 7 Of them, 5,575 had a living parent. To test the sensitivity of the matching estimates from the main analysis, I repeat it with this subsample of non-caregivers. The results remain consistent. 8 Because the PSID questionnaire elicits information on the provision of time support to parents only, it is possible that some persons in the non-caregiver sample provide care to others. However, as about three-quarters of working-age caregivers to older adults are children and the prevalence of caregiving for this population is 6.7 percent (Table 1), no more than 2 percent of the non-caregiver sample might be affected. Given the observed negative impact of caregiving on the likelihood of working and hours worked, this could result in a marginal downward bias of the estimates.
9
Projections of demographic trends, disability, and work-related variables, including labor
force status and hours worked, come from the Urban Institute’s DYNASIM4 microsimulation
model. This model starts with a representative sample of individuals from the 2004 and 2008
Survey of Income and Program Participation and “ages” them in annual increments, simulating
key demographic, economic, and health events over the life cycle. Many of the key demographic
and economic variables are calibrated to the intermediate assumptions of the Social Security and
Medicare Trustees’ Reports (Board of Trustees, Federal Old-Age and Survivors Insurance and
Disability Insurance Trust Funds. 2017; Boards of Trustees of the Federal Hospital Insurance and
Federal Supplementary Medical Insurance Trust Funds 2017). The model’s projections on older
adults’ health and disability use information from various nationally representative surveys,
including the Health and Retirement Study and the NHATS. While DYNASIM has been
extensively validated in prior work, its results should be interpreted with caution due to inherent
uncertainties about future outcomes, especially distant ones.9
Analytic Approach
The analysis begins with an overview of the current number and population share of
caregivers aged 20-64 and care recipients aged 65 and older as well as the number and
population share of care recipients and caregivers that would be needed in 2050 if the prevalence
of older adults with LTSS needs who receive unpaid family care remains at its current level. It
then describes the distribution of the population of unpaid caregivers by age, race/ethnicity, and
education, three key demographic characteristics that will significantly change in the future, and
compares caregivers and non-caregivers with respect to the prevalence and intensity of work.
Age is important because workers’ earnings tend to increase over the course of their careers and
9 For further information on DYNASIM, see Favreault et al (2015).
10
better educated workers on average earn more than those with less education. The literature
suggests that race/ethnicity may be an important factor to consider as older non-Hispanic blacks
and Hispanics generally suffer from more functional disabilities and appear to have
comparatively somewhat stronger preference for family care vs. other types of care than non-
Hispanic whites (Angel et al 2016; Thomeer et al 2014).
To estimate the work-related opportunity costs of providing family care, data on family
caregivers from the NSOC are statistically matched to data on non-caregivers from the PSID.
The samples are matched using propensity score matching based on the following
sociodemographic and health characteristics that were comparable across the two surveys: age
(in years), self-rated overall health status (excellent/very good, good, and fair/poor), inverse
hyperbolic sine of the total household income10, and binary predictors for gender, race/ethnicity
(non-Hispanic white vs. other), marital status (married vs. unmarried), education (college degree
or higher vs. less than a college degree), self-rated health, any living children younger than 18,
and any living siblings.11 The matching is conducted both for the full sample of unpaid family
caregivers and separately for eight subgroups of caregivers defined by the basic demographic
characteristics projected to change substantially through 2050, including age (20-49 vs. 50-64),
race/ethnicity, and education, the latter two of which are defined as previously described.12
Using these results, the relevant information on the number of caregivers and the share of them
10 This is an alternative to the logarithmic transformation when a substantial proportion of observations has either zero or negative value. Interpretation of results is similar to log-transformed variables, except for values close to zero (Bugliari et al 2016; Burbidge et al 1988). 11 To check for sensitivity of results to the selection of matching method, I repeat the matching using an alternative matching method, nearest neighbor matching. This analysis yields similar results for the likelihood of working and somewhat lower estimates for the hours worked. Therefore, the results remain broadly consistent. 12 While distinguishing various race/ethnic groups beyond the binary categorization used here would be desirable, small sample sizes preclude reliable estimates of differences in the likelihood of working and hours worked separately for various racial/ethnic subgroups by age and education.
11
who work from the NSOC, and hourly wages, weeks worked per year, and hours worked per
week from the PSID matched sample of non-caregivers, I calculate the approximate work-related
cost of providing unpaid care related both with the lower likelihood of working and fewer hours
worked.
Using information from DYNASIM, the analysis proceeds with an overview of the
demographic change of the working-age and older-adult populations, as well as the relative
changes in population size and likelihood of working for working-age adults, and relative
changes in prevalence of any physical disability for older adults by age groups, race/ethnicity,
and education. To approximate future work-related costs of caregiving, I adjust the calculations
of difference in the likelihood of working and hours worked for each of the eight subgroups for
the present period by using information on the likely increase in the size of each subgroup of
caregivers based on both the change in the size of the corresponding working-age population
subgroups and the size of disabled population by different characteristics. The latter is important
given that disabled parents are not randomly distributed across the eight subgroups of caregivers,
and future changes in disability will not be uniform across all older adults. The final estimate,
then, represents the approximation of the present value of future work-related opportunity costs
of providing care to older adults.
Due to the greater uncertainty surrounding future work-related outcomes than
demographic trends, I use information on hours worked and hourly wage for both the current and
future periods in calculations of future opportunity costs of providing unpaid care. Based on the
available historic evidence, predicting wages several decades in the future is particularly
challenging. For example, between 1979 and 2016, median weekly real earnings for full-time
wage and salary workers in the United States increased by only 4.5 percent, yet moving the
12
reference period to 1980-2017 yields a much higher result, 10.4 percent (U.S. Bureau of Labor
Statistics 2018). Moreover, recent research shows divergent trends in real wages for workers
with different educational attainment. Over the 1979-2017 period, those with a college degree
experienced increases in mean real wages of 5.9 percent, 15.4 percent, and 33.3 percent at 10th,
50th, and 90th percentiles, whereas those with only a high school diploma or less experienced
declines of 5.1 percent, 14.3 percent, and 7.5 percent, respectively (Donovan and Bradley 2018).
I use these insights from the recent literature to test several alternative scenarios for the expected
change in hourly wage in 2050 and effectively establish a range of estimates for the future
opportunity cost of unpaid caregiving.
I also make several simplifying assumptions. First, I assume that the overall provision of
care will increase proportionately with the increase in the population with LTSS needs.
Therefore, unmet care needs will not change. Second, I assume a constant preference for
informal caregiving, disregarding the possibility that the relative prices of alternatives to
informal caregiving—primarily paid home care and nursing homes—may change and thereby
shift the demand for informal caregiving independently of population characteristics. If such a
change would occur, the estimate could be either too high (if the relative price of alternatives
declines) or too low (if it increases). Furthermore, I assume that the relative prices of family and
paid care will remain broadly constant. While the available data on the trends in the cost of paid
care (Genworth 2018) and wages (Federal Reserve Bank of Atlanta 2019) and incomes (U.S.
Bureau of Economic Analysis 2019) over the last fifteen years suggest that this is a reasonable
approximation overall, trends may differ if focusing on particular subpopulations and types of
paid care.13 Finally, I assume that the relative difference between profiles of care recipients for
13 The average annual increase in the prices of paid care ranged from 1.5 percent for home health aides to 3.8 percent for assisted living facilities. In the last five years, the annual increase in the prices of nursing homes (3.4-3.6
13
each of the eight subgroups of caregivers and an average care recipient will remain constant over
time, after accounting for each subgroup’s share of the total population. In other words, while
population profiles by key characteristics of interest will change over time as the nation becomes
older, better educated, and more racially and ethnically diverse, this change will happen for each
of the subgroups commensurately with the change for the population overall.14
Results
Demographic Profile of Caregivers
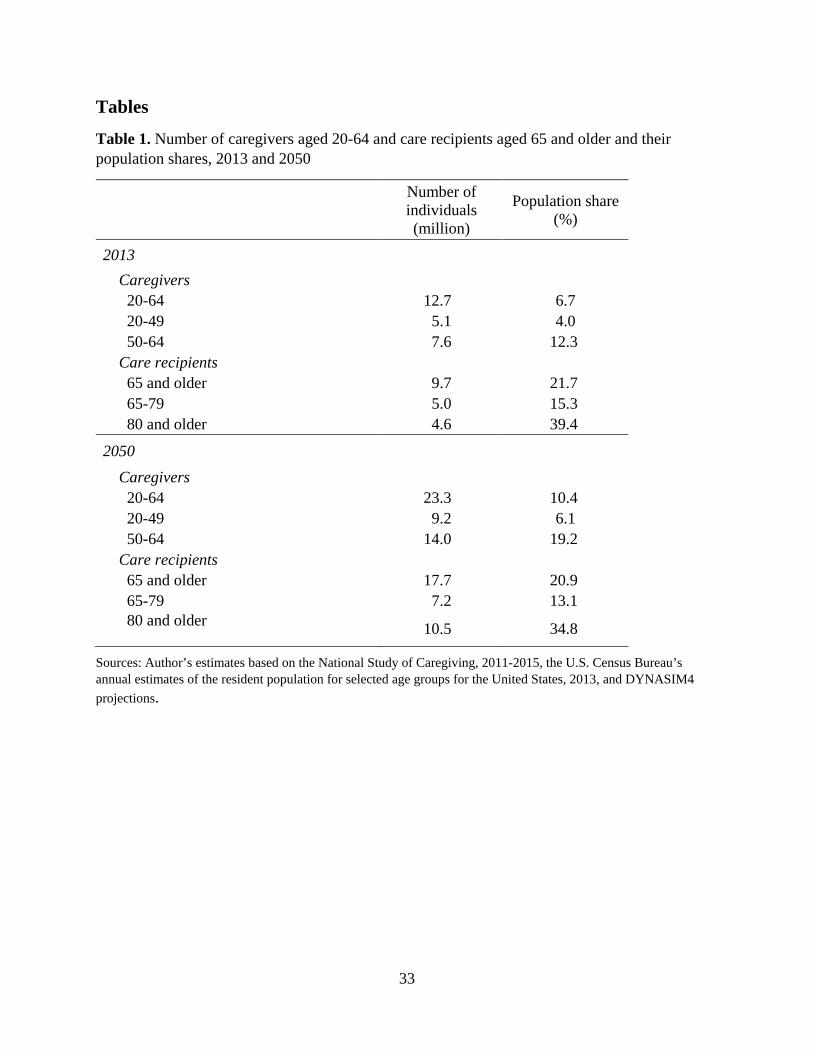
Currently, there are almost 13 million caregivers aged 20-64 providing care to 10 million
older adults with limitations in daily activities (Table 1).15 In addition to the adult children of
care recipients (71%), unpaid working-age caregivers to this population include spouses (5%),
other family members (17%), and nonrelatives (7%). Overall, these caregivers account for 6.7
percent of the population aged 20-64, but the provision of caregiving is highly unequally
percent) outpaced the growth for assisted living facilities (3 percent). Annual increases in wages and incomes over the same period varied between roughly 2 and 4 percent, with the increase generally somewhat higher for younger and better educated workers. 14 To illustrate, we can assume that currently there only two groups of family caregivers, non-Hispanic whites and others, with 75 percent and 25 percent of caregivers, respectively. Among their care recipients, 40 percent and 20 percent, respectively, have college degrees. On average, therefore, 35 percent of all care recipients have college degrees. We can also assume that in the future half of all older adults with disability will have college degrees, but the relative change will be only half as large for older non-Hispanic whites than others. Furthermore, we assume that the shares of working-age non-Hispanic whites and others will become equal in the future. For simplicity, we also assume that disability increases uniformly for all care recipients. In this scenario, therefore, future proportion of care recipients with college degrees will be 60 percent and 40 percent for non-Hispanic whites and others, respectively. The estimated difference in the likelihood of working and hours worked between caregivers and non-caregivers for each of the two groups of caregivers will be reweighted to reflect the change in the future educational composition of older adults. As the number of characteristics of working-age and older adults of interest increases and differences in the increase of disability over time for different older adults are accounted for, the calculations become more complex, but the basic logic of changes commensurate with the underlying compositional changes of the populations of interest remain. 15 This estimate is the average of the estimates for 2011 and 2015, the two years of the NSOC data collection.
14
distributed by age as the majority of caregivers are aged 50-64, and adults in this age group are
more than three times as likely to be caregivers than those aged 20-49.
[Table 1 about here]
Accounting for future population aging and trends in physical disability and adjusting for
compositional changes of the future population, the number of caregivers needed to keep the
current prevalence of unpaid caregiving constant would have to almost double. This implies that
the proportion of unpaid family caregivers to older adults would have to increase by more than a
half to 6.1 percent for adults aged 20-49 and 19.2 percent for those aged 50-64. Simultaneously,
the number of older care recipients would increase by about 8 million, although their share in the
older population would decline slightly as the projected number of older adults with disabilities
would increase somewhat slower than the overall population of older adults.
[Table 2 about here]
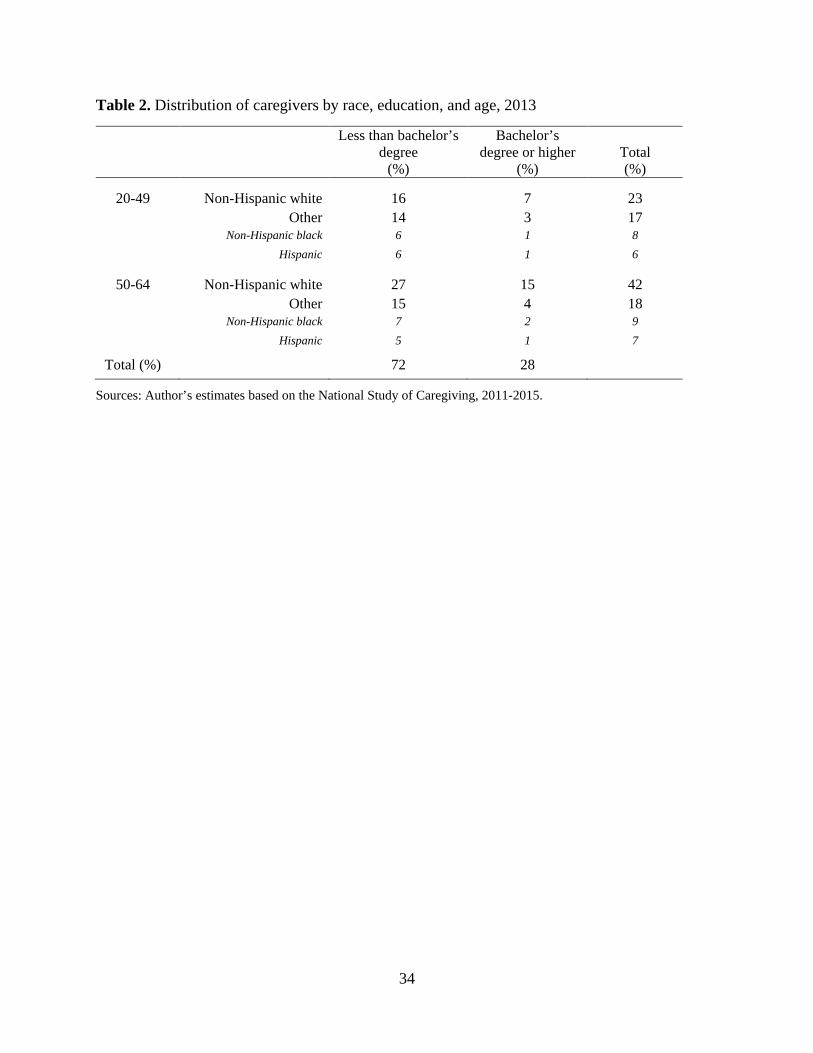
Compositionally, almost two-thirds of unpaid working-age caregivers are non-Hispanic
whites, followed by non-Hispanic blacks and Hispanics who comprise the overwhelming
majority of the subsample of non-whites and Hispanics of any race (Table 2). More than 7 in 10
caregivers have less than a bachelor’s degree. Minority caregivers are much younger than non-
Hispanic white caregivers as almost half of them are aged 20-49 compared to just over one-third
of non-Hispanic whites. They are, regardless of age, comparatively less educated than non-
Hispanic white caregivers.
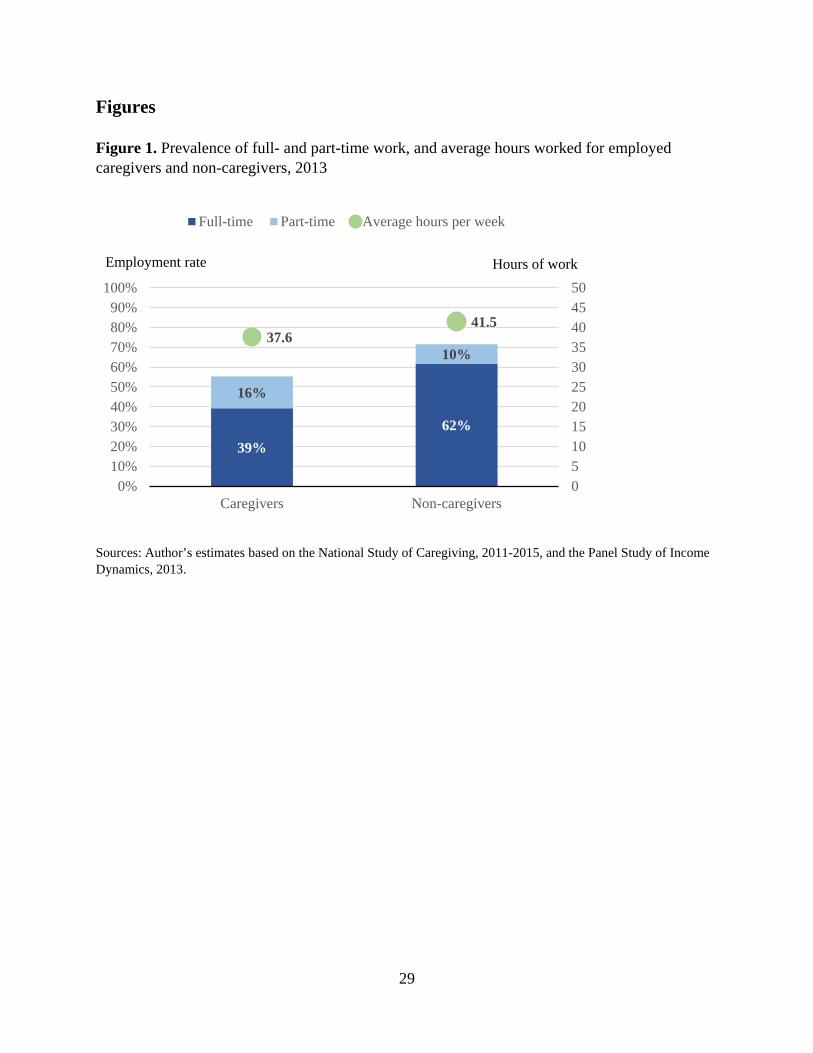
Figure 1 shows the prevalence of full-time and part-time employment for family
caregivers and non-caregivers, as well as hours worked among those who are employed. The
results suggest that non-caregivers are overall much more likely to work than caregivers (16.2
percentage points difference). Moreover, only one in seven employed non-caregivers in the
15
sample works part time compared to one in four employed caregivers. Employed caregivers
work on average 3.9 fewer hours per week than their non-caregiver peers.
[Figure 1 about here]
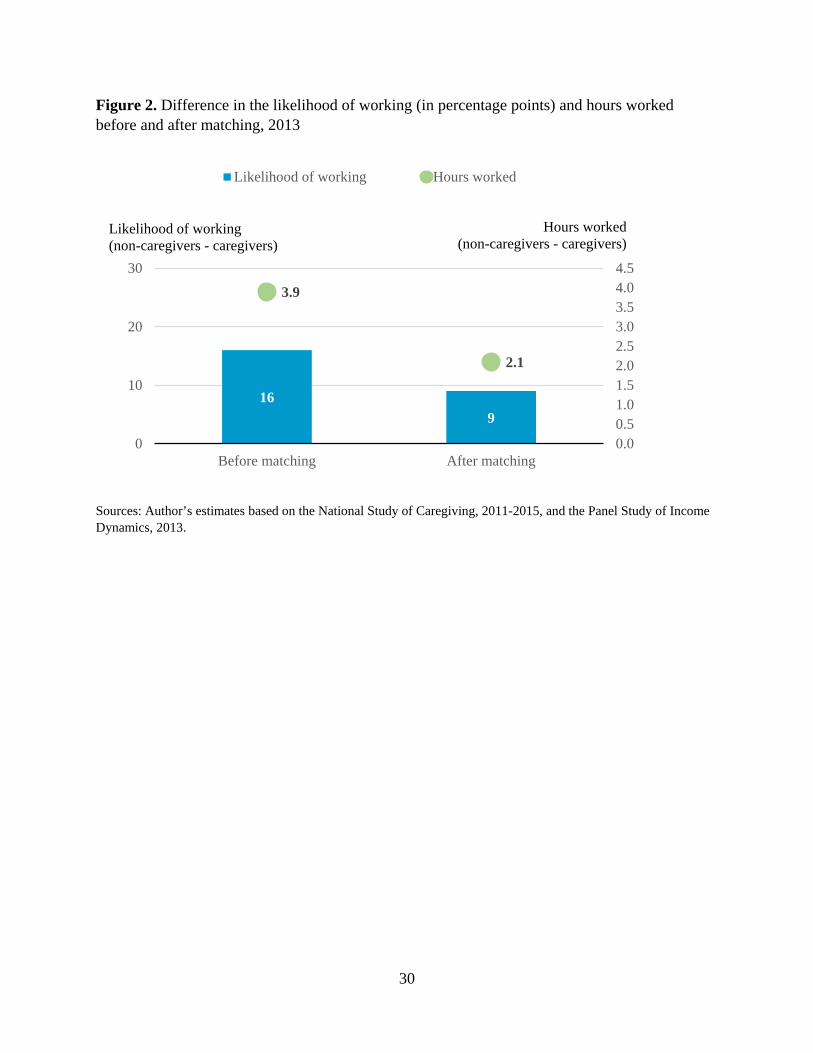
Work-Related Opportunity Costs of Informal Caregiving in 2013
While the difference in work-related outcomes between family caregivers and non-
caregivers is substantial, it is unclear to what extent this reflects the actual impact of caregiving
activities as opposed to self-selection and compositional differences between the two groups that
would make caregivers less likely to work and more likely to work fewer hours even in the
absence of caregiving activities. Results in Figure 2, however, show the difference in work-
related outcomes between caregivers and non-caregivers of similar characteristics. While the
difference narrows substantially, caregivers are still 9 percentage points less likely to work, and
they on average work 2.1 fewer hours per week if employed.
[Figure 2 about here]
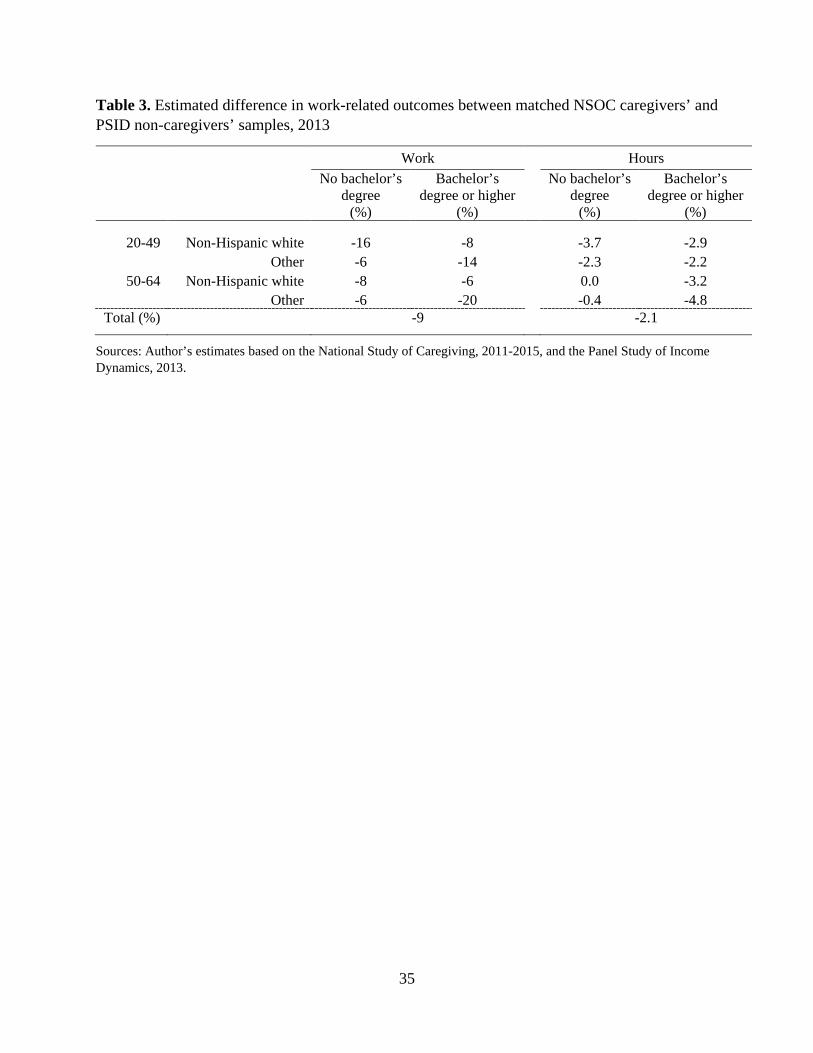
The differences are very uneven across subgroups of caregivers. Overall, the largest
differences in the likelihood of working and hours worked are observed for college-educated
minority adults aged 50-64, followed by non-college-educated non-Hispanic white adults aged
20-49. More generally, the likelihood of working appears to be particularly adversely impacted
for college-educated minority caregivers. At the opposite side of the spectrum, non-college
educated caregivers aged 50-64 exhibit the least work-related impacts overall relative to their
non-caregiver peers.
[Table 3 about here]
Using the estimates of differences in the work-related outcomes for caregivers and non-
caregivers as well as the information on their demographic and work-related characteristics, it is
16
possible to approximate the work-related opportunity costs of providing unpaid family care.
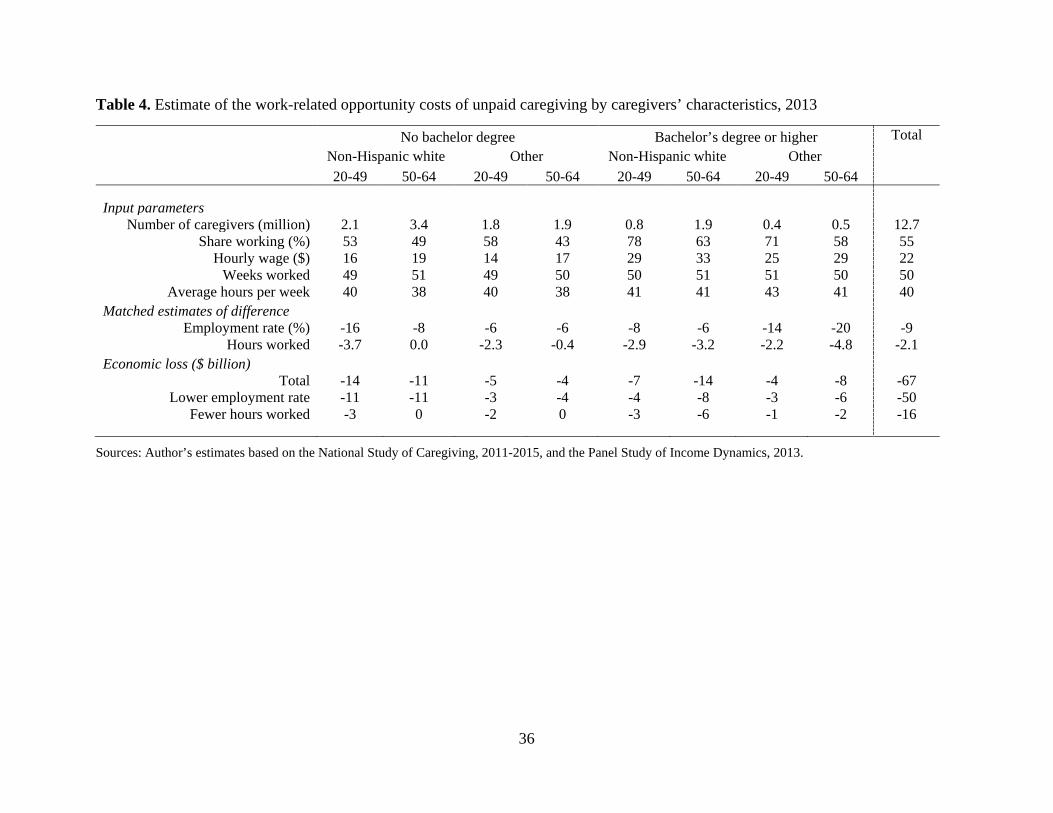
These results are shown in Table 4.
[Table 4 about here]
Assuming that caregivers who are not working would work at the same rate, with the
same intensity, and for the same salary as their matched non-caregiver peers yields an annual
loss from unpaid caregiving of about $50 billion. Once the additional loss attributable to fewer
hours worked is accounted for, the total negative annual impact of caregiving on earnings of
caregivers increases to nearly $67 billion. While the majority of caregivers have less than a
bachelor’s degree, the opportunity costs of providing care are evenly split between those with
more and less education, reflecting higher earnings potential of better educated caregivers.
Younger and non-Hispanic white caregivers have somewhat higher share of opportunity costs
than their share in the population of caregivers, consistent with their higher educational
attainment than their older and minority peers.
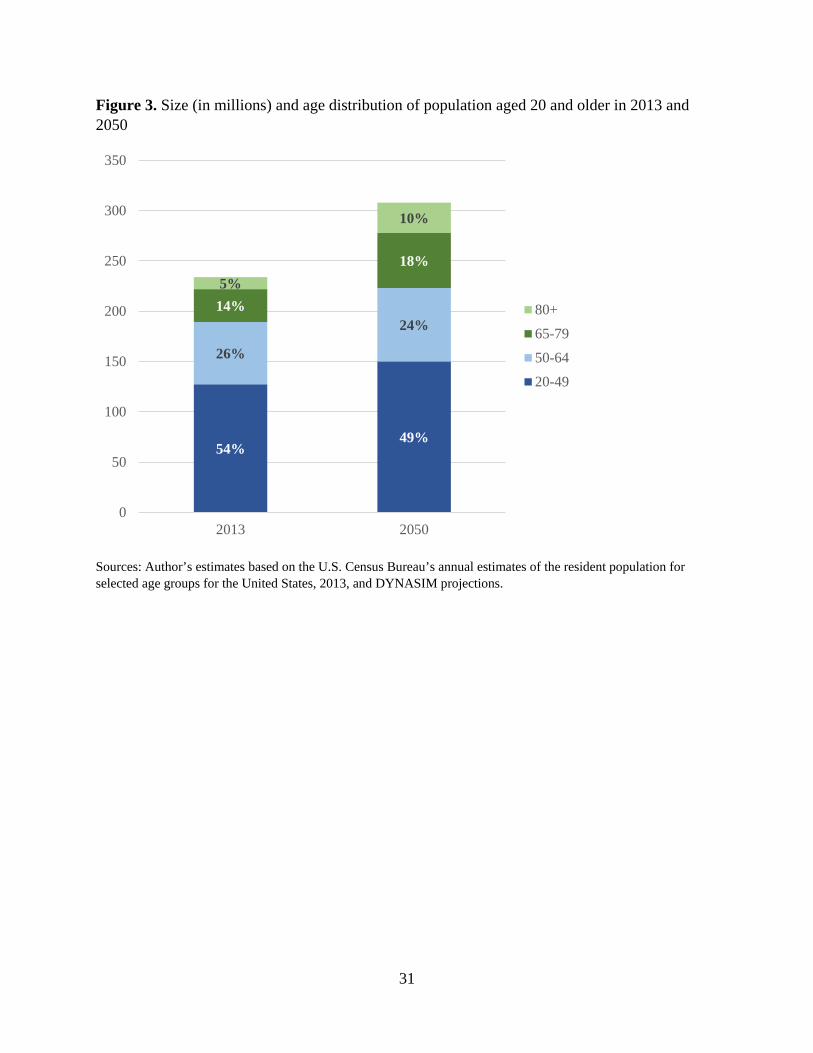
Demographic Change Between 2013 and 2050
Between 2013 and 2050, the U.S. population aged 20 and older will increase by almost
one third (Figure 3). However, this growth will be very uneven as the increase of population
aged 65 and older will be about five times as fast as the increase of population aged 20-64. Even
among the older population, the growth of the advanced old-age adults (aged 80 and older) will
outpace strongly the growth of older adults aged 65-79. These trends will raise the share of the
older population from 19 to 28 percent, including a doubling in the share of those aged 80 and
older, and a corresponding decline in the share of the population aged 20-64.
[Figure 3 about here]
17
While the working-age population will grow moderately, it will experience substantial
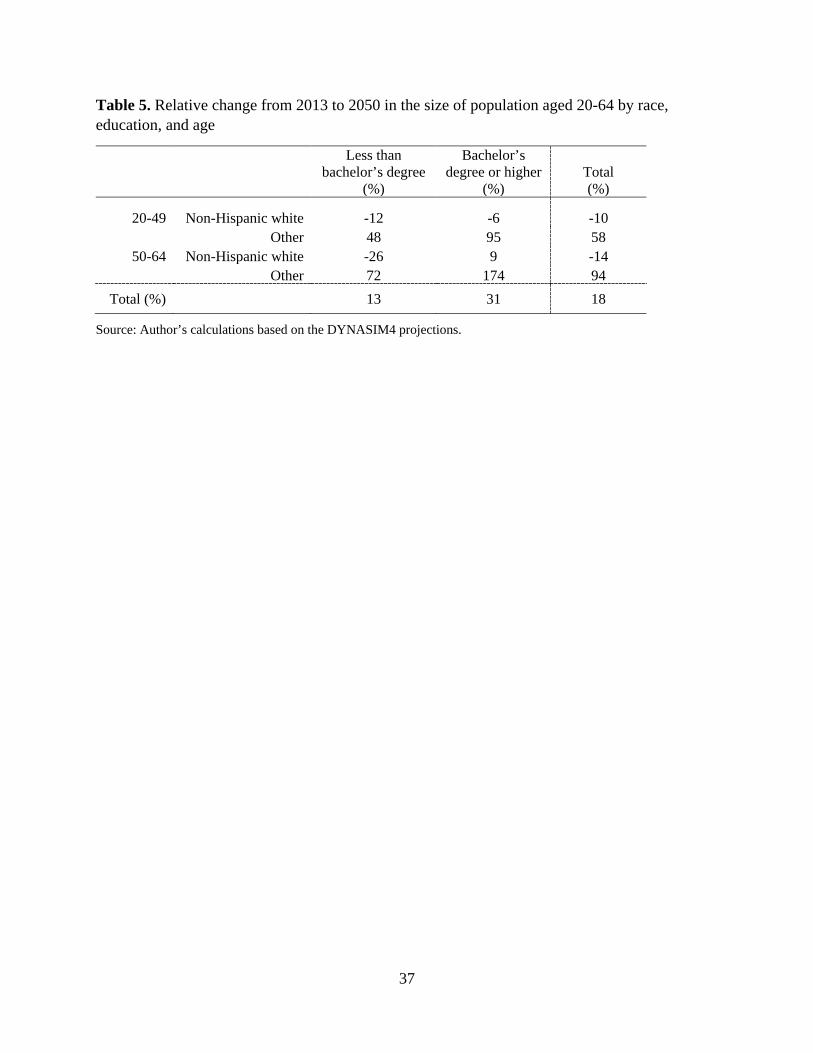
compositional change. As Table 5 shows, this population will become decisively more racially
and ethnically diverse. Moreover, it will be much better educated. Overall, college-educated
minority adults aged 50-64 will experience the strongest growth as their number will almost
triple between 2013 and 2050, followed by their peers aged 20-49 whose number will double.
Conversely, the number of non-college educated non-Hispanic whites will decline substantially.
[Table 5 about here]
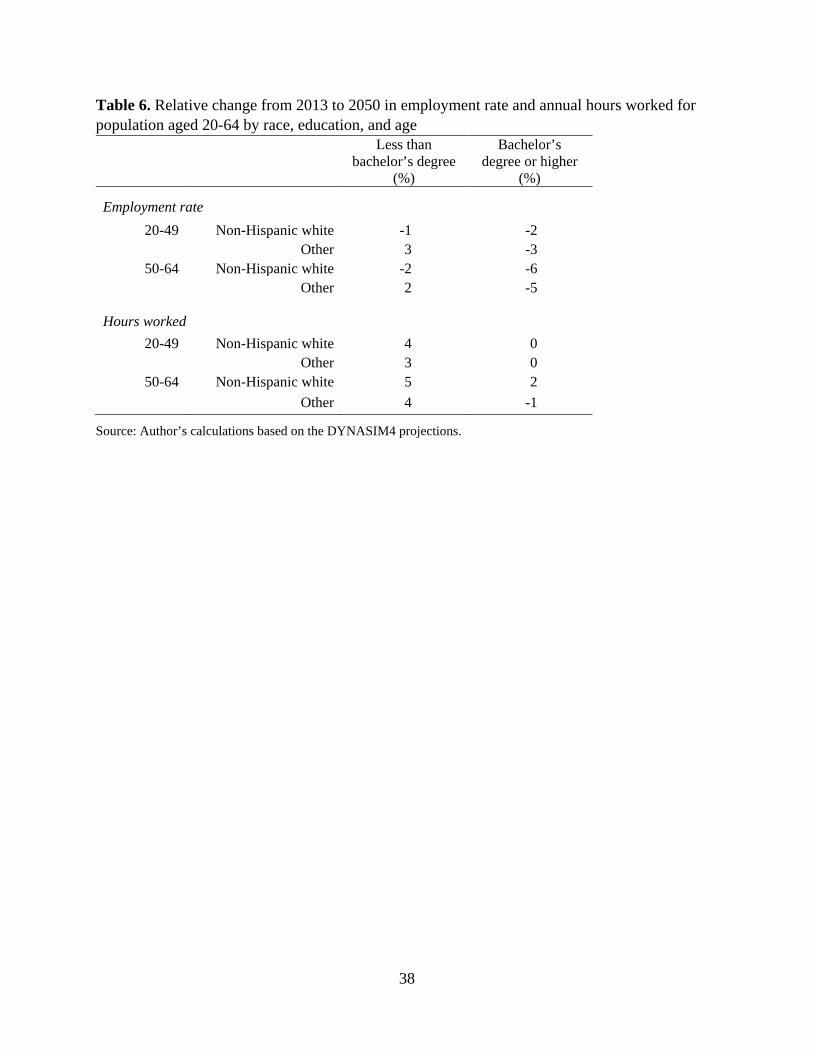
While the population composition will change dramatically, work-related variables,
including employment rate and hours worked, are projected to remain broadly similar to their
current levels (Table 6). The overall employment rate might decline somewhat while hours
worked remain flat or increase. The decline in the employment rate is driven primarily by
projected trends for non-Hispanic whites. The projected increase in annual hours worked is
primarily concentrated among non-college educated adults.
[Table 6 about here]
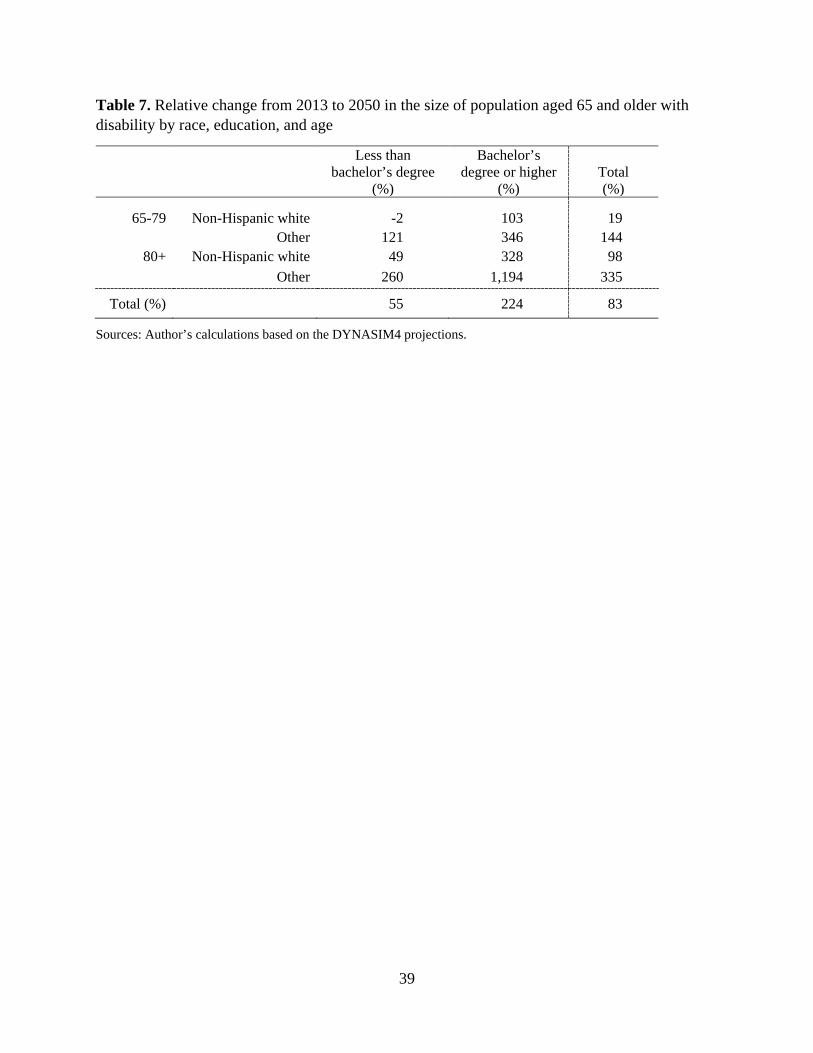
Given the strong growth of the older-adult population as well as the compositional
change of the US population more generally, it is important to document how the size of the
disabled population will change across various subgroups of older adults. The change, shown in
Table 7, primarily reflects change in the population composition, but also somewhat more
moderate projected increase in disability for minorities relative to non-Hispanic whites, and
faster increase for college-educated older adults. The latter can be linked to the fact that college-
educated individuals account for the large part of the population increase among the advanced
old-age adults that suffer from more disabilities than their younger peers. The strongest relative
growth, therefore, will be among college-educated minority adults aged 80 and older, followed
18
by college-educated minority adults aged 65-79 and college-educated non-Hispanic whites aged
80 and older. At the opposite end, the number of non-college-educated non-Hispanic white
adults aged 65-79 will remain effectively unchanged.
[Table 7 about here]
Work-related Opportunity Costs of Informal Caregiving in 2050
Based on these overall population trends as well as the compositional changes of both
working-age and older-adult population by age, race/ethnicity, and education, it is apparent that
future work-related opportunity costs of providing unpaid family care, assuming the preference
for its provision remains constant, will grow substantially. While most of the expected change
can be attributed to population aging, the compositional changes will likely have an important
impact on the work-related opportunity costs of providing family care. To assess the magnitude
of this impact, I repeat the cost calculation from Table 4 changing only the distribution of the
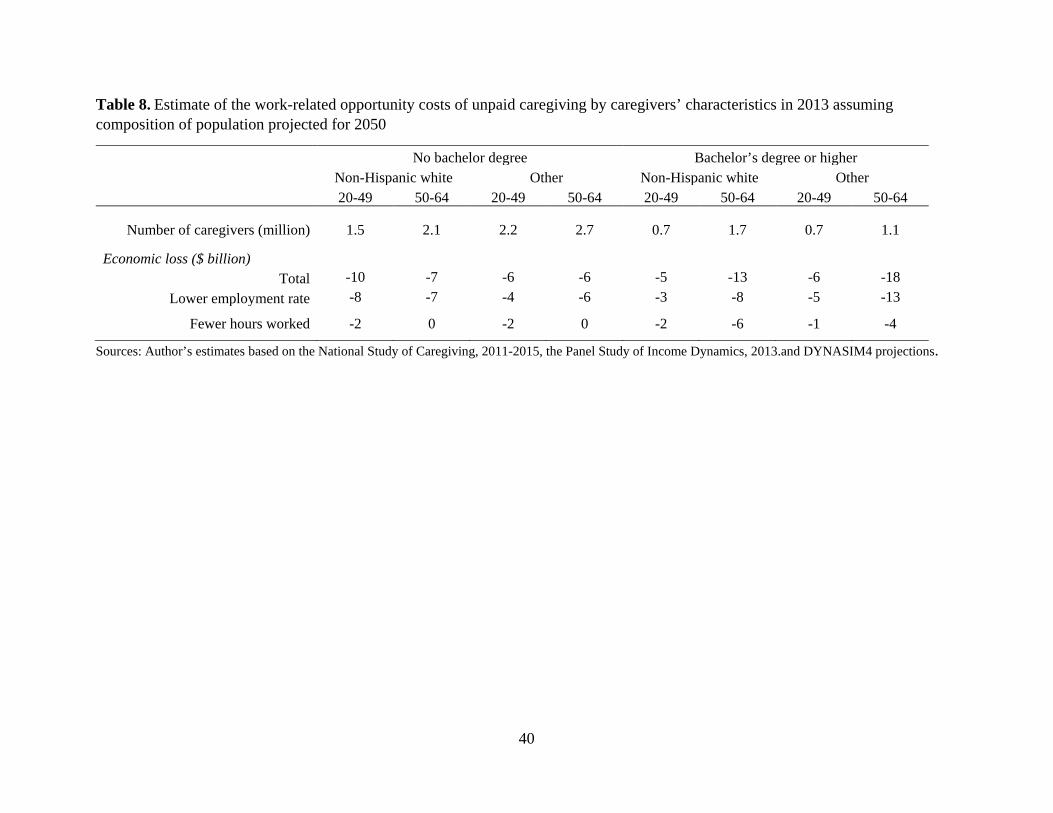
eight subgroups of caregivers to reflect their expected compositional change in 2050 (Table 8).
This allows comparing the actual work-related opportunity costs of family caregiving in 2013
with the hypothetical opportunity costs for the caregiving population of the same size that looks
like the expected future population of caregivers.
[Table 8 about here]
The results show that the total opportunity costs would increase to over $71 billion.
Better educated caregivers would incur most of the cost (almost 60 percent), compared to the
current situation where they incur about half of all opportunity costs, and the share of costs
attributable to minority caregivers would dramatically increase from less than one third to just
over one half.
19
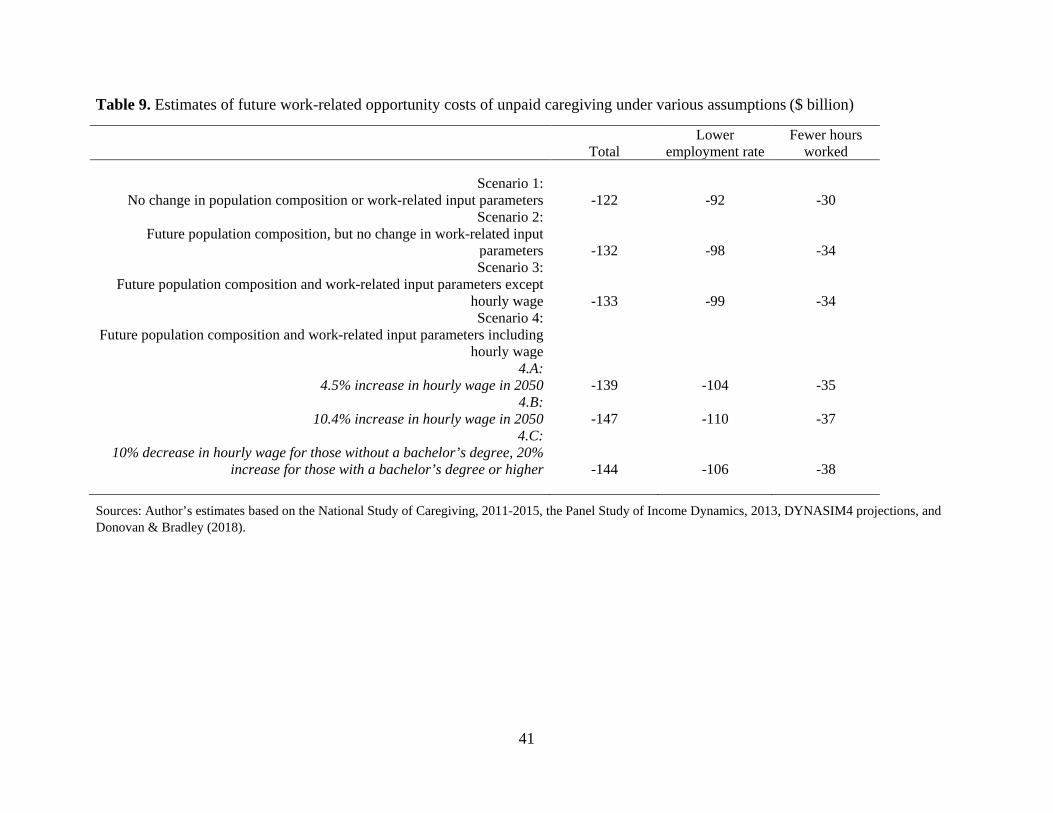
Next, I explore a series of scenarios for the assessment of work-related opportunity costs
providing family care in 2050 (Table 9). Scenario 1 assumes that the demand for caregiving and
the number of working-age caregivers increase to their expected 2050 level, but holds the current
(i.e., 2013) composition of caregivers constant. The results for this scenario tell us what the
opportunity costs of future caregiving would be in the absence of any compositional change of
the population between 2013 and 2050, but accounting for the overall increase in the demand for
caregiving. Scenario 2 incorporates all compositional changes to the population of working-age
caregivers and their care recipients in 2050, but assumes no changes in work-related outcomes,
that is, it assumes that the employment rate, hours worked, and hourly real wage will remain at
their 2013 level. Scenario 3 further incorporates work-related information about the expected
changes in the future work participation and hours worked from DYNASIM, but assumes no
changes in hourly real wages. Scenario 4 builds on Scenario 3 by testing three alternatives for the
future change in hourly real wage consistent with the trends observed over a comparable time
period in the recent past (i.e., 1979-2017 period). The alternatives include: A) a uniform 4.5
percent increase (corresponding to the 1979-2016 median wage increase), B) a uniform 10.4
percent increase (corresponding to the 1980-2017 median wage increase), and C) a 10 percent
decrease for caregivers with less than a bachelor’s degree and a 20 percent increase for
caregivers with a bachelor’s degree or more (broadly consistent with the observed cumulative
change in real wages by educational level between 1979 and 2017).
[Table 9 about here]
The results suggest that the expected present value of the annual work-related opportunity
cost of caregiving would increase to $122 billion, based just on the projected growth of the total
population of disabled older adults. Accounting for the compositional changes in the population
20
results in an additional opportunity cost of about $10 billion. Further accounting for the expected
changes in the share of caregivers who work and hours worked increases opportunity costs by
about $1 billion (Scenario 3), whereas various alternative scenarios for the increase in hourly real
wages (Scenarios 4.A through 4.C) suggest additional $6-14 billion increase in the opportunity
costs. The total difference between the “naïve” assessment of future work-related opportunity
costs that disregards the changes in the composition of the population and work-related variables
and those that fully account for them is about $17-25 billion or 14-20 percent, of which 8
percentage points is due to population composition and the rest due to changes in work-related
variables.
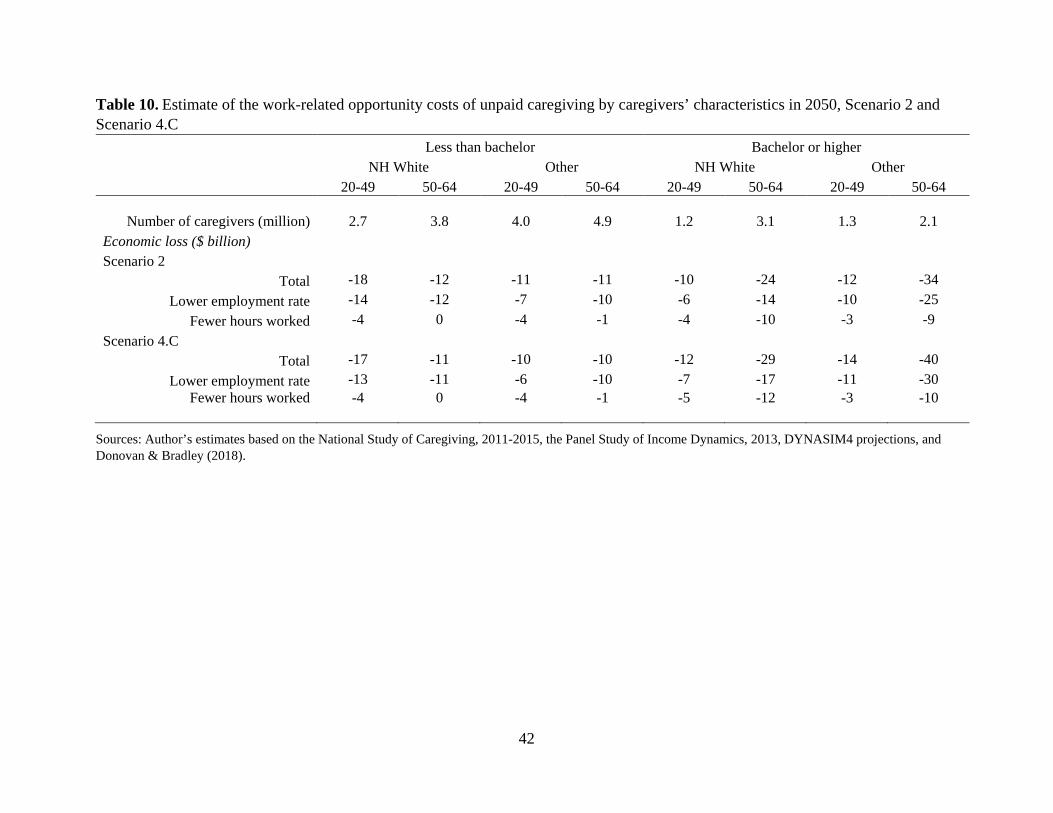
Since Scenario 4.C, which assumes divergent trends in real wage growth based on the
level of education, arguably best reflects the trends observed in recent decades, it is interesting to
explore how the continuation of such trends, alongside all other expected population and work-
related changes, could impact the distribution of work-related opportunity costs across the eight
subgroups of caregivers (Table 10). These results are contrasted with the results for Scenario 2
that accounts only for the change in the population composition.
[Table 10 about here]
Accounting for the changes in work-related variables, including a differential trend in
real wages by education, results in work-related opportunity costs that are $15 billion higher for
those with at least a bachelor’s degree and $3 billion lower for those with less education than
suggested by changes in the population composition alone. While under Scenario 2 less than 61
percent of future opportunity costs would be incurred by better educated caregivers, under
Scenario 4.C their share of the total increases to more than 66 percent.
21
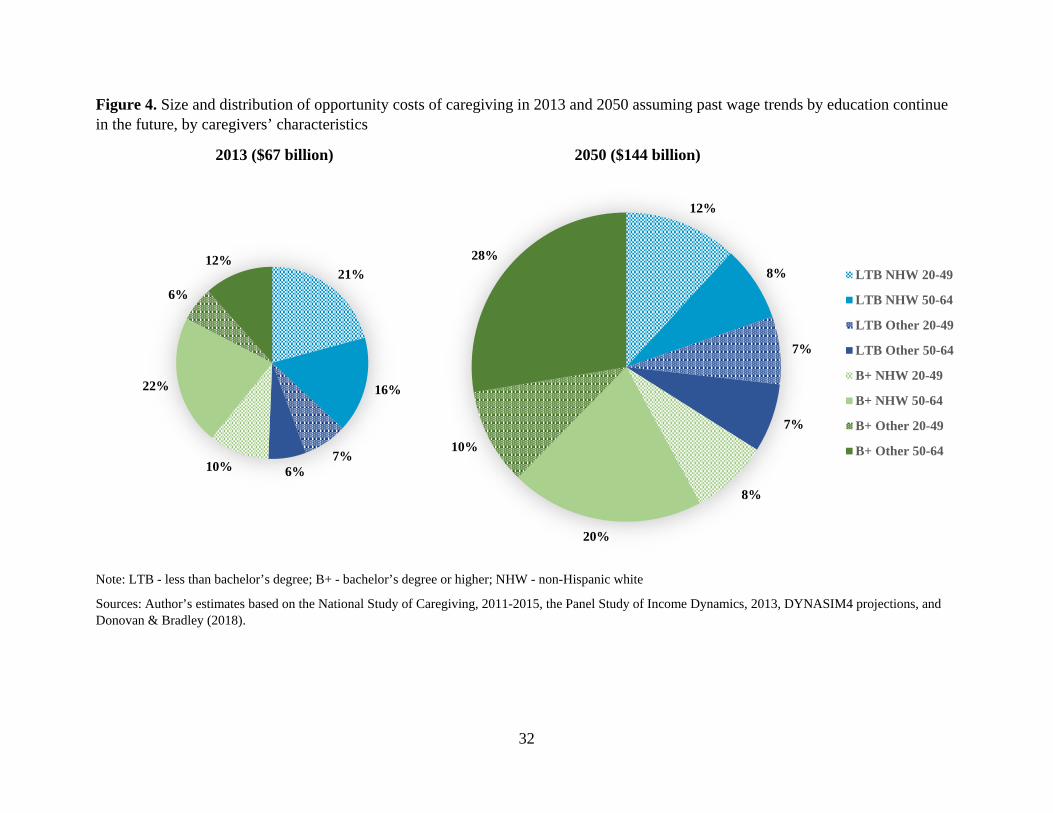
Comparing the Scenario 4.C assessment of future work-related opportunity costs with
their distribution today provides further insight into the changes that may happen over the
coming several decades (Figure 4). In addition to the increase in the share of opportunity costs
attributable to better educated caregivers, there will also be substantial cost redistribution from
non-Hispanic white to non-white and Hispanic caregivers. Given the overall aging of the
population, some redistribution will also happen from younger to older working-age caregivers.
All these changes will happen in the context of the strong growth in the total work-related
opportunity costs that will more than double by 2050.
[Figure 4 about here]
Discussion
Economic valuation of unpaid family caregiving has long concerned researchers and
policymakers. However, although past research established that caregiving imposed economic
costs on caregivers, especially with respect to their ability to work, prior valuations of caregiving
focused primarily on estimating the economic value of unpaid caregiving without considering
related costs. This study set out to assess the impact of unpaid family caregiving on the
likelihood of working and hours worked for caregivers and, relatedly, to calculate the work-
related opportunity costs (i.e., foregone earnings) of providing family care today and
approximate how they may change by 2050. The results obtained by matching the nationally
representative samples of caregivers and non-caregivers suggest that there is a substantial
adverse impact of caring for a family member on the likelihood of working (about 9 percentage
points difference), whereas the impact on hours worked is more moderate (about two fewer
hours worked). However, these averages conceal substantial variation in the estimates by age,
22
race/ethnicity, and educational attainment. In particular, college-educated minority caregivers, a
population that will increase at the fastest pace in coming decades, appear to be most adversely
impacted by caregiving. The total opportunity cost of lost work is currently about $67 billion.
While this estimate is somewhat larger than the previous estimate by Mudrazija and Johnson
(forthcoming), once several methodological and substantive differences are accounted for (e.g.,
the present study accounts for the impact of caregiving on hours worked for employed
caregivers, the hourly wages used in this study are actual wages of the matched non-caregivers
rather than the average wages based on age, sex, and education groups, and the number of
caregivers increased between 2011 and 2013), the two estimates appear broadly consistent.
The estimates of future work-related opportunity costs of caregiving suggest that, unless
the preference for unpaid family caregiving substantially declines and viable cost-effective
alternatives emerge, these costs will sharply increase. Even if one accounts only for the future
population size and composition and disregards any possible change in employment, hours
worked, and real wages, the opportunity costs in 2050 will likely double, thereby outpacing the
growth of disabled older population by about one fifth. Further accounting for possible changes
in work-related variables results in the total opportunity costs outpacing the growth of the
disabled older population by roughly 30-40 percentage points. Therefore, although the growth in
work-related opportunity costs in the coming decades will be primarily attributable to population
aging, compositional changes in the population (e.g., the increasing educational level of
caregivers and growing share of advanced old-age adults) and possible changes in work-related
variables, including work participation, hours worked, and real wages, will further increase the
size of the costs.16
16 Although the current analytic sample size precluded further disaggregation of the analysis by gender and various racial/ethnic subgroups, supplementary analysis explored differences in work-related outcomes by race/ethnicity
23
These estimates, however, should be considered in the context of limitations with the data
and the analytic assumptions. While the nature of making assessments about future outcomes
requires a set of strong simplifying assumptions, it is important to recognize their inherent
uncertainty. For example, substantial wage gains for college-educated working-age adults that
are assumed in one of the scenarios may encourage them to work more and limit their ability to
provide caregiving at the currently observed rates or change the composition of losses away from
the lower likelihood of working toward fewer hours worked, especially if the wage gains outpace
the growth in the costs of various paid care alternatives. Declines in the average number of
potential caregivers per person in need of care implies an increase in the share of older adults
without any potential caregiver, but if the long-term trend of declining geographic mobility in the
United States (U.S. Census Bureau 2018) persists in the future, this may increase the availability
of potential family caregivers to provide care. While it is unclear which of these forces may
prevail in the future, testing the sensitivity of the results presented in this paper to some of the
existing assumptions and exploring various possible changes that may affect the nexus of work
and family caregiving remains an important area for future study.
Notwithstanding these limitations, the present study contributes to a better understanding
of the impact of unpaid caregiving on work and the extent to which this may affect current and
future economic valuations of unpaid caregiving. While family caregivers will undoubtedly
remain the key element of the LTSS in years and decades to come, and the value of their
(and gender) for all adults aged 20-64 of any educational level. These results suggest that men may be somewhat more likely than women to experience negative impact of family caregiving on employment, which may be related with the overall higher labor force participation for men. Furthermore, while the Hispanic subsample is too small for reliable estimates, the results tentatively suggest that Hispanics may be substantially more adversely impacted with respect to hours worked than other racial/ethnic groups, but marginally less adversely impacted with respect to the likelihood of working. Taken together, this suggests that Hispanic caregivers may be more likely to switch to part-time work rather than drop out of labor force, which is consistent with the higher proportion of the first-generation immigrants who are less likely to qualify for any public assistance.
24
caregiving has traditionally far outweighed the associated costs, the results of this study suggest
that their future contribution may come at an increasing cost of forgone income. Alongside
negative health consequences and other burdens of providing unpaid care, this could translate to
a growing negative fiscal impact through forgone taxes and potentially larger outlays for social
programs. Therefore, future discussions of the role of unpaid family care should recognize that
this is a finite and increasingly expensive resource. In this context, future policy action could
benefit from more deliberate efforts to account fully for the costs in addition to the benefits of
caregiving, which would help define better the scope and the size of programs needed to support
caregivers, many of whom struggle to balance their work and caregiving activities. Moreover,
given the unique strengths and limits of public and family LTSS provision, it may be particularly
beneficial for the government to invest effort into designing and/or strengthening programs that
balance and coordinate public and family supports to older adults. The present study represents
an attempt, albeit limited, to contribute to this effort by shedding light on the extent to which the
growing LTSS need will impact work-related outcomes. Future studies could further advance
this work by disaggregating the analysis by gender and various racial/ethnic groups to gain
deeper insight of the full impact of intersectionality on the association of unpaid family care and
work, and by estimating the life-cycle opportunity costs of providing unpaid family care.
25
References
Angel, Jacqueline L., Stipica Mudrazija, and Rebecca Benson. 2016. “Racial and ethnic inequalities in health.” In: Linda K. George and Kenneth F. Ferraro (eds), Handbook of Aging and the Social Sciences (8th edition), pp. 123–41. San Diego, CA: Elsevier.
Board of Trustees, Federal Old-Age and Survivors Insurance and Disability Insurance Trust Funds. 2017. “2017 Annual Report of the Board of Trustees of the Federal Old-Age and Survivors Insurance and Disability Insurance Trust Funds.” Washington, DC: Author. Available at https://www.ssa.gov/oact/TR/2017/tr2017.pdf.
Boards of Trustees of the Federal Hospital Insurance and Federal Supplementary Medical Insurance Trust Funds. 2017. “2017 Annual Report of the Boards of Trustees of the Federal Hospital Insurance and Federal Supplementary Medical Insurance Trust Funds.” Washington, DC: Author. Available at https://www.cms.gov/Research-Statistics-Data-and-Systems/Statistics-Trends-and-Reports/ReportsTrustFunds/Downloads/TR2017.pdf.
Bolin, Kristian, Bjorn Lindgren, and Petter Lundborg. 2008. “Your Next of Kin or Your Own Career? Caring and Working Among the 50+ of Europe.” Journal of Health Economics 27: 718-38.
Bugliari, Delia, Nancy Campbell, Chris Chan, Orla Hayden, Michael Hurd, Regan Main, Joshua Mallett, Colleen McCullough, Erik Meijer, Michael Moldoff, Philip Pantoja, Susann Rohwedder, and Patricia St.Clair. 2016. “RAND HRS Data Documentation, Version P.” Santa Monica, CA: RAND Center for the Study of Aging. Available at http://hrsonline.isr.umich.edu/modules/meta/rand/randhrsp/randhrs_P.pdf.
Burbidge, John B., Lonnie Magee, and A. Leslie Robb. 1988. “Alternative Transformations to Handle Extreme Values of the Dependent Variable.” Journal of the American Statistical Association 83(401): 123-27.
Butrica, Barbara A., and Nadia S. Karamcheva. 2014. “The Impact of Informal Caregiving on Older Adults’ Labor Supply and Economic Resources.” Final report prepared for the Department of Labor Employee Benefits Security Administration. Washington, DC: Urban Institute. Available at https://www.dol.gov/sites/default/files/ebsa/researchers/analysis/retirement/the-impact-of-informal-caregiving-on-older-adults-labor-supply-and-economic-resources.pdf.
Chari, Amalavoyal V., John Engberg, Kristin Ray, and Ateev Mehrotra. 2015. “The Opportunity Costs of Informal Elder-Care in the United States: New Estimates from the American Time Use Study.” Health Services Research 50(3): 871–82.
Charles, Kerwin Kofi, and Purvi Sevak. 2005. “Can Family Caregiving Substitute for Nursing Home Care?” Journal of Health Economics 24(6): 1174–90.
Donovan, Sarah A., and David H. Bradley. 2018. “Real Wage Trends, 1979 to 2017.” CRS Report. Washington, DC: Congressional Research Service. Available at: https://fas.org/sgp/crs/misc/R45090.pdf.
Favreault, Melissa, and Judith Dey. 2015. “Long-Term Services and Supports for Older Americans: Risks and Financing.” Research Brief. Washington, DC: U.S. Department of Health and Human Services, Office of the Assistant Secretary for Planning and Evaluation,
26
Office of Disability, Aging and Long-Term Care Policy. Available at http://aspe.hhs.gov/basic-report/long-term-services-and-supports-older-americans-risks-and-financing-research-brief.
Favreault, Melissa M., Karen E. Smith, and Richard W. Johnson. 2015. “The Dynamic Simulation of Income Model (DYNASIM): An Overview.” Washington, DC: Urban Institute. Available at https://www.urban.org/sites/default/files/publication/67366/2000391-The-Dynamic-Simulation-of-Income-Model-DYNASIM-%20An-Overview.pdf
Federal Reserve Bank of Atlanta. 2019. “Wage growth tracker.” Available at https://www. frbatlanta.org/chcs/wage-growth-tracker.aspx
Freedman, Vicki A., and Brenda C. Spillman. 2014. “Disability and Care Needs of Older Americans,” The Milbank Quarterly 92(3): 509-41.
Genworth. 2018. “Genworth 2018 cost of care survey.” Available at https://www.genworth. com/aging-and-you/finances/cost-of-care.html
Giovannetti, Erin R., and Jennifer L. Wolff. 2010. "Cross-Survey Differences in National Estimates of Numbers of Caregivers of Disabled Older Adults." The Milbank Quarterly 88(3): 310-49.
Heitmueller, Alex, and Kirsty Inglis. 2007. “The Earnings of Informal Carers: Wage Differentials and Opportunity Costs.” Journal of Health Economics 26: 821-41.
Jacobs, Josephine C., Audrey Laporte, Courtney H. Van Houtven, and Peter C. Coyte. 2014. "Caregiving Intensity and Retirement Status in Canada." Social Science & Medicine 102: 74-82.
Jacobs, Josephine C., Meredith B. Lilly, Carita Ng, and Peter C. Coyte. 2013. “The Fiscal Impact of Informal Caregiving to Home Care Recipients in Canada: How the Intensity of Care Influences Costs and Benefits to Government.” Social Science & Medicine 81: 102-109.
Janus, Alexander L., and Pamela Doty. 2018. “Trends in Informal Care for Disabled Older Americans, 1982–2012.” Gerontologist 58(5): 863–71.
Johnson, Richard W., and Anthony T. Lo Sasso. 2006. “The Impact of Elder Care on Women’s Labor Supply at Midlife.” Inquiry 43(3): 195-210.
Lilly, Meredith B., Audrey Laporte, and Peter C. Coyte. 2010. “Do They Care Too Much to Work? The Influence of Caregiving Intensity on the Labour Force Participation of Unpaid Caregivers in Canada.” Journal of Health Economics 29(6): 895-903.
Lo Sasso, Anthony T., and Richard W. Johnson. 2002. “Does Informal Care from Adult Children Reduce Nursing Home Admissions for the Elderly?” Inquiry 39(3): 279–97.
Mazanec, Susan R., Barbara J. Daly, Sara L. Douglas, and Amy R. Lipson. 2011. "Work productivity and health of informal caregivers of persons with advanced cancer." Research in Nursing & Health 34(6): 483-95.
Mudrazija, Stipica, and Richard W. Johnson. Forthcoming. “Economic Impacts of Programs to Support Informal Caregivers.” Washington, DC: U.S. Department of Health and Human Services.
27
National Alliance for Caregiving and AARP Public Policy Institute. 2015. “Caregiving in the U.S.” Bethesda, MD and Washington, DC: National Alliance for Caregiving and AARP. Available at http://www.aarp.org/ppi/info-2015/caregiving-in-the-united-states-2015.html.
Nguyen, Ha Trong and Luke Brian Connelly. 2014. “The Effect of Unpaid Caregiving Intensity on Labour Force Participation: Results from a Multinomial Endogenous Treatment Model.” Social Science & Medicine 100: 115-22.
Pinquart, Martin, and Silvia Sorensen. 2003. “Differences between Caregivers and Noncaregivers in Psychological Health and Physical Health: A Meta-Analysis.” Psychology and Aging 18(2): 250–67.
Redfoot, Donald, Lynn Feinberg, and Ari Houser. 2013. “The Aging of the Baby Boom and the Growing Care Gap: A Look at Future Declines in the Availability of Family Caregivers.” Washington, DC: AARP Public Policy Institute. Available at https://www.aarp.org/content/dam/aarp/research/public_policy_institute/ltc/2013/baby-boom-and-the-growing-care-gap-insight-AARP-ppi-ltc.pdf.
Reinhard, Susan C. 2010. “Diversion, Transition Programs Target Nursing Homes’ Status Quo.” Health Affairs 29(1): 44-8.
Reinhard, Susan C., Lynn Friss Feinberg, Rita Choula, and Ari Houser. 2015. Valuing the Invaluable: 2015 Update. Washington, DC: AARP Public Policy Institute. http://www.aarp.org/content/dam/aarp/ppi/2015/valuing-the-invaluable-2015-update-new.pdf
Spillman, Brenda C., Jennifer Wolff, Vicki A. Freedman, and Judith D. Kasper. 2014. “Informal Caregiving for Older Americans: An Analysis of the 2011 National Study of Caregiving.” Report to the U.S. Department of Health and Human Services, Office of the Assistant Secretary for Planning and Evaluation. Available at https://aspe.hhs.gov/system/files/pdf/77146/NHATS-IC.pdf.
Thomeer, Mieke B., Stipica Mudrazija, and Jacqueline L. Angel. 2014. “How do race and Hispanic ethnicity affect nursing home admission? Evidence from the Health and Retirement Study.” Journals of Gerontology, Series B: Psychological Sciences and Social Sciences 70(4): 628–38.
U.S. Bureau of Economic Analysis. 2019. “Personal income per capita.” Retrieved from FRED, Federal Reserve Bank of St. Louis. Available at https://fred.stlouisfed.org/series/A792RC0 A052NBEA
U.S. Bureau of Labor Statistics. 2018. “Employed Full Time: Median Usual Weekly Real Earnings: Wage and Salary Workers: 16 Years and Over.” Retrieved from FRED, Federal Reserve Bank of St. Louis. Available at https://fred.stlouisfed.org/series/LEU0252881600A.
U.S. Census Bureau. 2018. “Number of movers and mover rate: 1948-2018.” Available at https://www.census.gov/library/visualizations/time-series/demo/historic.html
Van Houtven, Courtney H., Norma B. Coe, and Meghan Skira. 2013. “The Effect of Informal Care on Work and Wages.” Journal of Health Economics 32(1): 240-52.
Wakabayashi, Chizuko and Katherine M. Donato. 2006. “Does Caregiving Increase Poverty among Women in Later Life? Evidence from the Health and Retirement Survey.” Journal of Health and Social Behavior 47(3): 258-74.
28
Wolff, Jennifer L., Brenda C. Spillman, Vicki A. Freedman, and Judith D. Kasper. 2016. “A National Profile of Family and Unpaid Caregivers Who Assist Older Adults with Health Care Activities.” JAMA Internal Medicine 176(3): 372-79.
29
Figures
Figure 1. Prevalence of full- and part-time work, and average hours worked for employed caregivers and non-caregivers, 2013
Sources: Author’s estimates based on the National Study of Caregiving, 2011-2015, and the Panel Study of Income Dynamics, 2013.
39%62%
16%
10%37.6
41.5
05101520253035404550
0%10%20%30%40%50%60%70%80%90%
100%
Caregivers Non-caregivers
Full-time Part-time Average hours per week
Employment rate Hours of work
30
Figure 2. Difference in the likelihood of working (in percentage points) and hours worked before and after matching, 2013
Sources: Author’s estimates based on the National Study of Caregiving, 2011-2015, and the Panel Study of Income Dynamics, 2013.
169
3.9
2.1
0.00.51.01.52.02.53.03.54.04.5
0
10
20
30
Before matching After matching
Likelihood of working Hours worked
Likelihood of working(non-caregivers - caregivers)
Hours worked (non-caregivers - caregivers)
31
Figure 3. Size (in millions) and age distribution of population aged 20 and older in 2013 and 2050
Sources: Author’s estimates based on the U.S. Census Bureau’s annual estimates of the resident population for selected age groups for the United States, 2013, and DYNASIM projections.
54%49%
26%
24%14%
18%5%
10%
0
50
100
150
200
250
300
350
2013 2050
80+
65-79
50-64
20-49
32
Figure 4. Size and distribution of opportunity costs of caregiving in 2013 and 2050 assuming past wage trends by education continue in the future, by caregivers’ characteristics
2013 ($67 billion) 2050 ($144 billion)
Note: LTB - less than bachelor’s degree; B+ - bachelor’s degree or higher; NHW - non-Hispanic white
Sources: Author’s estimates based on the National Study of Caregiving, 2011-2015, the Panel Study of Income Dynamics, 2013, DYNASIM4 projections, and Donovan & Bradley (2018).
21%
16%
7%6%10%
22%
6%
12%
12%
8%
7%
7%
8%
20%
10%
28%LTB NHW 20-49
LTB NHW 50-64
LTB Other 20-49
LTB Other 50-64
B+ NHW 20-49
B+ NHW 50-64
B+ Other 20-49
B+ Other 50-64
33
Tables
Table 1. Number of caregivers aged 20-64 and care recipients aged 65 and older and their population shares, 2013 and 2050
Number of individuals (million)
Population share (%)
2013
Caregivers
20-64 12.7 6.7 20-49 5.1 4.0 50-64 7.6 12.3 Care recipients
65 and older 9.7 21.7 65-79 5.0 15.3 80 and older 4.6 39.4
2050
Caregivers
20-64 23.3 10.4 20-49 9.2 6.1 50-64 14.0 19.2 Care recipients
65 and older 17.7 20.9 65-79 7.2 13.1 80 and older 10.5 34.8
Sources: Author’s estimates based on the National Study of Caregiving, 2011-2015, the U.S. Census Bureau’s annual estimates of the resident population for selected age groups for the United States, 2013, and DYNASIM4 projections.
34
Table 2. Distribution of caregivers by race, education, and age, 2013
Less than bachelor’s degree
(%)
Bachelor’s degree or higher
(%) Total (%)
20-49 Non-Hispanic white 16 7 23 Other 14 3 17 Non-Hispanic black 6 1 8
Hispanic 6 1 6
50-64 Non-Hispanic white 27 15 42 Other 15 4 18 Non-Hispanic black 7 2 9
Hispanic 5 1 7
Total (%) 72 28
Sources: Author’s estimates based on the National Study of Caregiving, 2011-2015.
35
Table 3. Estimated difference in work-related outcomes between matched NSOC caregivers’ and PSID non-caregivers’ samples, 2013
Work Hours No bachelor’s
degree (%)
Bachelor’s degree or higher
(%)
No bachelor’s degree
(%)
Bachelor’s degree or higher
(%)
20-49 Non-Hispanic white -16 -8
-3.7 -2.9 Other -6 -14 -2.3 -2.2
50-64 Non-Hispanic white -8 -6 0.0 -3.2 Other -6 -20 -0.4 -4.8
Total (%) -9 -2.1
Sources: Author’s estimates based on the National Study of Caregiving, 2011-2015, and the Panel Study of Income Dynamics, 2013.
36
Table 4. Estimate of the work-related opportunity costs of unpaid caregiving by caregivers’ characteristics, 2013
No bachelor degree Bachelor’s degree or higher Total Non-Hispanic white Other Non-Hispanic white Other
20-49 50-64 20-49 50-64 20-49 50-64 20-49 50-64
Input parameters
Number of caregivers (million) 2.1 3.4 1.8 1.9 0.8 1.9 0.4 0.5 12.7 Share working (%) 53 49 58 43 78 63 71 58 55
Hourly wage ($) 16 19 14 17 29 33 25 29 22 Weeks worked 49 51 49 50 50 51 51 50 50
Average hours per week 40 38 40 38 41 41 43 41 40 Matched estimates of difference
Employment rate (%) -16 -8 -6 -6 -8 -6 -14 -20 -9 Hours worked -3.7 0.0 -2.3 -0.4 -2.9 -3.2 -2.2 -4.8 -2.1
Economic loss ($ billion) Total -14 -11 -5 -4 -7 -14 -4 -8 -67
Lower employment rate -11 -11 -3 -4 -4 -8 -3 -6 -50 Fewer hours worked -3 0 -2 0 -3 -6 -1 -2 -16
Sources: Author’s estimates based on the National Study of Caregiving, 2011-2015, and the Panel Study of Income Dynamics, 2013.
37
Table 5. Relative change from 2013 to 2050 in the size of population aged 20-64 by race, education, and age
Less than bachelor’s degree
(%)
Bachelor’s degree or higher
(%) Total (%)
20-49 Non-Hispanic white -12 -6 -10 Other 48 95 58
50-64 Non-Hispanic white -26 9 -14 Other 72 174 94
Total (%) 13 31 18
Source: Author’s calculations based on the DYNASIM4 projections.
38
Table 6. Relative change from 2013 to 2050 in employment rate and annual hours worked for population aged 20-64 by race, education, and age Less than
bachelor’s degree (%)
Bachelor’s degree or higher
(%)
Employment rate 20-49 Non-Hispanic white -1 -2
Other 3 -3 50-64 Non-Hispanic white -2 -6
Other 2 -5
Hours worked 20-49 Non-Hispanic white 4 0
Other 3 0 50-64 Non-Hispanic white 5 2
Other 4 -1
Source: Author’s calculations based on the DYNASIM4 projections.
39
Table 7. Relative change from 2013 to 2050 in the size of population aged 65 and older with disability by race, education, and age
Less than bachelor’s degree
(%)
Bachelor’s degree or higher
(%) Total (%)
65-79 Non-Hispanic white -2 103 19 Other 121 346 144
80+ Non-Hispanic white 49 328 98 Other 260 1,194 335
Total (%) 55 224 83
Sources: Author’s calculations based on the DYNASIM4 projections.
40
Table 8. Estimate of the work-related opportunity costs of unpaid caregiving by caregivers’ characteristics in 2013 assuming composition of population projected for 2050
No bachelor degree Bachelor’s degree or higher Non-Hispanic white Other Non-Hispanic white Other 20-49 50-64 20-49 50-64 20-49 50-64 20-49 50-64
Number of caregivers (million) 1.5 2.1 2.2 2.7 0.7 1.7 0.7 1.1
Economic loss ($ billion) Total -10 -7 -6 -6 -5 -13 -6 -18
Lower employment rate -8 -7 -4 -6 -3 -8 -5 -13
Fewer hours worked -2 0 -2 0 -2 -6 -1 -4
Sources: Author’s estimates based on the National Study of Caregiving, 2011-2015, the Panel Study of Income Dynamics, 2013.and DYNASIM4 projections.
41
Table 9. Estimates of future work-related opportunity costs of unpaid caregiving under various assumptions ($ billion)
Total Lower
employment rate Fewer hours
worked
Scenario 1: No change in population composition or work-related input parameters -122 -92 -30
Scenario 2: Future population composition, but no change in work-related input
parameters -132 -98 -34 Scenario 3:
Future population composition and work-related input parameters except hourly wage -133 -99 -34 Scenario 4:
Future population composition and work-related input parameters including hourly wage
4.A: 4.5% increase in hourly wage in 2050 -139 -104 -35
4.B: 10.4% increase in hourly wage in 2050 -147 -110 -37
4.C: 10% decrease in hourly wage for those without a bachelor’s degree, 20%
increase for those with a bachelor’s degree or higher
-144
-106
-38
Sources: Author’s estimates based on the National Study of Caregiving, 2011-2015, the Panel Study of Income Dynamics, 2013, DYNASIM4 projections, and Donovan & Bradley (2018).
42
Table 10. Estimate of the work-related opportunity costs of unpaid caregiving by caregivers’ characteristics in 2050, Scenario 2 and Scenario 4.C Less than bachelor Bachelor or higher NH White Other NH White Other 20-49 50-64 20-49 50-64 20-49 50-64 20-49 50-64
Number of caregivers (million) 2.7 3.8 4.0 4.9 1.2 3.1 1.3 2.1
Economic loss ($ billion) Scenario 2
Total -18 -12 -11 -11 -10 -24 -12 -34 Lower employment rate -14 -12 -7 -10 -6 -14 -10 -25
Fewer hours worked -4 0 -4 -1 -4 -10 -3 -9 Scenario 4.C
Total -17 -11 -10 -10 -12 -29 -14 -40 Lower employment rate -13 -11 -6 -10 -7 -17 -11 -30
Fewer hours worked
-4
0
-4
-1
-5
-12
-3
-10
Sources: Author’s estimates based on the National Study of Caregiving, 2011-2015, the Panel Study of Income Dynamics, 2013, DYNASIM4 projections, and Donovan & Bradley (2018).