Embed Size (px)
Citation preview
Monograph Series 2015
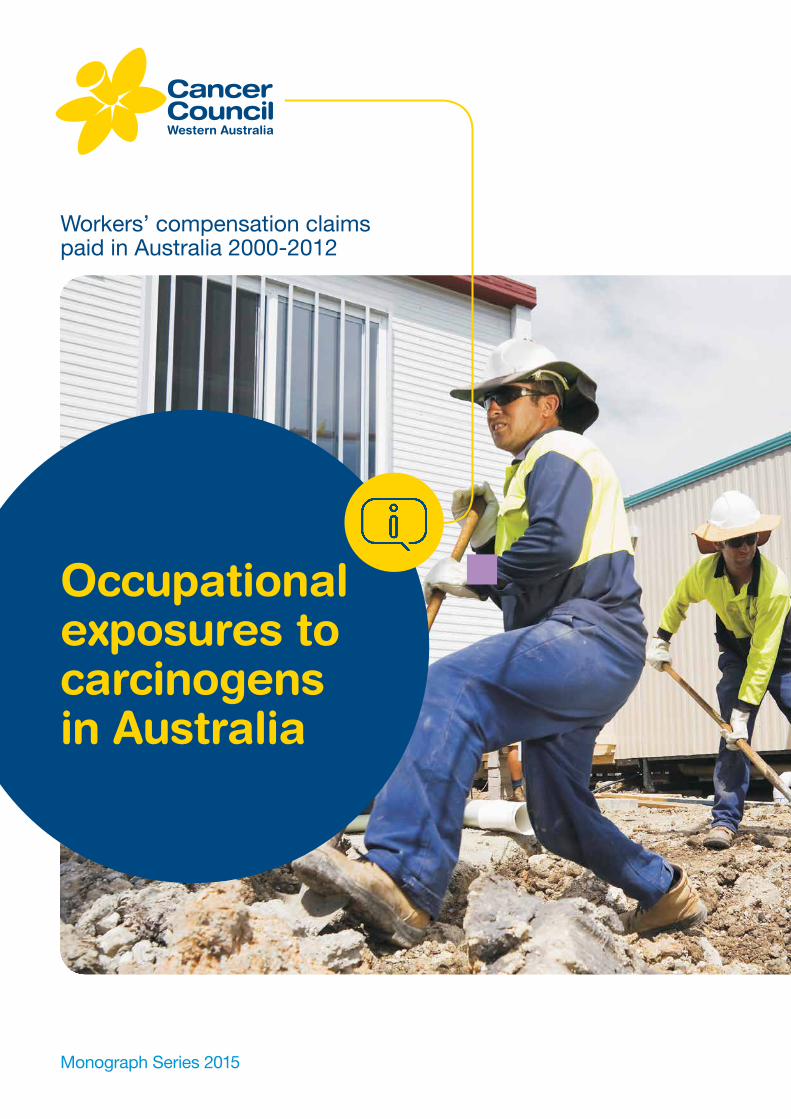
Workers’ compensation claims paid in Australia 2000-2012
Occupational exposures to carcinogens in Australia
Occupational exposures to carcinogens in Australia: Workers’ compensation claims paid in Australia 2000–2012
Key issues:
• Occupational exposures to carcinogens are estimated to cause over 5,000 new cases of cancer in Australia each year
• Approximately 3.6 million Australians could be exposed to one or more carcinogens at work
• Priority carcinogens applicable to the Australian industrial profile should be the focus of scientists and regulators
• The number of occupationally caused cancers compensated each year equates to less than eight percent of the expected number
• Under-compensation may be a result of lack of awareness of occupational risk factors among workers and health professionals, along with the inherent difficulties in assigning a specific cancer case to an occupational cause
This monograph has been developed by Cancer Council Western Australia with special acknowledgement to Terry Slevin and Lauren Zappa and contributions from Ellissa Tomich and Caitlin Kameron. Reviews were also provided by Prof Deborah Glass (Monash University), Prof Lin Fritschi (Curtin University), Kristin Miller (Cancer Council Queensland), Julie Hill (Safe Work Australia) and Richard Webster (Safe Work Australia).
The report is based on workers’ compensation data provided to Cancer Council Western Australia by Safe Work Australia’s National Data Team.
Cancer Council Western Australia acknowledges that production of this monograph would not be possible without the provision of these datasets and appreciates the cooperation of Safe Work Australia in providing this data for use.
ISBN 1 876628 86 3
1
Contents1. Executive summary 2
2. Occupational cancer risks 3
3. Burden of occupational cancers in Australia 5
3.1. Historical estimates of occupational cancer 5
3.2. Australian estimates of occupational cancer 6
3.3. Prevalence of exposure to occupational carcinogens 7
3.4. Limitations of these estimates 10
3.5. Estimates from other countries 12
4. Workers’ compensation claims statistics 13
4.1. Compensation paid for workers with cancers determined to be attributed to occupational exposures 13
4.2. Under-compensation 17
5. Conclusions 18
References 19
Cover page photograph courtesy of Queensland Health.
2
This monograph addresses the issue of occupational exposures to carcinogens in Australia and reviews estimates of the burden of occupational cancer in Australia. It documents the number of workers’ compensation claims made for occupationally related cancers from 2000 to 2012, and the costs of such claims.
Risk factors like asbestos and ultraviolet radiation are well known occupational carcinogens, but there are other exposures and specific jobs which are less commonly perceived as being linked to cancer. A recent Australian study compiled a priority list of 38 known or potential occupational cancer risk factors. These agents or groups of agents all hold strong evidence of a cancer link, are relevant to Australian workers and should be the focus of Australian scientists and regulators in reducing the rate of occupational cancers.
Occupational causes of cancer have previously been thought to account for no more than four percent of the total cancer burden. Recent analysis, however, concluded that occupational risk factors may account for 6.5 percent of new cancer cases diagnosed in Australia every year, amounting to around 5,000 cases attributed to workplace exposures (10.8% in men, 2.2% in women). Furthermore, around 3.6 million workers in Australia (40 percent of the working population between the ages of 18 and 65) could be exposed to one or more known occupational carcinogens. Although these estimates have some limitations, occupational causes appear to be a bigger contributor to Australia’s cancer burden than previously thought.
The total number of compensation claims made for occupationally related cancers over the entire period investigated (2000-2012) was 4,745 claims, with an average of 395 claims made per year. This was at a total cost from 2000-2012 of AU$360.5 million, at an average cost of AU$30.0 million per year. Compensation paid annually ranged from AU$14.9 million (2000-01) to AU$42.3 million (2006-07).
Compensation claims decreased between 2002-03 and 2008-09 from 470 to 345 claims; however, there was a resurgence of claims between 2009-10 and 2011-12, with the number of claims growing to 395 in 2011-12. Similar trends were observed for the cost of compensation claims during this time.
Skin cancers and mesotheliomas account for the vast majority of the claim numbers (79.1% combined), and mesotheliomas account for the majority of the compensation payments (73%).
From the data available, it appears that over the last decade only small fractions (less than eight percent) of cancer cases that have been caused in some part due to occupational exposure, have been compensated. Reasons for under-compensation may include a lack of awareness of occupational risk factors for cancer among workers and health professionals, along with the inherent difficulties in assigning a specific case to an occupational cause.
1. Executive summary
Occupational exposures to carcinogens
Occupational cancers are those that occur as a result of exposure to carcinogenic (cancer causing) agents in the workplace. Such exposures include:
• a wide range of different industrial chemicals, dusts, metals and combustion products (e.g. asbestos or diesel engine exhaust);
• forms of radiation (e.g. ultraviolet or ionising radiation);
• entire professions and industries (e.g. working as a painter, or aluminium production); and
• patterns of behaviour (e.g. shift working).
Work environments may also indirectly affect the risk of cancer by enabling unhealthy behaviours, such as poor nutrition and physical inactivity.
Several agencies classify exposures according to the strength of the evidence for their carcinogenicity. The WHO International Agency for Research on Cancer (IARC) publishes the best known and most comprehensive list of carcinogens, which is based on the review of published studies and evaluation of weight of evidence by an interdisciplinary group of expert scientists. As the evidence is always evolving, the IARC list, although very thorough and comprehensive, is not an exhaustive list.
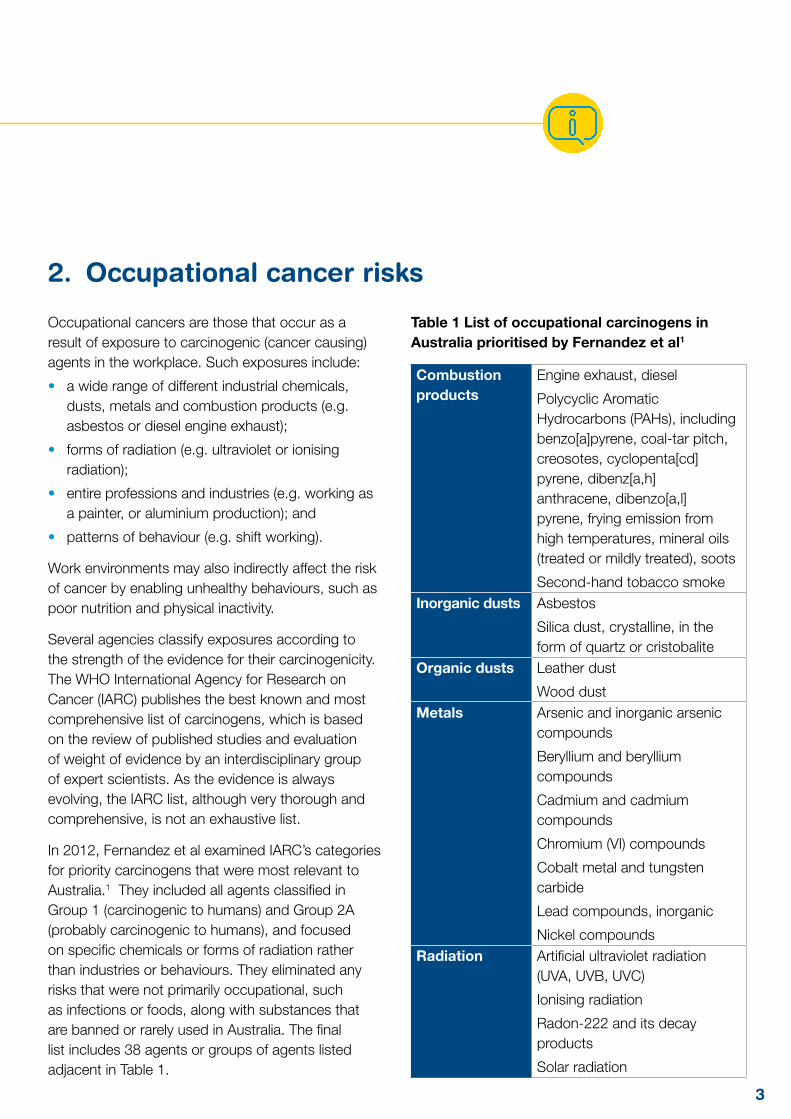
In 2012, Fernandez et al examined IARC’s categories for priority carcinogens that were most relevant to Australia.1 They included all agents classified in Group 1 (carcinogenic to humans) and Group 2A (probably carcinogenic to humans), and focused on specific chemicals or forms of radiation rather than industries or behaviours. They eliminated any risks that were not primarily occupational, such as infections or foods, along with substances that are banned or rarely used in Australia. The final list includes 38 agents or groups of agents listed adjacent in Table 1.
Table 1 List of occupational carcinogens in Australia prioritised by Fernandez et al1
Combustion products
Engine exhaust, diesel
Polycyclic Aromatic Hydrocarbons (PAHs), including benzo[a]pyrene, coal-tar pitch, creosotes, cyclopenta[cd] pyrene, dibenz[a,h]anthracene, dibenzo[a,l]pyrene, frying emission from high temperatures, mineral oils (treated or mildly treated), soots
Second-hand tobacco smokeInorganic dusts Asbestos
Silica dust, crystalline, in the form of quartz or cristobalite
Organic dusts Leather dust
Wood dustMetals Arsenic and inorganic arsenic
compounds
Beryllium and beryllium compounds
Cadmium and cadmium compounds
Chromium (VI) compounds
Cobalt metal and tungsten carbide
Lead compounds, inorganic
Nickel compoundsRadiation Artificial ultraviolet radiation
(UVA, UVB, UVC)
Ionising radiation
Radon-222 and its decay products
Solar radiation
3
2. Occupational cancer risks
4
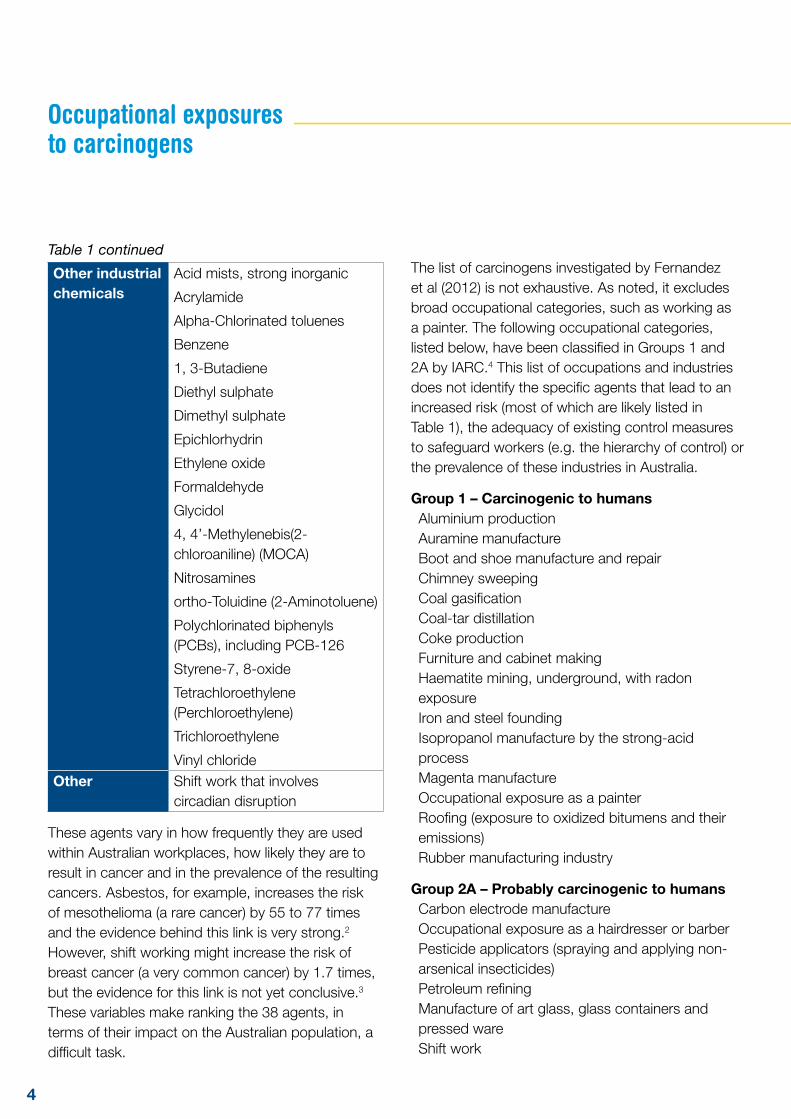
Other industrial chemicals
Acid mists, strong inorganic
Acrylamide
Alpha-Chlorinated toluenes
Benzene
1, 3-Butadiene
Diethyl sulphate
Dimethyl sulphate
Epichlorhydrin
Ethylene oxide
Formaldehyde
Glycidol
4, 4’-Methylenebis(2-chloroaniline) (MOCA)
Nitrosamines
ortho-Toluidine (2-Aminotoluene)
Polychlorinated biphenyls (PCBs), including PCB-126
Styrene-7, 8-oxide
Tetrachloroethylene (Perchloroethylene)
Trichloroethylene
Vinyl chlorideOther Shift work that involves
circadian disruption
These agents vary in how frequently they are used within Australian workplaces, how likely they are to result in cancer and in the prevalence of the resulting cancers. Asbestos, for example, increases the risk of mesothelioma (a rare cancer) by 55 to 77 times and the evidence behind this link is very strong.2 However, shift working might increase the risk of breast cancer (a very common cancer) by 1.7 times, but the evidence for this link is not yet conclusive.3 These variables make ranking the 38 agents, in terms of their impact on the Australian population, a difficult task.
The list of carcinogens investigated by Fernandez et al (2012) is not exhaustive. As noted, it excludes broad occupational categories, such as working as a painter. The following occupational categories, listed below, have been classified in Groups 1 and 2A by IARC.4 This list of occupations and industries does not identify the specific agents that lead to an increased risk (most of which are likely listed in Table 1), the adequacy of existing control measures to safeguard workers (e.g. the hierarchy of control) or the prevalence of these industries in Australia.
Group 1 – Carcinogenic to humansAluminium production Auramine manufacture Boot and shoe manufacture and repair Chimney sweeping Coal gasificationCoal-tar distillation Coke production Furniture and cabinet making Haematite mining, underground, with radon exposure Iron and steel founding Isopropanol manufacture by the strong-acid process Magenta manufacture Occupational exposure as a painter Roofing (exposure to oxidized bitumens and their emissions) Rubber manufacturing industry
Group 2A – Probably carcinogenic to humansCarbon electrode manufacture Occupational exposure as a hairdresser or barberPesticide applicators (spraying and applying non-arsenical insecticides) Petroleum refining Manufacture of art glass, glass containers and pressed ware Shift work
Occupational exposures to carcinogens
Table 1 continued
5
In order to estimate the burden of occupational cancers in Australia, the following information is required:
• a list of known occupational carcinogens;
• for each carcinogen listed, an estimate of the relative risk that it will cause a cancer type;
• the proportion of people exposed to each carcinogen in an occupational settings; and
• the annual number of each cancer type.
Given these complexities, few have attempted to estimate the burden of occupational cancer in Australia. Following a discussion of historical estimates, this monograph outlines two studies that have used the best available evidence to estimate the proportion of cancers caused by occupational factors in Australia.
3.1 Historical estimates of occupational cancer
A seminal and often quoted paper from Sir Richard Doll and Sir Richard Peto, published in 1981, provisionally estimated that four percent of cancer deaths in the US were caused by occupational factors (lung cancer being the biggest contributor to this estimate).5 Doll and Peto (1981) noted at the time that their estimate was based on poor data, although they believed it would not be “out in either direction by more than a factor of about two”. They also noted that the four percent figure was “far smaller than has recently been suggested by various U.S. Government agencies” and recommended that further research be done to arrive at a better estimate.5
Doll and Peto (1981) concluded that occupational cancers tend to be concentrated among relatively small groups of people who have large risks of developing the disease – risks that could be “reduced, or even eliminated, once they have been identified”. They wrote: “The detection of occupational hazards should therefore have a higher priority in any program of cancer prevention than their proportional importance might suggest.”5
Studies have attempted to apply Doll and Peto’s methodology to other countries and arrived at similar figures. But beyond the obvious differences in each country’s exposure prevalence, and the changing working conditions since the 1940s to 1970s, experts cite four reasons to believe that Doll and Peto’s four percent figure was an underestimate:6
• they excluded cancers diagnosed over the age of 65 although many occupational cancers have long latency periods (e.g. mesothelioma);
• they excluded certain occupational carcinogens, such as ultraviolet radiation;
• they excluded certain cancer sites which have since been linked to occupational factors, such as breast cancer (linked to physical inactivity/obesity and shift work); and
• they radically underestimated the proportion of mesotheliomas linked to occupational causes.
3. Burden of occupational cancers in Australia
6
3.2 Australian estimates of occupational cancer
A study by Fritschi and Driscoll (2006) estimated the number of cancer cases caused each year in Australia by occupational exposures. Their study utilised the most recent, evidence-based data from a Finnish study completed in 2001.7 Fritschi and Driscoll (2006) applied the Finnish estimates of the proportion of cancers caused by occupation to the annual number of cancers at each site in Australia,
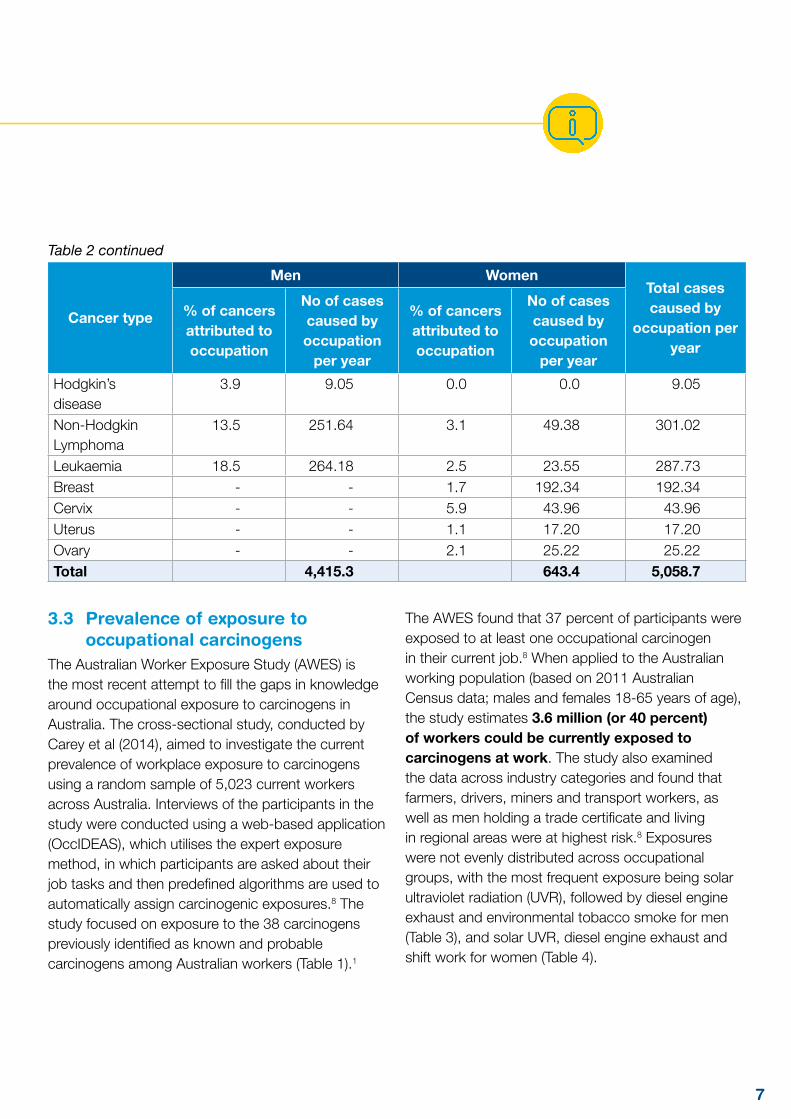
as recorded by the Australian Institute for Health and Welfare (AIHW) and the Australasian Association of Cancer Registries (AACR). The authors estimated that around 5,000 cancers a year are caused by occupation – around 6.5 percent of the total cancer burden. This equates to 4,415 cancers in men (10.8 percent) and 643 in women (2.2 percent) (Table 2). In addition to this, they estimated around 34,000 non-melanoma skin cancers are also due to occupational exposures (28,000 in men and 6,000 in women).
Table 2 Annual number of cases of cancer* caused by occupation in Australia6
Cancer type
Men WomenTotal cases caused by
occupation per year
% of cancers attributed to occupation
No of cases caused by occupation
per year
% of cancers attributed to occupation
No of cases caused by occupation
per year
Oral cavity 1 9.36 0.3 1.49 10.85Pharynx 2 5.72 0.5 0.43 6.15Oesophagus 6.4 45.50 0.2 0.71 46.21Stomach 10.3 130.50 5.4 38.50 169.0Colon 5.6 265.38 0.0 0.0 265.38Rectum 3.1 62.62 0.1 1.20 63.82Liver 3.5 18.41 5.3 10.65 29.06Gallbladder 0.2 0.49 0.4 1.35 1.84Pancreas 13.4 122.21 3.5 31.36 153.57Nose and nasal sinuses
24.0 21.12 6.7 3.48 24.60
Larynx 9.3 44.73 0.5 0.35 45.08Bronchus and lung
29.0 1,530.62 5.3 147.45 1,678.07
Bone 0.6 0.56 0.6 0.41 0.97Melanoma 4.3 192.21 0.4 15.01 207.22Mesothelioma 90.0 351.90 25.0 18.75 370.65Prostate 6.0 630.72 - - 630.72Kidney 4.7 69.09 0.8 7.48 76.57Bladder 14.2 303.74 0.7 5.23 308.97Brain 10.6 85.52 1.3 7.90 93.42
Occupational exposures to carcinogens
* Number of cancers as recorded in Australia in 2000
7
Cancer type
Men WomenTotal cases caused by
occupation per year
% of cancers attributed to occupation
No of cases caused by occupation
per year
% of cancers attributed to occupation
No of cases caused by occupation
per year
Hodgkin’s disease
3.9 9.05 0.0 0.0 9.05
Non-Hodgkin Lymphoma
13.5 251.64 3.1 49.38 301.02
Leukaemia 18.5 264.18 2.5 23.55 287.73Breast - - 1.7 192.34 192.34Cervix - - 5.9 43.96 43.96Uterus - - 1.1 17.20 17.20Ovary - - 2.1 25.22 25.22Total 4,415.3 643.4 5,058.7
3.3 Prevalence of exposure to occupational carcinogens
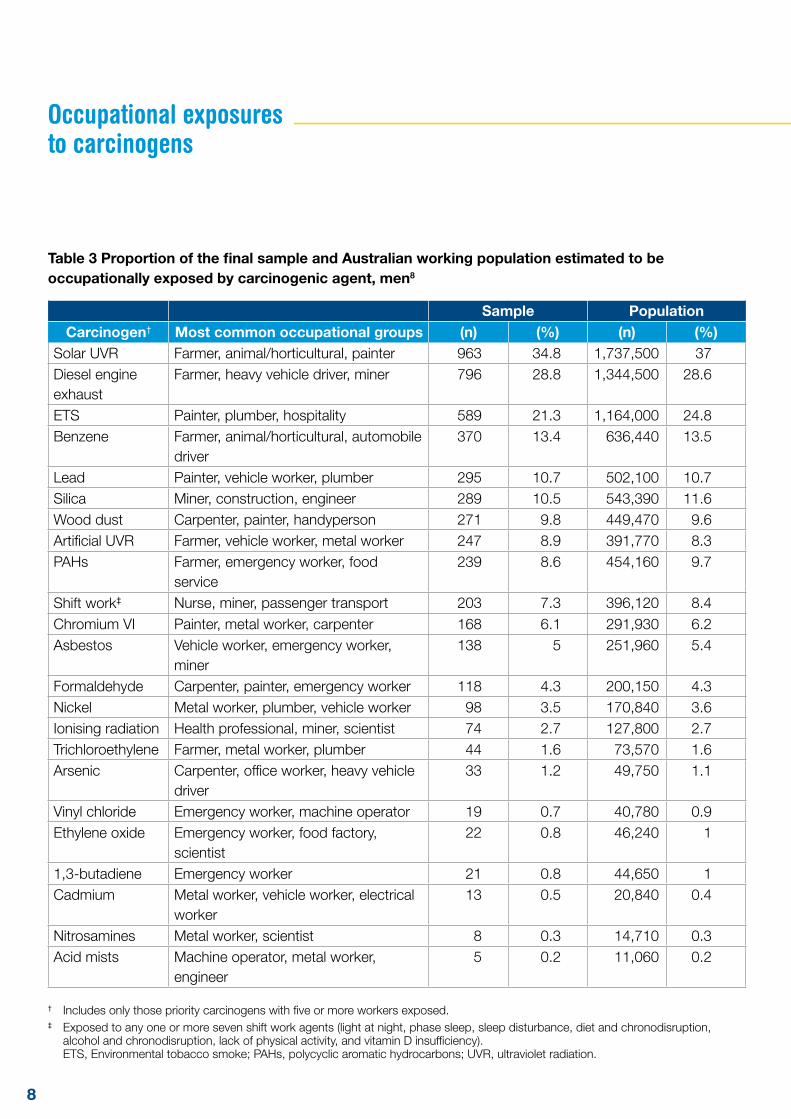
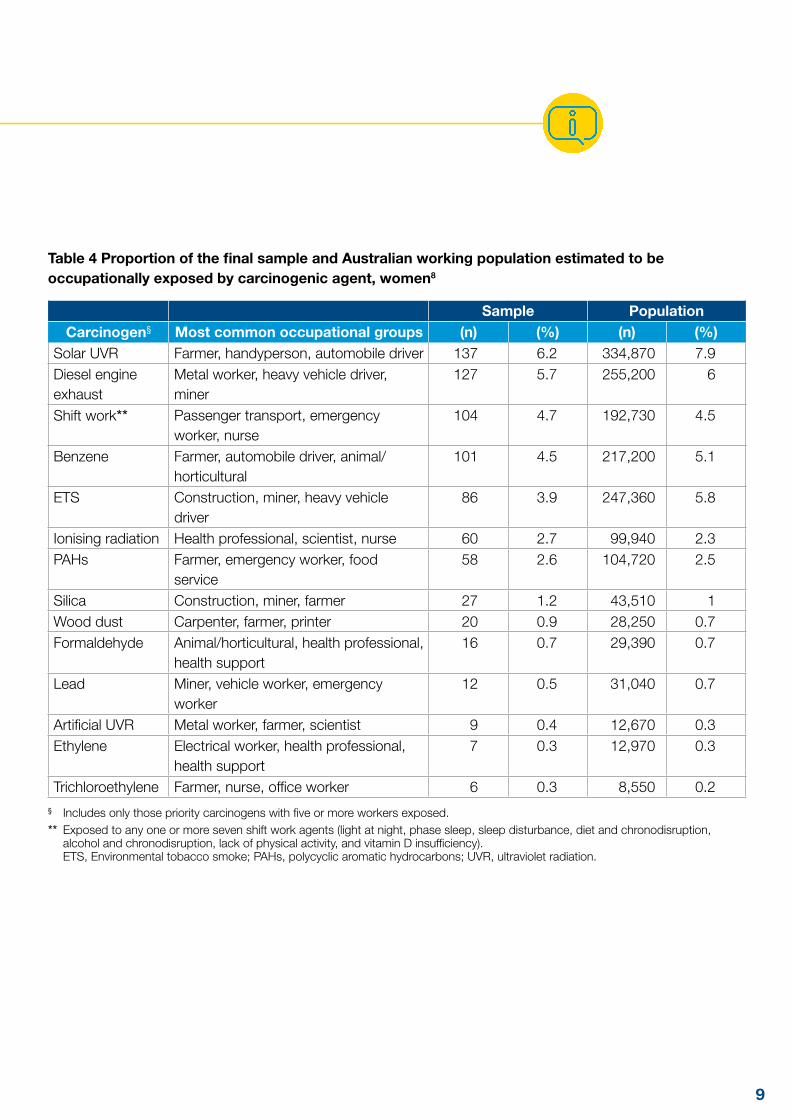
The Australian Worker Exposure Study (AWES) is the most recent attempt to fill the gaps in knowledge around occupational exposure to carcinogens in Australia. The cross-sectional study, conducted by Carey et al (2014), aimed to investigate the current prevalence of workplace exposure to carcinogens using a random sample of 5,023 current workers across Australia. Interviews of the participants in the study were conducted using a web-based application (OccIDEAS), which utilises the expert exposure method, in which participants are asked about their job tasks and then predefined algorithms are used to automatically assign carcinogenic exposures.8 The study focused on exposure to the 38 carcinogens previously identified as known and probable carcinogens among Australian workers (Table 1).1
The AWES found that 37 percent of participants were exposed to at least one occupational carcinogen in their current job.8 When applied to the Australian working population (based on 2011 Australian Census data; males and females 18-65 years of age), the study estimates 3.6 million (or 40 percent) of workers could be currently exposed to carcinogens at work. The study also examined the data across industry categories and found that farmers, drivers, miners and transport workers, as well as men holding a trade certificate and living in regional areas were at highest risk.8 Exposures were not evenly distributed across occupational groups, with the most frequent exposure being solar ultraviolet radiation (UVR), followed by diesel engine exhaust and environmental tobacco smoke for men (Table 3), and solar UVR, diesel engine exhaust and shift work for women (Table 4).
Table 2 continued
8
Table 3 Proportion of the final sample and Australian working population estimated to be occupationally exposed by carcinogenic agent, men8
Sample PopulationCarcinogen† Most common occupational groups (n) (%) (n) (%)
Solar UVR Farmer, animal/horticultural, painter 963 34.8 1,737,500 37Diesel engine exhaust
Farmer, heavy vehicle driver, miner 796 28.8 1,344,500 28.6
ETS Painter, plumber, hospitality 589 21.3 1,164,000 24.8Benzene Farmer, animal/horticultural, automobile
driver370 13.4 636,440 13.5
Lead Painter, vehicle worker, plumber 295 10.7 502,100 10.7Silica Miner, construction, engineer 289 10.5 543,390 11.6Wood dust Carpenter, painter, handyperson 271 9.8 449,470 9.6Artificial UVR Farmer, vehicle worker, metal worker 247 8.9 391,770 8.3PAHs Farmer, emergency worker, food
service239 8.6 454,160 9.7
Shift work‡ Nurse, miner, passenger transport 203 7.3 396,120 8.4Chromium VI Painter, metal worker, carpenter 168 6.1 291,930 6.2Asbestos Vehicle worker, emergency worker,
miner138 5 251,960 5.4
Formaldehyde Carpenter, painter, emergency worker 118 4.3 200,150 4.3Nickel Metal worker, plumber, vehicle worker 98 3.5 170,840 3.6Ionising radiation Health professional, miner, scientist 74 2.7 127,800 2.7Trichloroethylene Farmer, metal worker, plumber 44 1.6 73,570 1.6Arsenic Carpenter, office worker, heavy vehicle
driver33 1.2 49,750 1.1
Vinyl chloride Emergency worker, machine operator 19 0.7 40,780 0.9Ethylene oxide Emergency worker, food factory,
scientist22 0.8 46,240 1
1,3-butadiene Emergency worker 21 0.8 44,650 1Cadmium Metal worker, vehicle worker, electrical
worker 13 0.5 20,840 0.4
Nitrosamines Metal worker, scientist 8 0.3 14,710 0.3Acid mists Machine operator, metal worker,
engineer5 0.2 11,060 0.2
† Includes only those priority carcinogens with five or more workers exposed.‡ Exposed to any one or more seven shift work agents (light at night, phase sleep, sleep disturbance, diet and chronodisruption,
alcohol and chronodisruption, lack of physical activity, and vitamin D insufficiency). ETS, Environmental tobacco smoke; PAHs, polycyclic aromatic hydrocarbons; UVR, ultraviolet radiation.
Occupational exposures to carcinogens
9
Table 4 Proportion of the final sample and Australian working population estimated to be occupationally exposed by carcinogenic agent, women8
Sample PopulationCarcinogen§ Most common occupational groups (n) (%) (n) (%)
Solar UVR Farmer, handyperson, automobile driver 137 6.2 334,870 7.9Diesel engine exhaust
Metal worker, heavy vehicle driver, miner
127 5.7 255,200 6
Shift work** Passenger transport, emergency worker, nurse
104 4.7 192,730 4.5
Benzene Farmer, automobile driver, animal/horticultural
101 4.5 217,200 5.1
ETS Construction, miner, heavy vehicle driver
86 3.9 247,360 5.8
Ionising radiation Health professional, scientist, nurse 60 2.7 99,940 2.3PAHs Farmer, emergency worker, food
service58 2.6 104,720 2.5
Silica Construction, miner, farmer 27 1.2 43,510 1Wood dust Carpenter, farmer, printer 20 0.9 28,250 0.7Formaldehyde Animal/horticultural, health professional,
health support16 0.7 29,390 0.7
Lead Miner, vehicle worker, emergency worker
12 0.5 31,040 0.7
Artificial UVR Metal worker, farmer, scientist 9 0.4 12,670 0.3Ethylene Electrical worker, health professional,
health support7 0.3 12,970 0.3
Trichloroethylene Farmer, nurse, office worker 6 0.3 8,550 0.2§ Includes only those priority carcinogens with five or more workers exposed.** Exposed to any one or more seven shift work agents (light at night, phase sleep, sleep disturbance, diet and chronodisruption,
alcohol and chronodisruption, lack of physical activity, and vitamin D insufficiency). ETS, Environmental tobacco smoke; PAHs, polycyclic aromatic hydrocarbons; UVR, ultraviolet radiation.
10
3.4 Limitations of these estimatesIt is often very difficult to determine if an individual cancer is attributable to occupation, because:
• the development of a tumour is a multi-step process that can take place over decades;
• most tumours have a long latency period between exposure and the development of symptoms;
• some exposures, such as solar UVR, can occur in both a work and non-work context; and
• other known non-occupational cancer risk factors may be present or have previously been present (e.g. tobacco smoking or obesity).
The complex causes of cancer complicate judgments about whether a particular case is definitively linked to a clear and established occupational exposure and therefore confounds attempts to estimate the proportion of cancers caused by occupation. This also leads to challenges in assessing what circumstances (i.e. connecting a particular cancer diagnosis with a specific occupational exposure) merit compensation (see section 4.1). Exceptions are cases where the type of cancer is very rare (e.g. vinyl chloride manufacture and angiosarcoma of the liver9) or where a strong relationship has been established between a known but situationally specific risk factor (e.g. asbestos) and the type of cancer a patient develops (e.g. mesothelioma10).
Both the AWES and the 2006 estimates are based on four separate data sets, only two of which are reasonably accurate in an Australian context:
1) A list of occupational carcinogens.
Although there is no definitive list of occupational carcinogens, as described in Section 2, a recent investigation has allowed for a priority list of carcinogens specific to Australia to be developed, based on the potential for occupational exposure and the evidence of use in Australian industry (Table 1).1
2) Estimates of increased risk for each carcinogen and the link to each cancer type. A Finnish study from 2001 collected many such risk estimates from across the scientific literature, from which Fritschi and Driscoll (2006) took their lead.7 A British group in 2012 similarly reviewed the literature for risk estimates (see Section 3.4).11
Such estimates include a degree of uncertainty due to:
• a lack of assessment for some combinations of exposures and cancers;
• evidence from small case-control studies may be unreliable as a result of unidentified biases;
• a bias within the literature towards research into risks for men over women; and
• the often healthier nature of active workers, which may underestimate the true risk compared to the general population. This is known as the “healthy worker effect”.
Europe and Australia may differ in terms of the effects of each carcinogen, due to differences in industrial practices or environmental conditions—for example, Australia experiences stronger solar UVR, but has less exposure to radon gas. It is unlikely that we will ever know precisely how large these differences are for every combination of carcinogen and type of cancer, given the difficulties, cost and uncertainties of carrying out further local detailed epidemiological studies.
3) Accurate information on the frequency and extent of exposure to each carcinogen in Australia. With the exception of chrysotile asbestos, no such data exists for Australia.12 Fritschi describes this as the biggest gap in information when assessing exposure risks associated with carcinogens in Australian workplaces.6 Fritschi’s 2006 estimates are based on Finnish figures estimating how many people are exposed to carcinogens in different
Occupational exposures to carcinogens
11
industry sectors.6 These datasets are both more than 20 years out of date and often geographically irrelevant—for example, Finland and Australia differ in their predominant manufacturing industries, and each country mines for different target minerals and resources in varying quantities.
While the AWES provides further insight, it is impossible to establish direct measurements of the precise extent of exposure to, and exact impact of, 38 carcinogens given the diversity of workplaces throughout Australia.7 The survey relies on self-reporting of tasks undertaken at work, from which exposure is inferred. In addition, the sample was limited by budget and only assessed 5,023 people nationally.7 As such, it is more accurate for common or easily identified exposures but less so for rare or obscure carcinogens. Despite these challenges this study remains the best estimates available.
There is precedent for more comprehensive data-collection initiatives. The EU CAREX (CARcinogen EXposure) database (www.carex-eu.org/) contains estimates of exposure to 139 carcinogens across 19 European countries, based on estimates from the US and Finland (first phase), with adjustments to these estimates made by a network of national experts for their respective countries (second phase). This survey relied on the availability of large databases of measurements of exposure taken over many years in a wide range of industries. CAREX Canada (www.carexcanada.ca/en/) expanded the concept through a multi-million-dollar “national surveillance project that estimates the number of Canadians exposed to substances associated with cancer in workplace and community environments”. It combines data from multiple sources including the scientific literature, regulatory agencies, industry, provincial health and safety organisations, among others.
A simpler model might be to link individual cancer cases to specific occupations, but this is not straightforward. Some cancer registries already note occupation, but information collection for these registries is not standardised. For example, many patients are retired and only provide their last job or do not state a job at all. Information relating only to a patient’s last job is less useful, because many cancers have long latencies; so a complete occupational history, detailing every past job for decades, is needed.
4) Annual numbers of different cancer types. This information, fortunately, is both reliable and easily accessible from State cancer registries and nationally via the AIHW.
An additional consideration is that neither study investigated the presence or adequacy of workplace controls which may be in place that would reduce or eliminate the potential risk of exposure to workplace carcinogens. This was beyond the scope of the studies, and is also a difficult (and costly) task to undertake, as it would need to consider assessments of individual workplaces. This further highlights the employer’s duty to ensure that their safety management system is both identifying and reducing the risk posed by each hazard so far as is reasonably practicable.
Regardless of these uncertainties, it is clear from these estimates that the burden of occupational cancer is higher than the early estimates of Doll and Peto (1981), or any earlier Australian research that adopted their methodology.
12
3.5 Estimates from other countries A recent British study from Rushton et al (2012)concluded that four percent of cancer cases and 5.3 percent of cancer deaths were due to occupational factors, a slight increase over the Doll and Peto estimate in 1981.11 The team concluded that the most important cancer types with occupational causes were mesothelioma, sinonasal, lung, nasopharynx, breast and non-melanoma skin cancer. The most significant carcinogens were asbestos, mineral oils, solar radiation, silica, diesel engine exhaust, coal tars and pitches, dioxins, environmental tobacco smoke, radon, tetrachloroethylene, arsenic, strong inorganic mists, and shift work – all of which feature on the Australian priority list – along with working as a painter or welder.11
Industry sectors and occupations with either a high cancer burden or high exposure to carcinogenic agents included construction, metal working, personal/household services, mining, land transport, printing/publishing, retail/hotels/restaurants, public administration/defence, farming and several manufacturing sectors. Fifty six percent of occupationally related cancer registrations in British men were attributable to work in the construction industry (mainly mesotheliomas, lung, bladder and non-melanoma skin cancers) and 54 percent of those cancer registrations in women were attributable to shift work (breast cancer).11
In New Zealand, a study by Driscoll et al (2004) estimated that between two and five percent of cancers in New Zealand, among people aged 30 or older, are due to work-related causes.13
Occupational exposures to carcinogens
13
All Australian jurisdictions have ‘no-fault’ workers’ compensation schemes for injuries that are work- related. These have a statutory basis and enable workers to recover full compensation for injuries, which may include physical injuries and illnesses and the aggravation or acceleration of pre-existing injuries.
Safe Work Australia collates and manages data on claims made under these workers’ compensation schemes.14 Although this data provides useful insights, these workers’ compensation statistics do not capture all compensation claims for work-related injuries and diseases in Australia for the reasons below:
• self-employed workers are not covered by workers’ compensation claims, yet around 10% of Australian workers are self-employed;
• sole traders and independent contractors may not be covered by statutory workers’ compensation schemes;
• while the majority of employees are covered for workers’ compensation, under general Commonwealth, State and Territory workers’ compensation legislation, some specific groups of workers are covered under separate legislation. Every effort has been made to compile data from all groups of employees, but it is currently known that, for example, those claims lodged by police in Western Australia and military personnel within the Defence Forces are excluded;
• diseases are significantly under-represented in workers’ compensation statistics. That is because many diseases result from long-term exposure to agents or have long latency periods, making the link between the work-related disease and specific exposures in specific workplaces often difficult to establish;
• data from Safe Work Australia data does not capture common law claims for damages for work-related injuries and illnesses. Persons with work-related cancers, particularly mesothelioma, may choose to pursue a common law claim for damages rather than compensation under the statutory schemes for workers. It is beyond the scope of this paper to estimate the value of these claims; and
• occupational cancer cases compensated under the New South Wales Dust Diseases Board are not captured as part of Safe Work Australia data.
4.1 Compensation paid for workers with cancers determined to be attributed to occupational exposures
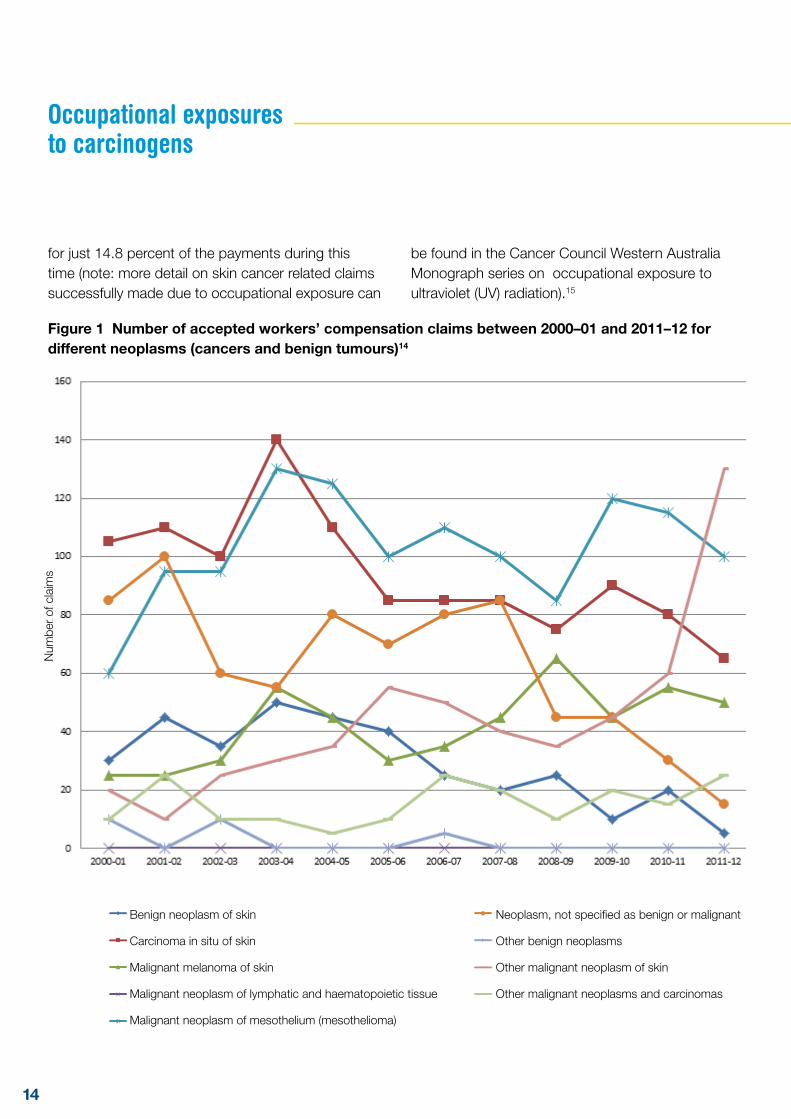
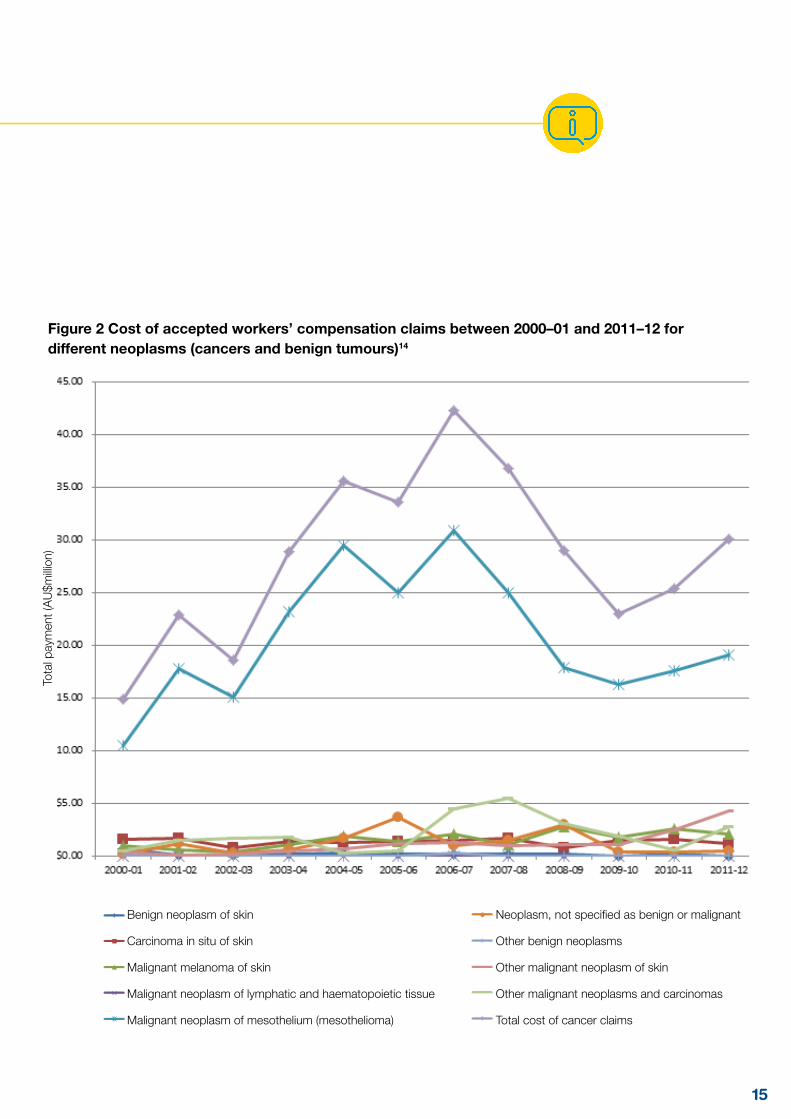
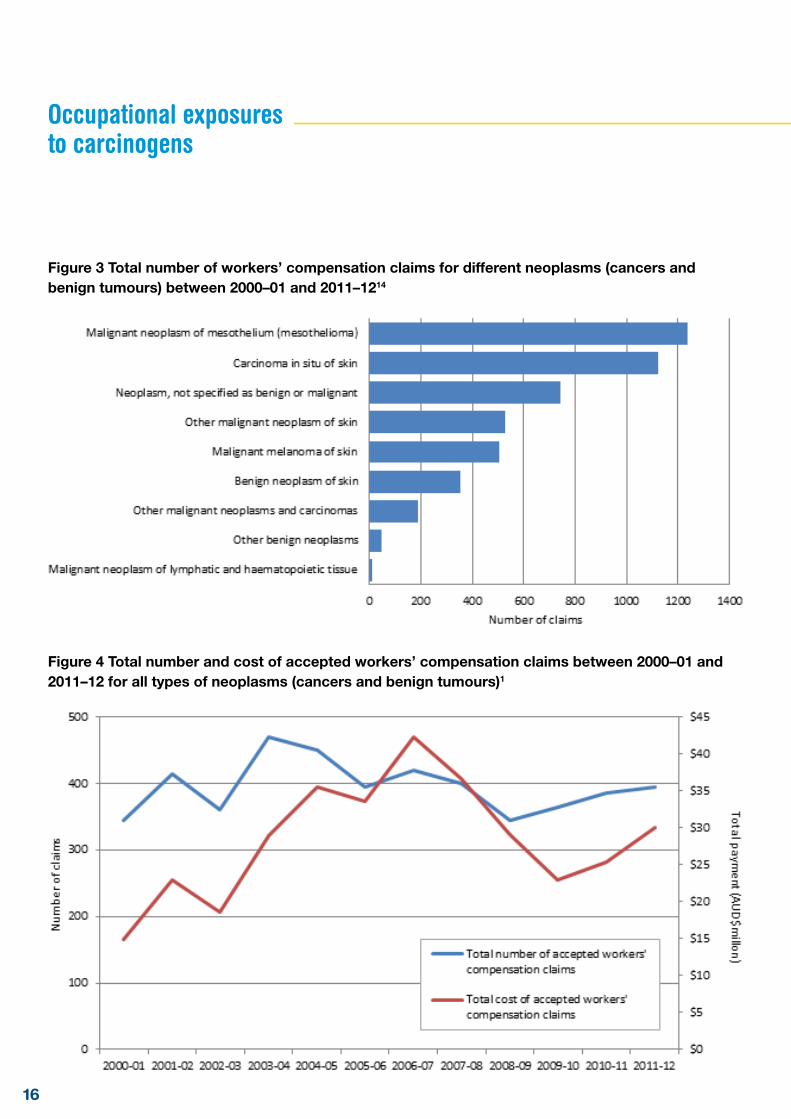
Data collected by Safe Work Australia between financial years 2000-01 to 2011-1214 shows that 4,745 claims were accepted for ‘cancer or benign tumours’, at a total cost of AU$360.5 million.†† Over the reporting period the total number of claims for cancers or benign tumours fell slightly, although the data does not show a clear trend. Skin cancers, combining both melanoma and non-melanoma skin cancers, remain the highest contributor to reported claims data, accounting for 53 percent of the number of claims made during this period, while mesotheliomas were the second highest contributor, accounting for a further 26.1 percent of cancer claims.
Although the total number of mesothelioma claims is lower than those of skin cancer, they typically result in much larger compensation payments, and as such, accounted for 73 percent of the payments from 2000-2012. In contrast, skin cancers accounted
4. Workers’ compensation claims statistics
†† Data has been rounded to the nearest five claims for confidentiality purposes. “Total cost” for this time period is likely to increase in the future as open claims are finalised.
14
for just 14.8 percent of the payments during this time (note: more detail on skin cancer related claims successfully made due to occupational exposure can
be found in the Cancer Council Western Australia Monograph series on occupational exposure to ultraviolet (UV) radiation).15
Figure 1 Number of accepted workers’ compensation claims between 2000–01 and 2011–12 for different neoplasms (cancers and benign tumours)14
Occupational exposures to carcinogens
Benign neoplasm of skin
Carcinoma in situ of skin
Malignant melanoma of skin
Malignant neoplasm of lymphatic and haematopoietic tissue
Malignant neoplasm of mesothelium (mesothelioma)
Neoplasm, not specified as benign or malignant
Other benign neoplasms
Other malignant neoplasm of skin
Other malignant neoplasms and carcinomas
Num
ber
of c
laim
s
15
Figure 2 Cost of accepted workers’ compensation claims between 2000–01 and 2011–12 for different neoplasms (cancers and benign tumours)14
Benign neoplasm of skin
Carcinoma in situ of skin
Malignant melanoma of skin
Malignant neoplasm of lymphatic and haematopoietic tissue
Malignant neoplasm of mesothelium (mesothelioma)
Neoplasm, not specified as benign or malignant
Other benign neoplasms
Other malignant neoplasm of skin
Other malignant neoplasms and carcinomas
Total cost of cancer claims
Tota
l pay
men
t (A
U$m
illion
)
1616
Figure 3 Total number of workers’ compensation claims for different neoplasms (cancers and benign tumours) between 2000–01 and 2011–1214
Occupational exposures to carcinogens
Figure 4 Total number and cost of accepted workers’ compensation claims between 2000–01 and 2011–12 for all types of neoplasms (cancers and benign tumours)1
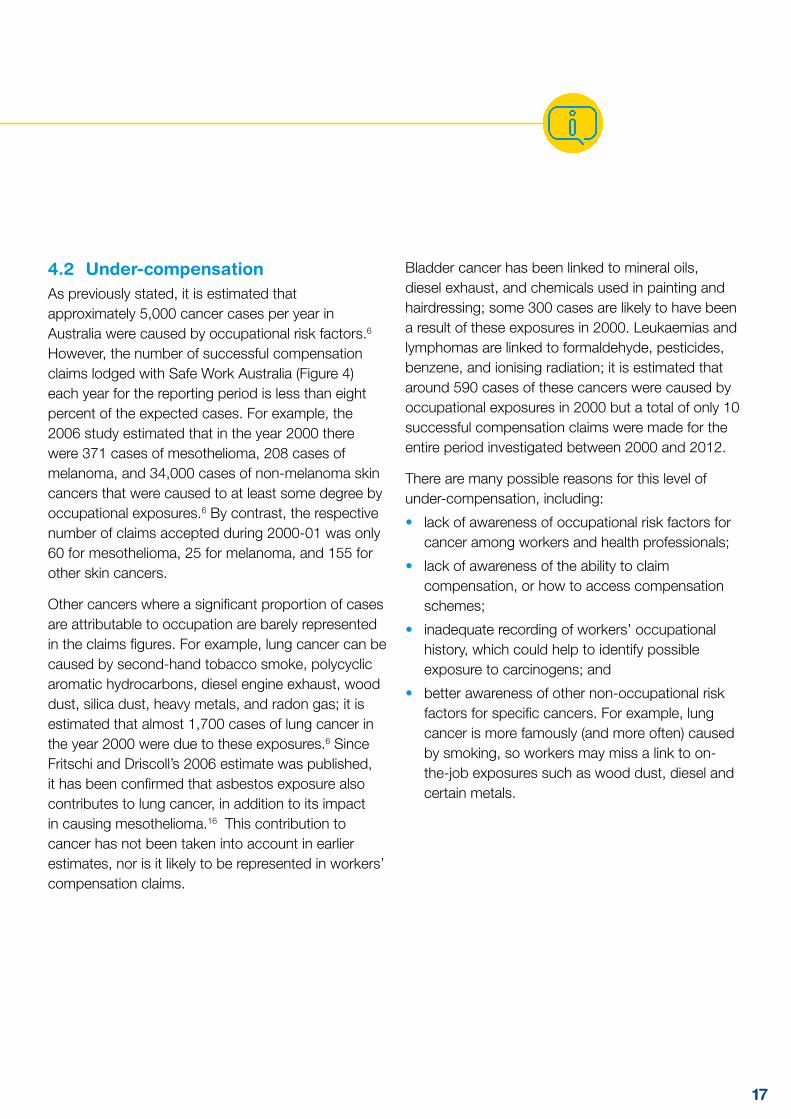
4.2 Under-compensation As previously stated, it is estimated that approximately 5,000 cancer cases per year in Australia were caused by occupational risk factors.6 However, the number of successful compensation claims lodged with Safe Work Australia (Figure 4) each year for the reporting period is less than eight percent of the expected cases. For example, the 2006 study estimated that in the year 2000 there were 371 cases of mesothelioma, 208 cases of melanoma, and 34,000 cases of non-melanoma skin cancers that were caused to at least some degree by occupational exposures.6 By contrast, the respective number of claims accepted during 2000-01 was only 60 for mesothelioma, 25 for melanoma, and 155 for other skin cancers.
Other cancers where a significant proportion of cases are attributable to occupation are barely represented in the claims figures. For example, lung cancer can be caused by second-hand tobacco smoke, polycyclic aromatic hydrocarbons, diesel engine exhaust, wood dust, silica dust, heavy metals, and radon gas; it is estimated that almost 1,700 cases of lung cancer in the year 2000 were due to these exposures.6 Since Fritschi and Driscoll’s 2006 estimate was published, it has been confirmed that asbestos exposure also contributes to lung cancer, in addition to its impact in causing mesothelioma.16 This contribution to cancer has not been taken into account in earlier estimates, nor is it likely to be represented in workers’ compensation claims.
Bladder cancer has been linked to mineral oils, diesel exhaust, and chemicals used in painting and hairdressing; some 300 cases are likely to have been a result of these exposures in 2000. Leukaemias and lymphomas are linked to formaldehyde, pesticides, benzene, and ionising radiation; it is estimated that around 590 cases of these cancers were caused by occupational exposures in 2000 but a total of only 10 successful compensation claims were made for the entire period investigated between 2000 and 2012.
There are many possible reasons for this level of under-compensation, including:
• lack of awareness of occupational risk factors for cancer among workers and health professionals;
• lack of awareness of the ability to claim compensation, or how to access compensation schemes;
• inadequate recording of workers’ occupational history, which could help to identify possible exposure to carcinogens; and
• better awareness of other non-occupational risk factors for specific cancers. For example, lung cancer is more famously (and more often) caused by smoking, so workers may miss a link to on-the-job exposures such as wood dust, diesel and certain metals.
17
18
Australians should be able to carry out a day’s work, and conduct their working life without adding to their risk of cancer. However, not all of the causes of cancer are known to science. Some cancer causes are known and clear. Known carcinogens should as much as possible be removed from the workplace. Where this is impossible all reasonable steps would be taken to minimise the exposure and the associated cancer risk. In circumstances where that exposure has occurred and a resultant cancer diagnosis occurs, compensation should be made available.
This report shows that on average each year, more than 395 Australian workers are paid a combined total of more than AU$30.0 million per year in compensation as a result of cancers caused, at least in part, by exposure at work to known carcinogens. It also shows that this is likely to be far less than what might be the actual number of cancer cases caused by exposure to carcinogens at work. More work is needed to reduce exposure to known carcinogens in the Australian workplace and more is needed to ensure those who are affected by these carcinogens are properly compensated.
5. Conclusions
Occupational exposures to carcinogens
19
References1. Fernandez RC, Driscoll TR, Glass DC, Vallance D, Reid A, Benke G et al. A priority list of occupational
carcinogenic agents for preventative action in Australia. Aust NZ J Public Health. 2012;36:111-115.
2. Reid A, Heyworth J, De Klerk N, Musk A. Cancer incidence among women and girls environmentally and occupationally exposed to blue asbestos at Wittenoom, Western Australia. Int J Cancer. 2008;122(10):2337-2344.
3. International Agency for Research on Cancer. Painting, Firefighting, and Shiftwork Vol 98, in IARC Monographs on the Evaluation of Carcinogenic Risks to Humans. Lyon, France: IARC World Health Organisation; 2010.
4. International Agency for Research on Cancer. IARC Monographs on the Evaluation of Carcinogenic Risks to Humans, Volumes 1-108. Lyon, France: International Agency for Research on Cancer; 1972-2014.
5. Doll, R. and R. Peto. The causes of cancer: quantitative estimates of avoidable risks of cancer in the United States today. Journal Nat Cancer Inst. 1981;66:1191-1308.
6. Fritschi, L. and T. Driscoll. Cancer due to occupation in Australia. J Public Health. 2006;30:213-219.
7. Nurminen, M. and A. Karjalainen. Epidemiologic estimate of the proportion of fatalities related to occupational factors in Finland. Scand J Work Environ Health. 2001;27:161-213.
8. Carey, R.N., et al. Estimated prevalence of exposure to occupational carcinogens in Australia (2011-2012). Occup Environ Med. 2014;71(1):55-62.
9. CDC. Epidemiologic notes and reports. Angiosarcoma of the liver among polyvinyl chloride workers - Kentucky. MMWR Morb Mortal Wkly Rep. 1997;46: 97-101.
10. Tossavainen, A. Global Use of Asbestos and the Incidence of Mesothelioma. Int J Occup Environ Health. 2004;10(1): 22-25.
11. Rushton L, et al. Occupational cancer burden in Great Britain. British J Cancer. 2012;107:S3-7.
12. National Occupational Health and Safety Commission, Regulatory Impact Statement of the Proposed Phase Out of Chrysotile Asbestos. Canberra, Australia: NOHSC; 2001.
13. Driscoll, T., et al. The Burden of Occupational Disease and Injury in New Zealand: Technical Report. National Occupational Health and Safety Advisory Committee: Wellington. 2001
14. Safe Work Australia. National Dataset for Workers’ Compensation Statistics (NDS): Accepted workers compensation claims for Neoplasms (cancers and benign tumours). Canberra, Australia; Safe Work Australia; 2015. Requested date: 17-02-2015.
15. Cancer Council Western Australia. Occupational exposure to ultraviolet (UV) radiation: Workers’ compensation claims paid in Australia 2000-2009. Monograph Series 2011. Perth, Australia; 2011.
16. McCormack V, et al. Estimating the asbestos-related lung cancer burden from mesothelioma mortality. British J Cancer. 2012;106(3):575-584.


To access any of our services, programs or information about cancer, call one of our Cancer Nurses on 13 11 20. This is a confidential service, available Statewide for the cost of a local call Monday to Friday 8 am – 6 pm.
www.cancerwa.asn.au