Embed Size (px)
Citation preview
Louisiana Workforce Information Review 20142
Louisiana WorkforceInformation Review 2014
Statewide Report
Bobby JindalGovernor
Curt Eysink, Executive DirectorLouisiana Workforce Commission
Raj Jindal, Director, Information Technology DirectorLouisiana Workforce Commission
1001 North 23rd StreetP. O. Box 94094
Baton Rouge, Louisiana 70804-9094(225) 342-3141 • (888) 302-7662
FAX (225) 342-9192
http://www.laworks.net
Equal Opportunity Employer/ProgramAuxiliary Aids and Services Are Available Upon Request to Individuals with Disabilities
1-800-259-5154 (TDD)
2
Louisiana WorkforceInformation Review 2014
Statewide Report
Bobby Jindal Governor
Curt Eysink, Executive Director Louisiana Workforce Commission
1001 North 23rd Street P. O. Box 94094
Baton Rouge, Louisiana 70804-9094 (225) 342-3141, (888) 302-7662
FAX (225) 342-9192
Visit our Web site at http://www.laworks.net
Equal Opportunity Employer/Program
Auxiliary Aids and Services Are Available Upon Request to Individuals with Disabilities1-800-259-5154 (TDD)

Louisiana Workforce Information Review 2014 3
Dear Governor Jindal:
The Louisiana Workforce Information Review 2014 is intended to serve as a tool to provide strategic economic demographic information for Louisiana and its regions, including data relevant in evaluating changes to the State’s economy during 2012-2013 that will assist local Workforce Investment Boards (WIBs) in making informed decisions regarding statewide and area economies. The latest available annual averages for 2012 and 2013 were used in analyzing unemployment compensation claims, mass layoffs, civilian labor force, occupational wages, and employment by industry. Regional data also include the revised forecast for the industry and occupational projections to 2022 to denote future employment demand. The publication is in a portable document format (PDF) file and can be downloaded at laworks.net. Simply select Labor Market Information, then LMI Downloads, then scroll down the list of available publications and choose Louisiana Workforce Information Review 2014. With questions, please feel free to contact me at 225.342.3001 [email protected] Sincerely, Curt EysinkExecutive DirectorLouisiana Workforce Commission
Letter to The Governor
Louisiana Workforce Information Review 20144
Executive Summary
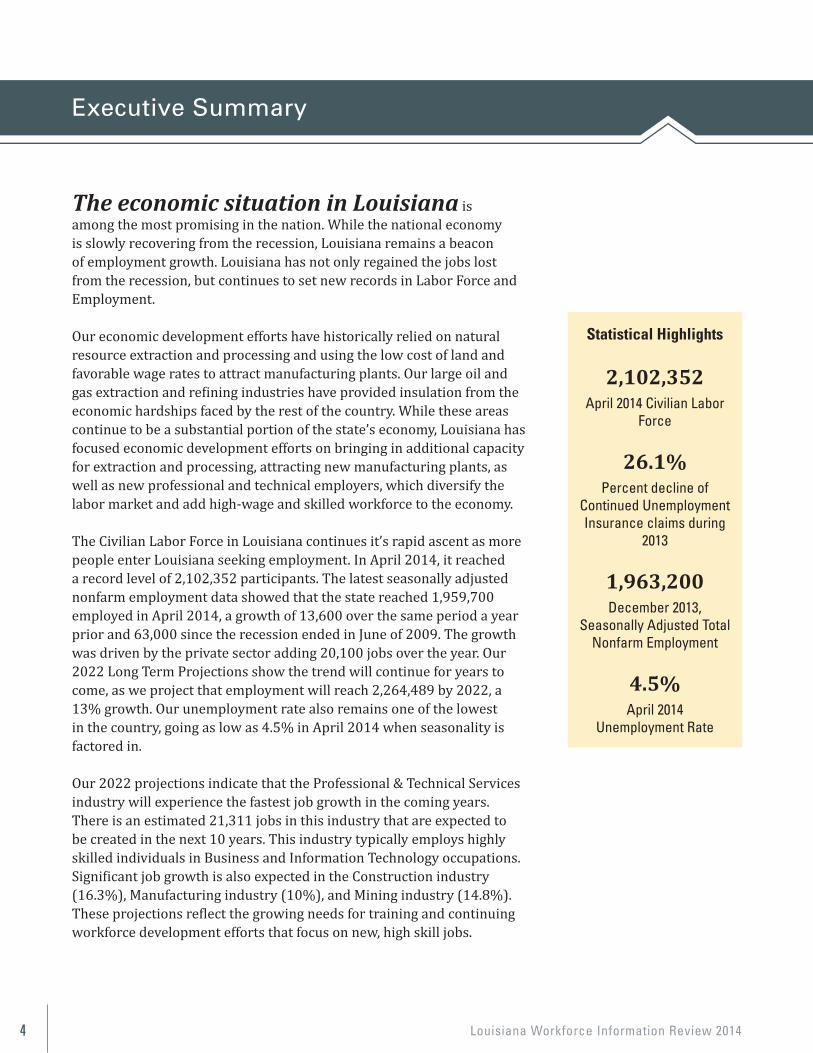
The economic situation in Louisiana is among the most promising in the nation. While the national economy is slowly recovering from the recession, Louisiana remains a beacon of employment growth. Louisiana has not only regained the jobs lost from the recession, but continues to set new records in Labor Force and Employment.
Our economic development efforts have historically relied on natural resource extraction and processing and using the low cost of land and favorable wage rates to attract manufacturing plants. Our large oil and gas extraction and refining industries have provided insulation from the economic hardships faced by the rest of the country. While these areas continue to be a substantial portion of the state’s economy, Louisiana has focused economic development efforts on bringing in additional capacity for extraction and processing, attracting new manufacturing plants, as well as new professional and technical employers, which diversify the labor market and add high-wage and skilled workforce to the economy.
The Civilian Labor Force in Louisiana continues it’s rapid ascent as more people enter Louisiana seeking employment. In April 2014, it reached a record level of 2,102,352 participants. The latest seasonally adjusted nonfarm employment data showed that the state reached 1,959,700 employed in April 2014, a growth of 13,600 over the same period a year prior and 63,000 since the recession ended in June of 2009. The growth was driven by the private sector adding 20,100 jobs over the year. Our 2022 Long Term Projections show the trend will continue for years to come, as we project that employment will reach 2,264,489 by 2022, a 13% growth. Our unemployment rate also remains one of the lowest in the country, going as low as 4.5% in April 2014 when seasonality is factored in.
Our 2022 projections indicate that the Professional & Technical Services industry will experience the fastest job growth in the coming years. There is an estimated 21,311 jobs in this industry that are expected to be created in the next 10 years. This industry typically employs highly skilled individuals in Business and Information Technology occupations. Significant job growth is also expected in the Construction industry (16.3%), Manufacturing industry (10%), and Mining industry (14.8%). These projections reflect the growing needs for training and continuing workforce development efforts that focus on new, high skill jobs.
Statistical Highlights
2,102,352April 2014 Civilian Labor
Force
26.1%Percent decline of
Continued UnemploymentInsurance claims during
2013
1,963,200December 2013,
Seasonally Adjusted TotalNonfarm Employment
4.5%April 2014
Unemployment Rate
Louisiana Workforce Information Review 2014 5
Table of Contents
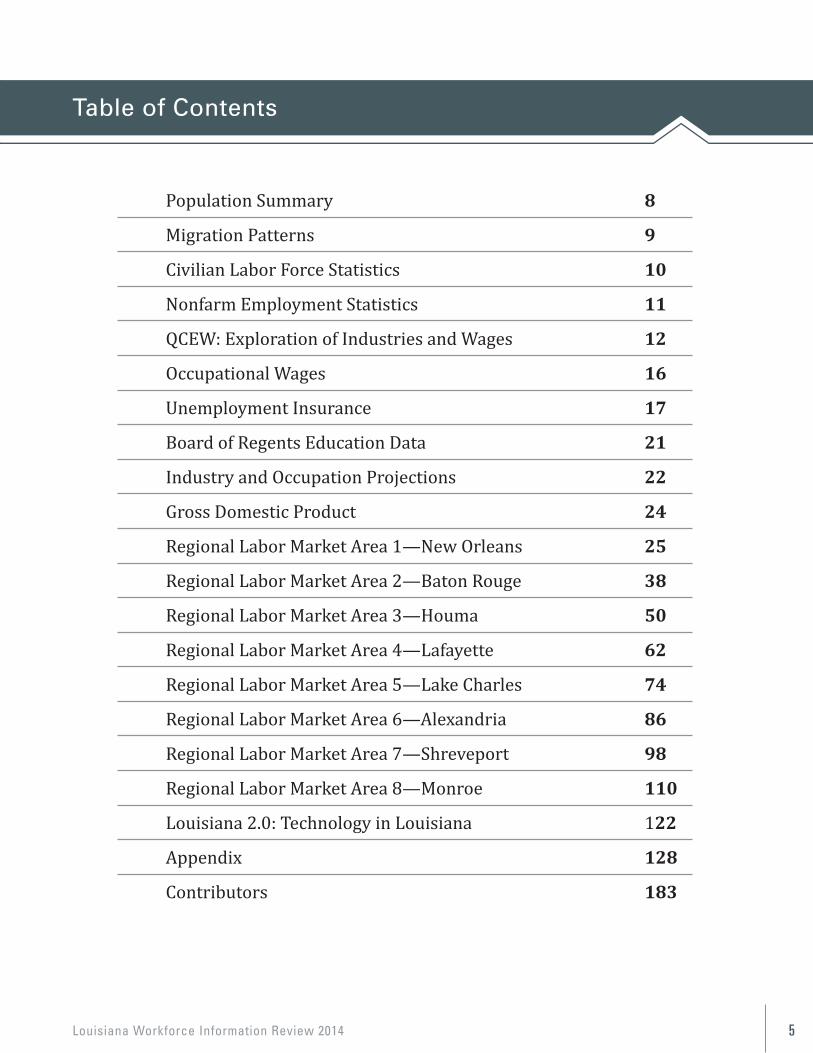
Population Summary 8
Migration Patterns 9
Civilian Labor Force Statistics 10
Nonfarm Employment Statistics 11
QCEW: Exploration of Industries and Wages 12
Occupational Wages 16
Unemployment Insurance 17
Board of Regents Education Data 21
Industry and Occupation Projections 22
Gross Domestic Product 24
Regional Labor Market Area 1—New Orleans 25
Regional Labor Market Area 2—Baton Rouge 38
Regional Labor Market Area 3—Houma 50
Regional Labor Market Area 4—Lafayette 62
Regional Labor Market Area 5—Lake Charles 74
Regional Labor Market Area 6—Alexandria 86
Regional Labor Market Area 7—Shreveport 98
Regional Labor Market Area 8—Monroe 110
Louisiana 2.0: Technology in Louisiana 122
Appendix 128
Contributors 183
Louisiana Workforce Information Review 20146
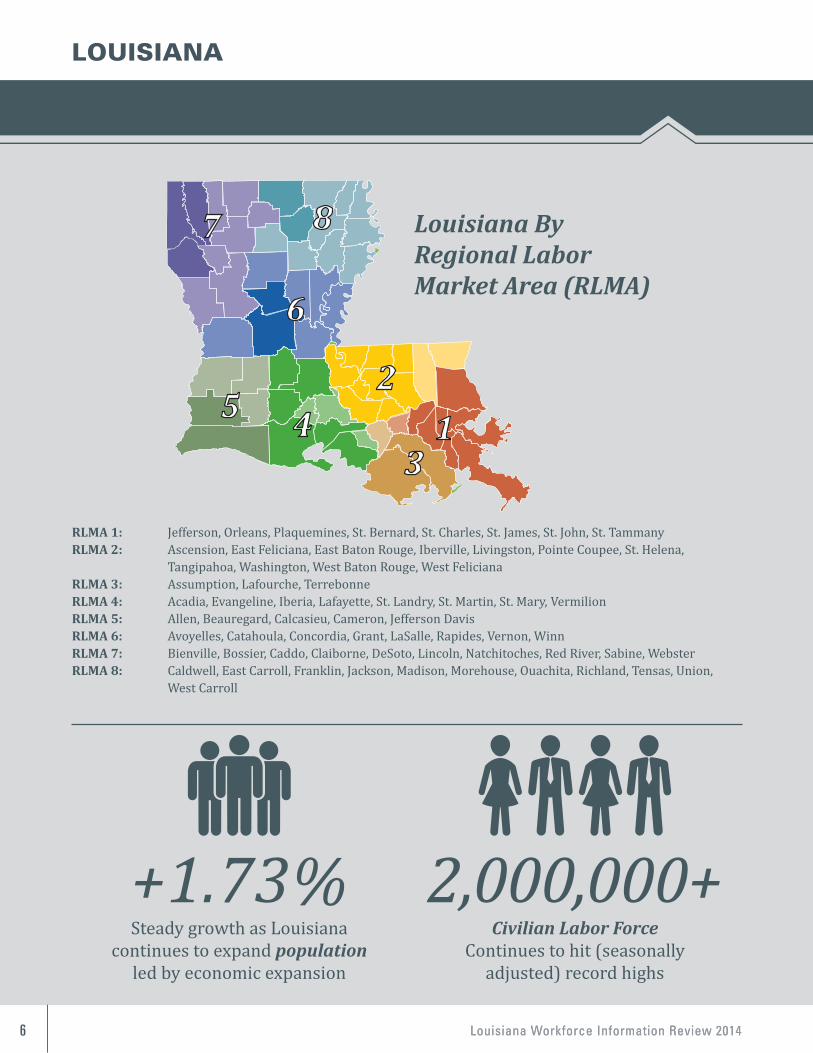
RLMA 1: Jefferson, Orleans, Plaquemines, St. Bernard, St. Charles, St. James, St. John, St. TammanyRLMA 2: Ascension, East Feliciana, East Baton Rouge, Iberville, Livingston, Pointe Coupee, St. Helena, Tangipahoa, Washington, West Baton Rouge, West FelicianaRLMA 3: Assumption, Lafourche, TerrebonneRLMA 4: Acadia, Evangeline, Iberia, Lafayette, St. Landry, St. Martin, St. Mary, VermilionRLMA 5: Allen, Beauregard, Calcasieu, Cameron, Jefferson DavisRLMA 6: Avoyelles, Catahoula, Concordia, Grant, LaSalle, Rapides, Vernon, WinnRLMA 7: Bienville, Bossier, Caddo, Claiborne, DeSoto, Lincoln, Natchitoches, Red River, Sabine, WebsterRLMA 8: Caldwell, East Carroll, Franklin, Jackson, Madison, Morehouse, Ouachita, Richland, Tensas, Union, West Carroll
Louisiana Workforce Information Review 2014
LOUISIANA
Steady growth as Louisiana continues to expand population
led by economic expansion
+1.73%Civilian Labor Force
Continues to hit (seasonally adjusted) record highs
2,000,000+
12
345
6
7 8 Louisiana ByRegional LaborMarket Area (RLMA)
Louisiana Workforce Information Review 2014 7
LOUISIANA
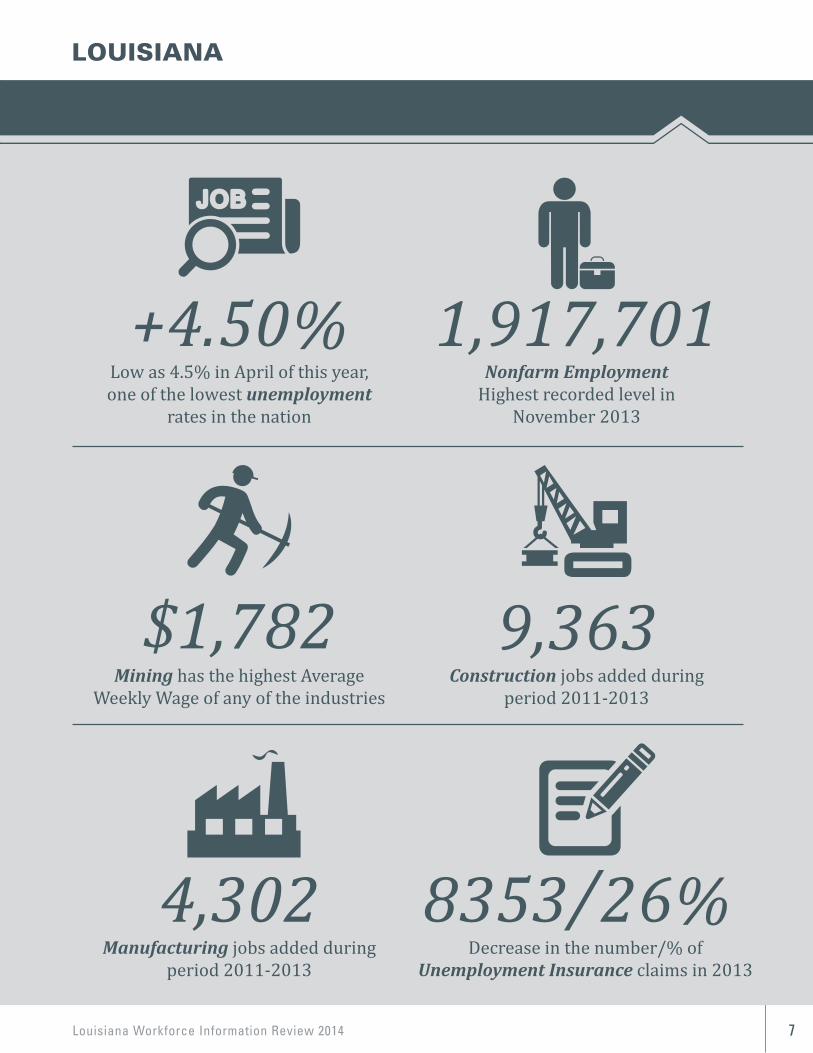
Nonfarm Employment Highest recorded level in
November 2013
1,917,701
Construction jobs added during period 2011-2013
9,363
Decrease in the number/% of Unemployment Insurance claims in 2013
8353/26%
Low as 4.5% in April of this year, one of the lowest unemployment
rates in the nation
+4.50%
Mining has the highest Average Weekly Wage of any of the industries
$1,782
Manufacturing jobs added during period 2011-2013
4,302
Louisiana Workforce Information Review 20148
Statewide Population Demographics
7
Statewide Population Demographics
4,545.39
4,575.20
4,602.13
4,625.47
4,500.00
4,520.00
4,540.00
4,560.00
4,580.00
4,600.00
4,620.00
4,640.00
2010 2011 2012 2013
Popu
latio
n, T
hous
ands
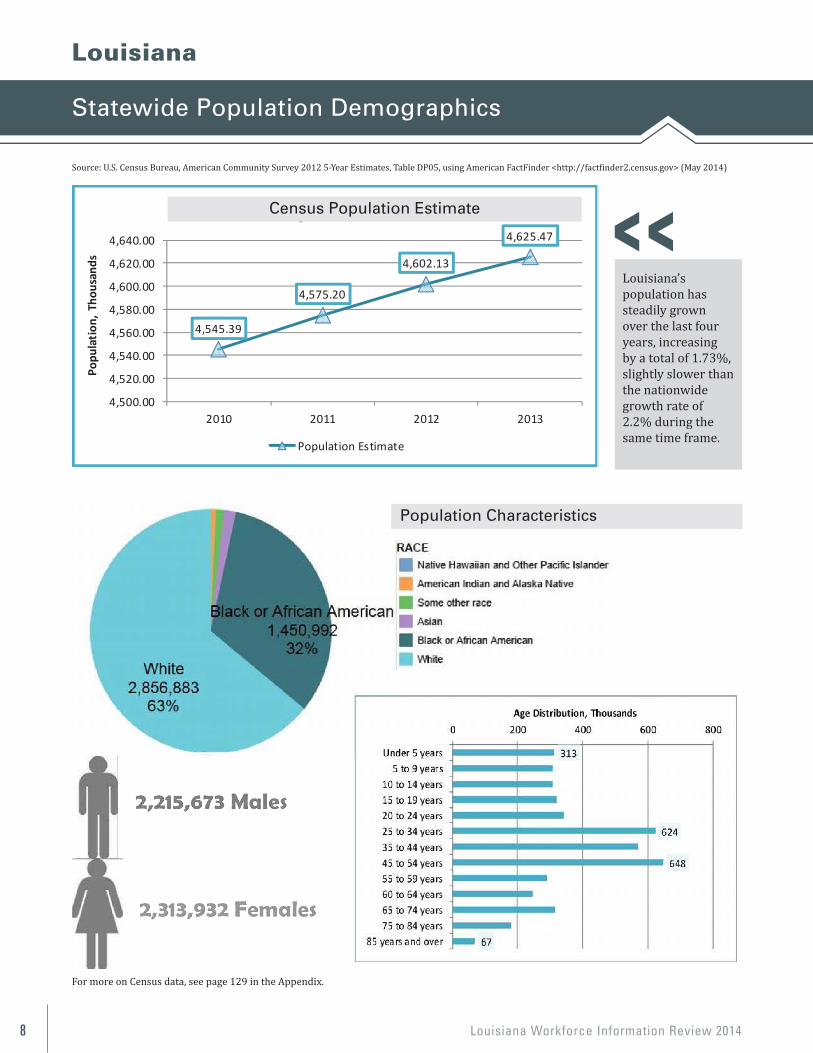
Census Population Estimate
Population Estimate
Louisiana’s population has steadily grown over the last four years, increasing by a total of 1.73%. This is slightly slower than the nationwide growth rate of 2.2% during the same timeframe.
2,215,673 Males
2,313,932 Females
313
624
648
67
0 200 400 600 800
Under 5 years 5 to 9 years
10 to 14 years 15 to 19 years 20 to 24 years 25 to 34 years 35 to 44 years 45 to 54 years 55 to 59 years 60 to 64 years 65 to 74 years 75 to 84 years
85 years and over
Age Distribution, Thousands
Source: U.S. Census Bureau, American Community Survey 2012 5-Year Estimates, Table DP05, using American FactFinder <http://factfinder2.census.gov> (May 2014)
For more on Census data, see page 108 in the Appendix.
Population Characteristics
Source: U.S. Census Bureau, American Community Survey 2012 5-Year Estimates, Table DP05, using American FactFinder <http://factfinder2.census.gov> (May 2014)
For more on Census data, see page 129 in the Appendix.
Population Characteristics
Louisiana’spopulation hassteadily grownover the last fouryears, increasingby a total of 1.73%, slightly slower than the nationwide growth rate of 2.2% during the same time frame.
Louisiana
Census Population Estimate
Population Characteristics
Louisiana Workforce Information Review 2014 9
Migration Patterns
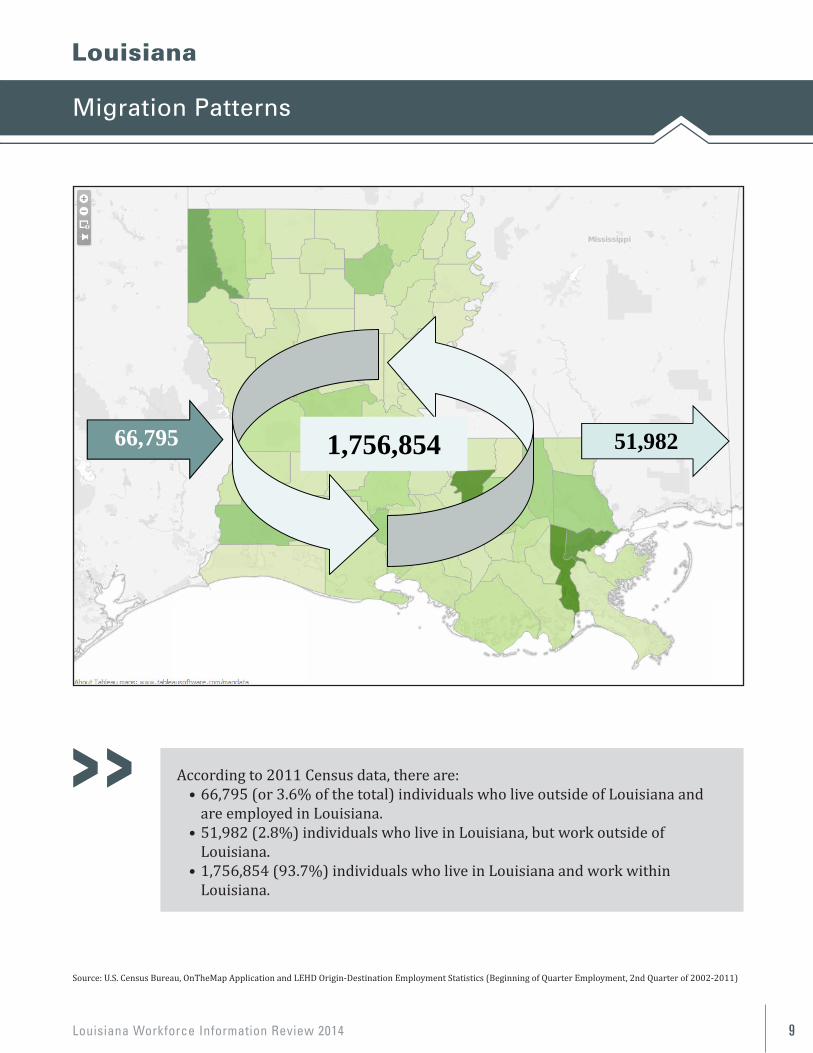
According to 2011 Census data, there are:• 66,795 (or 3.6% of the total) individuals who live outside of Louisiana and
are employed in Louisiana.• 51,982 (2.8%) individuals who live in Louisiana, but work outside of
Louisiana.• 1,756,854 (93.7%) individuals who live in Louisiana and work within
Louisiana.
Source: U.S. Census Bureau, OnTheMap Application and LEHD Origin-Destination Employment Statistics (Beginning of Quarter Employment, 2nd Quarter of 2002-2011)
8
Volume 1 , Issue 1 Newslet ter Date
MIGRATION PATTERNS Louis iana
According to 2011 Census data, there are
66,795 (or 3.6% of the total) individuals who live outside of Louisiana and are employed in Louisiana.
51,982 (2.8%) individuals who live in Louisiana, but work outside of Louisiana.
1,756,854 (93.7%) individuals who live in Louisiana and work within Louisiana.
Source: U.S. Census Bureau, OnTheMap Application and LEHD Origin-Destination Employment Statistics (Beginning of Quarter Employment, 2nd Quarter of 2002-2011
66,795 51,9821,756,854
Louisiana
Louisiana Workforce Information Review 201410
Civilian Labor Force
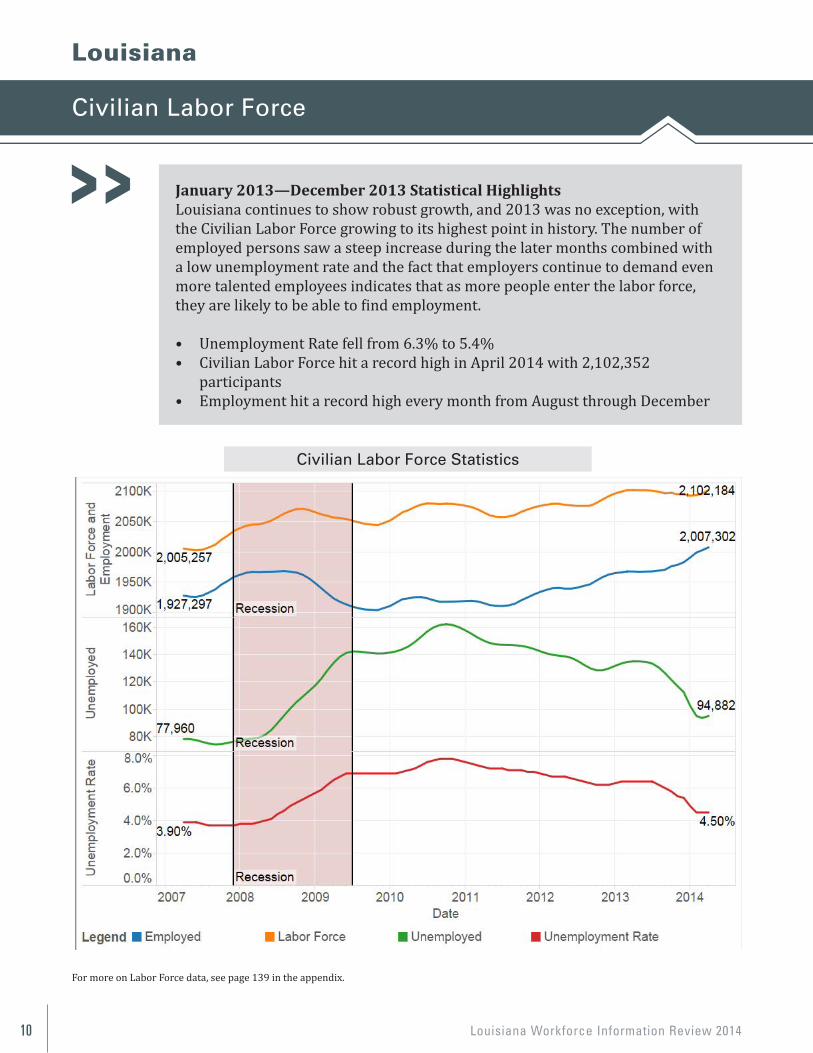
January 2013—December 2013 Statistical HighlightsLouisiana continues to show robust growth, and 2013 was no exception, with the Civilian Labor Force growing to its highest point in history. The number of employed persons saw a steep increase during the later months combined with a low unemployment rate and the fact that employers continue to demand even more talented employees indicates that as more people enter the labor force, they are likely to be able to find employment.
• Unemployment Rate fell from 6.3% to 5.4%• Civilian Labor Force hit a record high in April 2014 with 2,102,352
participants• Employment hit a record high every month from August through December
For more on Labor Force data, see page 139 in the appendix.
9
Louis iana
CIVILIAN LABOR FORCE January 2013—December 2013 Statistical Highlights Louisiana continues to show robust growth, and 2013 was no exception. In 2013, the Civilian Labor Force grew to it’s highest point in history, while the number of Employed persons saw a steep increase during the later months. Coupled with a low unemployment rate, this tells us that as more people enter the labor force, it is likely that they will be able to find employment as employers continue to demand even more talented employees.● Unemployment Rate fell from 6.3% to 5.4%
● Civilian Labor Force hit a record high in April 2014 with 2,102,352 participants
● Employment hit a record high every month from August through December
For more on Labor Force data, see page 118 in the appendix.
Civilian Labor Force Statistics
Louisiana
Civilian Labor Force Statistics
Louisiana Workforce Information Review 2014 11
Nonfarm Employment
For more on Nonfarm Employment, see page 147 in the Appendix.
10
Louis iana
NONFARM EMPLOYMENT
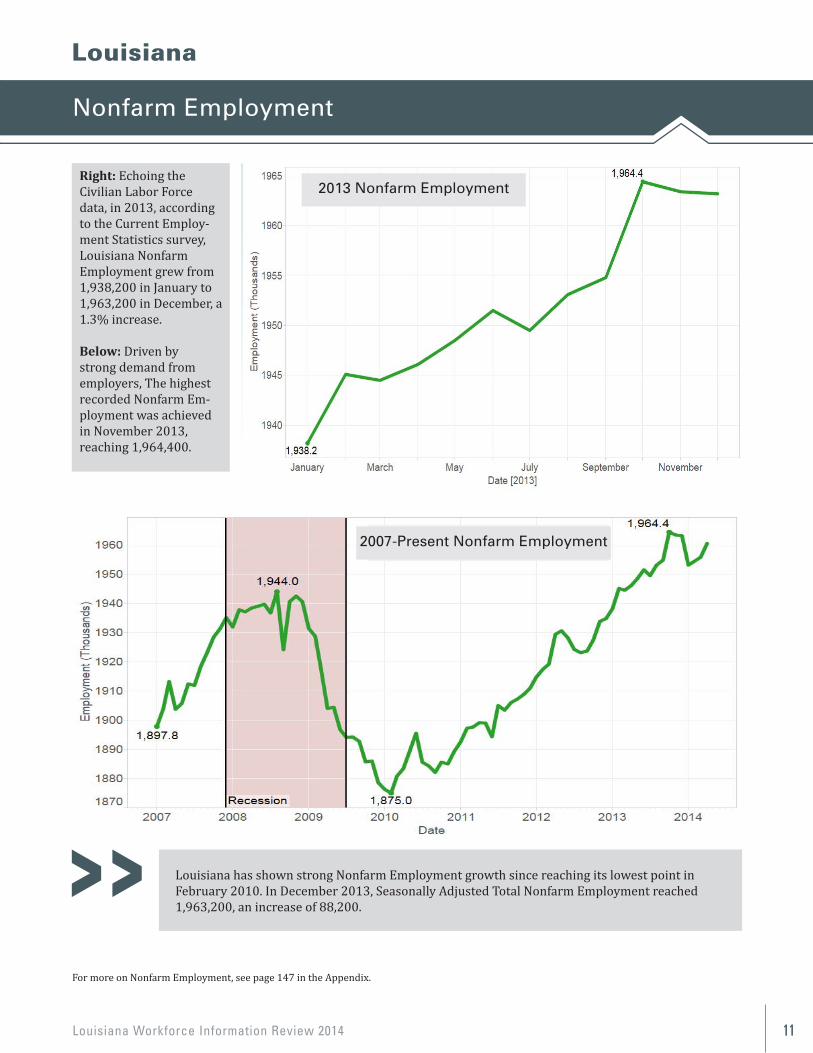
Louisiana has shown strong Nonfarm Employment growth since reaching it’s lowest point in February 2010. In December 2013, Seasonally Adjusted Total Nonfarm Employment reached 1,963,200, an increase of 88,200 since the low.
Right: Echoing the Civilian Labor Force data, in 2013, according to the Current Employment Statistics survey, Louisiana Nonfarm Employment grew from 1,938,200 in January to 1,963,200 in December, a 1.3% increase. Below: Driven by strong demand from employers, The highest recorded Nonfarm Employment was achieved in November 2013, reaching 1,964,400.
For more on Nonfarm Employment, see page 126 in the Appendix.
2013 Nonfarm Employment
2007—Present Nonfarm Employment
10
Louis iana
NONFARM EMPLOYMENT
Louisiana has shown strong Nonfarm Employment growth since reaching it’s lowest point in February 2010. In December 2013, Seasonally Adjusted Total Nonfarm Employment reached 1,963,200, an increase of 88,200 since the low.
Right: Echoing the Civilian Labor Force data, in 2013, according to the Current Employment Statistics survey, Louisiana Nonfarm Employment grew from 1,938,200 in January to 1,963,200 in December, a 1.3% increase. Below: Driven by strong demand from employers, The highest recorded Nonfarm Employment was achieved in November 2013, reaching 1,964,400.
For more on Nonfarm Employment, see page 126 in the Appendix.
2013 Nonfarm Employment
2007—Present Nonfarm Employment
Right: Echoing the Civilian Labor Force data, in 2013, according to the Current Employ-ment Statistics survey, Louisiana Nonfarm Employment grew from 1,938,200 in January to 1,963,200 in December, a 1.3% increase.
Below: Driven bystrong demand fromemployers, The highestrecorded Nonfarm Em-ployment was achieved in November 2013,reaching 1,964,400.
Louisiana has shown strong Nonfarm Employment growth since reaching its lowest point in February 2010. In December 2013, Seasonally Adjusted Total Nonfarm Employment reached 1,963,200, an increase of 88,200.
Louisiana
2013 Nonfarm Employment
2007-Present Nonfarm Employment
Louisiana Workforce Information Review 201412
Industry Breakdown
Employment & Wages
11
QCEW
INDUSTRY BREAKDOWN
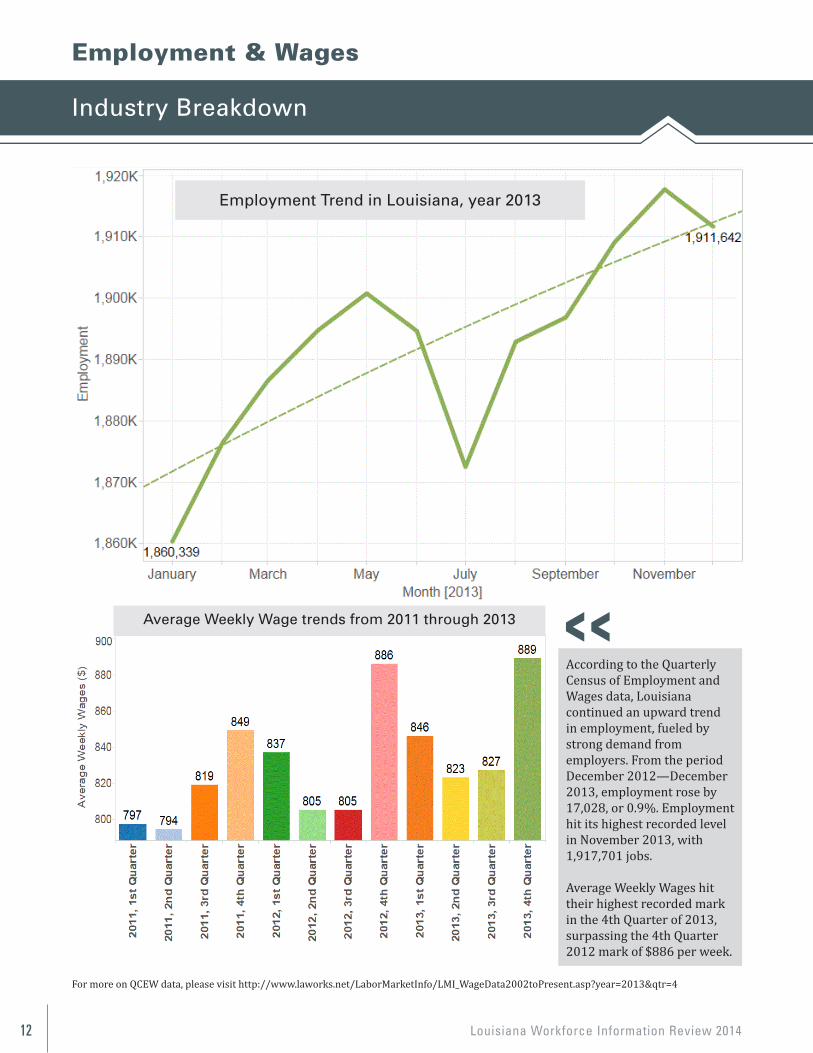
According to the Quarterly Census of Employment and Wages data,Louisiana continued an upward trend in employment, fueled by strong demand from employers. From the period December 2012—December 2013, Employment rose by 17,028, or 0.9%. Employment hit it’s highest recorded level in November 2013, with 1,917,701 jobs.
Average Weekly Wages hit their highest recorded mark in the 4th Quarter of 2013, surpassing the 4th Quarter 2012 mark of $886 per week.
Employment Trend in Louisiana, year 2013
Average Weekly Wage trends from 2011 through 2013
For more on QCEW data, please visit http://www.laworks.net/LaborMarketInfo/LMI_WageData2002toPresent.asp?year=2013&qtr=4
For more on QCEW data, please visit http://www.laworks.net/LaborMarketInfo/LMI_WageData2002toPresent.asp?year=2013&qtr=4
According to the Quarterly Census of Employment and Wages data, Louisiana continued an upward trend in employment, fueled by strong demand from employers. From the period December 2012—December 2013, employment rose by 17,028, or 0.9%. Employment hit its highest recorded level in November 2013, with 1,917,701 jobs.
Average Weekly Wages hit their highest recorded mark in the 4th Quarter of 2013, surpassing the 4th Quarter 2012 mark of $886 per week.
Employment Trend in Louisiana, year 2013
Average Weekly Wage trends from 2011 through 2013
Louisiana Workforce Information Review 2014 13
Industry Breakdown
Employment & Wages
12
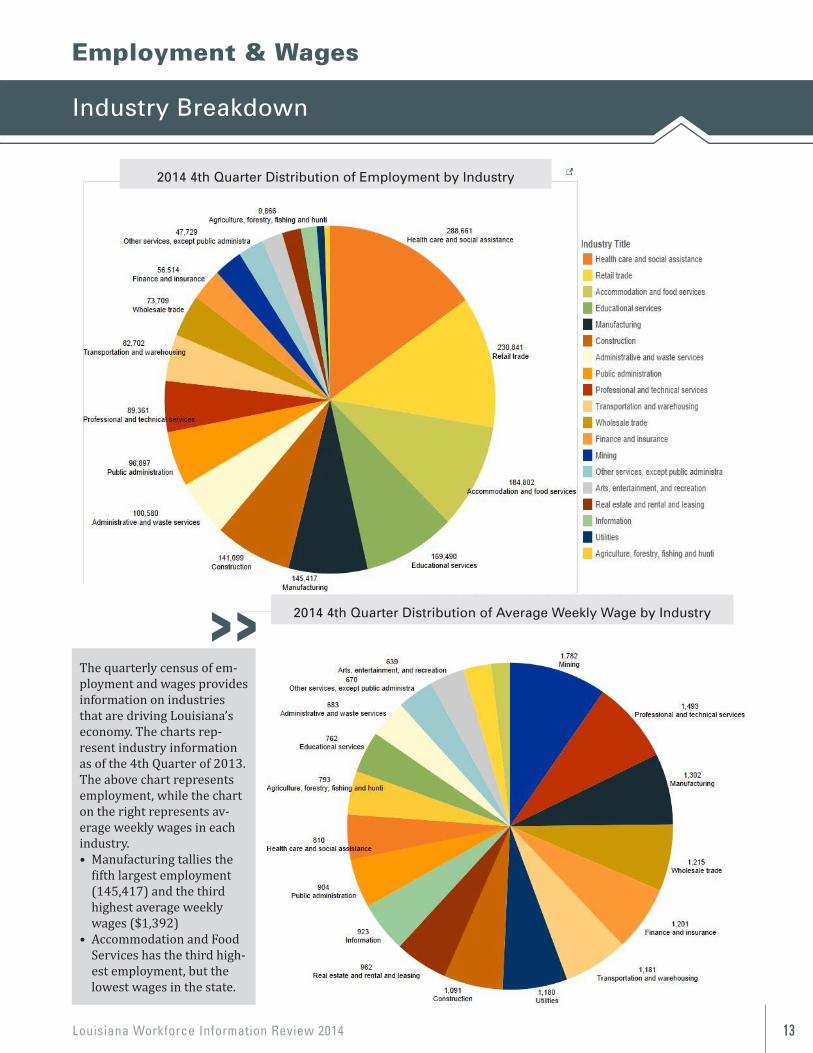
The quarterly census of employment and wages provides information on industries that are driving Louisiana’s economy. The charts represent Industry information as of the 4th Quarter of 2013. The Above chart represents employment, while the chart on the Rightrepresents average weekly wages in each industry. Manufacturing tallies
the fifth largest employment (145,417) and the third highest average weekly wages ($1,392)
Accommodation and Food Services has the third highest employment, but the lowest wages in the state
The quarterly census of em-ployment and wages provides information on industries that are driving Louisiana’s economy. The charts rep-resent industry information as of the 4th Quarter of 2013. The above chart representsemployment, while the chart on the right represents av-erage weekly wages in each industry.• Manufacturing tallies the
fifth largest employment (145,417) and the third highest average weekly wages ($1,392)
• Accommodation and Food Services has the third high-est employment, but the lowest wages in the state.
12
The quarterly census of employment and wages provides information on industries that are driving Louisiana’s economy. The charts represent Industry information as of the 4th Quarter of 2013. The Above chart represents employment, while the chart on the Rightrepresents average weekly wages in each industry. Manufacturing tallies
the fifth largest employment (145,417) and the third highest average weekly wages ($1,392)
Accommodation and Food Services has the third highest employment, but the lowest wages in the state
2014 4th Quarter Distribution of Employment by Industry
2014 4th Quarter Distribution of Average Weekly Wage by Industry
Louisiana Workforce Information Review 201414
Industry Breakdown
Employment & Wages
13
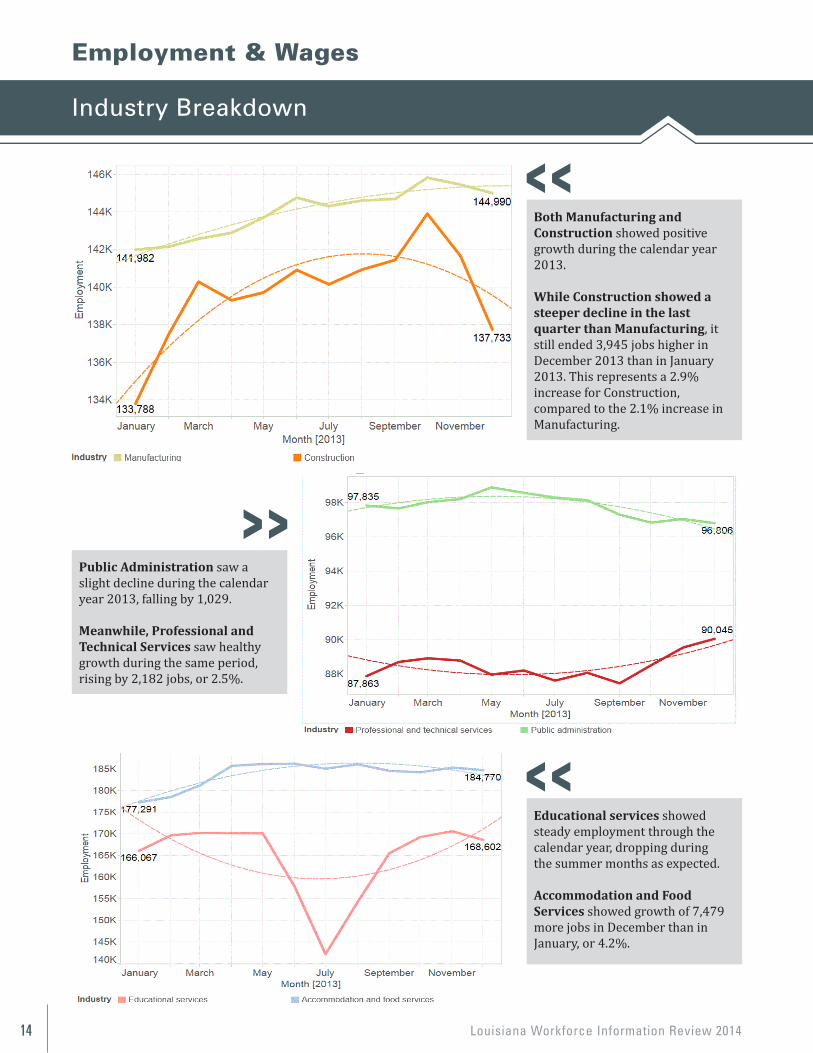
Both Manufacturing and Construction showed positive growth during the calendar year 2013.
While Construction showed a steeper decline in the last quarter than Manufacturing, it still ended 3,945 jobs higher in December 2013 than it began with in January 2013. This represents a 2.9% increase for Construction, compared to the 2.1% increase in Manufacturing.
Public Administration saw a slight decline during the calendar year 2013, falling by 1,029.
Meanwhile, Professional and Technical Services saw healthy growth during the same period, rising by 2,182 jobs, or 2.5%.
Educational services showed steady employment through the calendar year, dropping during the summer months as expected. Accommodation and Food Services showed growth of 7,479 more jobs in December than began with in January, or 4.2%.
13
Both Manufacturing and Construction showed positive growth during the calendar year 2013.
While Construction showed a steeper decline in the last quarter than Manufacturing, it still ended 3,945 jobs higher in December 2013 than it began with in January 2013. This represents a 2.9% increase for Construction, compared to the 2.1% increase in Manufacturing.
Public Administration saw a slight decline during the calendar year 2013, falling by 1,029.
Meanwhile, Professional and Technical Services saw healthy growth during the same period, rising by 2,182 jobs, or 2.5%.
Educational services showed steady employment through the calendar year, dropping during the summer months as expected. Accommodation and Food Services showed growth of 7,479 more jobs in December than began with in January, or 4.2%.
Both Manufacturing and Construction showed positive growth during the calendar year 2013.
While Construction showed a steeper decline in the last quarter than Manufacturing, it still ended 3,945 jobs higher in December 2013 than in January 2013. This represents a 2.9% increase for Construction, compared to the 2.1% increase in Manufacturing.
Public Administration saw aslight decline during the calendar year 2013, falling by 1,029.
Meanwhile, Professional andTechnical Services saw healthy growth during the same period, rising by 2,182 jobs, or 2.5%.
Educational services showedsteady employment through thecalendar year, dropping duringthe summer months as expected.
Accommodation and FoodServices showed growth of 7,479 more jobs in December than in January, or 4.2%.
Louisiana Workforce Information Review 2014 15
Industry Breakdown
Employment & Wages
14
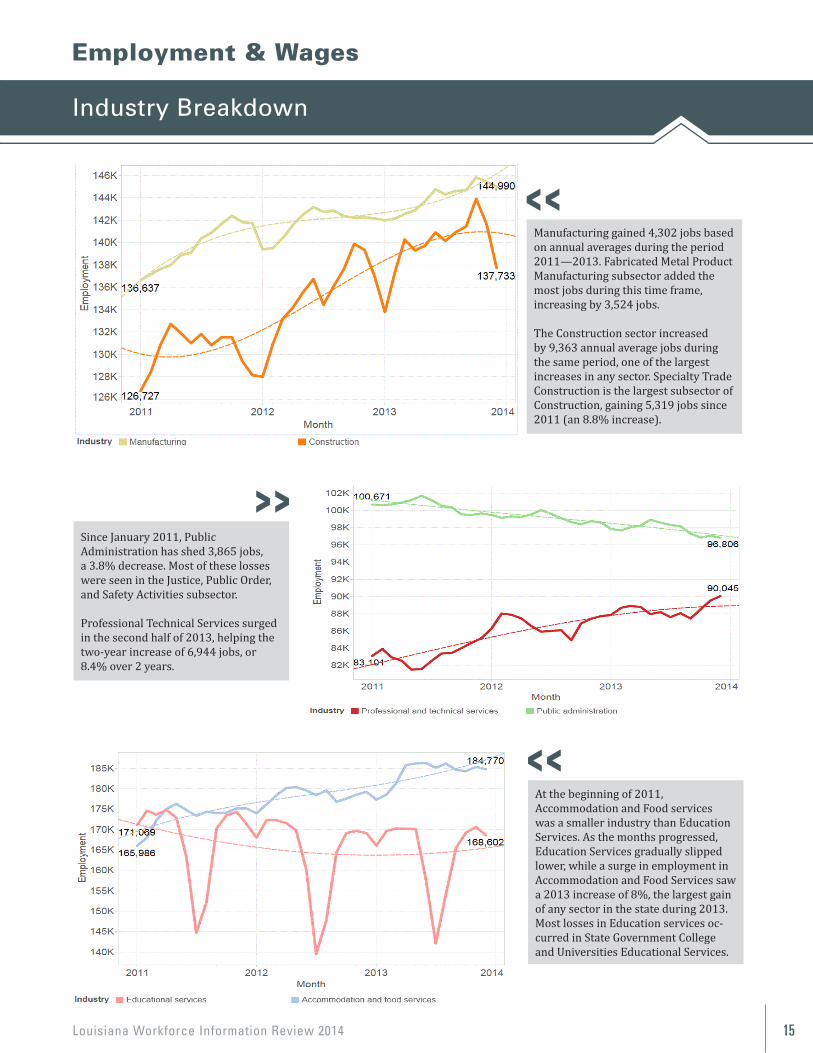
At the beginning of 2011, Accommodation and Food services was a smaller industry than Education Services. As the months progressed, Education Services gradually slipped lower, while a surge in employment in Accommodation and Food Services saw a 2013 increase of 8% - the largest gain of any sector in the state during 2013. Most of the losses in Education services occurred in State Government College and Universities Educational Services.
Since January 2011, Public Administration has shed 3,865 jobs, a 3.8% decrease. Most of these losses were seen in the Justice, Public Order, and Safety Activities subsector. Professional Technical Services surged in the second half of 2013, helping give rise to the two year increase of 6,944 jobs, or 8.4% increase over 2 years.
Manufacturing gained 4,302 jobs based on annual averages during the period 2011—2013. Fabricated Metal Product Manufacturing subsector added the most jobs during this timeframe, increasing by 3,524 jobs. The Construction sector increased by 9,363 annual average jobs during the same period, one of the largest increases in any sector. Specialty Trade Construction is the largest subsector of Construction, which gained 5,319 jobs since 2011 (an 8.8% increase).
14
At the beginning of 2011, Accommodation and Food services was a smaller industry than Education Services. As the months progressed, Education Services gradually slipped lower, while a surge in employment in Accommodation and Food Services saw a 2013 increase of 8% - the largest gain of any sector in the state during 2013. Most of the losses in Education services occurred in State Government College and Universities Educational Services.
Since January 2011, Public Administration has shed 3,865 jobs, a 3.8% decrease. Most of these losses were seen in the Justice, Public Order, and Safety Activities subsector. Professional Technical Services surged in the second half of 2013, helping give rise to the two year increase of 6,944 jobs, or 8.4% increase over 2 years.
Manufacturing gained 4,302 jobs based on annual averages during the period 2011—2013. Fabricated Metal Product Manufacturing subsector added the most jobs during this timeframe, increasing by 3,524 jobs. The Construction sector increased by 9,363 annual average jobs during the same period, one of the largest increases in any sector. Specialty Trade Construction is the largest subsector of Construction, which gained 5,319 jobs since 2011 (an 8.8% increase).
Manufacturing gained 4,302 jobs based on annual averages during the period 2011—2013. Fabricated Metal Product Manufacturing subsector added the most jobs during this time frame, increasing by 3,524 jobs.
The Construction sector increased by 9,363 annual average jobs during the same period, one of the largest increases in any sector. Specialty Trade Construction is the largest subsector of Construction, gaining 5,319 jobs since 2011 (an 8.8% increase).
Since January 2011, Public Administration has shed 3,865 jobs, a 3.8% decrease. Most of these losses were seen in the Justice, Public Order, and Safety Activities subsector.
Professional Technical Services surged in the second half of 2013, helping the two-year increase of 6,944 jobs, or 8.4% over 2 years.
At the beginning of 2011, Accommodation and Food services was a smaller industry than Education Services. As the months progressed, Education Services gradually slipped lower, while a surge in employment in Accommodation and Food Services saw a 2013 increase of 8%, the largest gain of any sector in the state during 2013. Most losses in Education services oc-curred in State Government Collegeand Universities Educational Services.
Louisiana Workforce Information Review 201416
Occupational Statistics
Louisiana
15
Louis iana
OCCUPATIONAL STATISTICS 2012 and 2013 Occupational Annual Wages
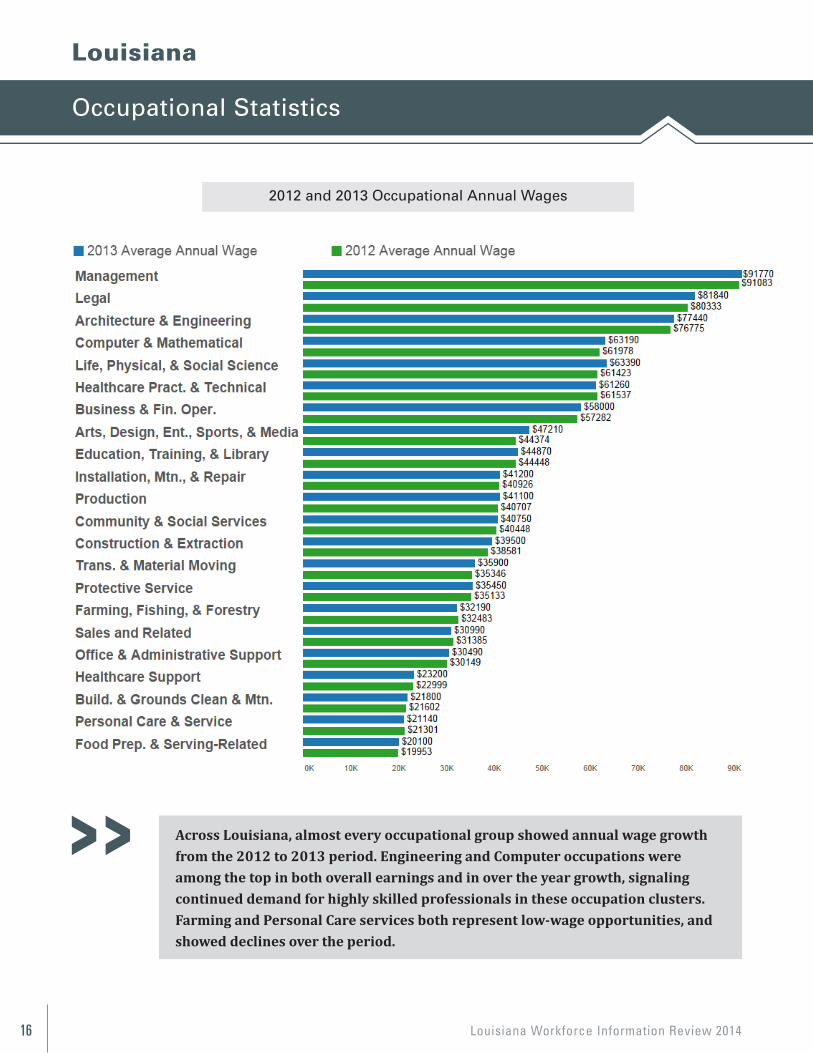
Across the state of Louisiana, almost every occupational group showed annual wage growth from the 2012 to 2013 period. Engineering and Computer occupations were among the top in both overall earnings and in over the year growth, signaling continued demand for highly skilled professionals in these occupation clusters. Farming and Personal Care services both represent low wage opportunities, and showed declines over the period.
Across Louisiana, almost every occupational group showed annual wage growth from the 2012 to 2013 period. Engineering and Computer occupations were among the top in both overall earnings and in over the year growth, signaling continued demand for highly skilled professionals in these occupation clusters. Farming and Personal Care services both represent low-wage opportunities, and showed declines over the period.
2012 and 2013 Occupational Annual Wages
Louisiana Workforce Information Review 2014 17
Unemployment Insurance Claimants
Supply Side
For more on Unemployment Insurance, visit page 156 in the Appendix 16
Supply Side
UNEMPLOYMENT INSURANCE CLAIMANTS
Along with the record level rises in the Civilian Labor Force and Employment levels in 2013, Louisiana’s number of continued claimants continues the optimistic trend by falling sharply from 32,001 the first week of January to 23,648 the last week of December. The 8,353 claimant decrease represents a 26.1% drop.
During 2013, InitialClaims continued their slow but steady downward trend, falling from 3,253 claims the first week of January to 1,721 claims the last week of December.
Weekly Initial Claims, January 2011—June 2014
Weekly Continued Claims, January 2011—June 2014
For more on Unemployment Insurance, visit page 135 in the Appendix
16
Supply Side
UNEMPLOYMENT INSURANCE CLAIMANTS
Along with the record level rises in the Civilian Labor Force and Employment levels in 2013, Louisiana’s number of continued claimants continues the optimistic trend by falling sharply from 32,001 the first week of January to 23,648 the last week of December. The 8,353 claimant decrease represents a 26.1% drop.
During 2013, InitialClaims continued their slow but steady downward trend, falling from 3,253 claims the first week of January to 1,721 claims the last week of December.
Weekly Initial Claims, January 2011—June 2014
Weekly Continued Claims, January 2011—June 2014
For more on Unemployment Insurance, visit page 135 in the Appendix
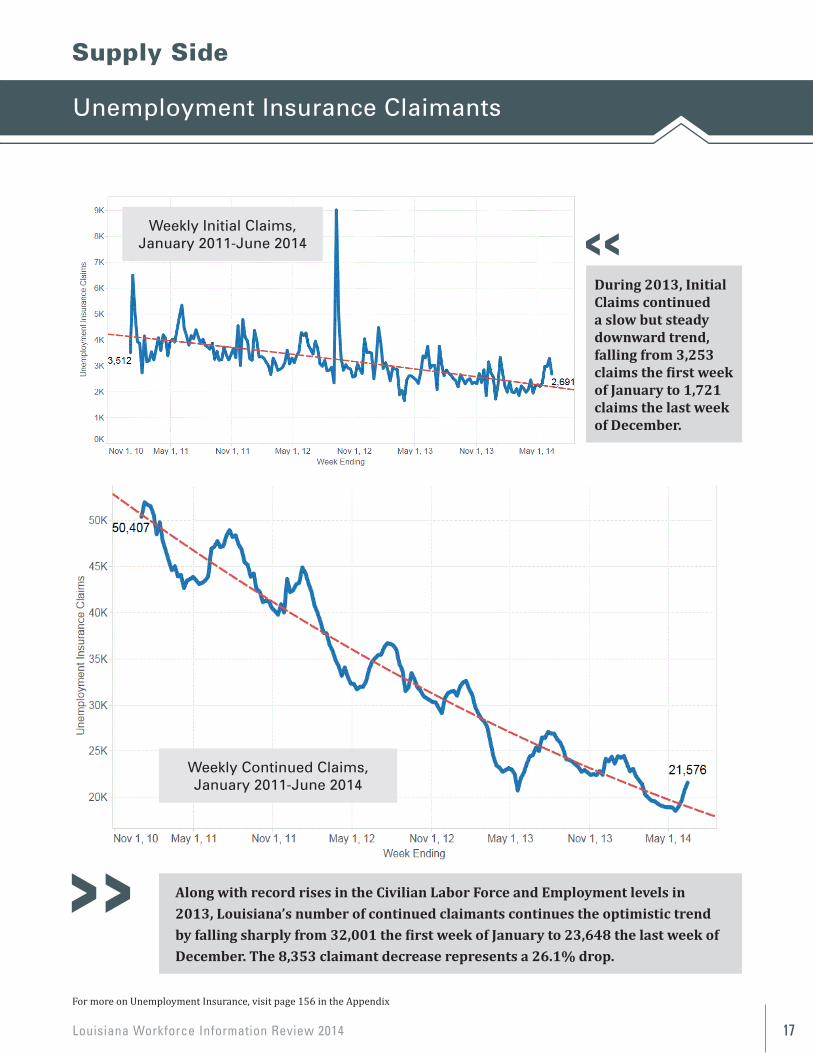
Along with record rises in the Civilian Labor Force and Employment levels in 2013, Louisiana’s number of continued claimants continues the optimistic trend by falling sharply from 32,001 the first week of January to 23,648 the last week of December. The 8,353 claimant decrease represents a 26.1% drop.
During 2013, Initial Claims continued a slow but steady downward trend, falling from 3,253 claims the first week of January to 1,721 claims the last week of December.
Weekly Initial Claims,January 2011-June 2014
Weekly Continued Claims,January 2011-June 2014
Louisiana Workforce Information Review 201418
Unemployment Insurance Claimants
Supply Side
17
Above: The chart above shows how long a typical Unemployment Insurance claimant would file continued claims. During the recession, the duration hit it’s lowest mark of 9.1 average weeks claimed, while shortly after the recession in early 2010, the duration peaked at 24.3 weeks. Louisiana began seeing a downward trend in Duration starting in 2012, decreasing quickly to what is 14.3 weeks claimed earlier this year, indicating that the length that Unemployment Insurance is needed is decreasing as job seekers are finding employment. Below: Weekly Unemployment Insurance exhaustions data further emphasizes the strength of the labor market. The state has seen sharp decreases in the number of claimants who are exhausting their Unemployment Insurance benefits, decreasing from a peak of 1,288 in mid-2011 to what is now 341 exhaustions in mid-2014.
Weekly Unemployment Insurance Exhaustions, January 2011—June 2014
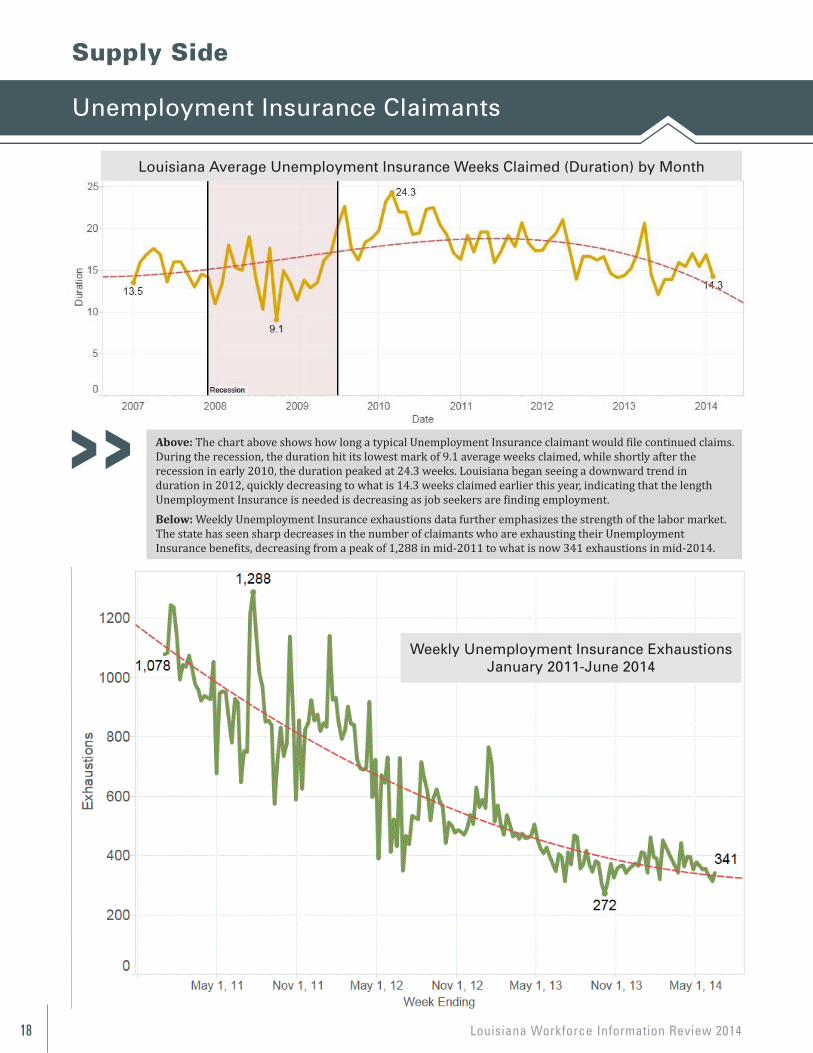
Above: The chart above shows how long a typical Unemployment Insurance claimant would file continued claims. During the recession, the duration hit its lowest mark of 9.1 average weeks claimed, while shortly after the recession in early 2010, the duration peaked at 24.3 weeks. Louisiana began seeing a downward trend in duration in 2012, quickly decreasing to what is 14.3 weeks claimed earlier this year, indicating that the length Unemployment Insurance is needed is decreasing as job seekers are finding employment.Below: Weekly Unemployment Insurance exhaustions data further emphasizes the strength of the labor market. The state has seen sharp decreases in the number of claimants who are exhausting their Unemployment Insurance benefits, decreasing from a peak of 1,288 in mid-2011 to what is now 341 exhaustions in mid-2014.
Louisiana Average Unemployment Insurance Weeks Claimed (Duration) by Month
Weekly Unemployment Insurance ExhaustionsJanuary 2011-June 2014
Louisiana Workforce Information Review 2014 19
Unemployment Insurance Claimants
Supply Side
18
Above: The chart above shows each RLMA’s contribution to total Continued Claims during the period May 2011—May 2013. All RLMAs showed large decreases over the previous two years. The Lafayette RLMA saw the largest decline (64.4% decline), followed by Baton Rouge (62.8%)
Left: The map to the left is a Parish heat map showing the number of continued claims filed in May of 2013. The heaviest concentration of claims can be found at the heart of Metropolitan Areas, while rural areas, where populations are much smaller to begin with, showed the least amount of claims.
Continued Claims by RLMA over two years
Continued Claims filed by Parish in May 2013
18
Above: The chart above shows each RLMA’s contribution to total Continued Claims during the period May 2011—May 2013. All RLMAs showed large decreases over the previous two years. The Lafayette RLMA saw the largest decline (64.4% decline), followed by Baton Rouge (62.8%)
Left: The map to the left is a Parish heat map showing the number of continued claims filed in May of 2013. The heaviest concentration of claims can be found at the heart of Metropolitan Areas, while rural areas, where populations are much smaller to begin with, showed the least amount of claims.
Continued Claims by RLMA over two years
Continued Claims filed by Parish in May 2013 Above: The chart shows
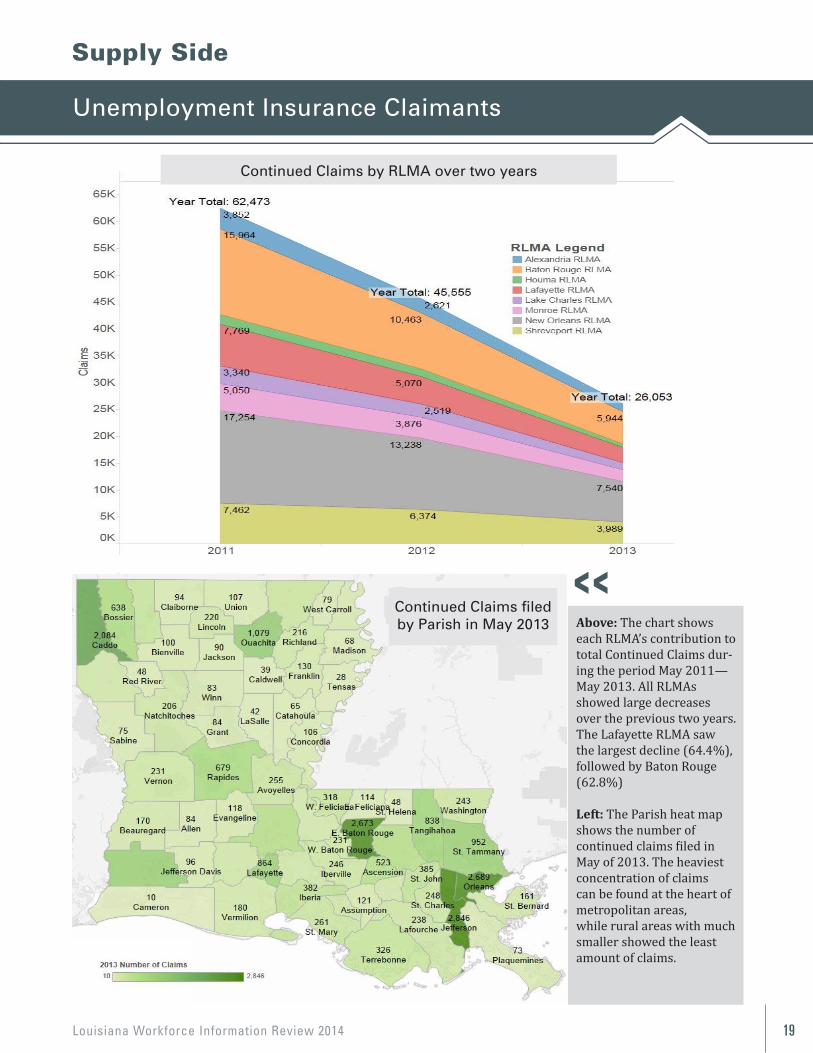
each RLMA’s contribution to total Continued Claims dur-ing the period May 2011— May 2013. All RLMAs showed large decreases over the previous two years. The Lafayette RLMA saw the largest decline (64.4%), followed by Baton Rouge (62.8%)
Left: The Parish heat map shows the number of continued claims filed in May of 2013. The heaviest concentration of claims can be found at the heart of metropolitan areas,while rural areas with much smaller showed the least amount of claims.
Continued Claims by RLMA over two years
Continued Claims filed by Parish in May 2013
Louisiana Workforce Information Review 201420
Unemployment Insurance Claimants
Supply Side
19
Above: This chart shows which occupation clusters contributed to the state’s overall continued claims in May 2013. Construction & Extraction led the occupation clusters with 3,307 continued claims… Right: … which is a large decrease from the 10,477 claims experienced in the same period just two years earlier. This represents a 68.4% decline. The decrease of claims in these occupation clusters alongside the increase of employment in comparable industries provided by QCEW, record-setting Nonfarm Employment & Civilian Labor Force, prove that Louisiana continues it’s robust growth into 2014. Yet unemployment claimants represent a key piece of Louisiana’s labor supply. As the number of claimants decreases, there is a subsequent decrease in the number of people who can supply labor to meet employers’ demand. In order to maintain this growth in the long run, Louisiana will have to find other ways to increase the labor force supply.
Continued Claims by Occupation Cluster filed in May 2013
Continued Claims by Occupation cluster
filed from May 2011—May 2013
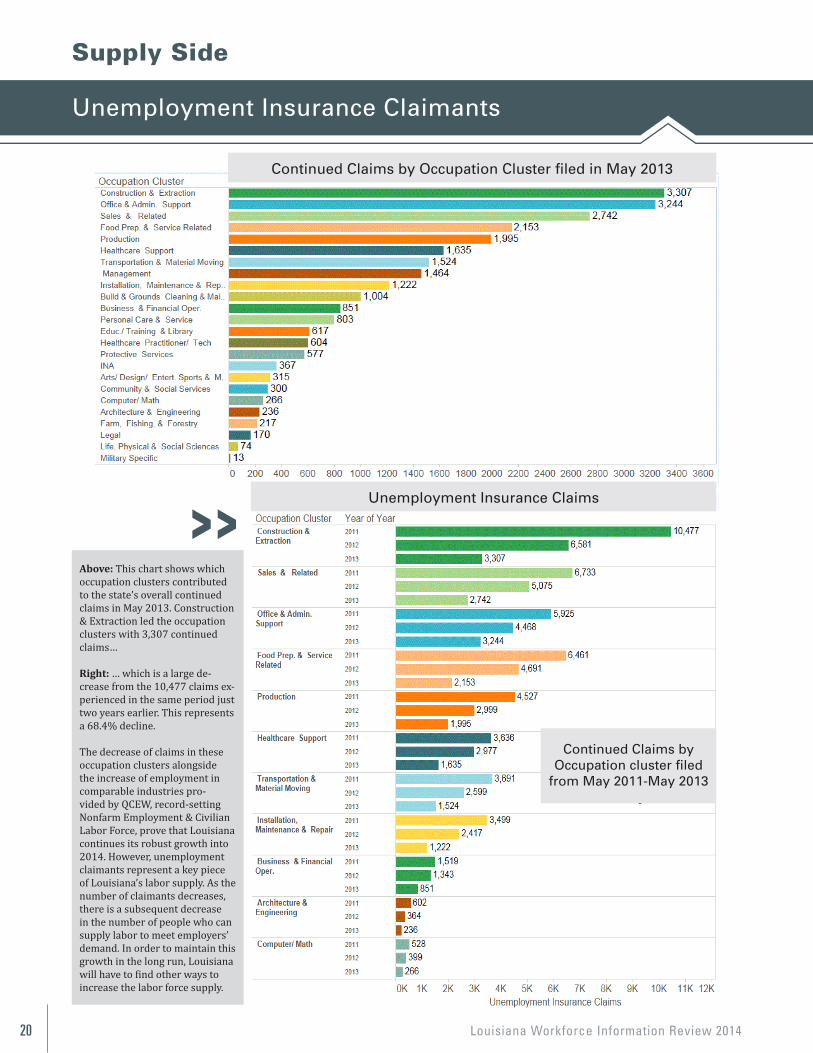
Above: This chart shows which occupation clusters contributed to the state’s overall continued claims in May 2013. Construction & Extraction led the occupation clusters with 3,307 continued claims…
Right: … which is a large de-crease from the 10,477 claims ex-perienced in the same period just two years earlier. This represents a 68.4% decline.
The decrease of claims in these occupation clusters alongside the increase of employment in comparable industries pro-vided by QCEW, record-setting Nonfarm Employment & Civilian Labor Force, prove that Louisiana continues its robust growth into 2014. However, unemployment claimants represent a key piece of Louisiana’s labor supply. As the number of claimants decreases, there is a subsequent decrease in the number of people who can supply labor to meet employers’ demand. In order to maintain this growth in the long run, Louisiana will have to find other ways to increase the labor force supply.
Continued Claims by Occupation Cluster filed in May 2013
Unemployment Insurance Claims
Continued Claims byOccupation cluster filed
from May 2011-May 2013
Louisiana Workforce Information Review 2014 21
Graduates as a Part of Supply
Education Information
20
Educat ion Information
GRADUATES AS A PART OF SUPPLY
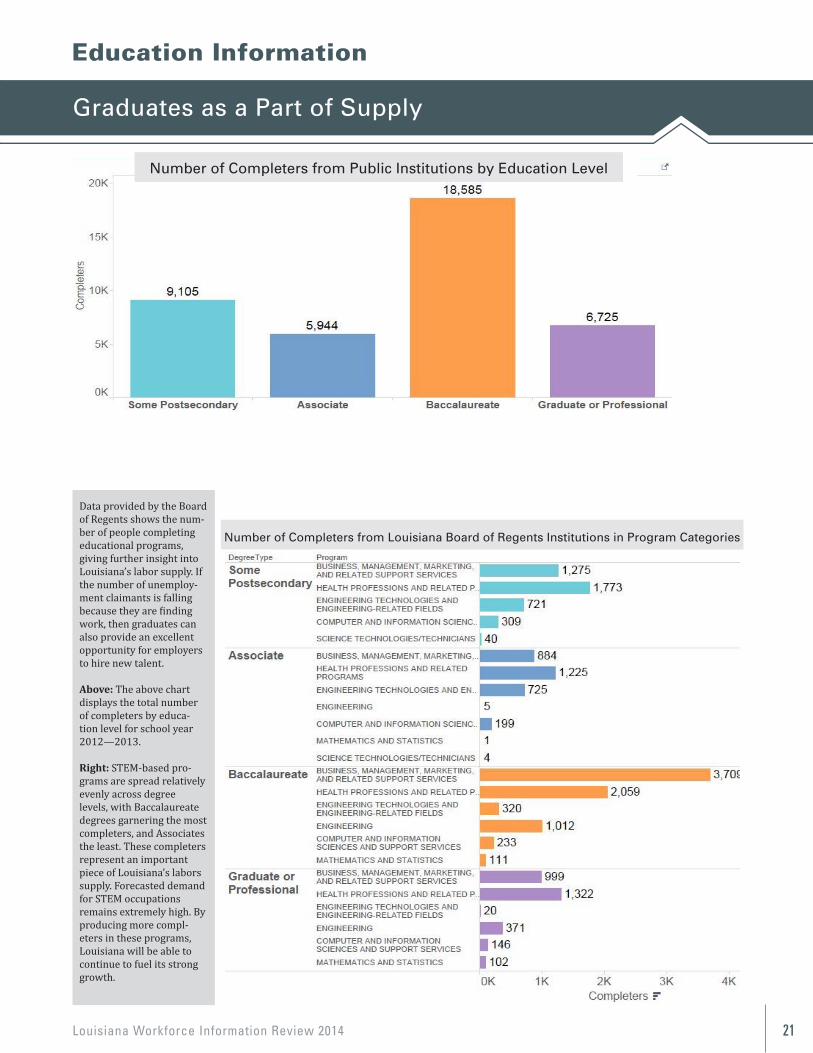
Data provided by the Board of Regents shows us the number of people completing educational programs, and give us a further insight into Louisiana’s labor supply. If the number of unemployment claimants is falling because they are finding work, then graduates can also provide an excellent opportunity for employers to hire new talent.
Above: The above chart displays the total number of completers by education level for school year 2012—2013. Right: STEM based programs are spread relatively evenly across degree levels, with Baccalaureate degrees garnering the most completers, and Associates the least. These completers represent an important piece of Louisiana’s labors supply. Forecasted demand for STEM occupations remains extremely high. By producing more completers in these programs, Louisiana will be able to continue to fuel it’s strong growth.
Number of Completers from Public Institutions by education level
20
Educat ion Information
GRADUATES AS A PART OF SUPPLY
Data provided by the Board of Regents shows us the number of people completing educational programs, and give us a further insight into Louisiana’s labor supply. If the number of unemployment claimants is falling because they are finding work, then graduates can also provide an excellent opportunity for employers to hire new talent.
Above: The above chart displays the total number of completers by education level for school year 2012—2013. Right: STEM based programs are spread relatively evenly across degree levels, with Baccalaureate degrees garnering the most completers, and Associates the least. These completers represent an important piece of Louisiana’s labors supply. Forecasted demand for STEM occupations remains extremely high. By producing more completers in these programs, Louisiana will be able to continue to fuel it’s strong growth.
Number of Completers from Public Institutions by education level
Data provided by the Board of Regents shows the num-ber of people completing educational programs, giving further insight into Louisiana’s labor supply. If the number of unemploy-ment claimants is falling because they are finding work, then graduates can also provide an excellent opportunity for employers to hire new talent.
Above: The above chart displays the total number of completers by educa-tion level for school year 2012—2013.
Right: STEM-based pro-grams are spread relatively evenly across degree levels, with Baccalaureate degrees garnering the most completers, and Associates the least. These completers represent an important piece of Louisiana’s labors supply. Forecasted demand for STEM occupations remains extremely high. By producing more compl-eters in these programs, Louisiana will be able to continue to fuel its strong growth.
Number of Completers from Public Institutions by Education Level
Number of Completers from Louisiana Board of Regents Institutions in Program Categories
Louisiana Workforce Information Review 201422
Industry And Occupational Projections
Louisiana
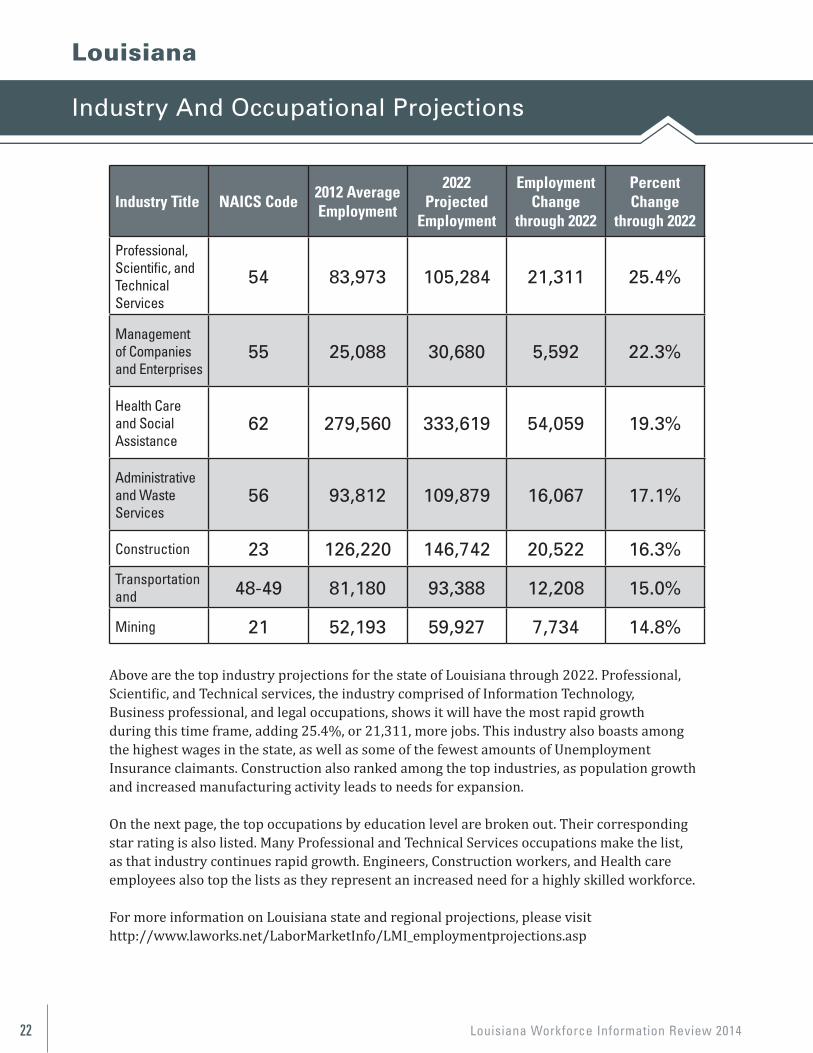
Above are the top industry projections for the state of Louisiana through 2022. Professional,Scientific, and Technical services, the industry comprised of Information Technology,Business professional, and legal occupations, shows it will have the most rapid growthduring this time frame, adding 25.4%, or 21,311, more jobs. This industry also boasts amongthe highest wages in the state, as well as some of the fewest amounts of UnemploymentInsurance claimants. Construction also ranked among the top industries, as population growthand increased manufacturing activity leads to needs for expansion.
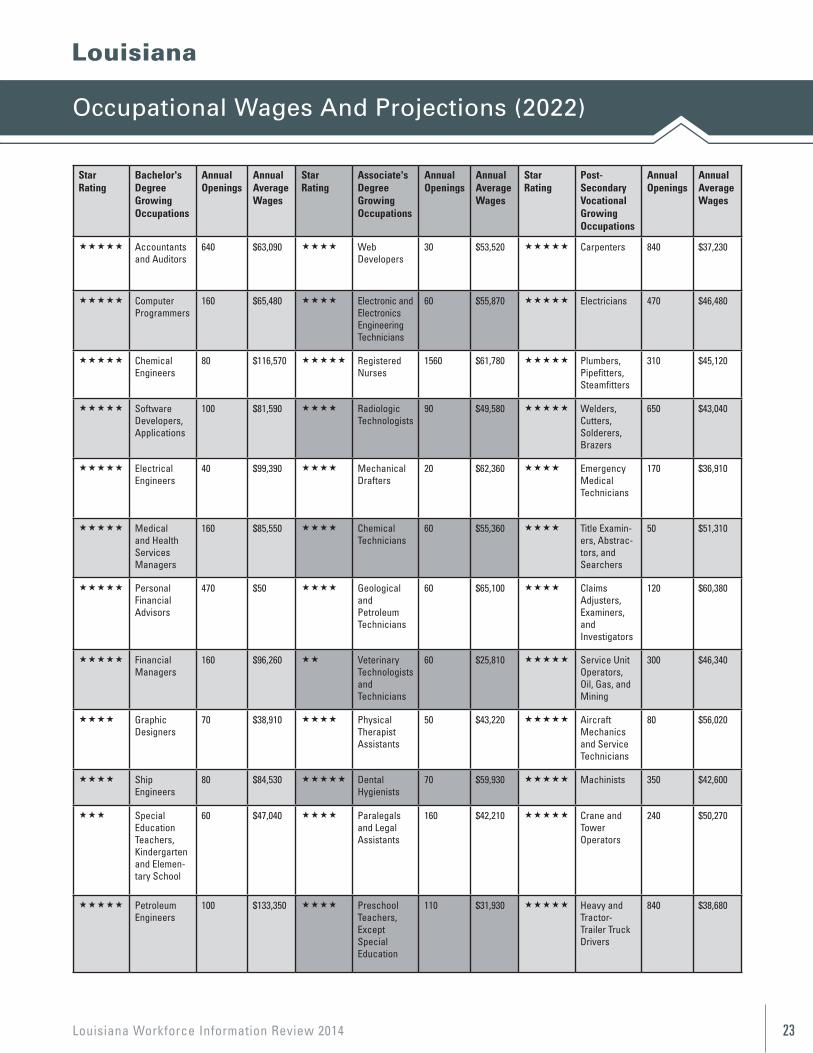
On the next page, the top occupations by education level are broken out. Their correspondingstar rating is also listed. Many Professional and Technical Services occupations make the list,as that industry continues rapid growth. Engineers, Construction workers, and Health careemployees also top the lists as they represent an increased need for a highly skilled workforce.
For more information on Louisiana state and regional projections, please visit http://www.laworks.net/LaborMarketInfo/LMI_employmentprojections.asp
Industry Title NAICS Code2012 AverageEmployment
2022 Projected
Employment
EmploymentChange
through 2022
PercentChange
through 2022
Professional,Scientific, andTechnical Services
54 83,973 105,284 21,311 25.4%
Management of Companies and Enterprises
55 25,088 30,680 5,592 22.3%
Health Care and Social Assistance
62 279,560 333,619 54,059 19.3%
Administrative and Waste Services
56 93,812 109,879 16,067 17.1%
Construction 23 126,220 146,742 20,522 16.3%
Transportation and 48-49 81,180 93,388 12,208 15.0%
Mining 21 52,193 59,927 7,734 14.8%
Louisiana Workforce Information Review 2014 23
Occupational Wages And Projections (2022)
Louisiana
StarRating
Bachelor's Degree Growing Occupations
Annual Openings
Annual Average Wages
StarRating
Associate's Degree Growing Occupations
Annual Openings
Annual Average Wages
StarRating
Post-Secondary Vocational Growing Occupations
Annual Openings
Annual Average Wages
Accountants and Auditors
640 $63,090 WebDevelopers
30 $53,520 Carpenters 840 $37,230
Computer Programmers
160 $65,480 Electronic and Electronics Engineering Technicians
60 $55,870 Electricians 470 $46,480
Chemical Engineers
80 $116,570 Registered Nurses
1560 $61,780 Plumbers, Pipefitters, Steamfitters
310 $45,120
Software Developers, Applications
100 $81,590 Radiologic Technologists
90 $49,580 Welders, Cutters, Solderers, Brazers
650 $43,040
Electrical Engineers
40 $99,390 Mechanical Drafters
20 $62,360 Emergency Medical Technicians
170 $36,910
Medical and Health Services Managers
160 $85,550 Chemical Technicians
60 $55,360 Title Examin-ers, Abstrac-tors, and Searchers
50 $51,310
Personal Financial Advisors
470 $50 Geologicaland Petroleum Technicians
60 $65,100 Claims Adjusters, Examiners, andInvestigators
120 $60,380
Financial Managers
160 $96,260 Veterinary Technologists and Technicians
60 $25,810 Service Unit Operators, Oil, Gas, and Mining
300 $46,340
Graphic Designers
70 $38,910 Physical Therapist Assistants
50 $43,220 Aircraft Mechanics and Service Technicians
80 $56,020
Ship Engineers
80 $84,530 Dental Hygienists
70 $59,930 Machinists 350 $42,600
Special Education Teachers, Kindergarten and Elemen-tary School
60 $47,040 Paralegals and Legal Assistants
160 $42,210 Crane and Tower Operators
240 $50,270
Petroleum Engineers
100 $133,350 Preschool Teachers, Except Special Education
110 $31,930 Heavy and Tractor-Trailer Truck Drivers
840 $38,680
Louisiana Workforce Information Review 201424 Louisiana Workforce Information Review 2014
Statewide GDP Snapshot
23
Workforce Information Review
2014 Statewide GDP Snapshot
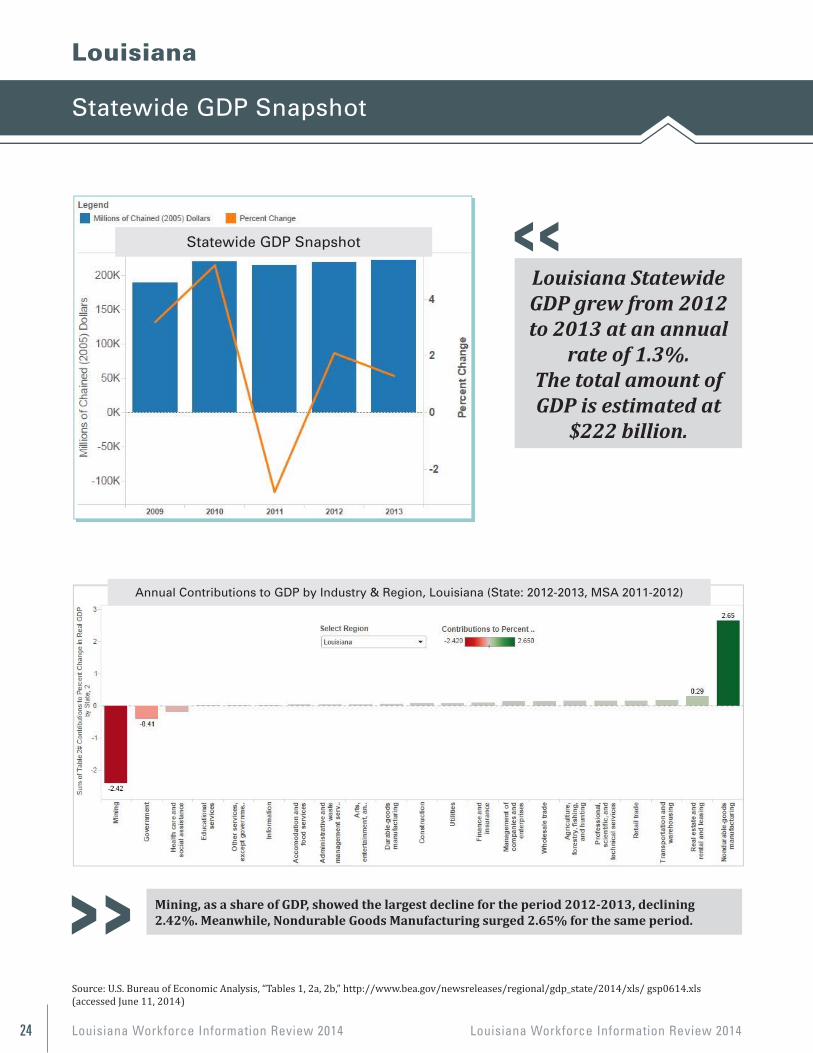
LouisianaStatewideGDPgrewfrom2012to2013atarateof1.3%annually.Thetotal
amountofGDPisestimatedat$222billion
Mining, as a share of GDP, showed the largest decline for the period 2012-2013, declining 2.42%,. Meanwhile, Nondurable Goods Manufacturing surged 2.65% for the same period.
Source: U.S. Bureau of Economic Analysis, “Tables 1, 2a, 2b,” http://www.bea.gov/newsreleases/regional/gdp_state/2014/xls/ gsp0614.xls (accessed June 11, 2014) Source: U.S. Bureau of Economic Analysis, “Tables 1, 2a, 2b,” http://www.bea.gov/newsreleases/regional/gdp_state/2014/xls/ gsp0614.xls (accessed June 11, 2014)
23
Workforce Information Review
2014 Statewide GDP Snapshot
LouisianaStatewideGDPgrewfrom2012to2013atarateof1.3%annually.Thetotal
amountofGDPisestimatedat$222billion
Mining, as a share of GDP, showed the largest decline for the period 2012-2013, declining 2.42%,. Meanwhile, Nondurable Goods Manufacturing surged 2.65% for the same period.
Source: U.S. Bureau of Economic Analysis, “Tables 1, 2a, 2b,” http://www.bea.gov/newsreleases/regional/gdp_state/2014/xls/ gsp0614.xls (accessed June 11, 2014)
Mining, as a share of GDP, showed the largest decline for the period 2012-2013, declining 2.42%. Meanwhile, Nondurable Goods Manufacturing surged 2.65% for the same period.
Louisiana Statewide GDP grew from 2012 to 2013 at an annual
rate of 1.3%.The total amount of GDP is estimated at
$222 billion.
Louisiana
Statewide GDP Snapshot
Annual Contributions to GDP by Industry & Region, Louisiana (State: 2012-2013, MSA 2011-2012)
Louisiana Workforce Information Review 2014 25
Occupational Wages And Projections (2022)
RLMA - NEW ORLEANS
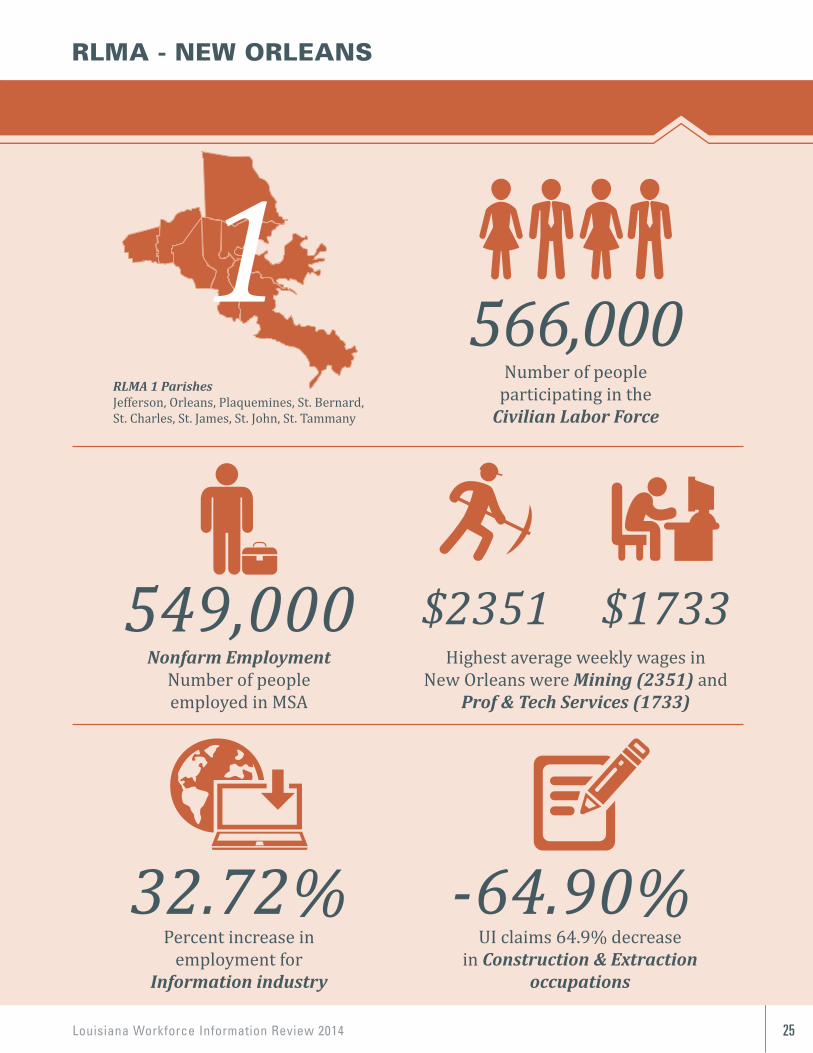
Nonfarm Employment Number of peopleemployed in MSA
549,000
Number of people participating in the
Civilian Labor Force
566,000
Highest average weekly wages inNew Orleans were Mining (2351) and
Prof & Tech Services (1733)
$2351 $1733
Percent increase inemployment for
Information industry
32.72%UI claims 64.9% decrease
in Construction & Extraction occupations
-64.90%
RLMA 1 ParishesJefferson, Orleans, Plaquemines, St. Bernard, St. Charles, St. James, St. John, St. Tammany
Louisiana Workforce Information Review 201426
New Orleans RLMA
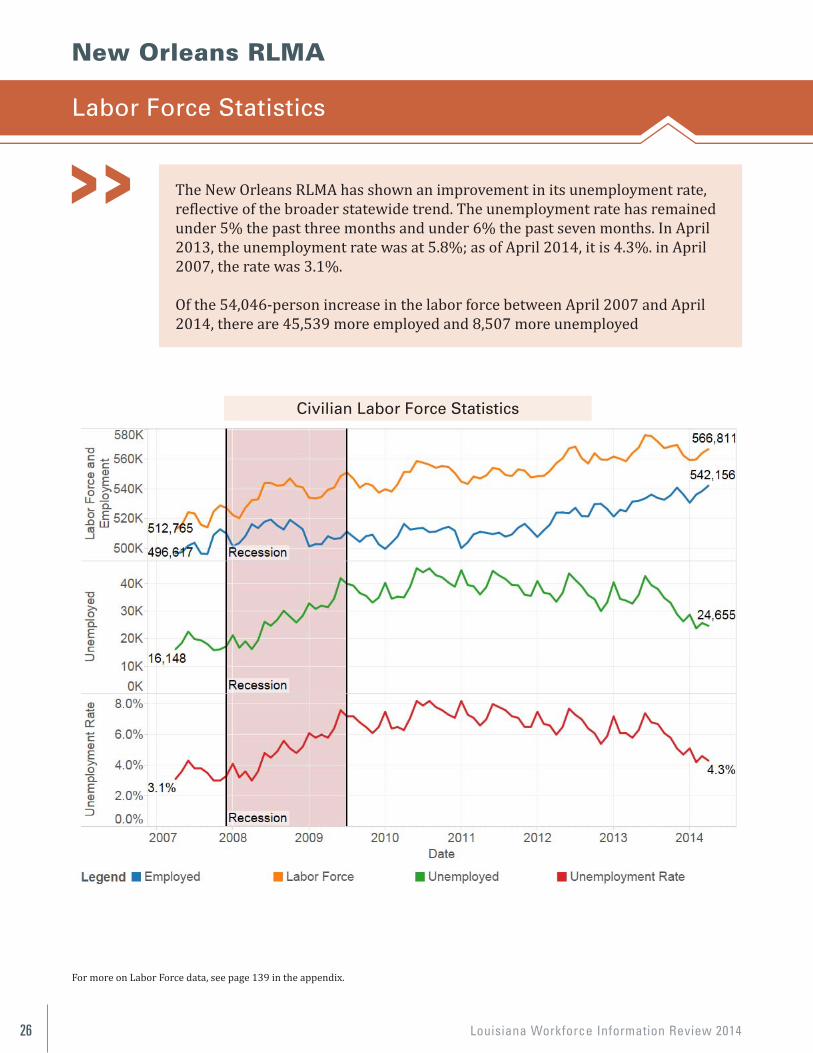
The New Orleans RLMA has shown an improvement in its unemployment rate, reflective of the broader statewide trend. The unemployment rate has remained under 5% the past three months and under 6% the past seven months. In April 2013, the unemployment rate was at 5.8%; as of April 2014, it is 4.3%. in April 2007, the rate was 3.1%.
Of the 54,046-person increase in the labor force between April 2007 and April 2014, there are 45,539 more employed and 8,507 more unemployed
For more on Labor Force data, see page 139 in the appendix.
29
New Orleans RLMA
LABOR FORCE STATISTICS The New Orleans RLMA has shown an improvement in its unemployment rate, reflective of the broader statewide trend. The unemployment rate has remained under 5% the past three months and under 6% the past seven months. In April 2013, the unemployment rate was at 5.8%; as of April 2014, it is 4.3%. in April 2007, the rate was 3.1%.
Of the 54,046 person increase in the labor force between April 2007 and April 2014, there are 45,539 more employed and 8,507 more unemployed
For more on Labor Force data, see page 118 in the appendix.
Civilian Labor Force Statistics
Labor Force Statistics
Civilian Labor Force Statistics
Louisiana Workforce Information Review 2014 27
Occupational Wages And Projections (2022)
New Orleans RLMA
For more on Nonfarm Employment, see page 149 in the Appendix.
30
NONFARM EMPLOYMENT
New Orleans MSA
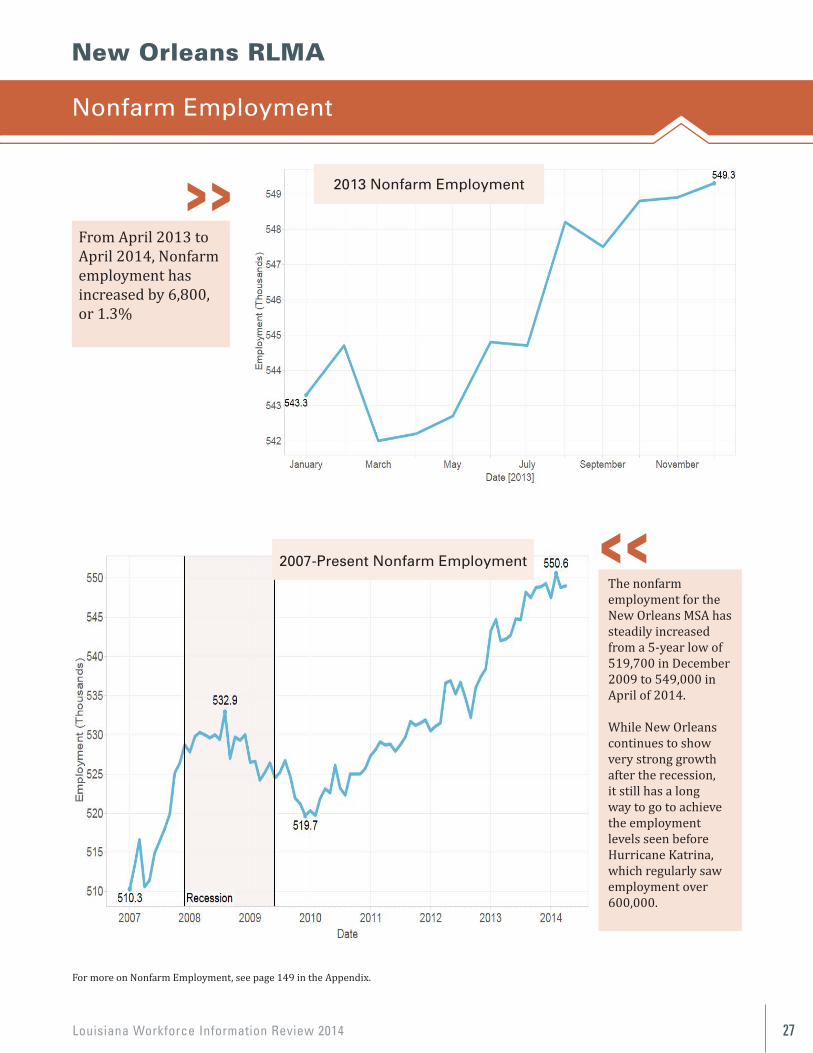
From April 2013 to April 2014, Nonfarm employment has increased by 6,800. This is an increase of 1.3%
The nonfarm employment for the New Orleans MSA has steadily increased from a 5 year low of 519,700 in December 2009 to 549,000 in April of 2014.
While New Orleans continues to show very strong growth after the recession ended, it still has a long way to go to achieve the employment levels seen before Hurricane Katrina, which regularly saw employment over 600,000.
For more on Nonfarm Employment, see page 126 in the Appendix.
2013 Nonfarm Employment
2007—Present Nonfarm Employment
30
NONFARM EMPLOYMENT
New Orleans MSA
From April 2013 to April 2014, Nonfarm employment has increased by 6,800. This is an increase of 1.3%
The nonfarm employment for the New Orleans MSA has steadily increased from a 5 year low of 519,700 in December 2009 to 549,000 in April of 2014.
While New Orleans continues to show very strong growth after the recession ended, it still has a long way to go to achieve the employment levels seen before Hurricane Katrina, which regularly saw employment over 600,000.
For more on Nonfarm Employment, see page 126 in the Appendix.
2013 Nonfarm Employment
2007—Present Nonfarm Employment
From April 2013 to April 2014, Nonfarmemployment hasincreased by 6,800, or 1.3%
The nonfarm employment for the New Orleans MSA has steadily increased from a 5-year low of519,700 in December 2009 to 549,000 in April of 2014.
While New Orleans continues to showvery strong growth after the recession, it still has a long way to go to achieve the employment levels seen before Hurricane Katrina, which regularly saw employment over 600,000.
Nonfarm Employment
2013 Nonfarm Employment
2007-Present Nonfarm Employment
Louisiana Workforce Information Review 201428
Employment & Wages
31
QCEW
NEW ORLEANS INDUSTRY BREAKDOWN
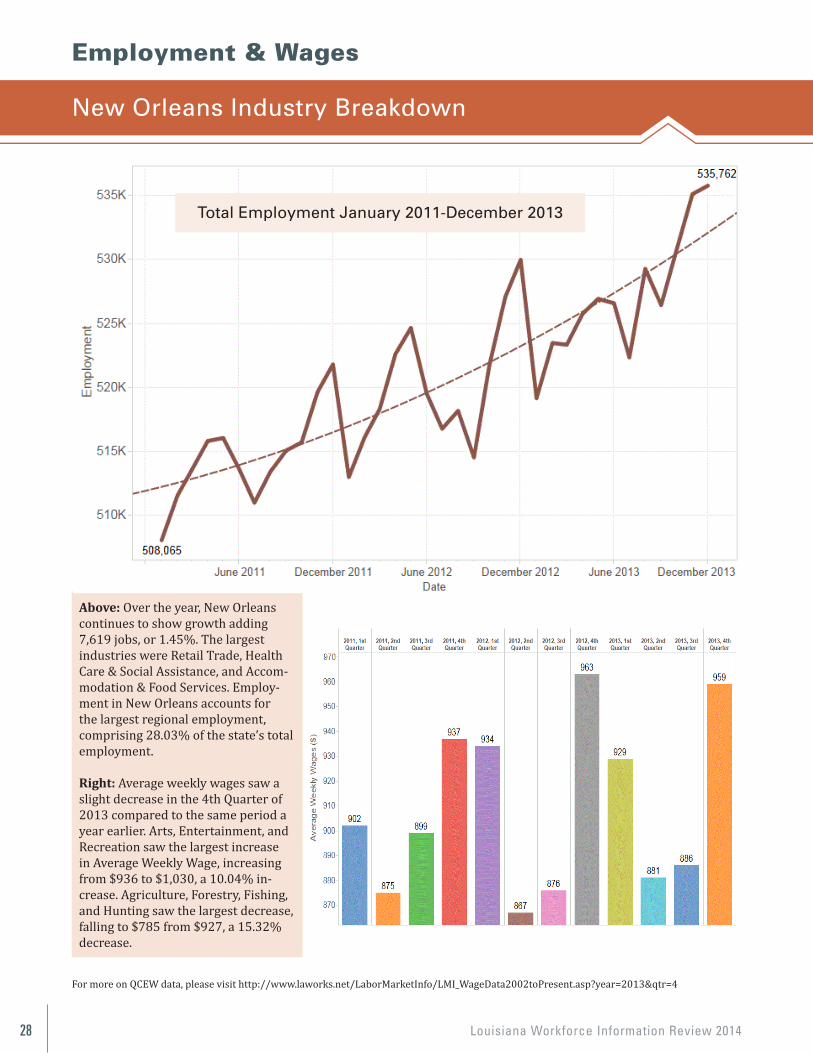
Above: Over the year, New Orleans continues to show growth adding 7,619 jobs, or 1.45%. The largest industries were Retail Trade, Health Care & Social Assistance, and Accommodation & Food Services. Employment in New Orleans accounts for the largest regional employment, comprising 28.03% of the state’s total employment. Right: Average weekly wages saw a slight decrease in the 4th Quarter of 2013 compared to the same period a year earlier. Arts, Entertainment, and Recreation saw the largest increase in Average Weekly Wage, increasing from $936 to $1,030, a 10.04% increase. Agriculture, Forestry, Fishing, and Hunting saw the largest decrease falling to $785 from $927, a 15.32% decrease.
Total Employment, January 2011—December 2013
For more on QCEW data, please visit http://www.laworks.net/LaborMarketInfo/LMI_WageData2002toPresent.asp?year=2013&qtr=4
For more on QCEW data, please visit http://www.laworks.net/LaborMarketInfo/LMI_WageData2002toPresent.asp?year=2013&qtr=4
Above: Over the year, New Orleans continues to show growth adding 7,619 jobs, or 1.45%. The largest industries were Retail Trade, Health Care & Social Assistance, and Accom-modation & Food Services. Employ-ment in New Orleans accounts for the largest regional employment, comprising 28.03% of the state’s total employment.
Right: Average weekly wages saw a slight decrease in the 4th Quarter of 2013 compared to the same period a year earlier. Arts, Entertainment, and Recreation saw the largest increase in Average Weekly Wage, increasing from $936 to $1,030, a 10.04% in-crease. Agriculture, Forestry, Fishing, and Hunting saw the largest decrease, falling to $785 from $927, a 15.32% decrease.
31
QCEW
NEW ORLEANS INDUSTRY BREAKDOWN
Above: Over the year, New Orleans continues to show growth adding 7,619 jobs, or 1.45%. The largest industries were Retail Trade, Health Care & Social Assistance, and Accommodation & Food Services. Employment in New Orleans accounts for the largest regional employment, comprising 28.03% of the state’s total employment. Right: Average weekly wages saw a slight decrease in the 4th Quarter of 2013 compared to the same period a year earlier. Arts, Entertainment, and Recreation saw the largest increase in Average Weekly Wage, increasing from $936 to $1,030, a 10.04% increase. Agriculture, Forestry, Fishing, and Hunting saw the largest decrease falling to $785 from $927, a 15.32% decrease.
Total Employment, January 2011—December 2013
For more on QCEW data, please visit http://www.laworks.net/LaborMarketInfo/LMI_WageData2002toPresent.asp?year=2013&qtr=4
New Orleans Industry Breakdown
Total Employment January 2011-December 2013
Louisiana Workforce Information Review 2014 29
Occupational Wages And Projections (2022)
Employment & Wages
32
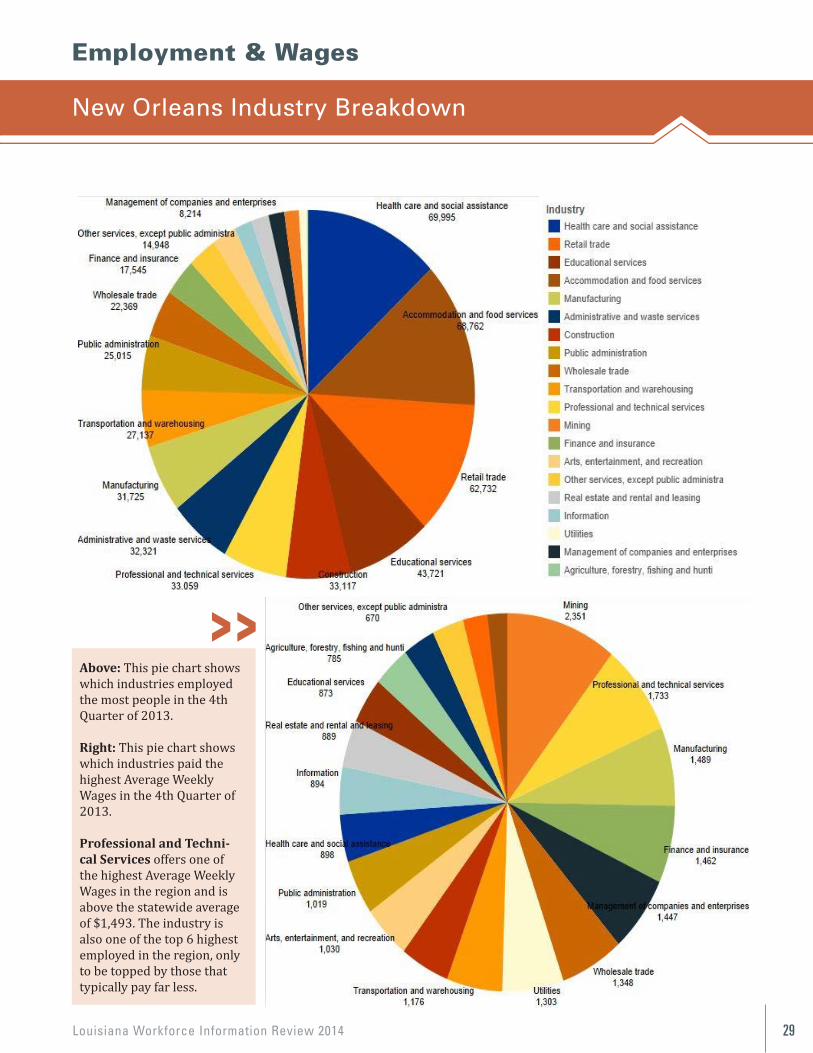
Above: This Pie Chart shows which industries employed the most people in the 4th Quarter of 2013. Right: This Pie Chart shows which industries paid the highest Average Weekly Wages in the 4th Quarter of 2013.
Professional and Technical Services not only offers one of the highest Average Weekly Wages in the region, it is also above the statewide average of $1,493. The industry is one of the top 6 highest employed industries in the region as well, only to be beaten by industries that typically pay far less.
32
Above: This Pie Chart shows which industries employed the most people in the 4th Quarter of 2013. Right: This Pie Chart shows which industries paid the highest Average Weekly Wages in the 4th Quarter of 2013.
Professional and Technical Services not only offers one of the highest Average Weekly Wages in the region, it is also above the statewide average of $1,493. The industry is one of the top 6 highest employed industries in the region as well, only to be beaten by industries that typically pay far less.
Above: This pie chart shows which industries employedthe most people in the 4th Quarter of 2013.
Right: This pie chart shows which industries paid the highest Average Weekly Wages in the 4th Quarter of 2013.
Professional and Techni-cal Services offers one of the highest Average Weekly Wages in the region and is above the statewide average of $1,493. The industry is also one of the top 6 highest employed in the region, only to be topped by those that typically pay far less.
New Orleans Industry Breakdown
Louisiana Workforce Information Review 201430
Employment & Wages
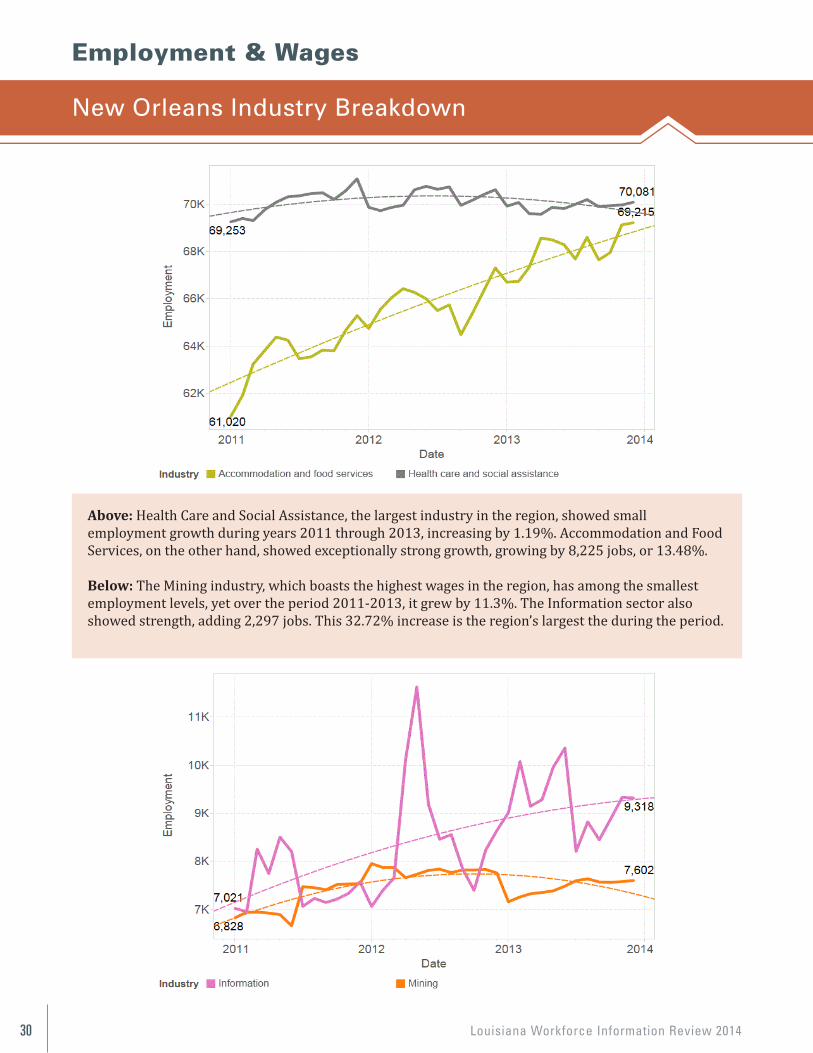
Above: Health Care and Social Assistance, the largest industry in the region, showed small employment growth during years 2011 through 2013, increasing by 1.19%. Accommodation and Food Services, on the other hand, showed exceptionally strong growth, growing by 8,225 jobs, or 13.48%.
Below: The Mining industry, which boasts the highest wages in the region, has among the smallest employment levels, yet over the period 2011-2013, it grew by 11.3%. The Information sector also showed strength, adding 2,297 jobs. This 32.72% increase is the region’s largest the during the period.
33
Above: Health Care and Social Assistance, the largest industry in the region, showed small employment growth during years 2011 through 2013, increasing by 1.19%. Accommodation and Food Services, on the other hand, showed exceptionally strong growth, growing by 8,225 jobs, or 13.48% Below: The Mining industry, which boasts the highest wages in the region, has among the smallest employment levels. That being said, over the period 2011-2013, it grew by 11.3%. The Information sector also showed strength, adding 2,297 jobs. This 32.72% increase is the largest increase in the region during the period.
New Orleans Industry Breakdown
Louisiana Workforce Information Review 2014 31
Occupational Wages And Projections (2022)
Employment & Wages
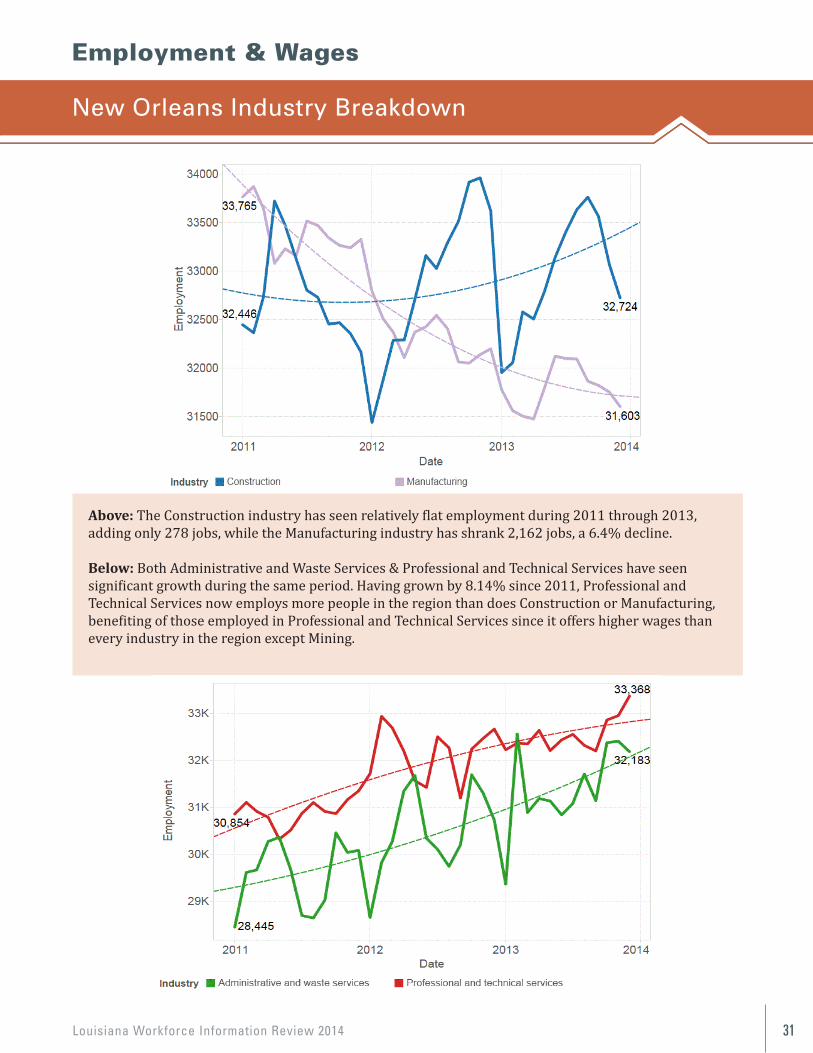
Above: The Construction industry has seen relatively flat employment during 2011 through 2013, adding only 278 jobs, while the Manufacturing industry has shrank 2,162 jobs, a 6.4% decline.
Below: Both Administrative and Waste Services & Professional and Technical Services have seen significant growth during the same period. Having grown by 8.14% since 2011, Professional and Technical Services now employs more people in the region than does Construction or Manufacturing, benefiting of those employed in Professional and Technical Services since it offers higher wages than every industry in the region except Mining.
34
Above: The Construction industry has seen relatively flat employment during the years 2011 through 2013, adding only 278 jobs, while the Manufacturing industry has shrank 2,162 jobs, a 6.4% decline. Below: Both Administrative and Waste Services & Professional and Technical Services have seen significant growth during the same period. Having grown by 8.14% since 2011, Professional and Technical Services now employs more people in the region than does Construction or Manufacturing, which is to the benefit of those employed in Professional and Technical Services since it offers higher wages than every industry in the region except Mining.
New Orleans Industry Breakdown
Louisiana Workforce Information Review 201432
New Orleans Region
35
New Orleans Region
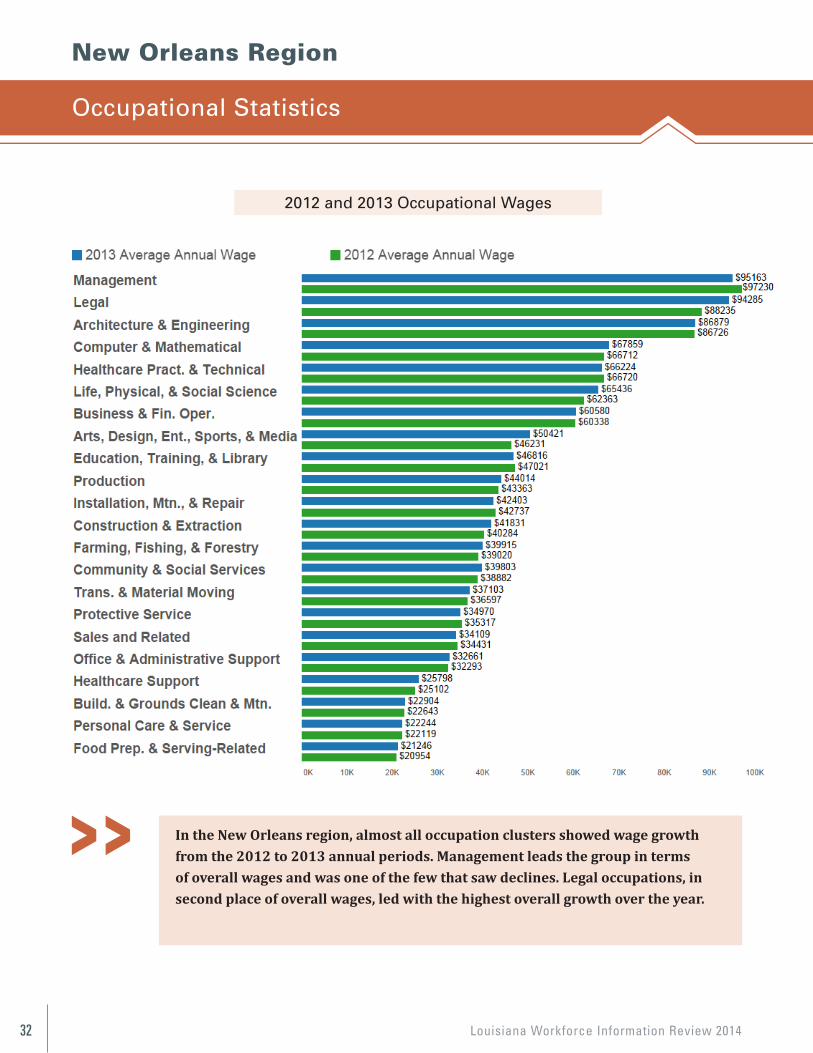
OCCUPATIONAL STATISTICS 2012 and 2013 Occupational Annual Wages
In the New Orleans region, almost all occupation clusters showed wage growth from the 2012 to 2013 annual periods. Management, which leads the group in terms of overall wages, was one of the few that saw declines. Legal occupations, which come in second place in terms of overall wages, led the pack with the highest overall growth over the year.
In the New Orleans region, almost all occupation clusters showed wage growth from the 2012 to 2013 annual periods. Management leads the group in terms of overall wages and was one of the few that saw declines. Legal occupations, in second place of overall wages, led with the highest overall growth over the year.
Occupational Statistics
2012 and 2013 Occupational Wages
Louisiana Workforce Information Review 2014 33
Occupational Wages And Projections (2022)
Supply Side
36
Supply Side
UNEMPLOYMENT INSURANCE CLAIMS
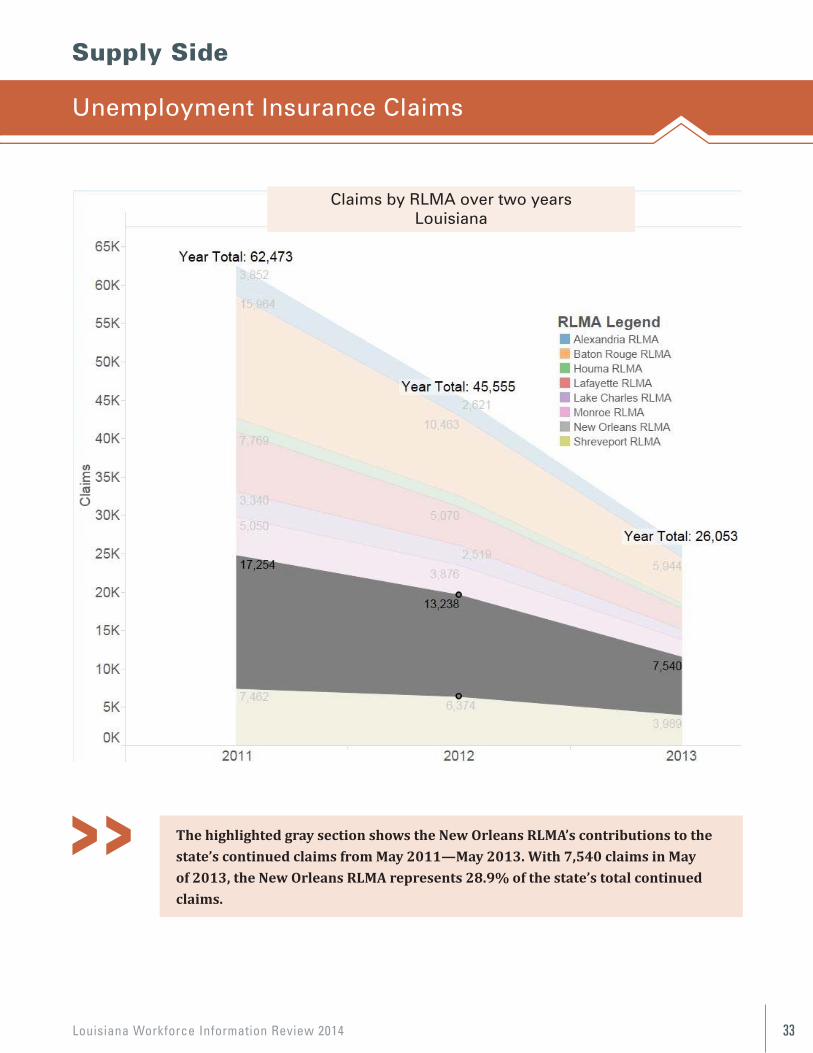
The above highlighted grey section shows the New Orleans RLMA’s contributions to the state’s continued claims from the period May 2011—May 2013. With 7,540 claims in May of 2013, the New Orleans RLMA represents 28.9% of the state’s total continued claims.
For more on Unemployment Insurance, visit page 135 in the Appendix
The highlighted gray section shows the New Orleans RLMA’s contributions to the state’s continued claims from May 2011—May 2013. With 7,540 claims in May of 2013, the New Orleans RLMA represents 28.9% of the state’s total continued claims.
Unemployment Insurance Claims
Claims by RLMA over two yearsLouisiana
Louisiana Workforce Information Review 201434
Supply Side
37
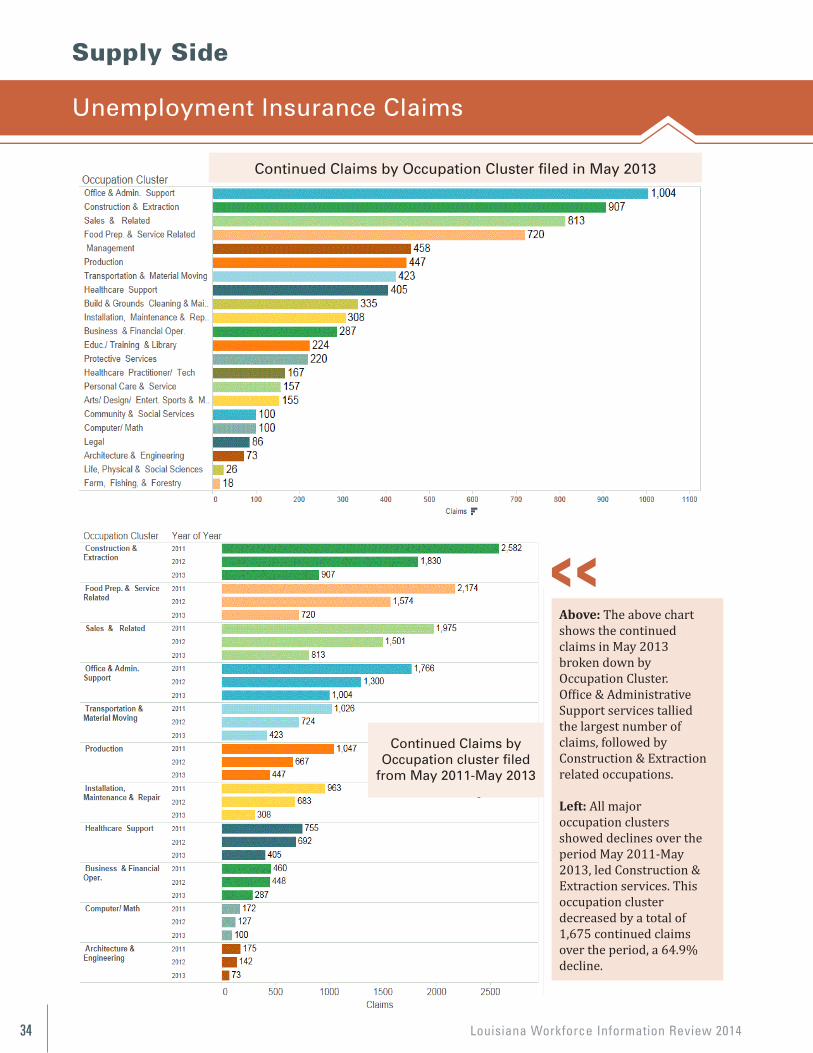
Above: The above chart shows the continued claims in May 2013 broken down by Occupation Cluster. Office & Administrative Support services tallied the largest number of claims, followed by Construction & Extraction related occupations. Left: All major occupation clusters showed declines over the period May 2011-May 2013, led Construction & Extraction services. This occupation cluster decreased by a total of 1,675 continued claims over the period, a 64.9% decline.
Continued Claims by Occupation Cluster filed in May 2013
Continued Claims by Occupation cluster
filed from May 2011—May 2013
Above: The above chartshows the continuedclaims in May 2013broken down byOccupation Cluster.Office & AdministrativeSupport services talliedthe largest number ofclaims, followed byConstruction & Extractionrelated occupations.
Left: All majoroccupation clustersshowed declines over theperiod May 2011-May2013, led Construction &Extraction services. Thisoccupation clusterdecreased by a total of1,675 continued claimsover the period, a 64.9%decline.
37
Above: The above chart shows the continued claims in May 2013 broken down by Occupation Cluster. Office & Administrative Support services tallied the largest number of claims, followed by Construction & Extraction related occupations. Left: All major occupation clusters showed declines over the period May 2011-May 2013, led Construction & Extraction services. This occupation cluster decreased by a total of 1,675 continued claims over the period, a 64.9% decline.
Continued Claims by Occupation Cluster filed in May 2013
Continued Claims by Occupation cluster
filed from May 2011—May 2013
Unemployment Insurance Claims
Continued Claims by Occupation Cluster filed in May 2013
Continued Claims byOccupation cluster filed
from May 2011-May 2013
Louisiana Workforce Information Review 2014 35
Occupational Wages And Projections (2022)
New Orleans Region
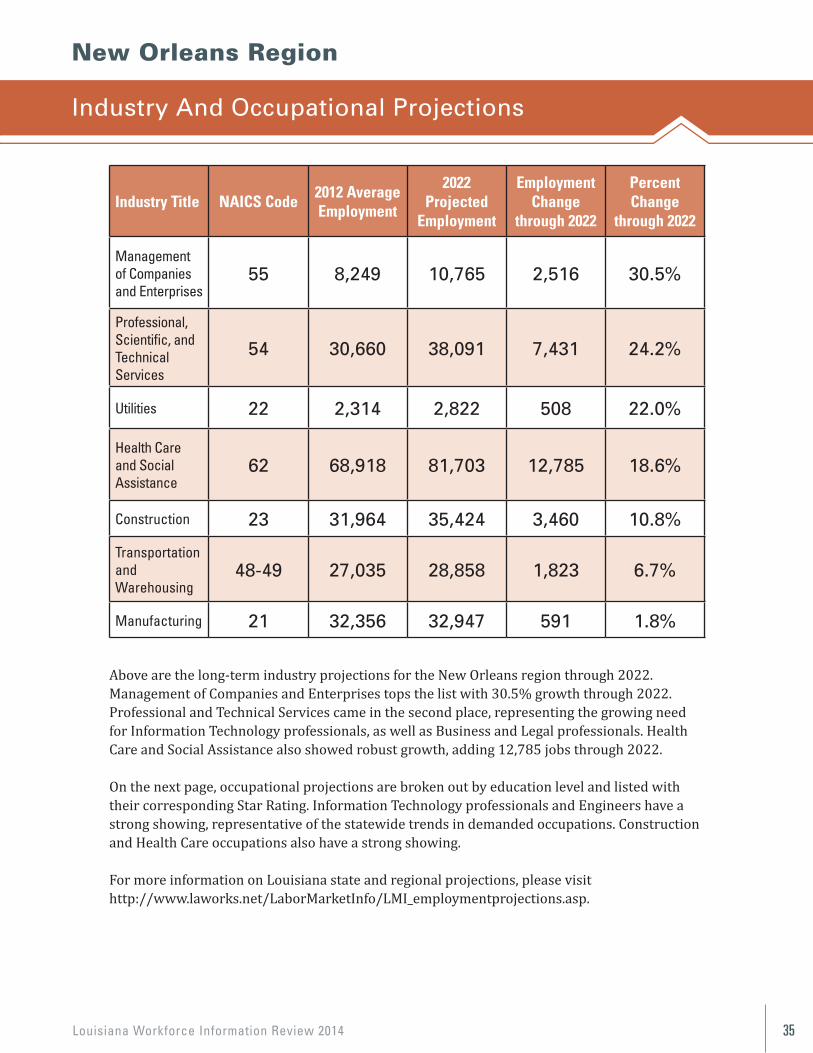
Above are the long-term industry projections for the New Orleans region through 2022. Management of Companies and Enterprises tops the list with 30.5% growth through 2022. Professional and Technical Services came in the second place, representing the growing need for Information Technology professionals, as well as Business and Legal professionals. Health Care and Social Assistance also showed robust growth, adding 12,785 jobs through 2022.
On the next page, occupational projections are broken out by education level and listed with their corresponding Star Rating. Information Technology professionals and Engineers have a strong showing, representative of the statewide trends in demanded occupations. Construction and Health Care occupations also have a strong showing.
For more information on Louisiana state and regional projections, please visit http://www.laworks.net/LaborMarketInfo/LMI_employmentprojections.asp.
Industry Title NAICS Code2012 AverageEmployment
2022 Projected
Employment
EmploymentChange
through 2022
PercentChange
through 2022
Management of Companies and Enterprises
55 8,249 10,765 2,516 30.5%
Professional,Scientific, andTechnical Services
54 30,660 38,091 7,431 24.2%
Utilities 22 2,314 2,822 508 22.0%
Health Care and Social Assistance
62 68,918 81,703 12,785 18.6%
Construction 23 31,964 35,424 3,460 10.8%
Transportation and Warehousing
48-49 27,035 28,858 1,823 6.7%
Manufacturing 21 32,356 32,947 591 1.8%
Industry And Occupational Projections
Louisiana Workforce Information Review 201436
New Orleans RLMA
StarRating
Bachelor's Degree Growing Occupations
Annual Openings
Annual Average Wages
StarRating
Associate's Degree Growing Occupations
Annual Openings
Annual Average Wages
StarRating
Post-Secondary Vocational Growing Occupations
Annual Openings
Annual Average Wages
Accountants and Auditors
210 $67,165 Property, Real Estate,and Community Association Managers
60 $43,577 Claims Adjusters, Examiners, and Investigators
40 $58,386
Computer Systems Analysts
100 $64,845 Loan Officers 40 $59,411 Nursing Assistants
170 $22,566
Information Security Analysts
20 $71,829 Computer Network Support Specialists
20 $54,685 Electricians 110 $49,567
Computer Programmers
60 $72,656 Registered Nurses
580 $65,824 Painters, Construction and Mainte-nance
60 $34,690
Software Developers, Applications
40 $87,591 Bookkeeping, Accounting, and Auditing Clerks
150 $35,819 Plumbers, Pipefitters, and Steam-fitters
60 $46,590
Chemical Engineers
10 $111,132 Chemical Plant and System Operators
10 $65,781 Automotive Service Tech-nicians and Mechanics
70 $39,200
Civil Engi-neers
60 $93,777 Chemical Equipment Operators and Tenders
20 $59,725 Welders, Cutters, Solderers, and Brazers
90 $46,414
Industrial Engineers
20 $97,722 Veterinary Technologists and Techni-cians
20 $26,566 Heavy and Tractor-Trailer Truck Drivers
170 $40,727
Mechanical Engineers
50 $97,391 Physical Therapist Assistants
10 $53,962 Crane and Tower Operators
40 $52,029
Petroleum Engineers
50 $143,828 Medical and Clinical Laboratory Technicians
30 $31,182 Dental Assistants
40 $30,945
Market Research Analysts and Marketing Specialists
40 $52,447 Dental Hygienists
20 $67,166 Phleboto-mists
30 $27,825
Elementary School Teachers, Except Special Education
100 $47,968 Electrical and Electronics Engineering Technicians
20 $58,080 Audio and Video Equipment Technicians
10 $37,409
Occupational Wages And Projections
Louisiana Workforce Information Review 2014 37
New Orleans MSA
40
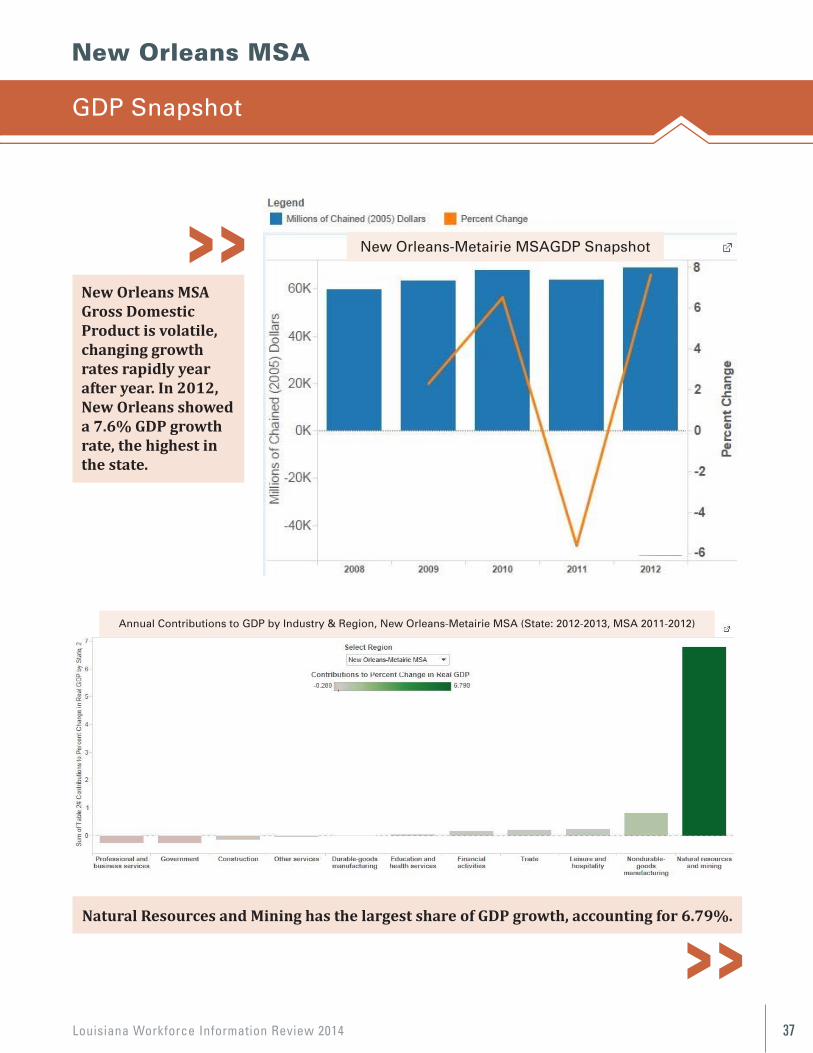
New Orleans MSA Gross Domestic Product is volatile, changing growth rates rapidly year after year. In 2012, New Orleans showed a 7.6% GDP growth rate, the highest in the state.
Natural Resources and Mining has the largest share of GDP growth, accounting for 6.79%.
Volume 1, Issue 1 Newsletter Date
New Orleans MSA
New Orleans MSA Gross Domestic Product is volatile, changing growthrates rapidly year after year. In 2012, New Orleans showed a 7.6% GDP growth rate, the highest in the state.
40
New Orleans MSA Gross Domestic Product is volatile, changing growth rates rapidly year after year. In 2012, New Orleans showed a 7.6% GDP growth rate, the highest in the state.
Natural Resources and Mining has the largest share of GDP growth, accounting for 6.79%.
Volume 1, Issue 1 Newsletter Date
New Orleans MSA
Natural Resources and Mining has the largest share of GDP growth, accounting for 6.79%.
GDP Snapshot
New Orleans-Metairie MSAGDP Snapshot
Annual Contributions to GDP by Industry & Region, New Orleans-Metairie MSA (State: 2012-2013, MSA 2011-2012)
Louisiana Workforce Information Review 201438
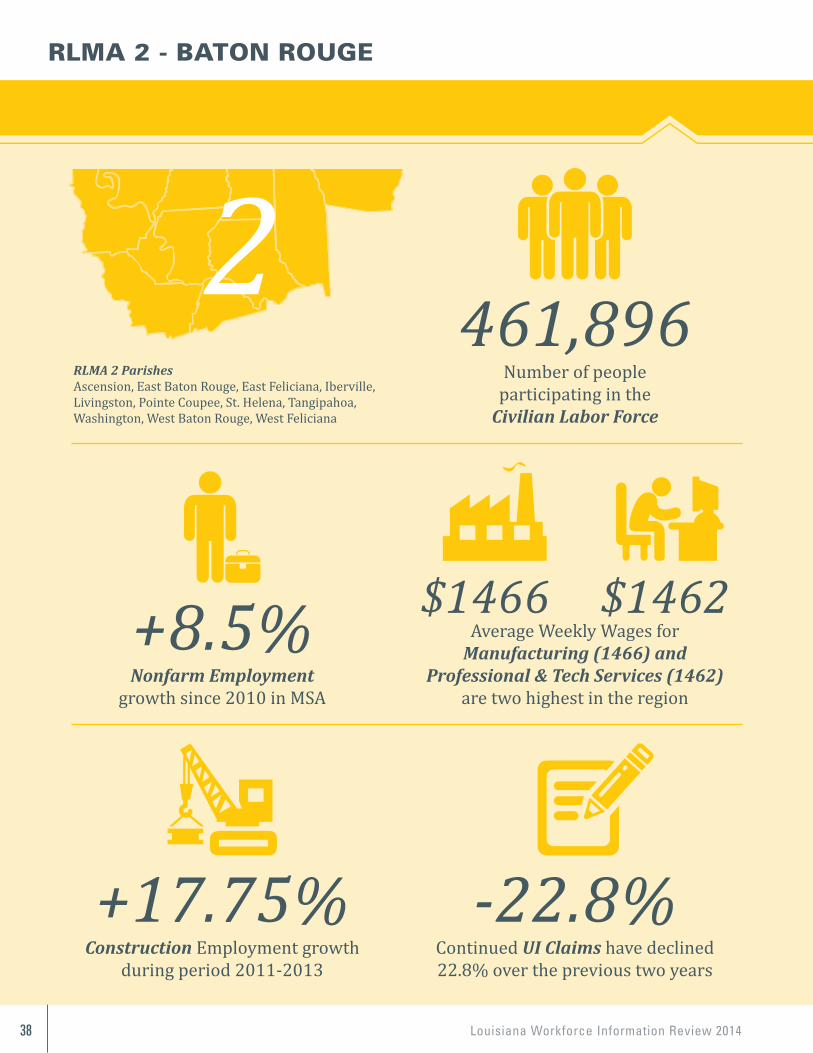
RLMA 2 ParishesAscension, East Baton Rouge, East Feliciana, Iberville, Livingston, Pointe Coupee, St. Helena, Tangipahoa, Washington, West Baton Rouge, West Feliciana
Number of people participating in the
Civilian Labor Force
461,896
Nonfarm Employment growth since 2010 in MSA
+8.5% Average Weekly Wages for Manufacturing (1466) and
Professional & Tech Services (1462) are two highest in the region
$1466 $1462
Construction Employment growth during period 2011-2013
+17.75%Continued UI Claims have declined 22.8% over the previous two years
-22.8%
RLMA 2 - BATON ROUGE
Louisiana Workforce Information Review 2014 39
BATON ROUGE RLMA
Labor Force Statistics
42
Baton Rouge RLMA
LABOR FORCE STATISTICS
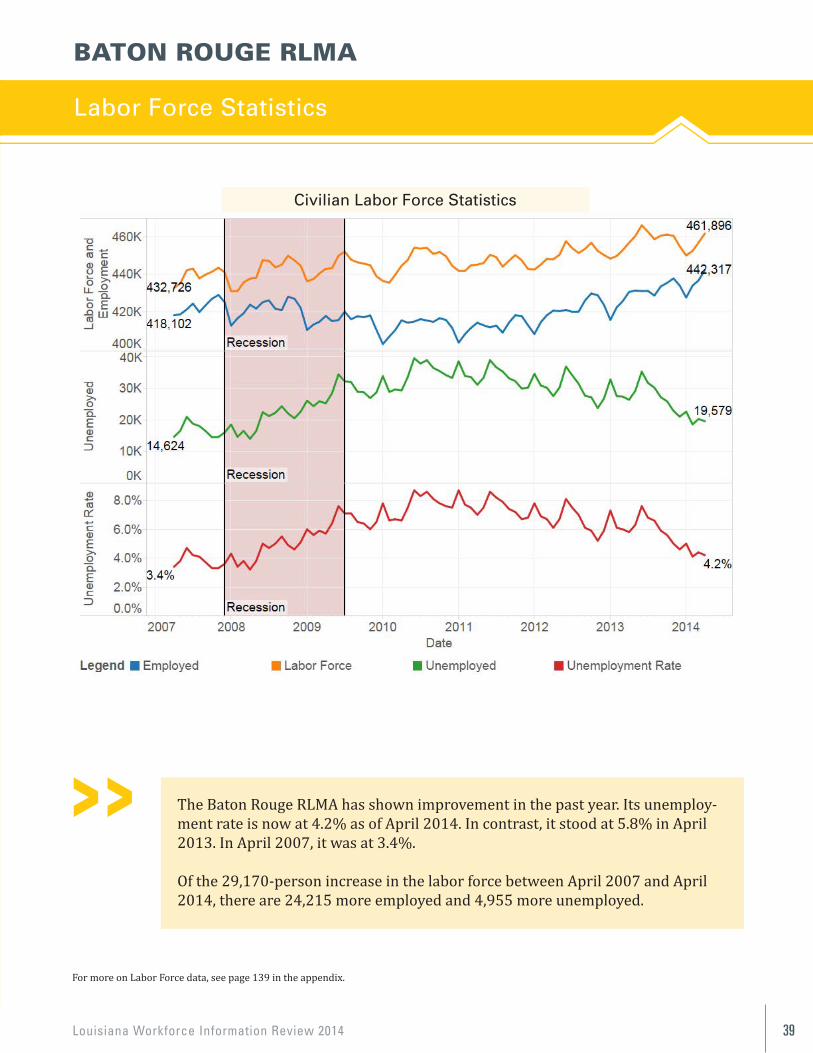
The Baton Rouge RLMA has shown improvement in the past year. Its unemployment rate is now at 4.2% as of April 2014. In contrast, it stood at 5.8% in April 2013. In April 2007, it was at 3.4%.
Of the 29,170 person increase in the labor force between April 2007 and April 2014, there are 24,215 more employed and 4,955 more unemployed.
For more on Labor Force data, see page 118 in the appendix.
Civilian Labor Force Statistics
The Baton Rouge RLMA has shown improvement in the past year. Its unemploy-ment rate is now at 4.2% as of April 2014. In contrast, it stood at 5.8% in April 2013. In April 2007, it was at 3.4%.
Of the 29,170-person increase in the labor force between April 2007 and April 2014, there are 24,215 more employed and 4,955 more unemployed.
For more on Labor Force data, see page 139 in the appendix.
Civilian Labor Force Statistics
Louisiana Workforce Information Review 201440
43
NONFARM EMPLOYMENT
Baton Rouge MSA
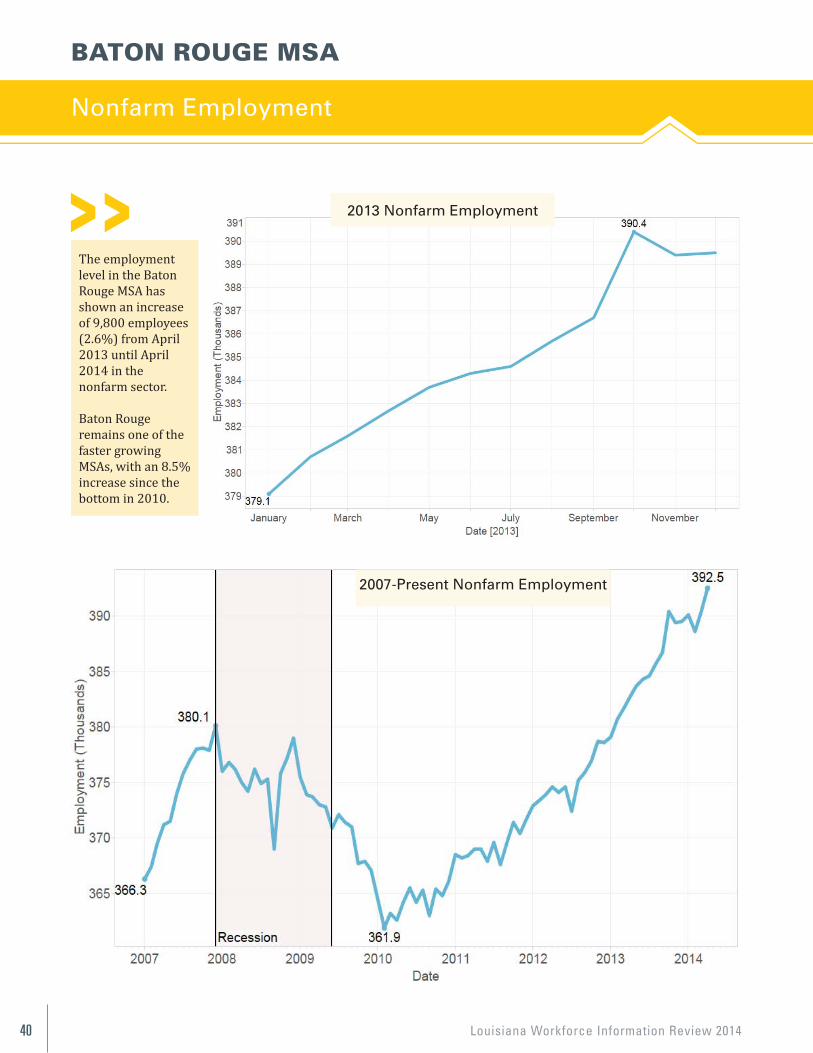
The employment level in the Baton Rouge MSA has shown an increase of 9,800 employees, or 2.6%, from April 2013 until April 2014 in the nonfarm sector.
Baton Rouge remains one of the faster growing MSAs, growing by 8.5% since the bottom in 2010.
For more on Nonfarm Employment, see page 126 in the Appendix.
2013 Nonfarm Employment
2007—Present Nonfarm Employment
BATON ROUGE MSA
Nonfarm Employment
The employmentlevel in the BatonRouge MSA hasshown an increaseof 9,800 employees (2.6%) from April2013 until April2014 in the nonfarm sector.
Baton Rougeremains one of thefaster growingMSAs, with an 8.5% increase since thebottom in 2010.
2013 Nonfarm Employment
2007-Present Nonfarm Employment
Louisiana Workforce Information Review 2014 41
Employment & Wages
Baton Rouge Industry Breakdown
44
BATON ROUGE INDUSTRY BREAKDOWN
QCEW
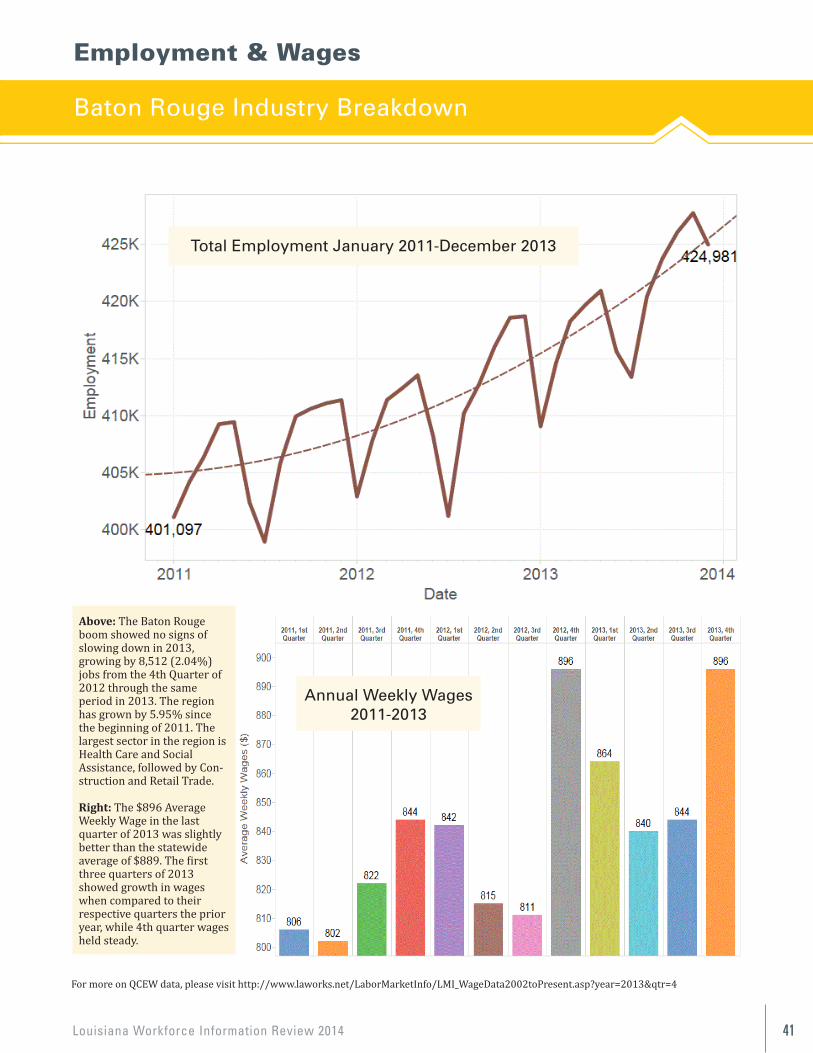
Above: The Baton Rouge boom showed no signs of slowing down in 2013, growing by 8,512 (2.04%) jobs from the 4th Quarter of 2012 through the same period in 2013. The region has grown by 5.95% since the beginning of 2011. The largest sector in the region is Health Care and Social Assistance, followed by Construction and Retail Trade. Right: The $896 Average Weekly Wage in the last quarter of 2013 was slightly better than the statewide average of $889. The first three quarters of 2013 showed growth in wages when compared to their respective quarters the prior year, while 4th quarter wages held steady.
Total Employment, January 2011—December 2013
Average Weekly Wages 2011—2013
For more on QCEW data, please visit http://www.laworks.net/LaborMarketInfo/LMI_WageData2002toPresent.asp?year=2013&qtr=4 For more on QCEW data, please visit http://www.laworks.net/LaborMarketInfo/LMI_WageData2002toPresent.asp?year=2013&qtr=4
Above: The Baton Rougeboom showed no signs ofslowing down in 2013,growing by 8,512 (2.04%)jobs from the 4th Quarter of2012 through the same period in 2013. The region has grown by 5.95% since the beginning of 2011. The largest sector in the region is Health Care and Social Assistance, followed by Con-struction and Retail Trade.
Right: The $896 AverageWeekly Wage in the lastquarter of 2013 was slightlybetter than the statewideaverage of $889. The firstthree quarters of 2013 showed growth in wages when compared to their respective quarters the prior year, while 4th quarter wages held steady.
Total Employment January 2011-December 2013
Annual Weekly Wages2011-2013
Louisiana Workforce Information Review 201442
Employment & Wages
45
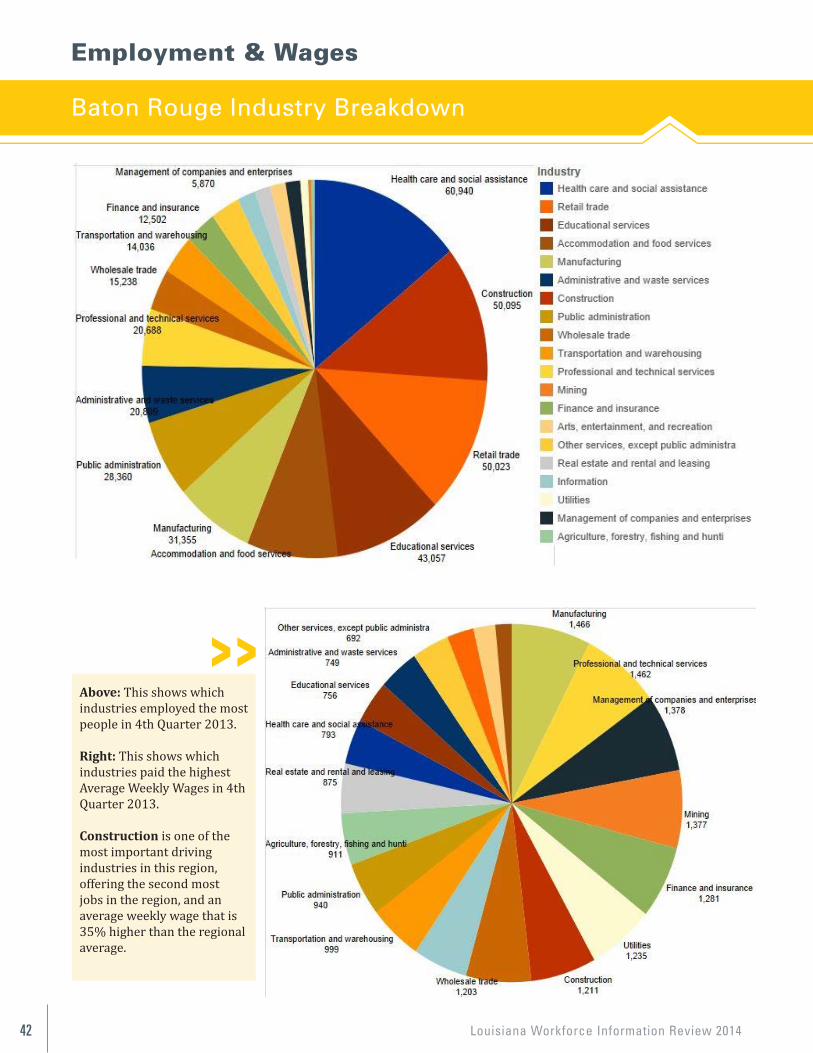
Above: This Pie Chart shows which industries employed the most people in the 4th Quarter of 2013. Right: This Pie Chart shows which industries paid the highest Average Weekly Wages in the 4th Quarter of 2013 Construction is one of the most important driving industries in this region, offering the second most jobs in the region, and an average weekly wage that is 35% higher than the regional average.
45
Above: This Pie Chart shows which industries employed the most people in the 4th Quarter of 2013. Right: This Pie Chart shows which industries paid the highest Average Weekly Wages in the 4th Quarter of 2013 Construction is one of the most important driving industries in this region, offering the second most jobs in the region, and an average weekly wage that is 35% higher than the regional average.
Above: This shows which industries employed the most people in 4th Quarter 2013.
Right: This shows which industries paid the highest Average Weekly Wages in 4th Quarter 2013.
Construction is one of the most important driving industries in this region, offering the second most jobs in the region, and an average weekly wage that is 35% higher than the regional average.
Baton Rouge Industry Breakdown
Louisiana Workforce Information Review 2014 43
Employment & Wages
Baton Rouge Industry Breakdown
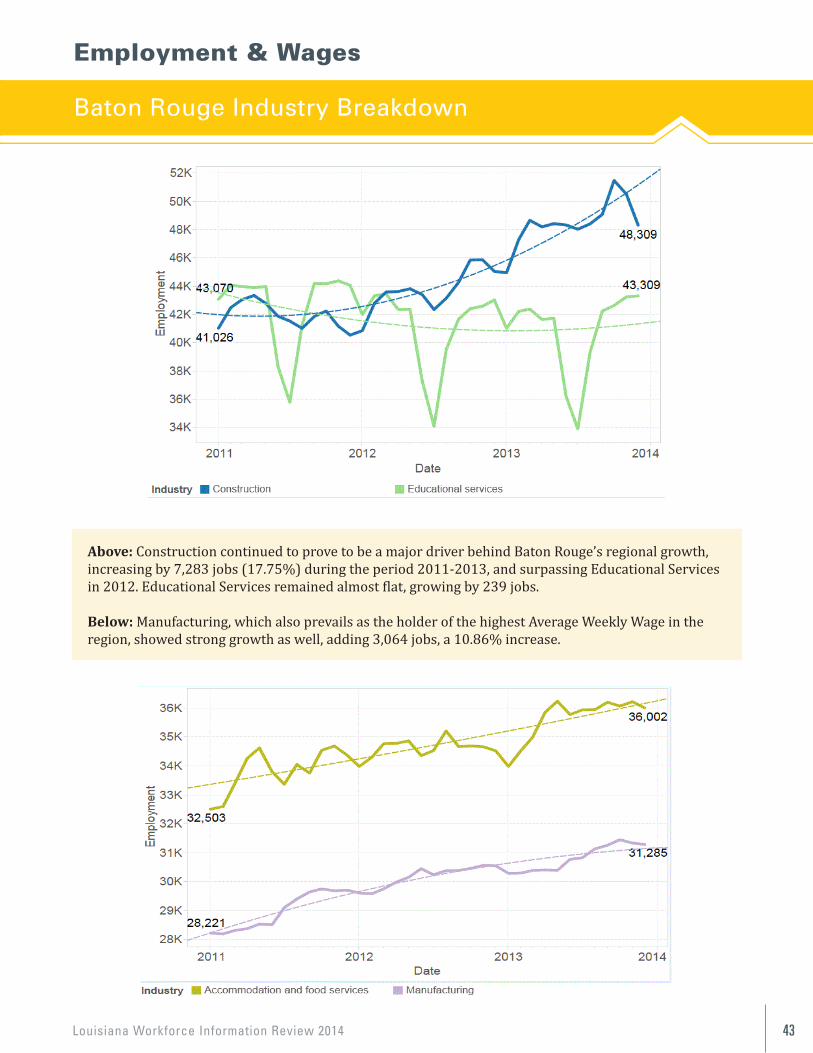
Above: Construction continued to prove to be a major driver behind Baton Rouge’s regional growth, increasing by 7,283 jobs (17.75%) during the period 2011-2013, and surpassing Educational Services in 2012. Educational Services remained almost flat, growing by 239 jobs.
Below: Manufacturing, which also prevails as the holder of the highest Average Weekly Wage in the region, showed strong growth as well, adding 3,064 jobs, a 10.86% increase.
46
Above: Construction continued to prove to be a major driver behind the Baton Rouge region’s growth, growing by 7,283 jobs, or 17.75%, during the period 2011-2013, surpassing Educational Services in 2012. Educational Services remained almost flat, growing by 239 jobs. Below: Manufacturing, which also prevails as the holder of the highest average weekly wage in the region, also showed strong growth, adding 3,064 jobs, an increase of 10.86%.
Louisiana Workforce Information Review 201444
Baton Rouge Region
Occupational Statistics
47
Baton Rouge Region
OCCUPATIONAL STATISTICS 2012 and 2013 Occupational Annual Wages
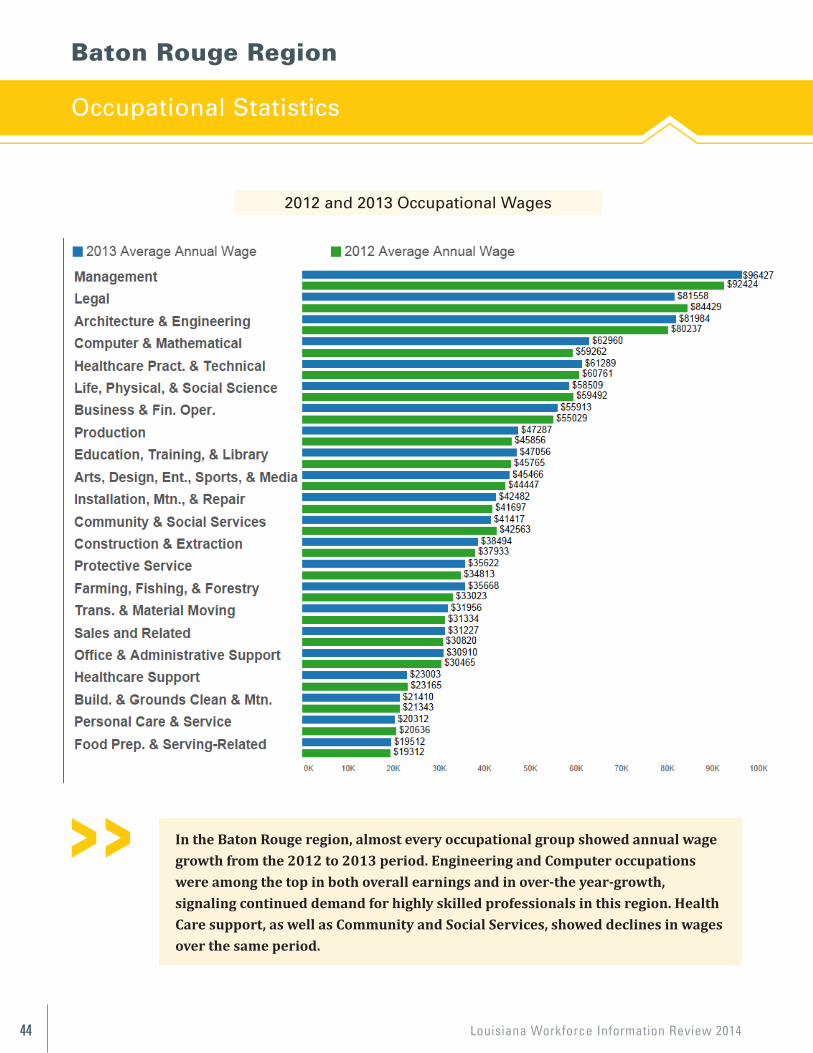
In the Baton Rouge region, almost every occupational group showed annual wage growth from the 2012 to 2013 period. Engineering and Computer occupations were among the top in both overall earnings and in over the year growth, signaling continued demand for highly skilled professionals in this region. Health Care support, as well as Community and Social Services, showed declines in wages over the same period.
In the Baton Rouge region, almost every occupational group showed annual wagegrowth from the 2012 to 2013 period. Engineering and Computer occupations were among the top in both overall earnings and in over-the year-growth, signaling continued demand for highly skilled professionals in this region. Health Care support, as well as Community and Social Services, showed declines in wages over the same period.
2012 and 2013 Occupational Wages
Louisiana Workforce Information Review 2014 45
Supply Side
Unemployment Insurance Claims
48
Supply Side
UNEMPLOYMENT INSURANCE CLAIMS
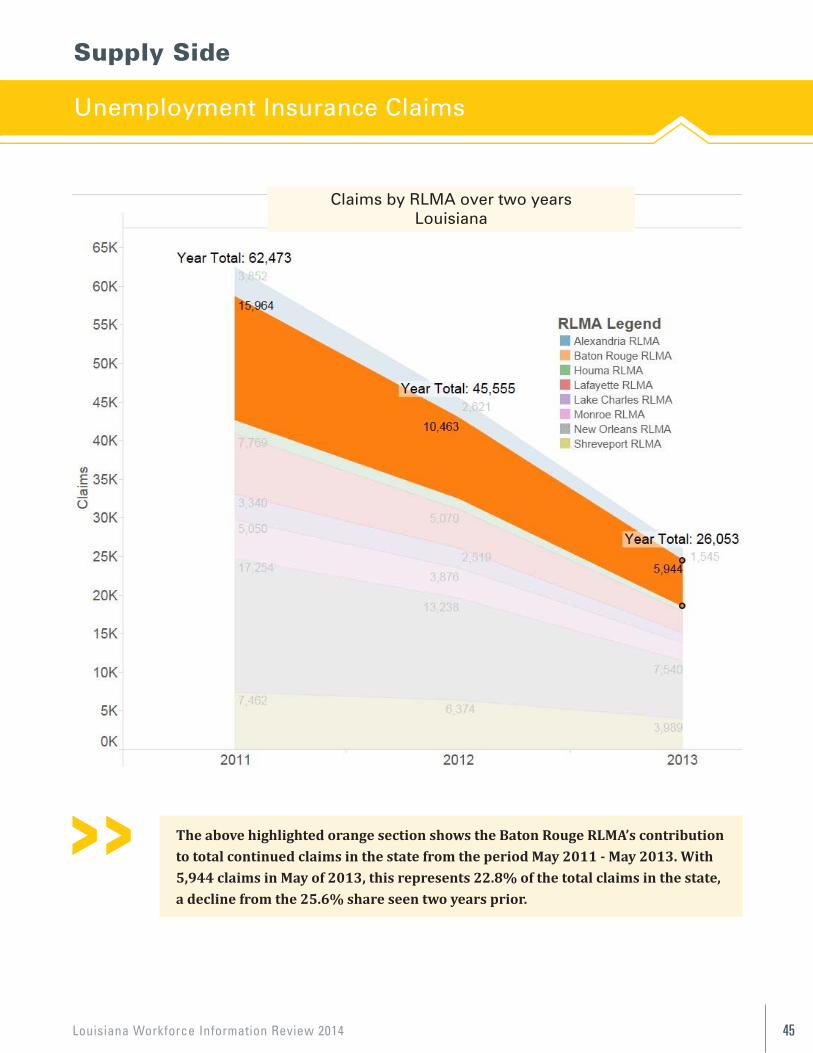
The above highlighted orange section shows the Baton Rouge RLMA’s contribution to total continued claims in the state from the period May 2011 - May 2013. With 5,944 claims in May of 2013, this represents 22.8% of the total claims in the state, which is a decline from the 25.6% share seen two years prior.
For more on Unemployment Insurance, visit page 135 in the Appendix
The above highlighted orange section shows the Baton Rouge RLMA’s contribution to total continued claims in the state from the period May 2011 - May 2013. With 5,944 claims in May of 2013, this represents 22.8% of the total claims in the state, a decline from the 25.6% share seen two years prior.
Claims by RLMA over two yearsLouisiana
Louisiana Workforce Information Review 201446
Supply Side
Unemployment Insurance Claims
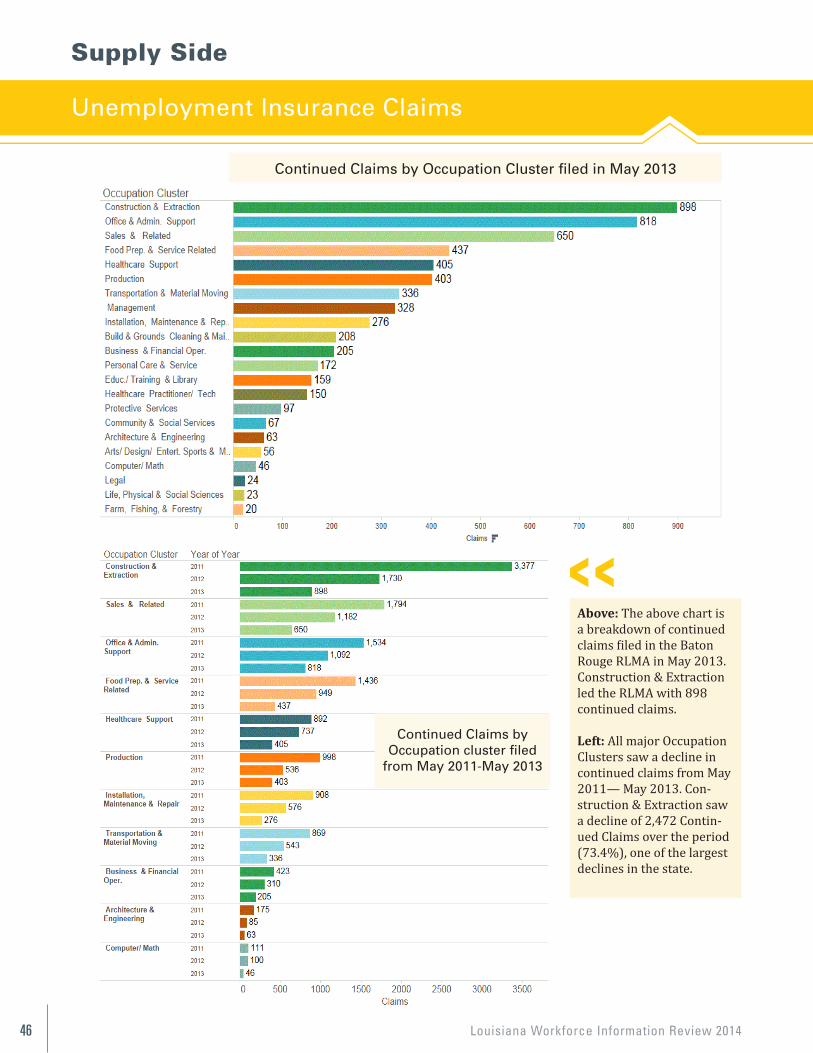
Above: The above chart isa breakdown of continuedclaims filed in the BatonRouge RLMA in May 2013. Construction & Extraction led the RLMA with 898 continued claims.
Left: All major Occupation Clusters saw a decline in continued claims from May 2011— May 2013. Con-struction & Extraction saw a decline of 2,472 Contin-ued Claims over the period (73.4%), one of the largest declines in the state.
49
Above: The above chart is a break down of continued claims filed in the Baton Rouge RLMA in May 2013. Construction & Extraction led the RLMA with 898 continued claims. Left: All major Occupation Clusters saw a decline in continued claims from May 2011—May 2013. Construction & Extraction saw a decline of 2,472 Continued Claims over the period, a 73.4% decline, one of the largest declines in the whole state.
Continued Claims by Occupation Cluster filed in May 2013
Continued Claims by Occupation cluster
filed from May 2011—May 2013
Continued Claims by Occupation Cluster filed in May 2013
Continued Claims byOccupation cluster filed
from May 2011-May 2013
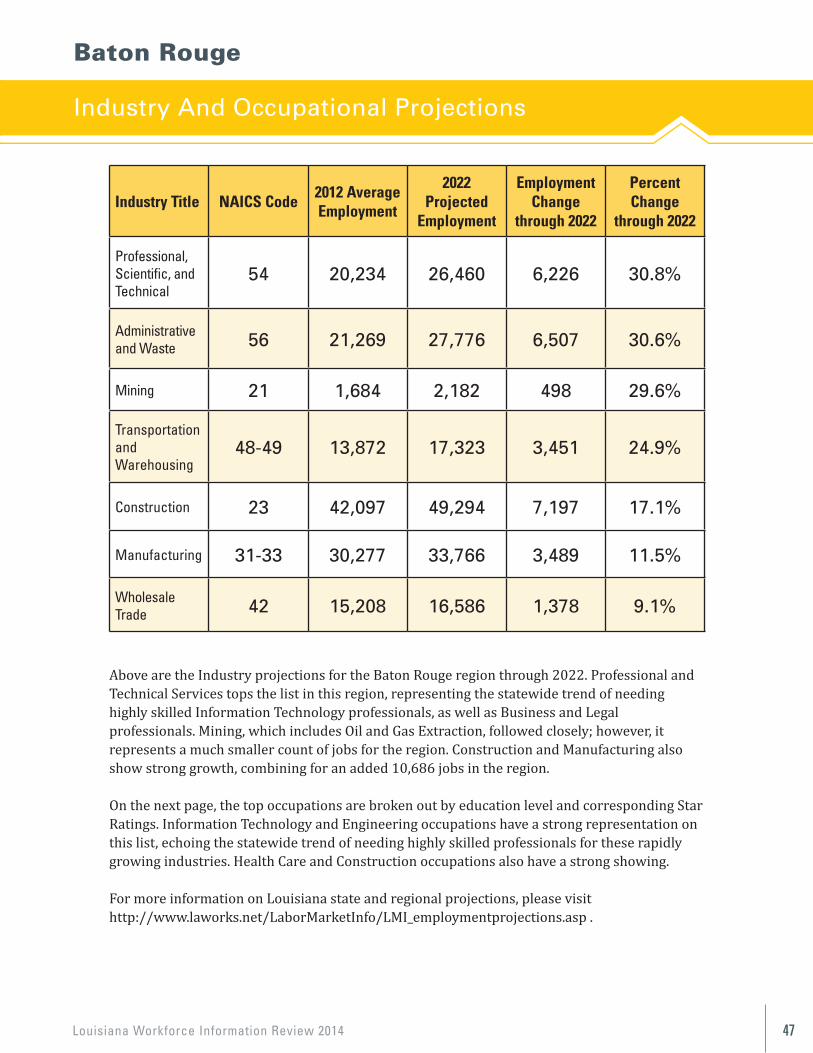
Louisiana Workforce Information Review 2014 47
Baton Rouge
Industry And Occupational Projections
Industry Title NAICS Code2012 AverageEmployment
2022 Projected
Employment
EmploymentChange
through 2022
PercentChange
through 2022
Professional,Scientific, andTechnical
54 20,234 26,460 6,226 30.8%
Administrativeand Waste 56 21,269 27,776 6,507 30.6%
Mining 21 1,684 2,182 498 29.6%
Transportation and Warehousing
48-49 13,872 17,323 3,451 24.9%
Construction 23 42,097 49,294 7,197 17.1%
Manufacturing 31-33 30,277 33,766 3,489 11.5%
Wholesale Trade 42 15,208 16,586 1,378 9.1%
Above are the Industry projections for the Baton Rouge region through 2022. Professional andTechnical Services tops the list in this region, representing the statewide trend of needinghighly skilled Information Technology professionals, as well as Business and Legalprofessionals. Mining, which includes Oil and Gas Extraction, followed closely; however, itrepresents a much smaller count of jobs for the region. Construction and Manufacturing alsoshow strong growth, combining for an added 10,686 jobs in the region.
On the next page, the top occupations are broken out by education level and corresponding Star Ratings. Information Technology and Engineering occupations have a strong representation on this list, echoing the statewide trend of needing highly skilled professionals for these rapidly growing industries. Health Care and Construction occupations also have a strong showing.
For more information on Louisiana state and regional projections, please visit http://www.laworks.net/LaborMarketInfo/LMI_employmentprojections.asp .
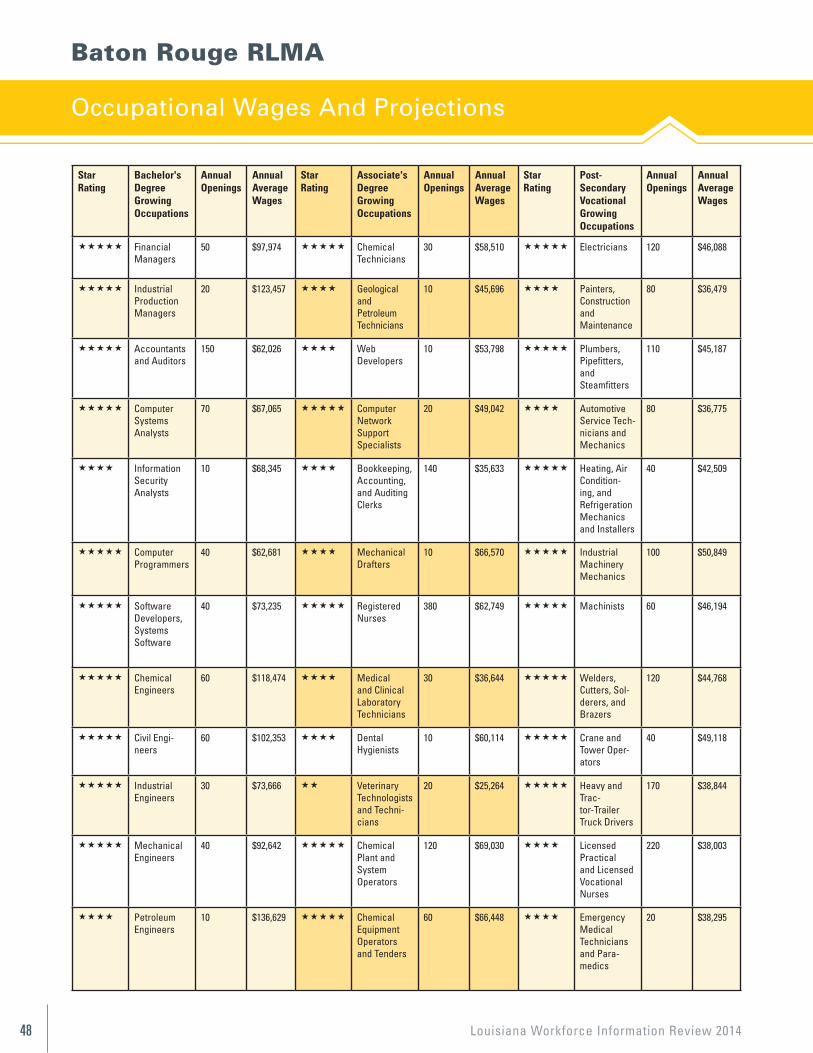
Louisiana Workforce Information Review 201448
StarRating
Bachelor's Degree Growing Occupations
Annual Openings
Annual Average Wages
StarRating
Associate's Degree Growing Occupations
Annual Openings
Annual Average Wages
StarRating
Post-Secondary Vocational Growing Occupations
Annual Openings
Annual Average Wages
Financial Managers
50 $97,974 Chemical Technicians
30 $58,510 Electricians 120 $46,088
Industrial Production Managers
20 $123,457 Geological and Petroleum Technicians
10 $45,696 Painters, Construction and Maintenance
80 $36,479
Accountants and Auditors
150 $62,026 Web Developers
10 $53,798 Plumbers, Pipefitters, and Steamfitters
110 $45,187
Computer Systems Analysts
70 $67,065 Computer Network Support Specialists
20 $49,042 Automotive Service Tech-nicians and Mechanics
80 $36,775
Information Security Analysts
10 $68,345 Bookkeeping, Accounting, and Auditing Clerks
140 $35,633 Heating, Air Condition-ing, and Refrigeration Mechanics and Installers
40 $42,509
Computer Programmers
40 $62,681 Mechanical Drafters
10 $66,570 Industrial Machinery Mechanics
100 $50,849
Software Developers, Systems Software
40 $73,235 Registered Nurses
380 $62,749 Machinists 60 $46,194
Chemical Engineers
60 $118,474 Medical and Clinical Laboratory Technicians
30 $36,644 Welders, Cutters, Sol-derers, and Brazers
120 $44,768
Civil Engi-neers
60 $102,353 Dental Hygienists
10 $60,114 Crane and Tower Oper-ators
40 $49,118
Industrial Engineers
30 $73,666 Veterinary Technologists and Techni-cians
20 $25,264 Heavy and Trac-tor-Trailer Truck Drivers
170 $38,844
Mechanical Engineers
40 $92,642 Chemical Plant and System Operators
120 $69,030 Licensed Practical and Licensed Vocational Nurses
220 $38,003
Petroleum Engineers
10 $136,629 Chemical Equipment Operators and Tenders
60 $66,448 Emergency Medical Technicians and Para-medics
20 $38,295
Baton Rouge RLMA
Occupational Wages And Projections
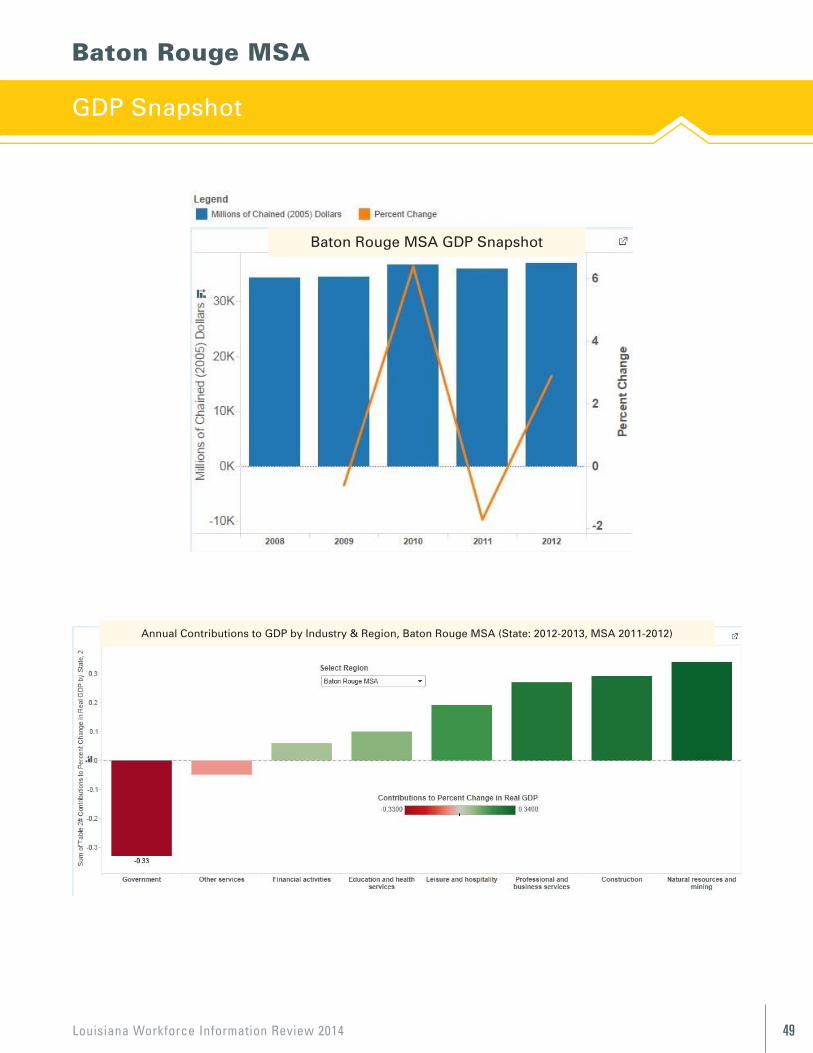
Louisiana Workforce Information Review 2014 49
Baton Rouge MSA
GDP Snapshot
52
Volume 1, Issue 1 Newsletter Date
Baton Rouge MSA
52
Volume 1, Issue 1 Newsletter Date
Baton Rouge MSA
Baton Rouge MSA GDP Snapshot
Annual Contributions to GDP by Industry & Region, Baton Rouge MSA (State: 2012-2013, MSA 2011-2012)
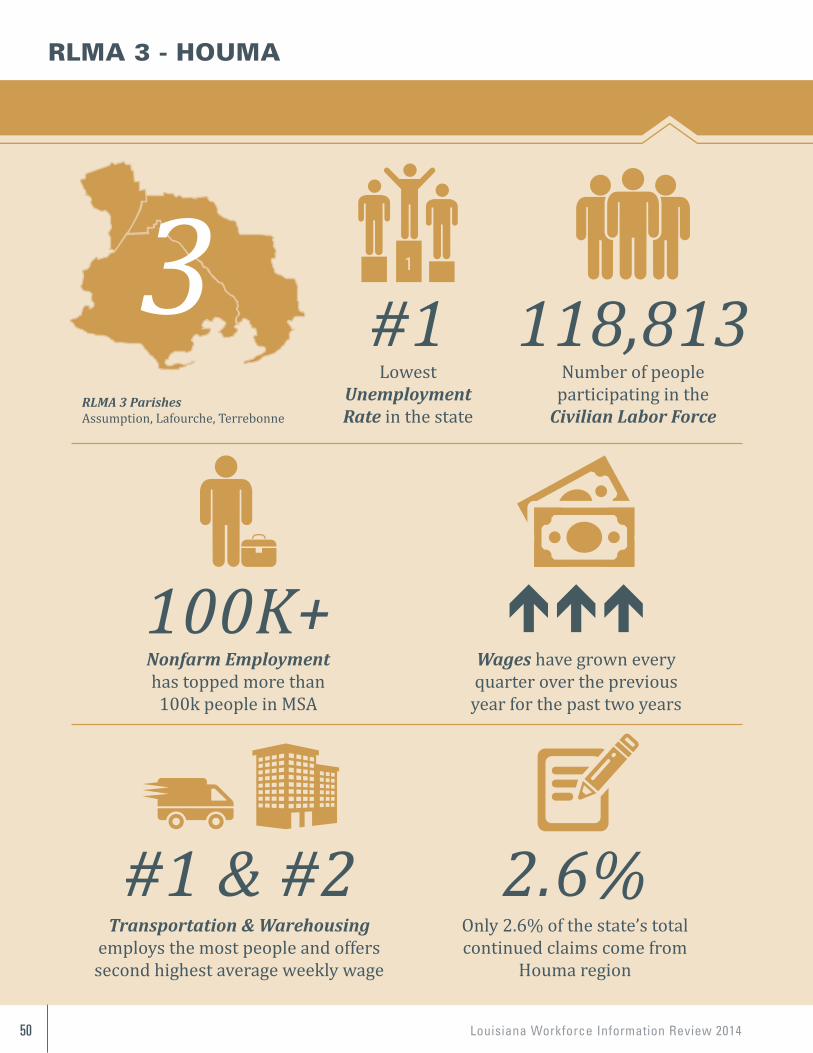
Louisiana Workforce Information Review 201450
RLMA 3 ParishesAssumption, Lafourche, Terrebonne
LowestUnemploymentRate in the state
#1
Nonfarm Employmenthas topped more than 100k people in MSA
100K+
Transportation & Warehousing employs the most people and offers second highest average weekly wage
#1 & #2Only 2.6% of the state’s total continued claims come from
Houma region
2.6%
RLMA 3 - HOUMA
Number of people participating in the
Civilian Labor Force
118,813
Wages have grown every quarter over the previous year for the past two years
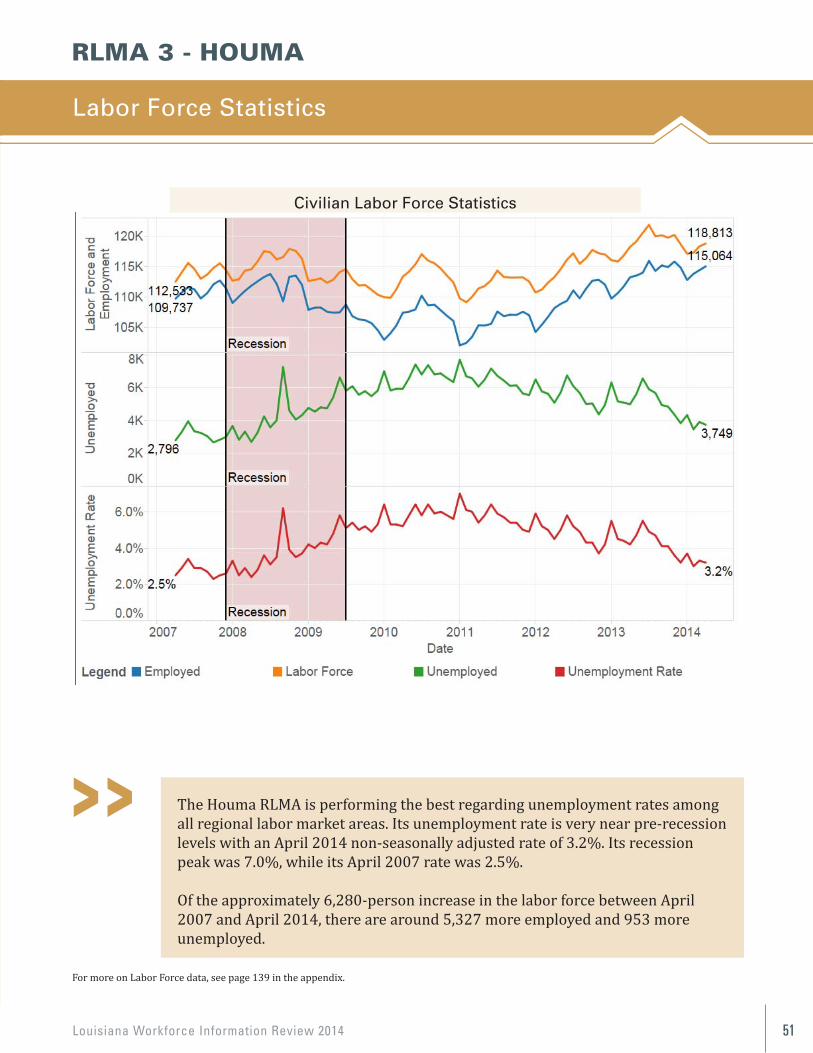
Louisiana Workforce Information Review 2014 51
Labor Force Statistics
RLMA 3 - HOUMA
54
Houma RLMA
LABOR FORCE STATISTICS
The Houma RLMA is performing the best regarding unemployment rates among all regional labor market areas. Its unemployment rate is very near pre-recession levels with an April 2014 non-seasonally adjusted rate of 3.2%. Its recession peak was 7.0%. Its April 2007 rate was 2.5%.
Of the approximately 6,280 person increase in the labor force between April 2007 and April 2014, there are around 5,327 more employed and 953 more unemployed.
Houma Region Labor Force Trends
For more on Labor Force data, see page 118 in the appendix.
Civilian Labor Force Statistics
The Houma RLMA is performing the best regarding unemployment rates among all regional labor market areas. Its unemployment rate is very near pre-recession levels with an April 2014 non-seasonally adjusted rate of 3.2%. Its recession peak was 7.0%, while its April 2007 rate was 2.5%.
Of the approximately 6,280-person increase in the labor force between April 2007 and April 2014, there are around 5,327 more employed and 953 more unemployed.
For more on Labor Force data, see page 139 in the appendix.
Civilian Labor Force Statistics
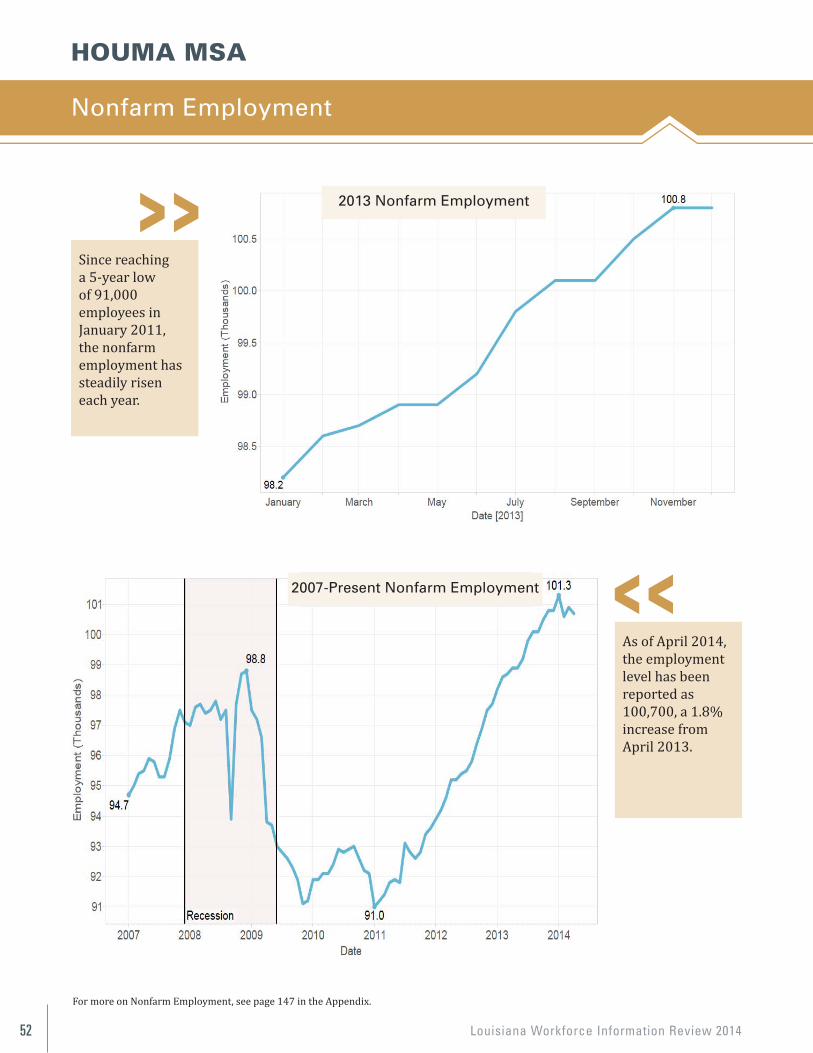
Louisiana Workforce Information Review 201452
HOUMA MSA
Nonfarm Employment
Since reaching a 5-year low of 91,000 employees in January 2011, the nonfarm employment has steadily risen each year.
55
NONFARM EMPLOYMENT
Houma MSA
Since reaching a 5 year low of 91,000employees in January of 2011, the nonfarmemploymenthas steadily risen each year.
As of April 2014, the employmentlevel has been reported as 100,700. This is a 1.8% increase from theemploymentlevel in April 2013.
For more on Nonfarm Employment, see page 126 in the Appendix.
2013 Nonfarm Employment
2007—Present Nonfarm Employment
As of April 2014, the employment level has been reported as 100,700, a 1.8% increase from April 2013.
For more on Nonfarm Employment, see page 147 in the Appendix.
2013 Nonfarm Employment
2007-Present Nonfarm Employment
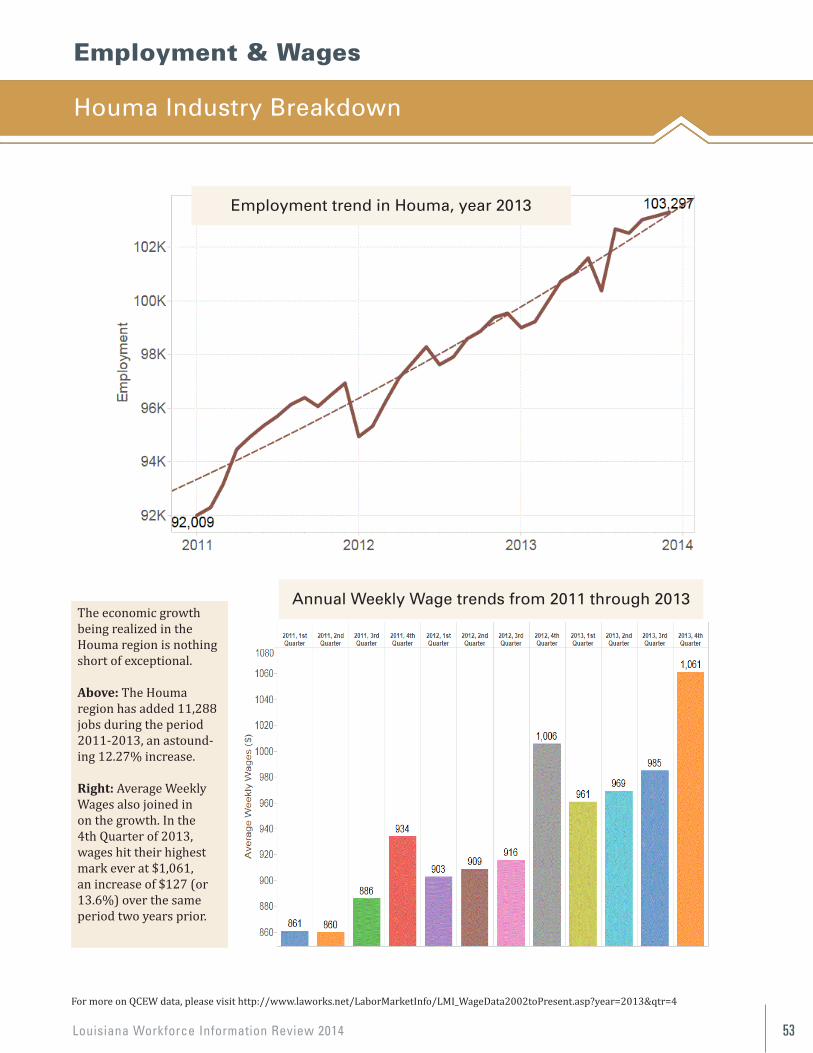
Louisiana Workforce Information Review 2014 53
Occupational Wages And Projections (2022)
Employment & Wages
Houma Industry Breakdown
For more on QCEW data, please visit http://www.laworks.net/LaborMarketInfo/LMI_WageData2002toPresent.asp?year=2013&qtr=4
The economic growth being realized in the Houma region is nothing short of exceptional.
Above: The Houma region has added 11,288 jobs during the period 2011-2013, an astound-ing 12.27% increase.
Right: Average WeeklyWages also joined in on the growth. In the 4th Quarter of 2013, wages hit their highest mark ever at $1,061, an increase of $127 (or 13.6%) over the same period two years prior.
56
HOUMA INDUSTRY BREAKDOWN QCEW
The Economic growth that is being realized in the Houma region is nothing short of exceptional.
Above: The Houma region has added 11,288 jobs during the period 2011-2013, an astounding 12.27%. Right: Average Weekly Wages also joined in on the growth. In the 4th Quarter of 2013, wages hit their highest mark ever at $1,061, an increase of $127 (or 13.6%) over the same period two years prior.
For more on QCEW data, please visit http://www.laworks.net/LaborMarketInfo/LMI_WageData2002toPresent.asp?year=2013&qtr=4
Employment Trend in Houma, year 2013
Average Weekly Wage trends from 2011 through 2013
Employment trend in Houma, year 2013
Annual Weekly Wage trends from 2011 through 2013
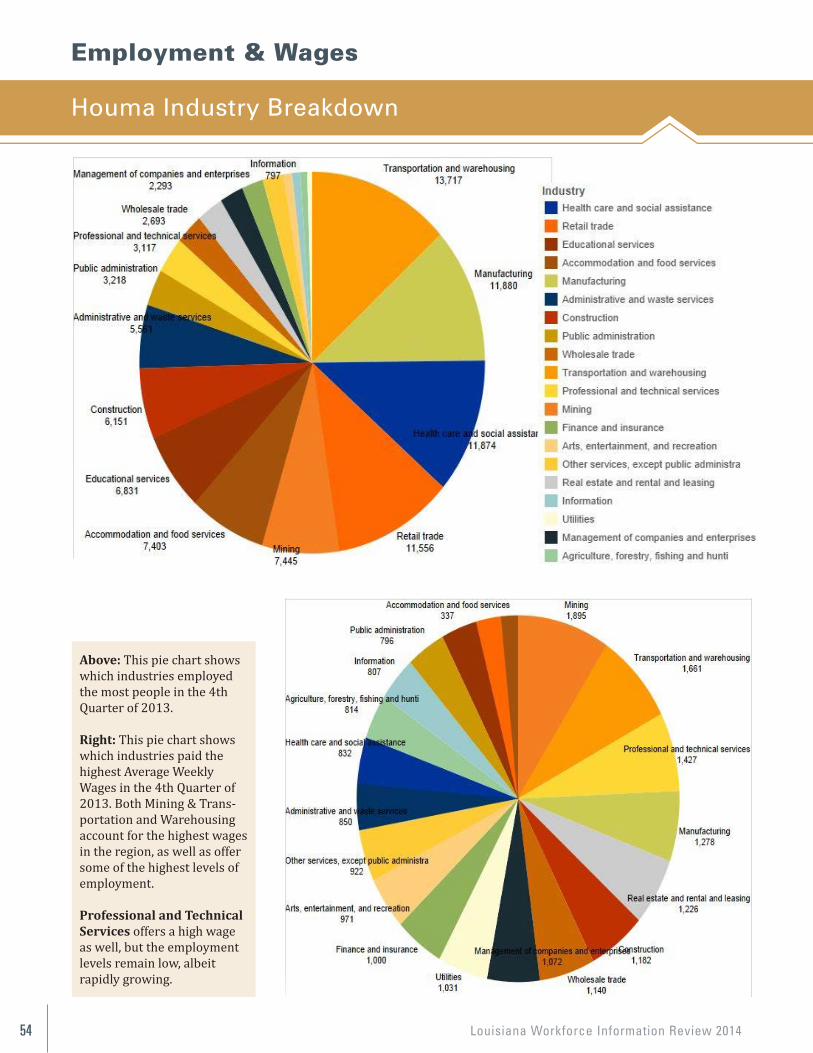
Louisiana Workforce Information Review 201454 57
Above: This Pie Chart shows which industries employed the most people in the 4th Quarter of 2013. Right: This Pie Chart shows which industries paid the highest Average Weekly Wages in the 4th Quarter of 2013 Both Mining & Transportation and Warehousing account for the highest wages in the region, as well as offer some of the highest levels of employment. Professional and Technical Services offers a high wage as well, but the employment levels remain low, albeit rapidly growing. 57
Above: This Pie Chart shows which industries employed the most people in the 4th Quarter of 2013. Right: This Pie Chart shows which industries paid the highest Average Weekly Wages in the 4th Quarter of 2013 Both Mining & Transportation and Warehousing account for the highest wages in the region, as well as offer some of the highest levels of employment. Professional and Technical Services offers a high wage as well, but the employment levels remain low, albeit rapidly growing.
Above: This pie chart shows which industries employed the most people in the 4thQuarter of 2013.
Right: This pie chart shows which industries paid the highest Average Weekly Wages in the 4th Quarter of 2013. Both Mining & Trans-portation and Warehousing account for the highest wages in the region, as well as offer some of the highest levels ofemployment.
Professional and Technical Services offers a high wage as well, but the employment levels remain low, albeitrapidly growing.
Employment & Wages
Houma Industry Breakdown
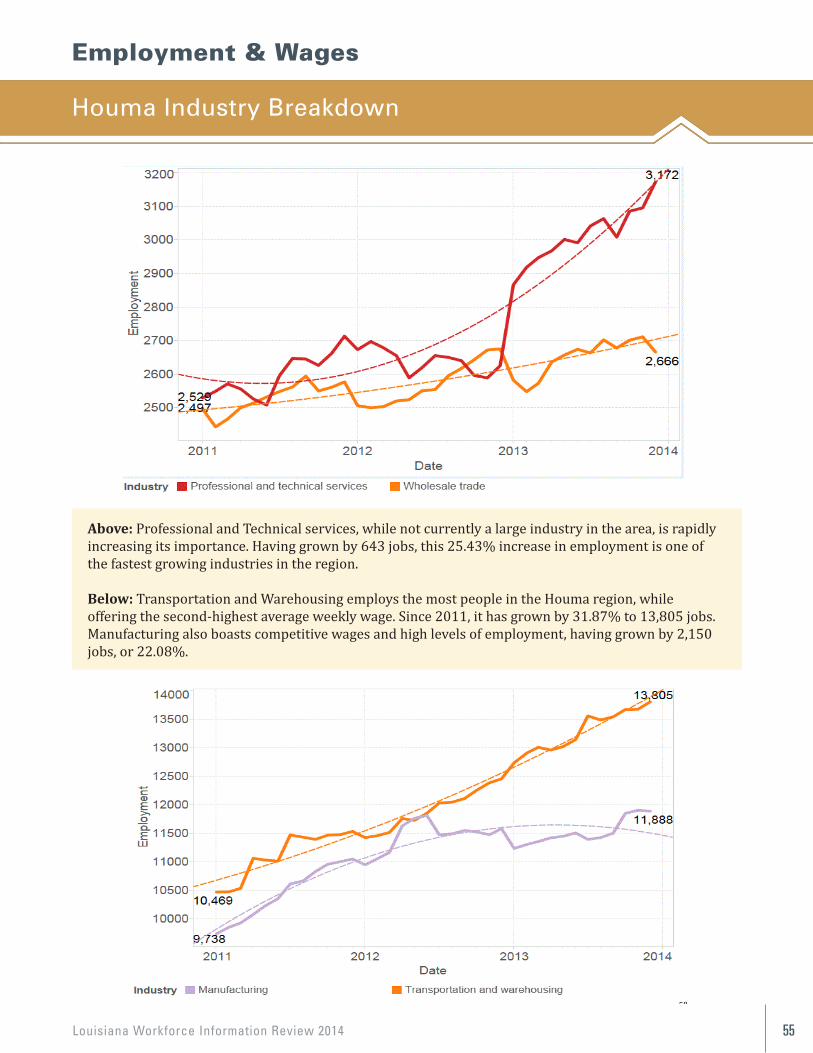
Louisiana Workforce Information Review 2014 55
Occupational Wages And Projections (2022)
Employment & Wages
Houma Industry Breakdown
Above: Professional and Technical services, while not currently a large industry in the area, is rapidly increasing its importance. Having grown by 643 jobs, this 25.43% increase in employment is one of the fastest growing industries in the region.
Below: Transportation and Warehousing employs the most people in the Houma region, while offering the second-highest average weekly wage. Since 2011, it has grown by 31.87% to 13,805 jobs. Manufacturing also boasts competitive wages and high levels of employment, having grown by 2,150 jobs, or 22.08%.
58
Above: As stated on the previous page, Professional and Technical services, while not a large industry in the area currently, is rapidly increasing it’s importance in the area. Having grown by 643 jobs, this 25.43% increase in employment is one of the fastest growing industries in the region. Below: Transportation and Warehousing employs the most people in the Houma region, while offering the second highest average weekly wage. Since 2011, it has grown by 31.87% to 13,805 jobs. Manufacturing also boasts competitive wages and high levels of employment, having grown by 2,150 jobs, or 22.08%.
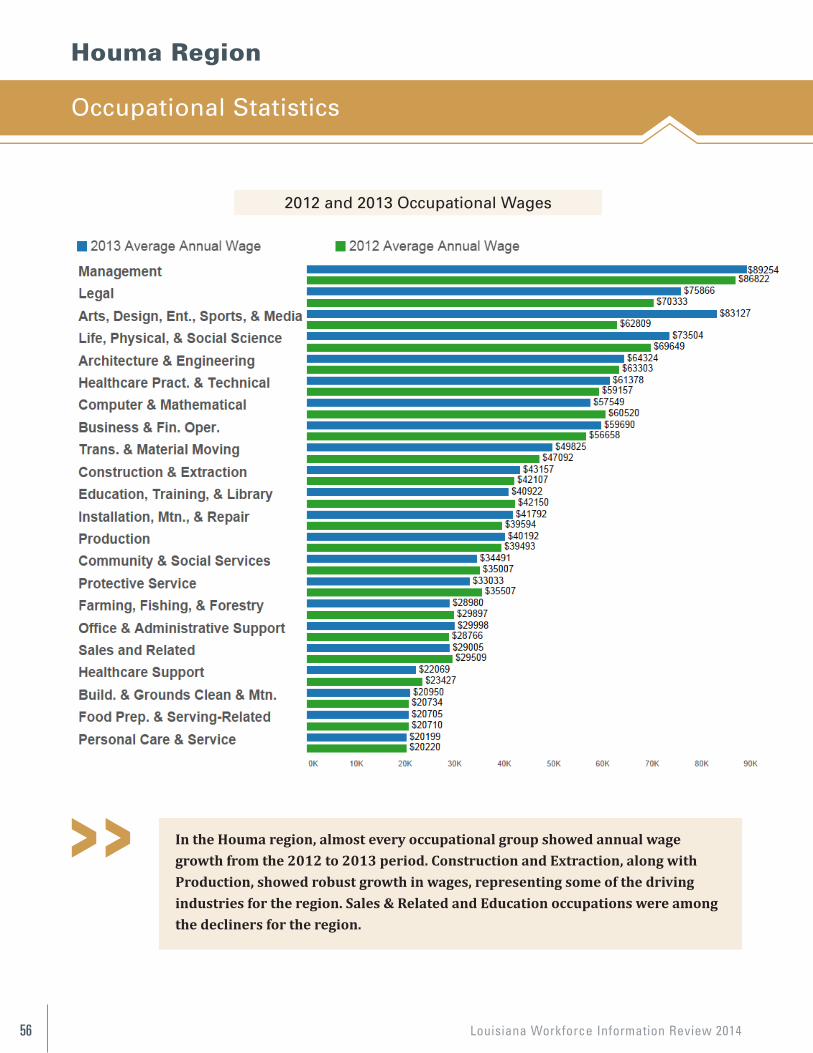
Louisiana Workforce Information Review 201456
Houma Region
Occupational Statistics
59
Houma Region
OCCUPATIONAL STATISTICS 2012 and 2013 Occupational Annual Wages
In the Houma region, almost every occupational group showed annual wage growth from the 2012 to 2013 period. Construction and Extraction, along with Production, showed robust growth in wages, as they represent some of the driving industries for the region. Sales & Related and Education occupations were among the decliners for the region.
In the Houma region, almost every occupational group showed annual wagegrowth from the 2012 to 2013 period. Construction and Extraction, along withProduction, showed robust growth in wages, representing some of the drivingindustries for the region. Sales & Related and Education occupations were amongthe decliners for the region.
2012 and 2013 Occupational Wages
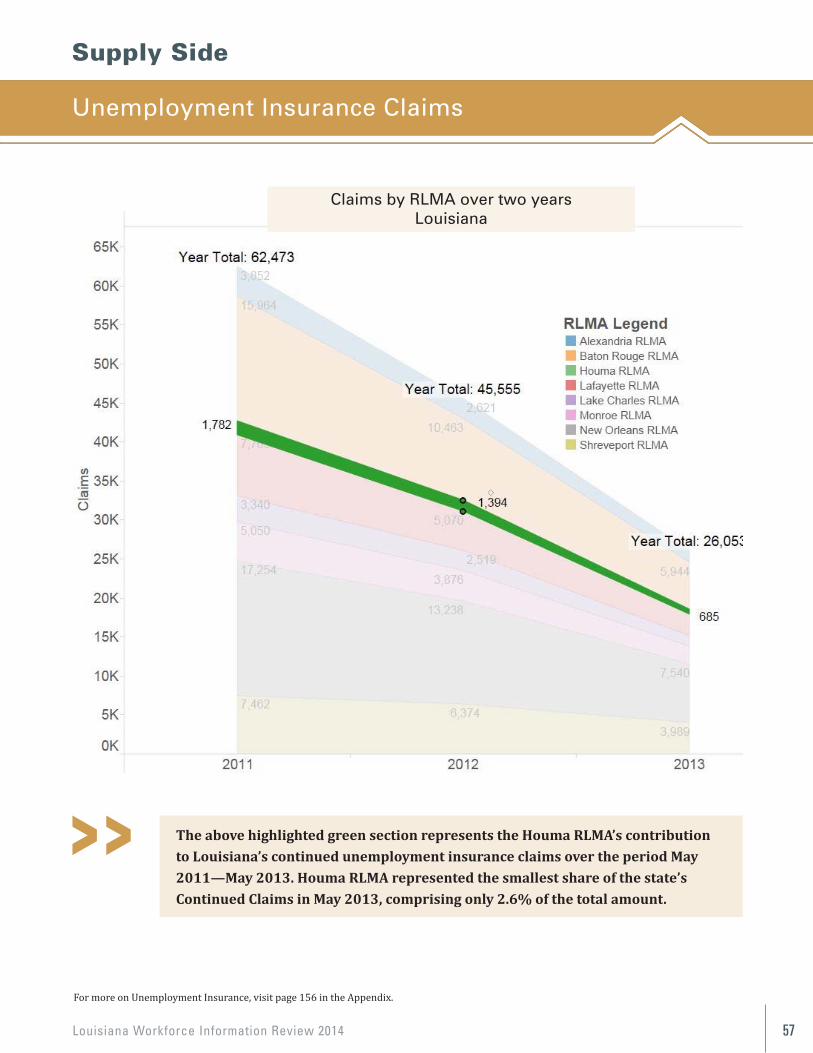
Louisiana Workforce Information Review 2014 57
Occupational Wages And Projections (2022)
Supply Side
Unemployment Insurance Claims
60
Supply Side
UNEMPLOYMENT INSURANCE CLAIMS
The above highlighted green section represents the Houma RLMA’s contribution to Louisiana’s continued unemployment insurance claims over the period May 2011—May 2013. Houma RLMA represented the smallest share of the state’s Continued Claims in May 2013, comprising only 2.6% of the state’s claims.
For more on Unemployment Insurance, visit page 135 in the Appendix
The above highlighted green section represents the Houma RLMA’s contributionto Louisiana’s continued unemployment insurance claims over the period May 2011—May 2013. Houma RLMA represented the smallest share of the state’s Continued Claims in May 2013, comprising only 2.6% of the total amount.
Claims by RLMA over two yearsLouisiana
For more on Unemployment Insurance, visit page 156 in the Appendix.
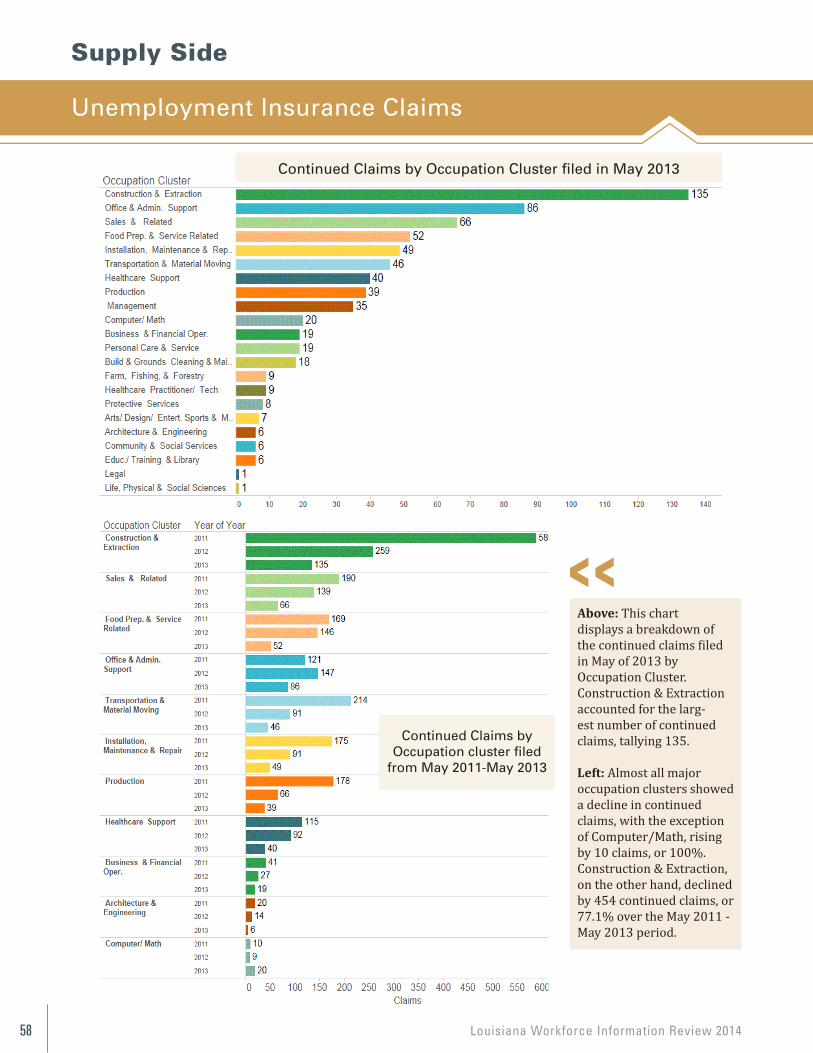
Louisiana Workforce Information Review 201458
Supply Side
Unemployment Insurance Claims
Above: This chartdisplays a breakdown ofthe continued claims filedin May of 2013 by Occupation Cluster. Construction & Extraction accounted for the larg-est number of continued claims, tallying 135.
Left: Almost all major occupation clusters showed a decline in continued claims, with the exception of Computer/Math, rising by 10 claims, or 100%.Construction & Extraction, on the other hand, declined by 454 continued claims, or77.1% over the May 2011 - May 2013 period.
61
Above: This chart displays a break down of the continued claims filed in May of 2013 by Occupation Cluster. Construction & Extraction accounted for the largest number of continued claims, tallying 135. Left: Almost all major occupation clusters showed a decline in continued claims, with the exception of Computer/Math, rising by 10 claims, or 100%. Construction & Extraction, on the other hand, declined by 454 continued claims, or 77.1% over the May 2011—May 2013 period.
Continued Claims by Occupation Cluster filed in May 2013
Continued Claims by Occupation cluster
filed from May 2011—May 2013
Continued Claims by Occupation Cluster filed in May 2013
Continued Claims byOccupation cluster filed
from May 2011-May 2013
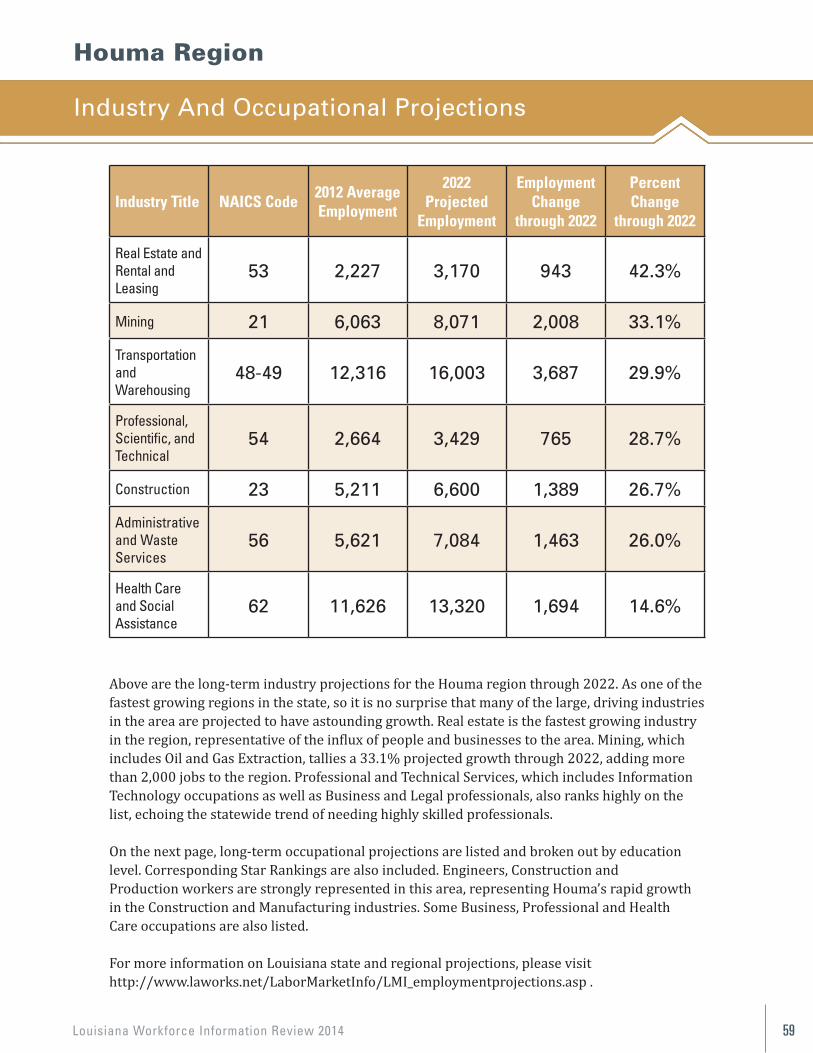
Louisiana Workforce Information Review 2014 59
Occupational Wages And Projections (2022)
Houma Region
Industry And Occupational Projections
Industry Title NAICS Code2012 AverageEmployment
2022 Projected
Employment
EmploymentChange
through 2022
PercentChange
through 2022
Real Estate andRental and Leasing
53 2,227 3,170 943 42.3%
Mining 21 6,063 8,071 2,008 33.1%
Transportationand Warehousing
48-49 12,316 16,003 3,687 29.9%
Professional,Scientific, andTechnical
54 2,664 3,429 765 28.7%
Construction 23 5,211 6,600 1,389 26.7%
Administrative and Waste Services
56 5,621 7,084 1,463 26.0%
Health Care and Social Assistance
62 11,626 13,320 1,694 14.6%
Above are the long-term industry projections for the Houma region through 2022. As one of the fastest growing regions in the state, so it is no surprise that many of the large, driving industries in the area are projected to have astounding growth. Real estate is the fastest growing industry in the region, representative of the influx of people and businesses to the area. Mining, which includes Oil and Gas Extraction, tallies a 33.1% projected growth through 2022, adding more than 2,000 jobs to the region. Professional and Technical Services, which includes Information Technology occupations as well as Business and Legal professionals, also ranks highly on the list, echoing the statewide trend of needing highly skilled professionals.
On the next page, long-term occupational projections are listed and broken out by educationlevel. Corresponding Star Rankings are also included. Engineers, Construction andProduction workers are strongly represented in this area, representing Houma’s rapid growthin the Construction and Manufacturing industries. Some Business, Professional and HealthCare occupations are also listed.
For more information on Louisiana state and regional projections, please visit http://www.laworks.net/LaborMarketInfo/LMI_employmentprojections.asp .
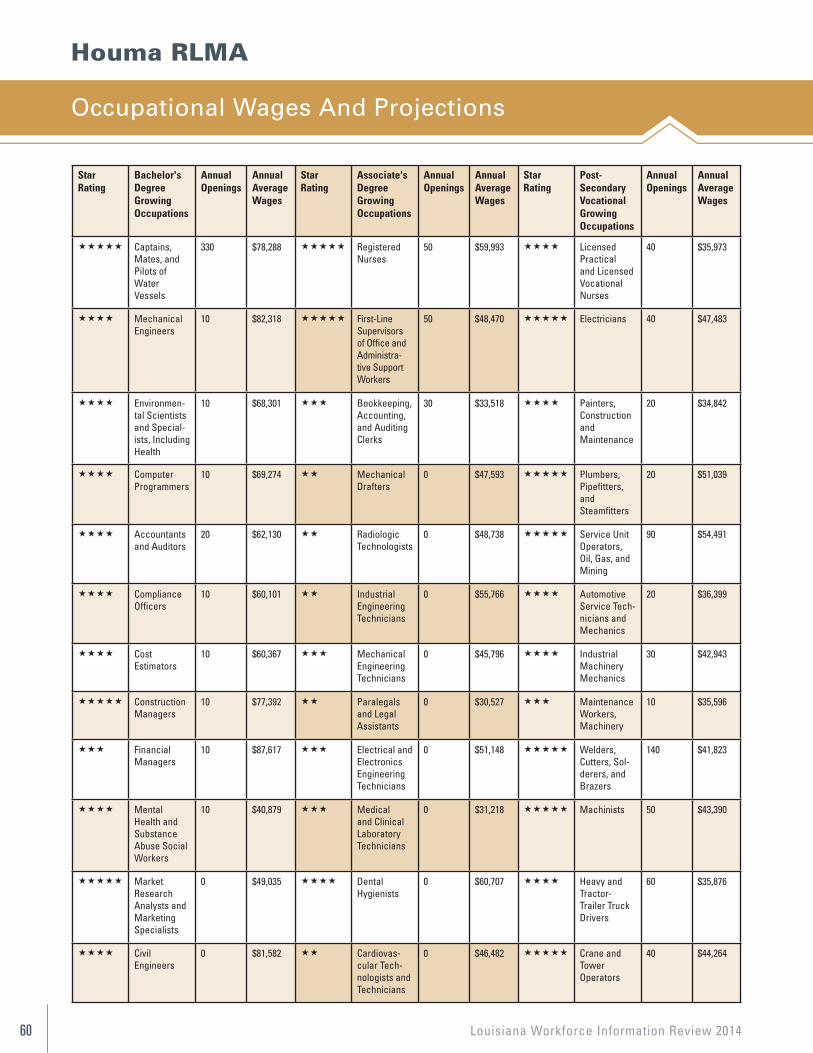
Louisiana Workforce Information Review 201460
StarRating
Bachelor's Degree Growing Occupations
Annual Openings
Annual Average Wages
StarRating
Associate's Degree Growing Occupations
Annual Openings
Annual Average Wages
StarRating
Post-Secondary Vocational Growing Occupations
Annual Openings
Annual Average Wages
Captains, Mates, and Pilots of Water Vessels
330 $78,288 Registered Nurses
50 $59,993 Licensed Practical and Licensed Vocational Nurses
40 $35,973
Mechanical Engineers
10 $82,318 First-Line Supervisors of Office and Administra-tive Support Workers
50 $48,470 Electricians 40 $47,483
Environmen-tal Scientists and Special-ists, Including Health
10 $68,301 Bookkeeping, Accounting, and Auditing Clerks
30 $33,518 Painters, Construction and Maintenance
20 $34,842
Computer Programmers
10 $69,274 Mechanical Drafters
0 $47,593 Plumbers, Pipefitters, and Steamfitters
20 $51,039
Accountants and Auditors
20 $62,130 Radiologic Technologists
0 $48,738 Service Unit Operators, Oil, Gas, and Mining
90 $54,491
Compliance Officers
10 $60,101 Industrial Engineering Technicians
0 $55,766 Automotive Service Tech-nicians and Mechanics
20 $36,399
Cost Estimators
10 $60,367 Mechanical Engineering Technicians
0 $45,796 Industrial Machinery Mechanics
30 $42,943
Construction Managers
10 $77,392 Paralegals and Legal Assistants
0 $30,527 Maintenance Workers, Machinery
10 $35,596
Financial Managers
10 $87,617 Electrical and Electronics Engineering Technicians
0 $51,148 Welders, Cutters, Sol-derers, and Brazers
140 $41,823
Mental Health and Substance Abuse Social Workers
10 $40,879 Medical and Clinical Laboratory Technicians
0 $31,218 Machinists 50 $43,390
Market Research Analysts and Marketing Specialists
0 $49,035 Dental Hygienists
0 $60,707 Heavy and Tractor-Trailer Truck Drivers
60 $35,876
Civil Engineers
0 $81,582 Cardiovas-cular Tech-nologists and Technicians
0 $46,482 Crane and Tower Operators
40 $44,264
Houma RLMA
Occupational Wages And Projections
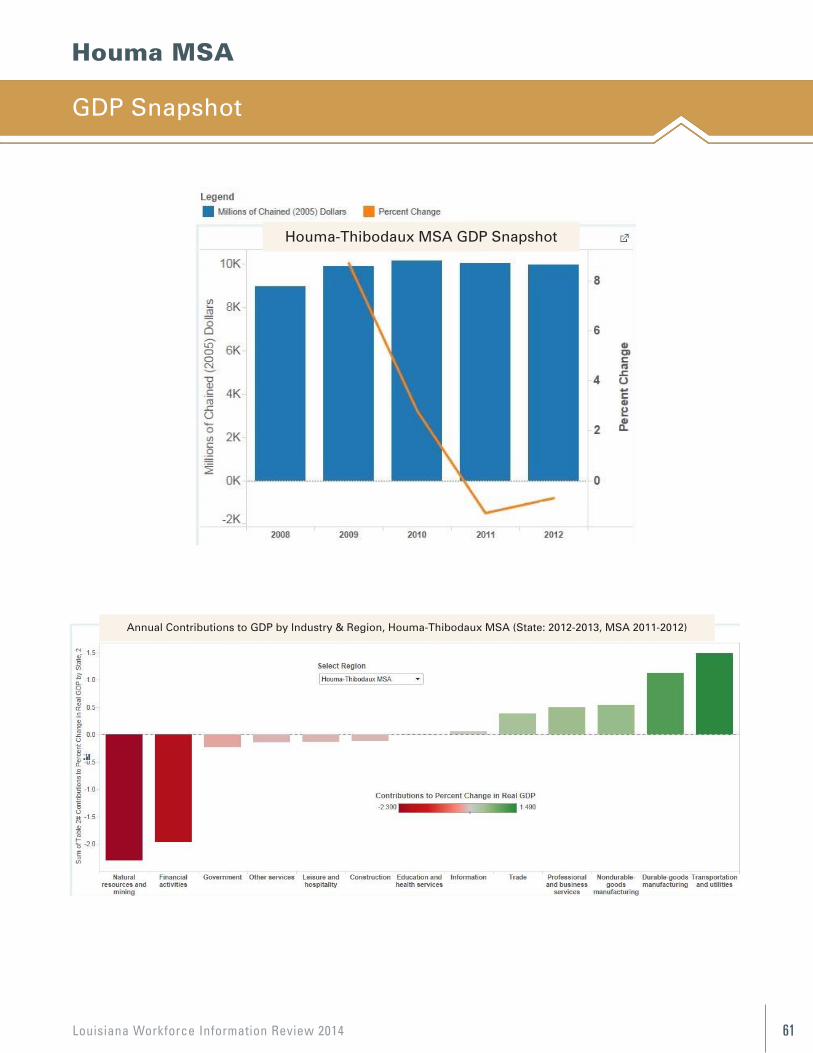
Louisiana Workforce Information Review 2014 61
Occupational Wages And Projections (2022)
Houma MSA
GDP Snapshot
64
Volume 1, Issue 1 Newsletter Date
Houma MSA
64
Volume 1, Issue 1 Newsletter Date
Houma MSA
Houma-Thibodaux MSA GDP Snapshot
Annual Contributions to GDP by Industry & Region, Houma-Thibodaux MSA (State: 2012-2013, MSA 2011-2012)
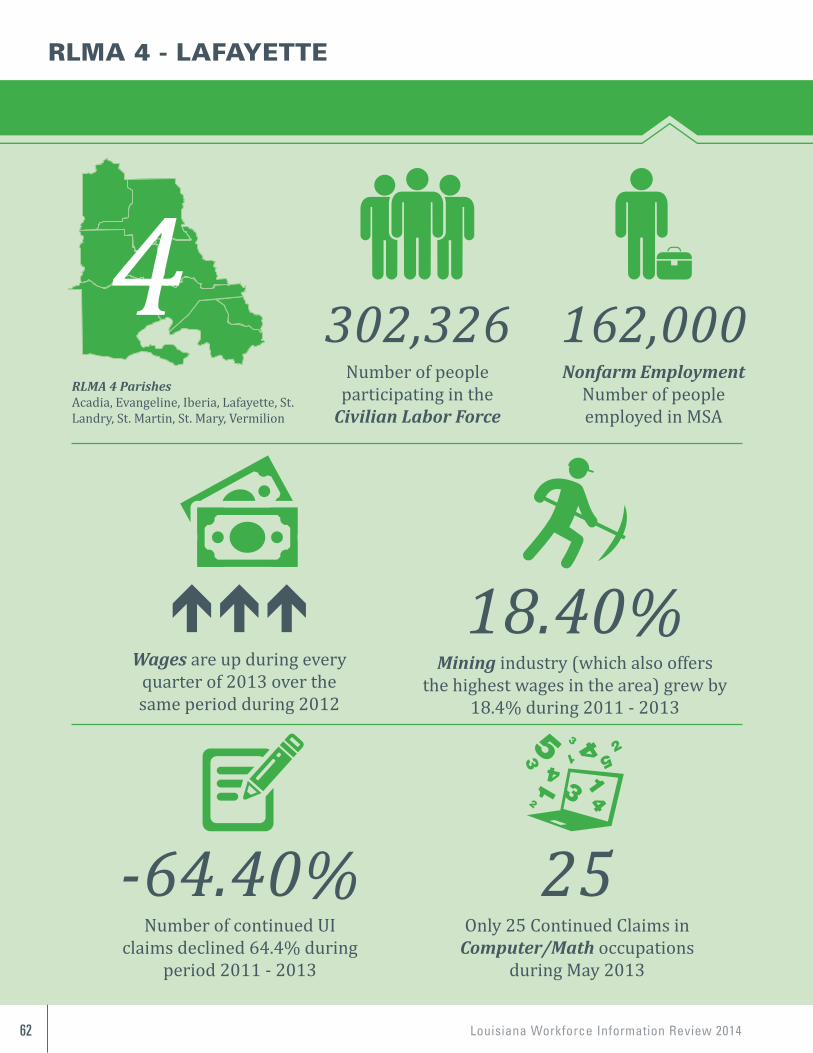
Louisiana Workforce Information Review 201462
RLMA 4 ParishesAcadia, Evangeline, Iberia, Lafayette, St. Landry, St. Martin, St. Mary, Vermilion
Nonfarm EmploymentNumber of peopleemployed in MSA
162,000
Only 25 Continued Claims in Computer/Math occupations
during May 2013
25
RLMA 4 - LAFAYETTE
Wages are up during every quarter of 2013 over the same period during 2012
Number of people participating in the
Civilian Labor Force
302,326
Mining industry (which also offers the highest wages in the area) grew by
18.4% during 2011 - 2013
18.40%
Number of continued UI claims declined 64.4% during
period 2011 - 2013
-64.40%
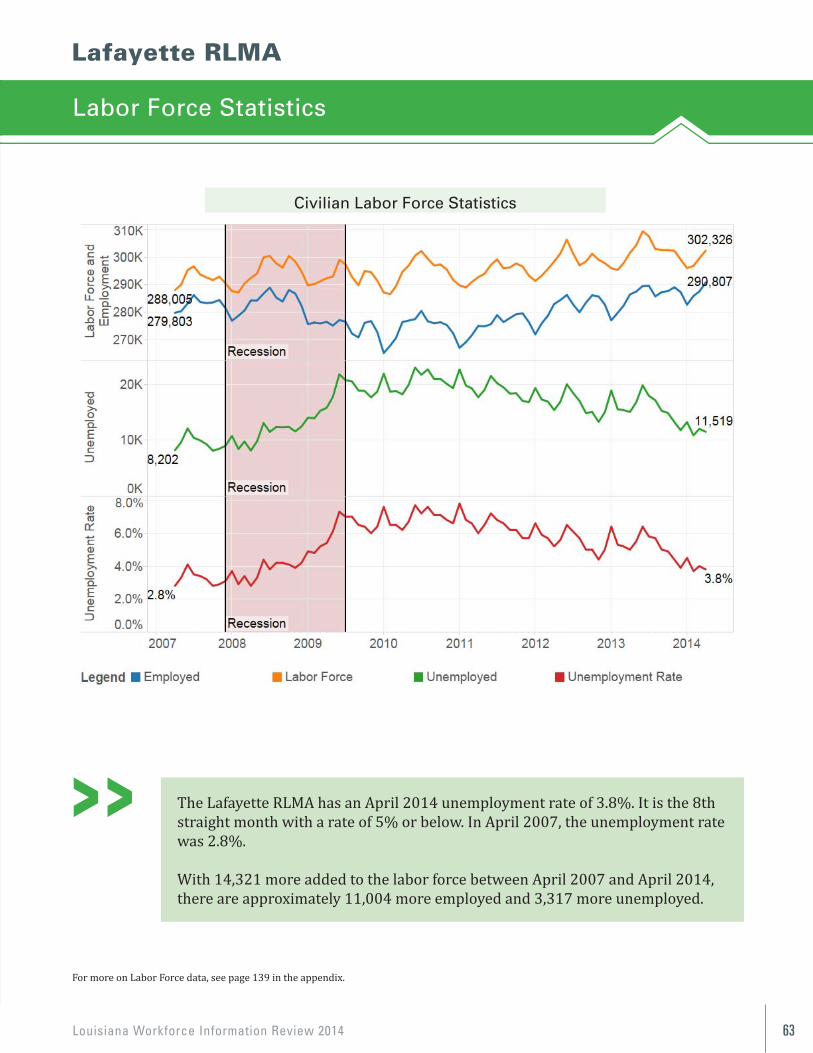
Louisiana Workforce Information Review 2014 63
Lafayette RLMA
66
Lafayette RLMA
LABOR FORCE STATISTICS The Lafayette RLMA has an April 2014 unemployment rate of 3.8%. It is the 8th straight month with a rate of 5% or below. In April 2007, the unemployment rate was 2.8%.
With 14,321 more added to the labor force between April 2007 and April 2014, there are approximately 11,004 more employed and 3,317 more unemployed.
For more on Labor Force data, see page 118 in the appendix.
Civilian Labor Force Statistics
The Lafayette RLMA has an April 2014 unemployment rate of 3.8%. It is the 8th straight month with a rate of 5% or below. In April 2007, the unemployment rate was 2.8%.
With 14,321 more added to the labor force between April 2007 and April 2014, there are approximately 11,004 more employed and 3,317 more unemployed.
For more on Labor Force data, see page 139 in the appendix.
Labor Force Statistics
Civilian Labor Force Statistics
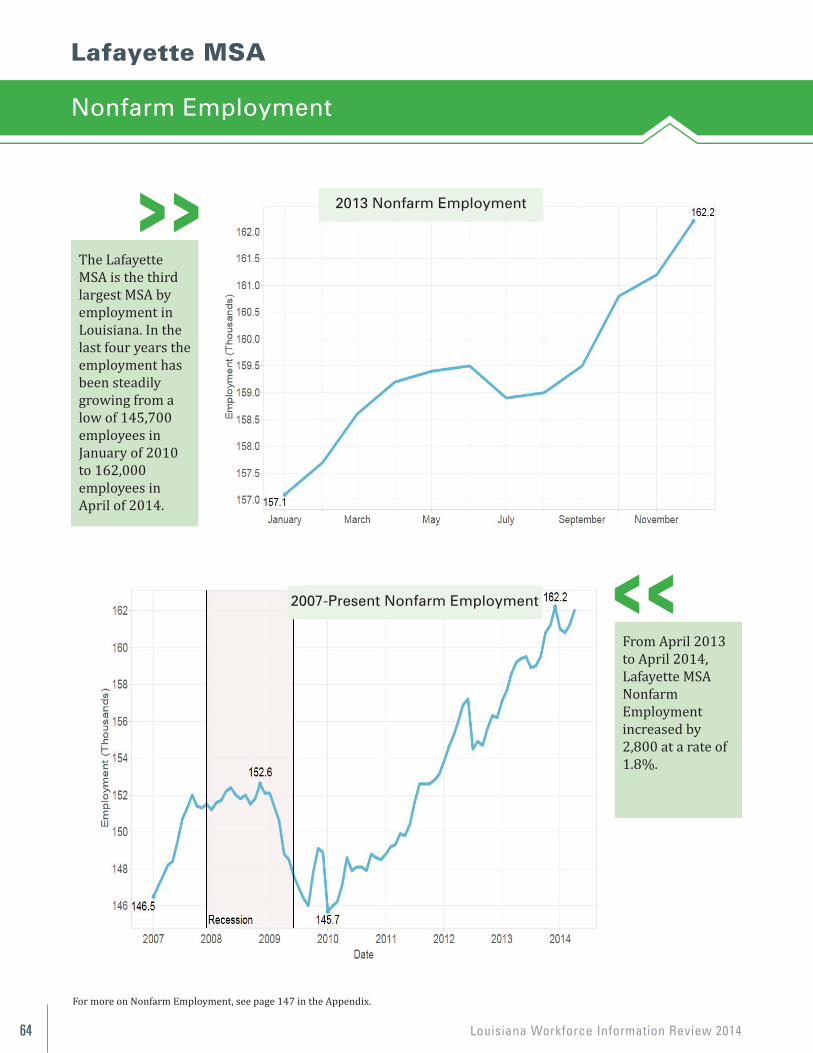
Louisiana Workforce Information Review 201464
Lafayette MSA
Nonfarm Employment
The Lafayette MSA is the third largest MSA byemployment inLouisiana. In thelast four years theemployment hasbeen steadilygrowing from a low of 145,700employees inJanuary of 2010 to 162,000 employees in April of 2014.
67
NONFARM EMPLOYMENT
Lafayette MSA
The Lafayette MSA is the third largest MSA by employment in Louisiana. In the last 4 years the employment has been steadily growing from a low of 145,700 employees in January of 2010 to 162,000 employees in April of 2014.
From April 2013 to April 2014, Lafayette MSA NonfarmEmploymentincreased by 2,800 at a rate of 1.8%.
For more on Nonfarm Employment, see page 126 in the Appendix.
2013 Nonfarm Employment
2007—Present Nonfarm Employment
From April 2013 to April 2014, Lafayette MSANonfarm Employment increased by 2,800 at a rate of 1.8%.
For more on Nonfarm Employment, see page 147 in the Appendix.
2013 Nonfarm Employment
2007-Present Nonfarm Employment
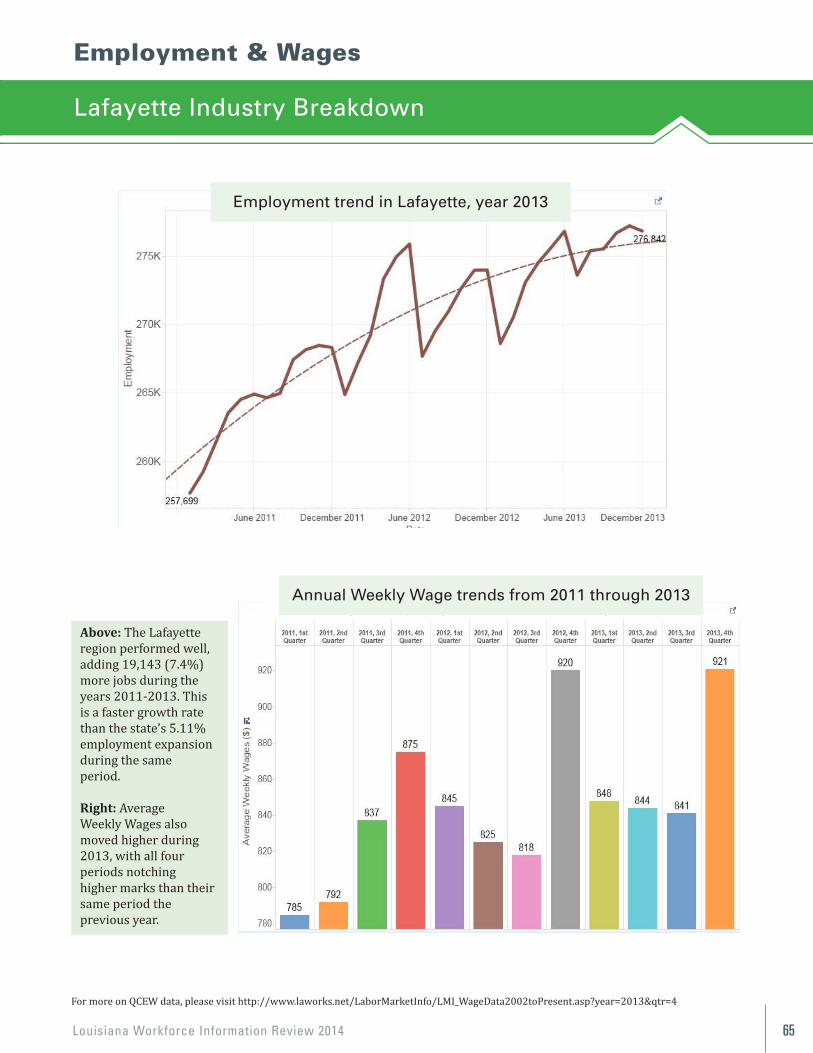
Louisiana Workforce Information Review 2014 65
Occupational Wages And Projections (2022)
Employment & Wages
Lafayette Industry Breakdown
For more on QCEW data, please visit http://www.laworks.net/LaborMarketInfo/LMI_WageData2002toPresent.asp?year=2013&qtr=4
Above: The Lafayette region performed well,adding 19,143 (7.4%)more jobs during theyears 2011-2013. Thisis a faster growth ratethan the state’s 5.11%employment expansionduring the sameperiod.
Right: AverageWeekly Wages alsomoved higher during2013, with all fourperiods notchinghigher marks than theirsame period theprevious year.
68
LAFAYETTE INDUSTRY BREAKDOWN QCEW
Above: The Lafayette region performed well, adding 19,143 (7.4%) more jobs during the years 2011-2013. This is a faster growth rate than the state’s 5.11% employment expansion during the same period. Right: Average Weekly Wages also moved higher during 2013, with all four periods notching higher marks than their same period the previous year.
For more on QCEW data, please visit http://www.laworks.net/LaborMarketInfo/LMI_WageData2002toPresent.asp?year=2013&qtr=4
Employment Trend in Lafayette, year 2013
Average Weekly Wage trends from 2011 through 2013
Employment trend in Lafayette, year 2013
Annual Weekly Wage trends from 2011 through 2013
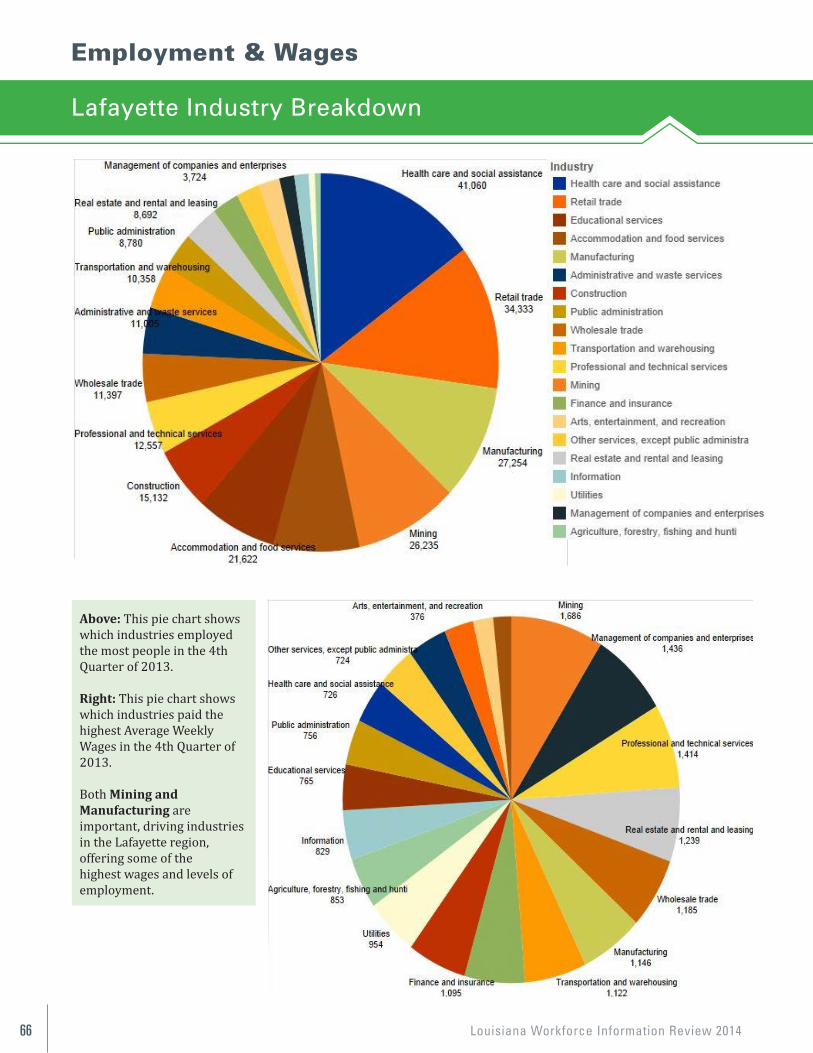
Louisiana Workforce Information Review 201466
69
Above: This Pie Chart shows which industries employed the most people in the 4th Quarter of 2013. Right: This Pie Chart shows which industries paid the highest Average Weekly Wages in the 4th Quarter of 2013 Both Mining and Manufacturing are important, driving industries in the Lafayette region, offering some of the highest wages and levels of employment. 69
Above: This Pie Chart shows which industries employed the most people in the 4th Quarter of 2013. Right: This Pie Chart shows which industries paid the highest Average Weekly Wages in the 4th Quarter of 2013 Both Mining and Manufacturing are important, driving industries in the Lafayette region, offering some of the highest wages and levels of employment.
Above: This pie chart shows which industries employed the most people in the 4thQuarter of 2013.
Right: This pie chart shows which industries paid thehighest Average Weekly Wages in the 4th Quarter of2013.
Both Mining and Manufacturing are important, driving industries in the Lafayette region, offering some of the highest wages and levels of employment.
Employment & Wages
Lafayette Industry Breakdown
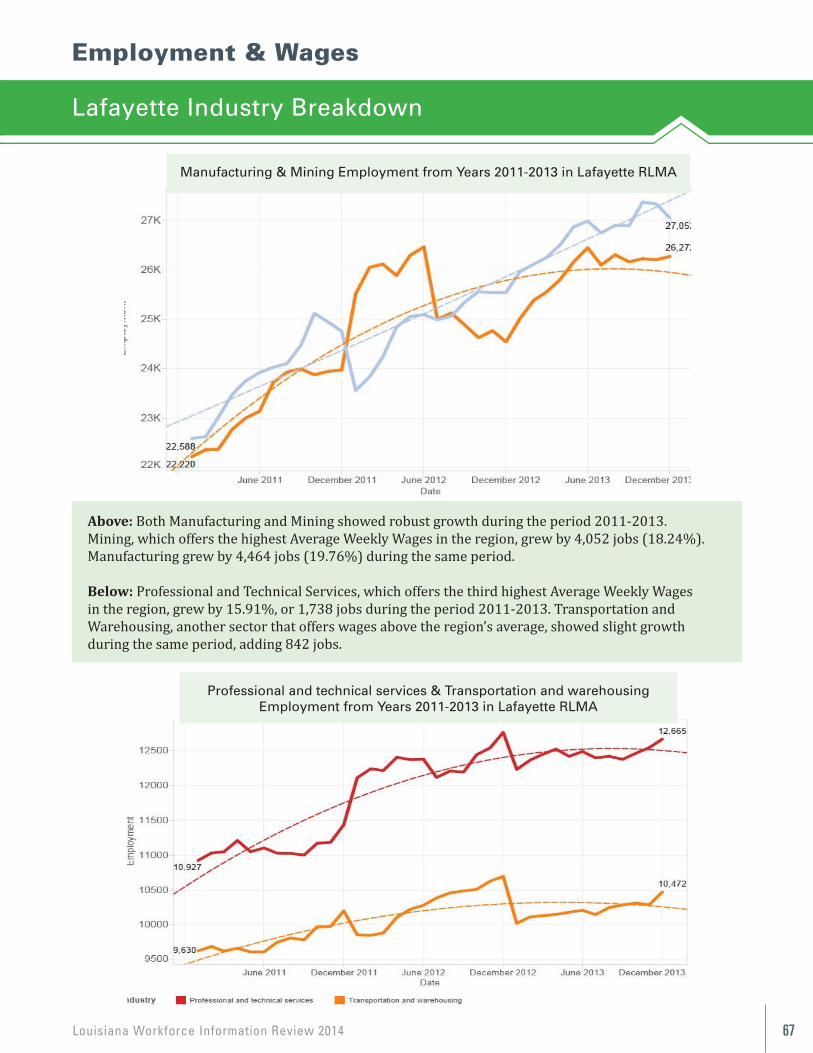
Louisiana Workforce Information Review 2014 67
Employment & Wages
Above: Both Manufacturing and Mining showed robust growth during the period 2011-2013. Mining, which offers the highest Average Weekly Wages in the region, grew by 4,052 jobs (18.24%). Manufacturing grew by 4,464 jobs (19.76%) during the same period.
Below: Professional and Technical Services, which offers the third highest Average Weekly Wages in the region, grew by 15.91%, or 1,738 jobs during the period 2011-2013. Transportation and Warehousing, another sector that offers wages above the region’s average, showed slight growth during the same period, adding 842 jobs.
70
Above: Both Manufacturing and Mining showed robust growth during the period 2011-2013. Mining, which offers the highest Average Weekly Wages in the region, grew by 4,052 jobs, or 18.24%. Manufacturing grew by 4,464 jobs, or 19.76%, during the same period. Below: Professional and Technical Services, which offers the third highest Average Weekly Wages in the region, grew by 15.91%, or 1,738 jobs during the period 2011-2013. Transportation and Warehousing, another sector that offers wages above the region’s average, showed slight growth during the same period, adding 842 jobs.
Lafayette Industry Breakdown
Manufacturing & Mining Employment from Years 2011-2013 in Lafayette RLMA
Professional and technical services & Transportation and warehousingEmployment from Years 2011-2013 in Lafayette RLMA
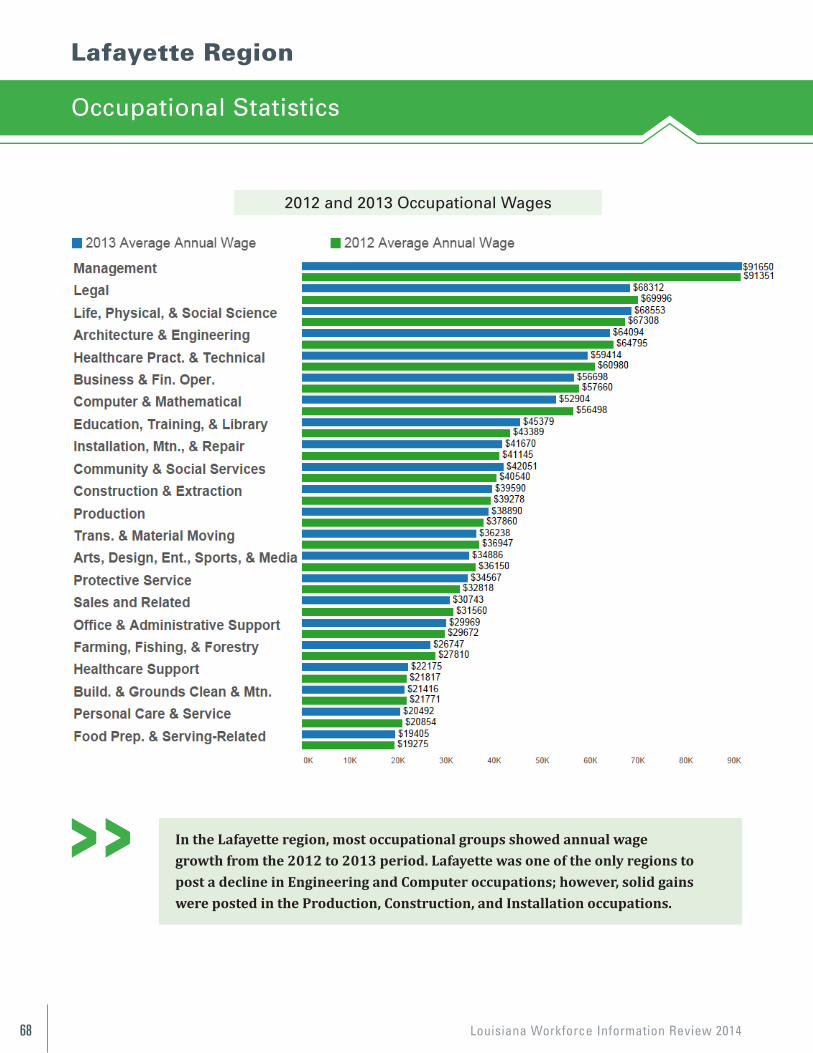
Louisiana Workforce Information Review 201468
Lafayette Region
Occupational Statistics
71
Lafayette Region
OCCUPATIONAL STATISTICS 2012 and 2013 Occupational Annual Wages
In the Lafayette region, most occupational groups showed annual wage growth from the 2012 to 2013 period. Lafayette was one of the only regions to post a decline in Engineering and Computer occupations; however, solid gains were posted in the Production, Construction, and Installation occupations.
In the Lafayette region, most occupational groups showed annual wagegrowth from the 2012 to 2013 period. Lafayette was one of the only regions topost a decline in Engineering and Computer occupations; however, solid gainswere posted in the Production, Construction, and Installation occupations.
2012 and 2013 Occupational Wages
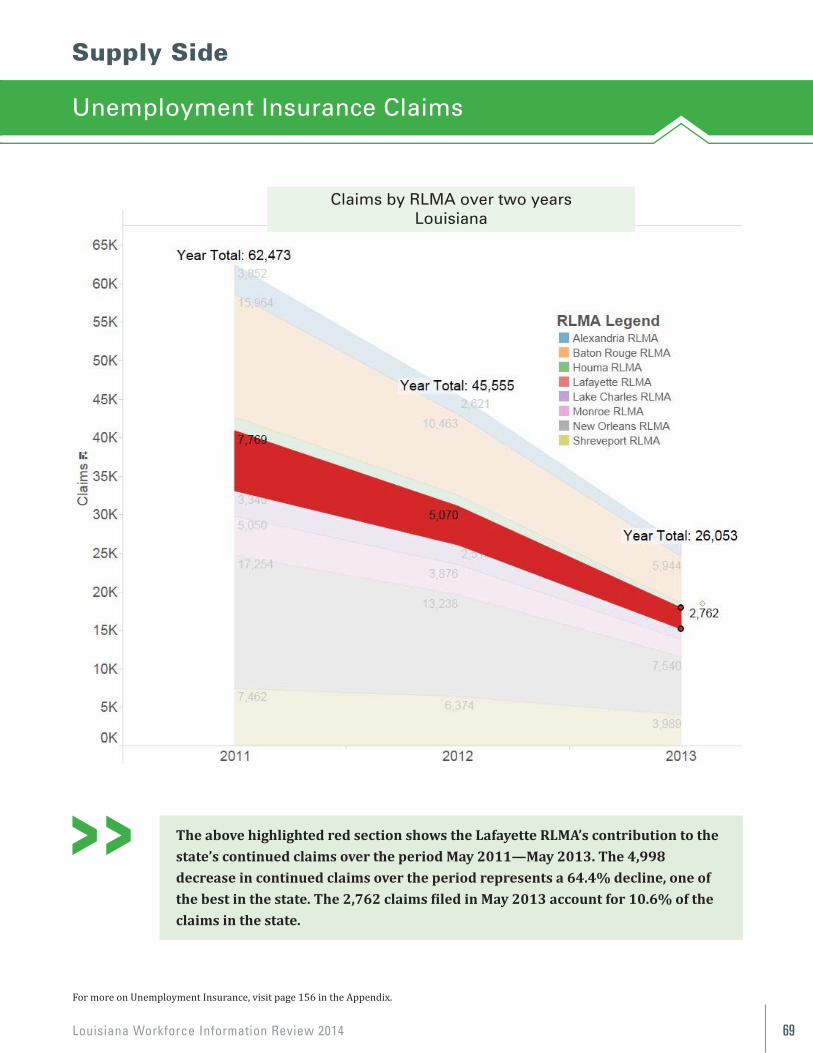
Louisiana Workforce Information Review 2014 69
Supply Side
Unemployment Insurance Claims
72
Supply Side
UNEMPLOYMENT INSURANCE CLAIMS
The above highlighted red section shows the Lafayette RLMA’s contribution to the state’s continued claims over the period May 2011—May 2013. The 4,998 decrease in continued claims over the period represents a 64.4% decline, one of the best in the state. The 2,762 claims filed in May 2013 account for 10.6% of the claims in the state.
For more on Unemployment Insurance, visit page 135 in the Appendix
The above highlighted red section shows the Lafayette RLMA’s contribution to thestate’s continued claims over the period May 2011—May 2013. The 4,998 decrease in continued claims over the period represents a 64.4% decline, one of the best in the state. The 2,762 claims filed in May 2013 account for 10.6% of the claims in the state.
Claims by RLMA over two yearsLouisiana
For more on Unemployment Insurance, visit page 156 in the Appendix.
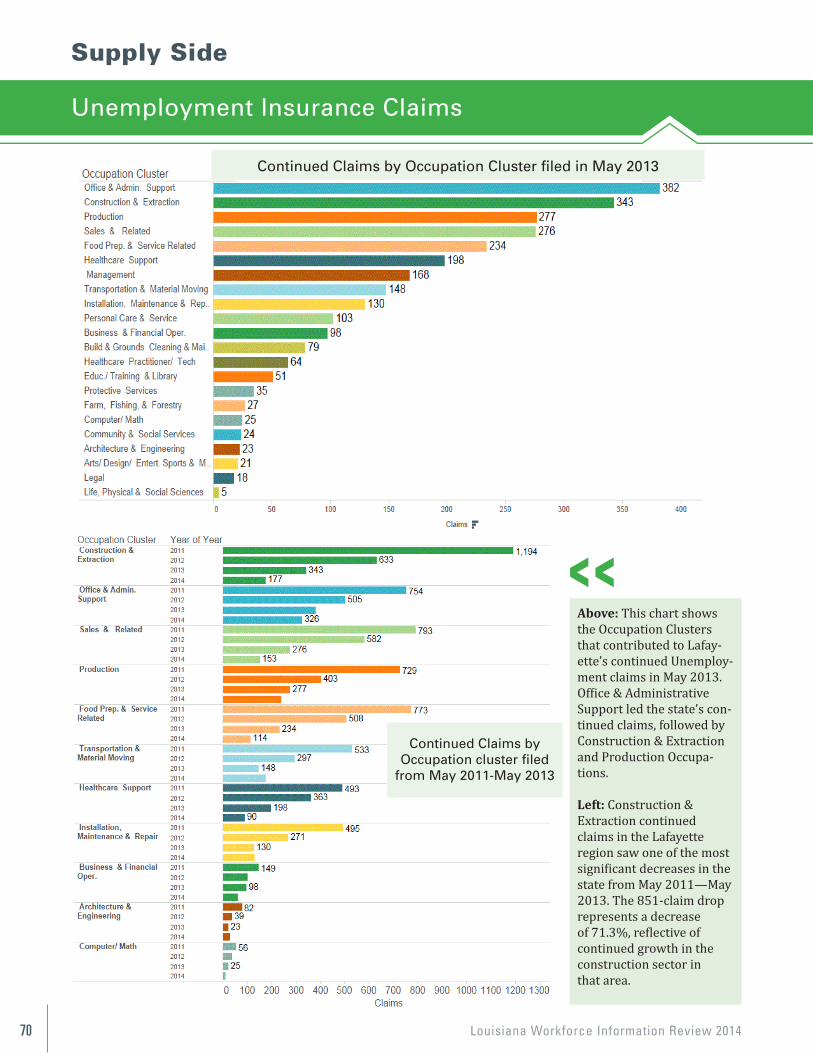
Louisiana Workforce Information Review 201470
Supply Side
Unemployment Insurance Claims
Above: This chart shows the Occupation Clusters that contributed to Lafay-ette’s continued Unemploy-ment claims in May 2013. Office & Administrative Support led the state’s con-tinued claims, followed byConstruction & Extraction and Production Occupa-tions.
Left: Construction &Extraction continued claims in the Lafayette region saw one of the most significant decreases in the state from May 2011—May2013. The 851-claim drop represents a decrease of 71.3%, reflective of continued growth in the construction sector inthat area.
73
Above: This chart shows the Occupation Clusters that contributed to Lafayette’s continued Unemployment claims in May 2013. Office & Administrative Support led the state’s continued claims, followed by Construction & Extraction and Production Occupations. Left: Construction & Extraction continued claims in the Lafayette region saw one of the most significant decreases in the state from May 2011—May 2013. The 851 claim drop represents a decrease of 71.3%, reflective of continued growth in the construction sector in that area.
Continued Claims by Occupation Cluster filed in May 2013
Continued Claims by Occupation cluster
filed from May 2011—May 2013
Continued Claims by Occupation Cluster filed in May 2013
Continued Claims byOccupation cluster filed
from May 2011-May 2013
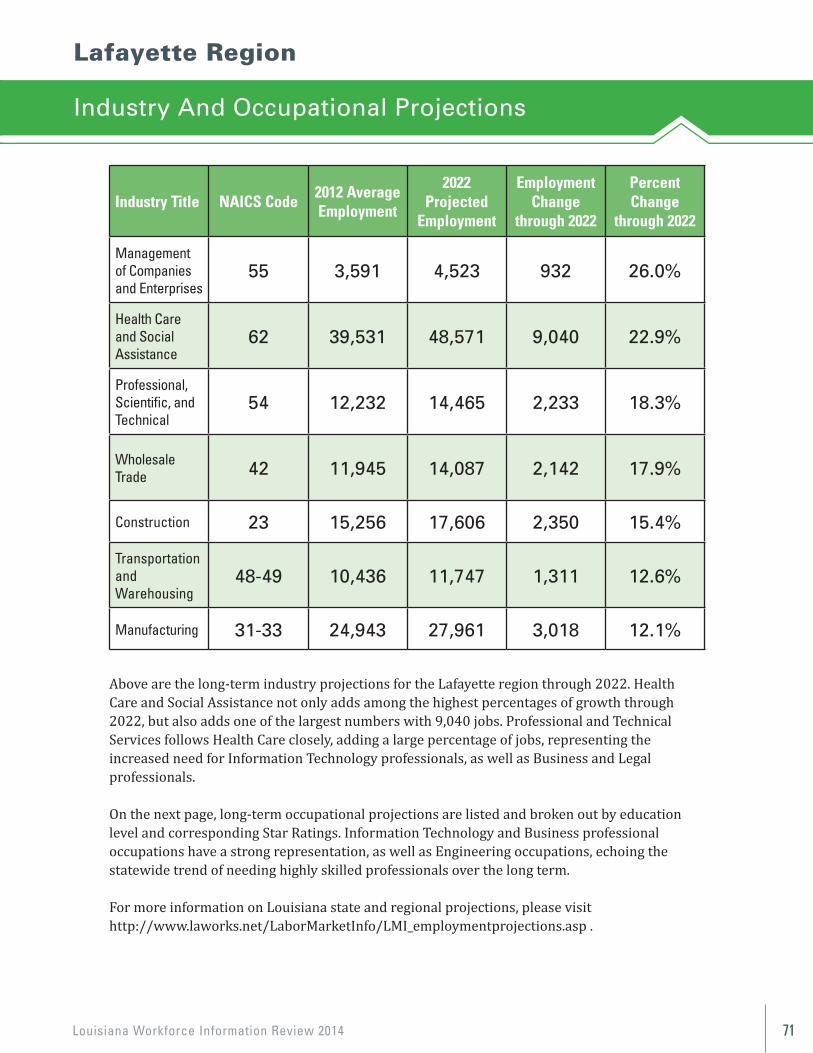
Louisiana Workforce Information Review 2014 71
Lafayette Region
Industry And Occupational Projections
Industry Title NAICS Code2012 AverageEmployment
2022 Projected
Employment
EmploymentChange
through 2022
PercentChange
through 2022
Management of Companies and Enterprises
55 3,591 4,523 932 26.0%
Health Care and Social Assistance
62 39,531 48,571 9,040 22.9%
Professional,Scientific, andTechnical
54 12,232 14,465 2,233 18.3%
Wholesale Trade 42 11,945 14,087 2,142 17.9%
Construction 23 15,256 17,606 2,350 15.4%
Transportationand Warehousing
48-49 10,436 11,747 1,311 12.6%
Manufacturing 31-33 24,943 27,961 3,018 12.1%
Above are the long-term industry projections for the Lafayette region through 2022. HealthCare and Social Assistance not only adds among the highest percentages of growth through2022, but also adds one of the largest numbers with 9,040 jobs. Professional and TechnicalServices follows Health Care closely, adding a large percentage of jobs, representing theincreased need for Information Technology professionals, as well as Business and Legalprofessionals.
On the next page, long-term occupational projections are listed and broken out by educationlevel and corresponding Star Ratings. Information Technology and Business professional occupations have a strong representation, as well as Engineering occupations, echoing the statewide trend of needing highly skilled professionals over the long term.
For more information on Louisiana state and regional projections, please visit http://www.laworks.net/LaborMarketInfo/LMI_employmentprojections.asp .
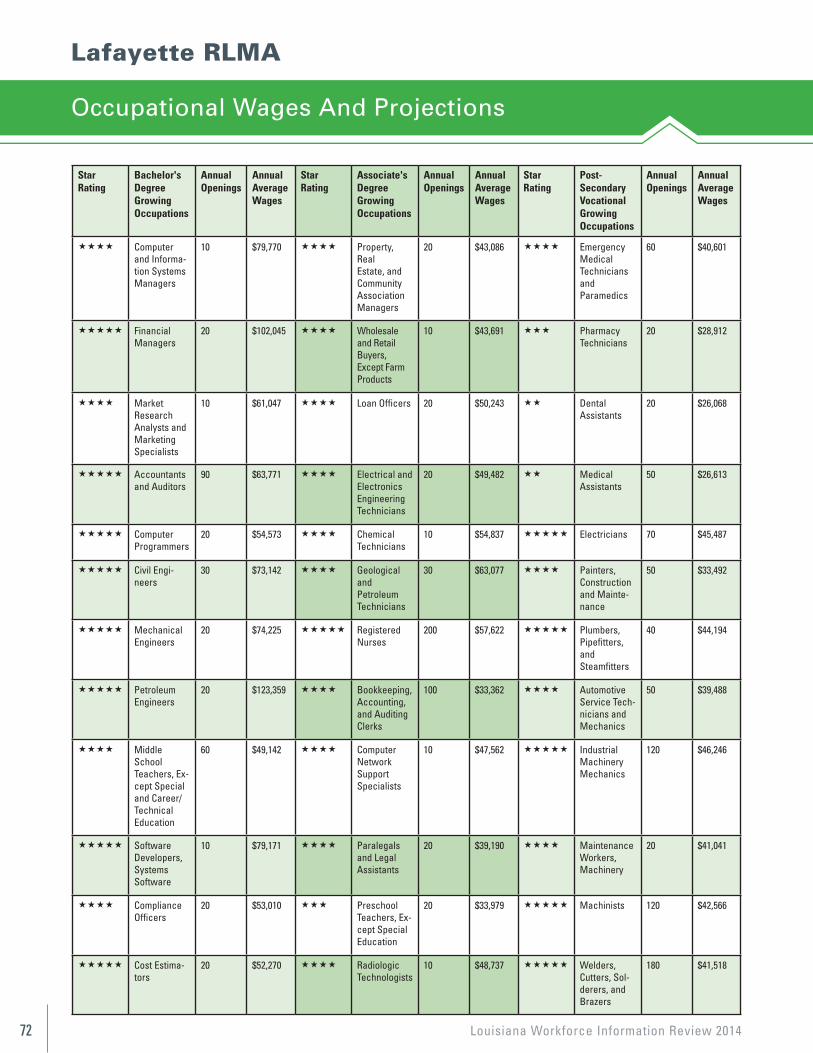
Louisiana Workforce Information Review 201472
StarRating
Bachelor's Degree Growing Occupations
Annual Openings
Annual Average Wages
StarRating
Associate's Degree Growing Occupations
Annual Openings
Annual Average Wages
StarRating
Post-Secondary Vocational Growing Occupations
Annual Openings
Annual Average Wages
Computer and Informa-tion Systems Managers
10 $79,770 Property, Real Estate, and Community Association Managers
20 $43,086 Emergency Medical Technicians and Paramedics
60 $40,601
Financial Managers
20 $102,045 Wholesale and Retail Buyers, Except Farm Products
10 $43,691 Pharmacy Technicians
20 $28,912
Market Research Analysts and Marketing Specialists
10 $61,047 Loan Officers 20 $50,243 Dental Assistants
20 $26,068
Accountants and Auditors
90 $63,771 Electrical and Electronics Engineering Technicians
20 $49,482 Medical Assistants
50 $26,613
Computer Programmers
20 $54,573 Chemical Technicians
10 $54,837 Electricians 70 $45,487
Civil Engi-neers
30 $73,142 Geological and Petroleum Technicians
30 $63,077 Painters, Construction and Mainte-nance
50 $33,492
Mechanical Engineers
20 $74,225 Registered Nurses
200 $57,622 Plumbers, Pipefitters, and Steamfitters
40 $44,194
Petroleum Engineers
20 $123,359 Bookkeeping, Accounting, and Auditing Clerks
100 $33,362 Automotive Service Tech-nicians and Mechanics
50 $39,488
Middle School Teachers, Ex-cept Special and Career/Technical Education
60 $49,142 Computer Network Support Specialists
10 $47,562 Industrial Machinery Mechanics
120 $46,246
Software Developers, Systems Software
10 $79,171 Paralegals and Legal Assistants
20 $39,190 Maintenance Workers, Machinery
20 $41,041
Compliance Officers
20 $53,010 Preschool Teachers, Ex-cept Special Education
20 $33,979 Machinists 120 $42,566
Cost Estima-tors
20 $52,270 Radiologic Technologists
10 $48,737 Welders, Cutters, Sol-derers, and Brazers
180 $41,518
Lafayette RLMA
Occupational Wages And Projections
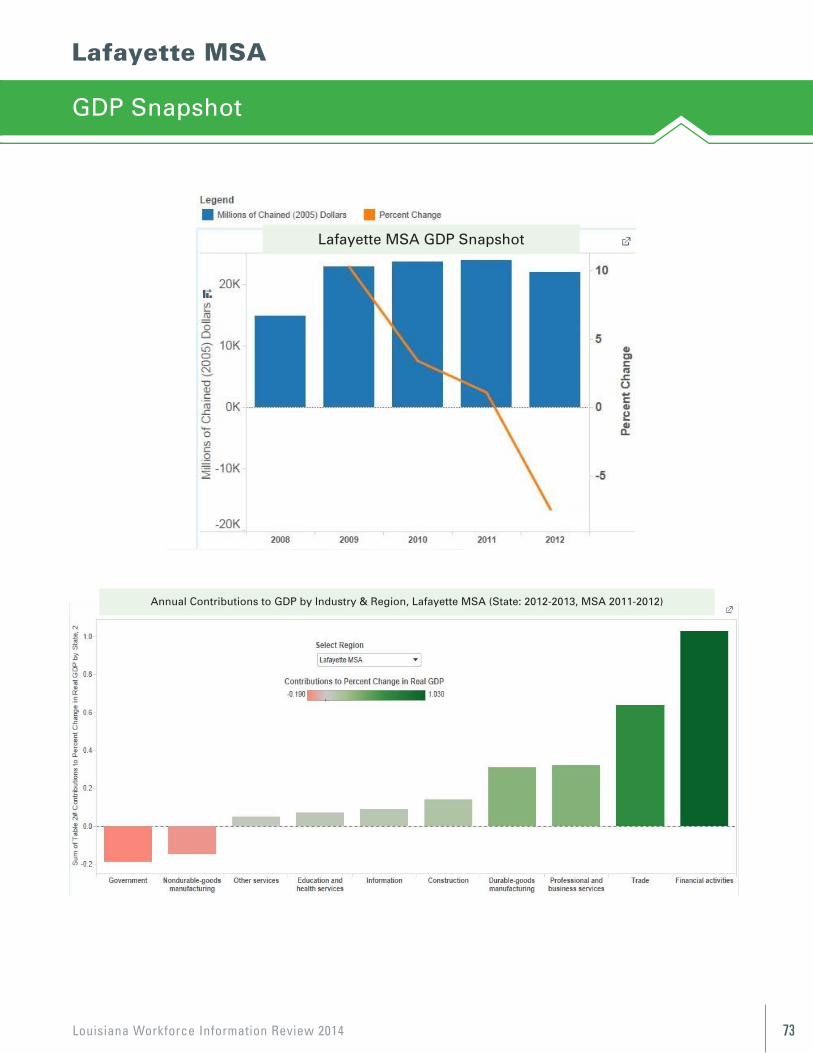
Louisiana Workforce Information Review 2014 73
Lafayette MSA
GDP Snapshot
76
Volume 1, Issue 1 Newsletter Date
Lafayette MSA
76
Volume 1, Issue 1 Newsletter Date
Lafayette MSA Lafayette MSA GDP Snapshot
Annual Contributions to GDP by Industry & Region, Lafayette MSA (State: 2012-2013, MSA 2011-2012)
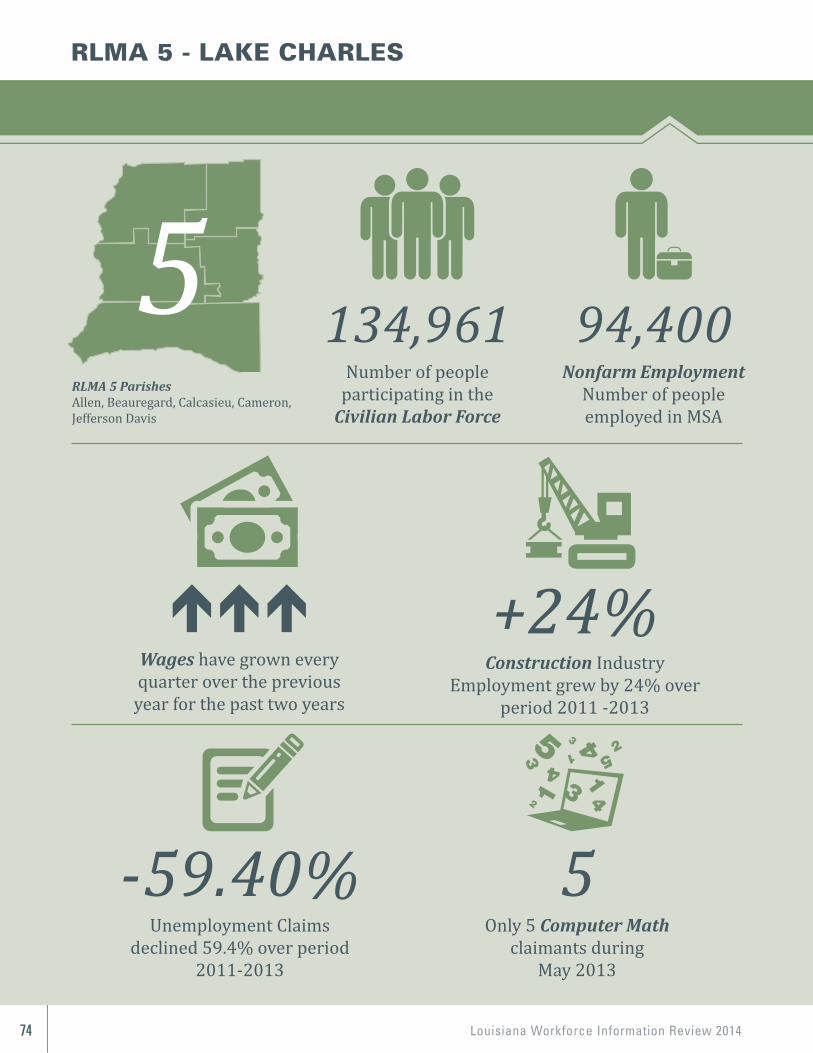
Louisiana Workforce Information Review 201474
RLMA 5 ParishesAllen, Beauregard, Calcasieu, Cameron, Jefferson Davis
Nonfarm EmploymentNumber of peopleemployed in MSA
94,400
Only 5 Computer Mathclaimants during
May 2013
5
Wages have grown every quarter over the previous year for the past two years
Number of people participating in the
Civilian Labor Force
134,961
Construction Industry Employment grew by 24% over
period 2011 -2013
+24%
Unemployment Claims declined 59.4% over period
2011-2013
-59.40%
RLMA 5 - LAKE CHARLES
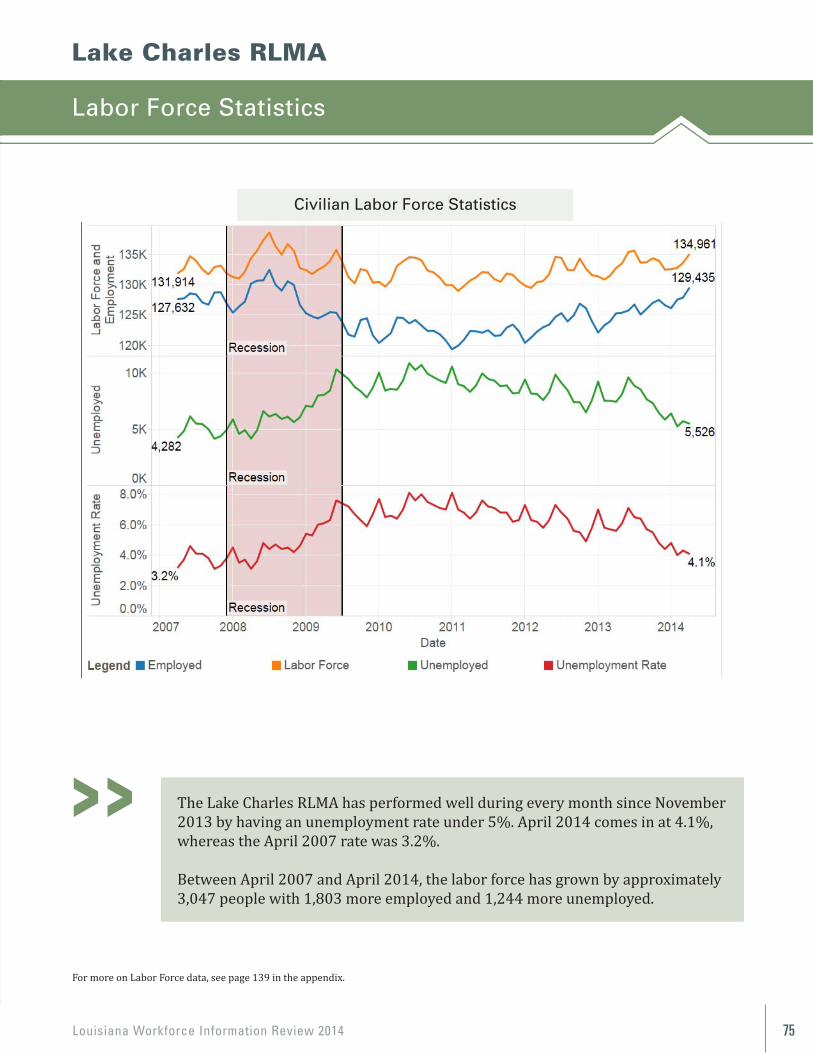
Louisiana Workforce Information Review 2014 75
78
Lake Charles RLMA
LABOR FORCE STATISTICS The Lake Charles RLMA has performed well with every month since November 2013 by having an unemployment rate under 5%. April 2014 comes in at 4.1%, whereas the April 2007 rate was 3.2%.
Between April 2007 and April 2014, the labor force has grown by approximately 3,047 people with 1,803 more employed and 1,244 more unemployed.
For more on Labor Force data, see page 118 in the appendix.
Civilian Labor Force Statistics
The Lake Charles RLMA has performed well during every month since November 2013 by having an unemployment rate under 5%. April 2014 comes in at 4.1%, whereas the April 2007 rate was 3.2%.
Between April 2007 and April 2014, the labor force has grown by approximately 3,047 people with 1,803 more employed and 1,244 more unemployed.
For more on Labor Force data, see page 139 in the appendix.
Lake Charles RLMA
Labor Force Statistics
Civilian Labor Force Statistics
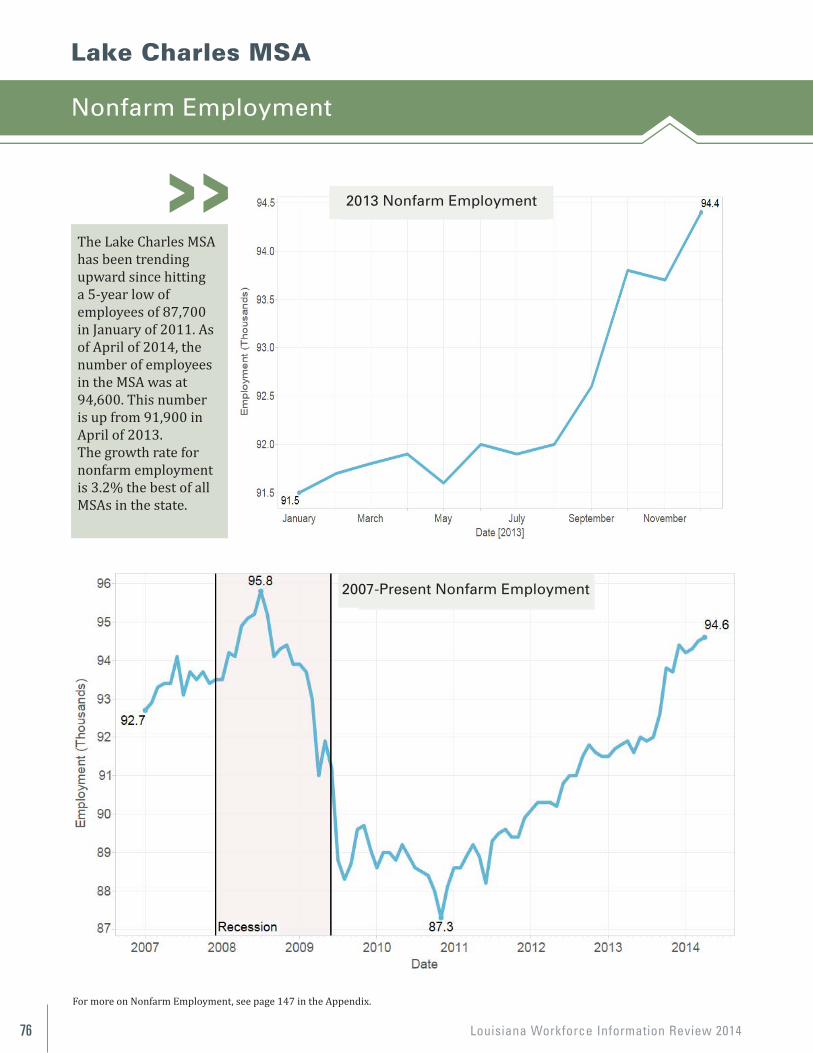
Louisiana Workforce Information Review 201476
Lake Charles MSA
Nonfarm Employment
The Lake Charles MSAhas been trendingupward since hitting a 5-year low of employees of 87,700 in January of 2011. As of April of 2014, the number of employees in the MSA was at 94,600. This number is up from 91,900 in April of 2013.The growth rate fornonfarm employment is 3.2% the best of all MSAs in the state.
79
NONFARM EMPLOYMENT
Lake Charles MSA
The Lake Charles MSA has been trending upward since hitting a 5 year low of employees of 87,700 in January of 2011. As of April of 2014 the number of employees in the MSA was at 94,600. This number is up from 91,900 in April of 2013.
The growth rate for nonfarm employment is 3.2% which is the best out of all the MSA’s in the state.
For more on Nonfarm Employment, see page 126 in the Appendix.
2013 Nonfarm Employment
2007—Present Nonfarm Employment
For more on Nonfarm Employment, see page 147 in the Appendix.
79
NONFARM EMPLOYMENT
Lake Charles MSA
The Lake Charles MSA has been trending upward since hitting a 5 year low of employees of 87,700 in January of 2011. As of April of 2014 the number of employees in the MSA was at 94,600. This number is up from 91,900 in April of 2013.
The growth rate for nonfarm employment is 3.2% which is the best out of all the MSA’s in the state.
For more on Nonfarm Employment, see page 126 in the Appendix.
2013 Nonfarm Employment
2007—Present Nonfarm Employment
2013 Nonfarm Employment
2007-Present Nonfarm Employment
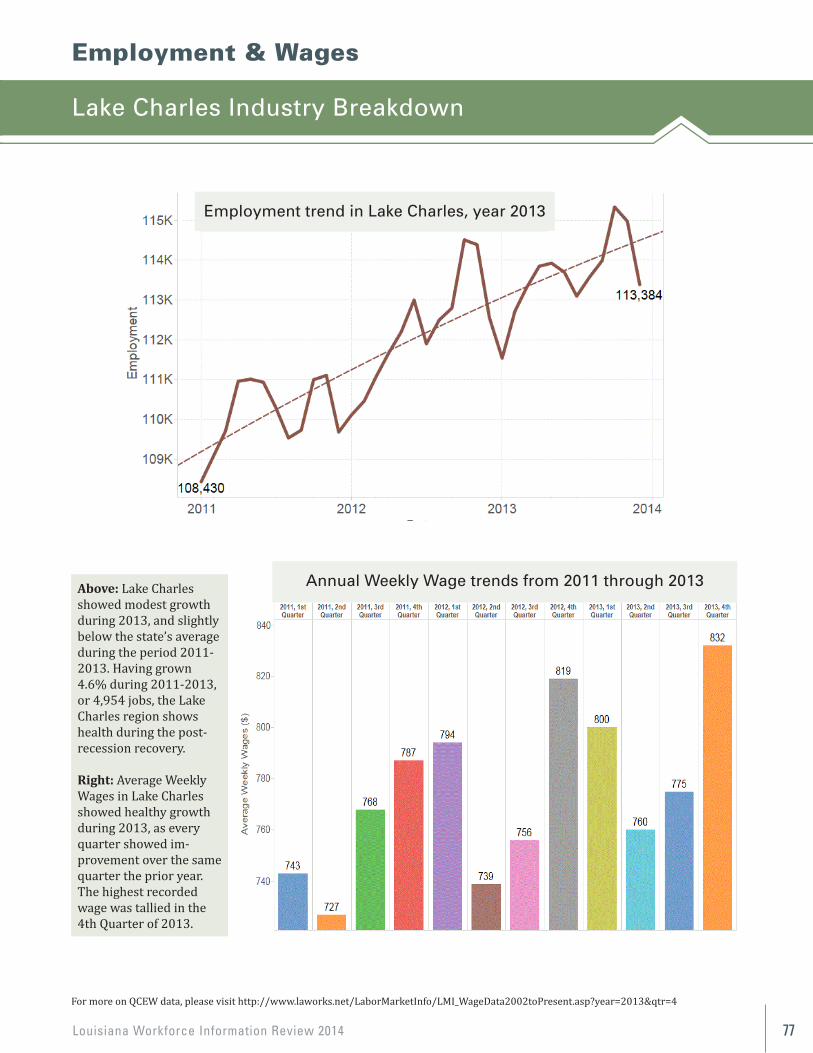
Louisiana Workforce Information Review 2014 77
Employment & Wages
Lake Charles Industry Breakdown
For more on QCEW data, please visit http://www.laworks.net/LaborMarketInfo/LMI_WageData2002toPresent.asp?year=2013&qtr=4
Above: Lake Charles showed modest growth during 2013, and slightly below the state’s average during the period 2011-2013. Having grown 4.6% during 2011-2013, or 4,954 jobs, the Lake Charles region shows health during the post-recession recovery.
Right: Average Weekly Wages in Lake Charles showed healthy growth during 2013, as everyquarter showed im-provement over the same quarter the prior year. The highest recordedwage was tallied in the 4th Quarter of 2013.
80
QCEW
LAKE CHARLES INDUSTRY BREAKDOWN
Above: Lake Charles showed modest growth during 2013, and slightly below the state’s average during the period 2011-2013. Having grown 4.6% during 2011-2013, or 4,954 jobs, the Lake Charles region shows health during the post-recession recovery. Right: Average Weekly Wages in Lake Charles showed healthy growth during 2013, as every quarter showed improvement over the same quarter the prior year. The highest recorded wage was tallied in the 4th Quarter of 2013.
For more on QCEW data, please visit http://www.laworks.net/LaborMarketInfo/LMI_WageData2002toPresent.asp?year=2013&qtr=4
Employment Trend in Lake Charles, year 2013
Average Weekly Wage trends from 2011 through 2013
Employment trend in Lake Charles, year 2013
Annual Weekly Wage trends from 2011 through 2013
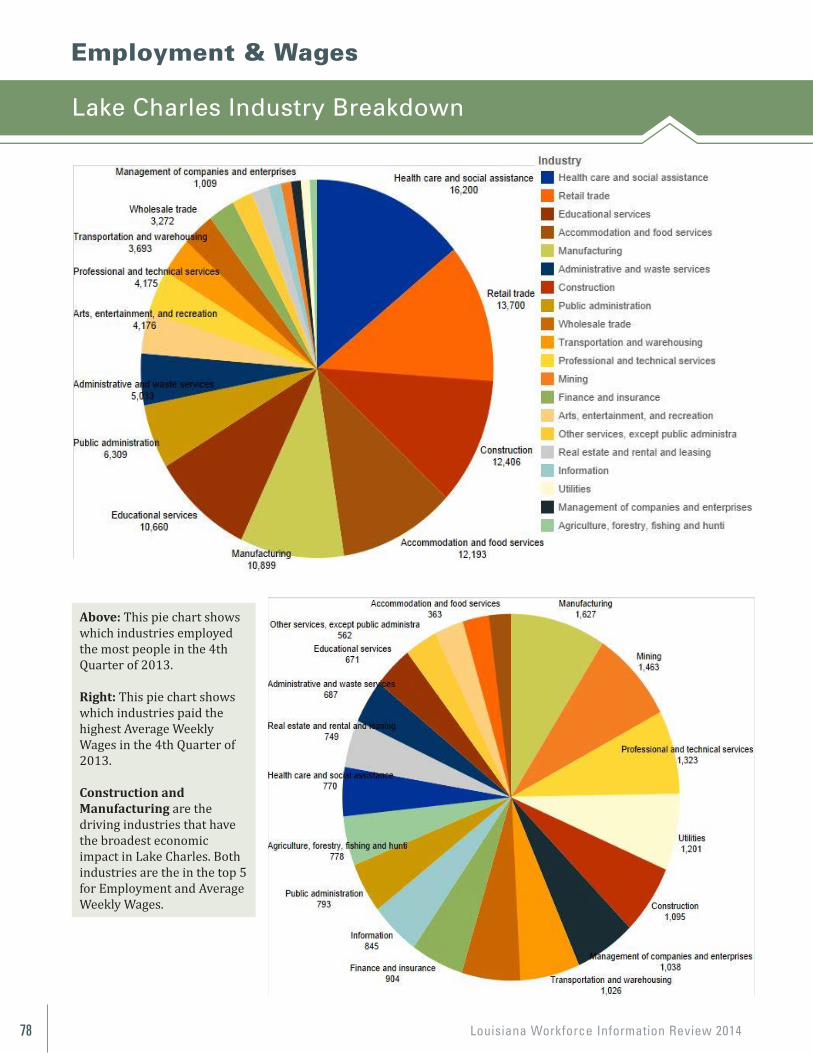
Louisiana Workforce Information Review 201478
Employment & Wages
Lake Charles Industry Breakdown
81
Above: This Pie Chart shows which industries employed the most people in the 4th Quarter of 2013. Right: This Pie Chart shows which industries paid the highest Average Weekly Wages in the 4th Quarter of 2013 Construction and Manufacturing are the driving industries that have the broadest economic impact in Lake Charles. Both industries are the in the top 5 for Employment and Average Weekly Wages. 81
Above: This Pie Chart shows which industries employed the most people in the 4th Quarter of 2013. Right: This Pie Chart shows which industries paid the highest Average Weekly Wages in the 4th Quarter of 2013 Construction and Manufacturing are the driving industries that have the broadest economic impact in Lake Charles. Both industries are the in the top 5 for Employment and Average Weekly Wages.
Above: This pie chart shows which industries employedthe most people in the 4th Quarter of 2013.
Right: This pie chart shows which industries paid thehighest Average Weekly Wages in the 4th Quarter of2013.
Construction and Manufacturing are the driving industries that have the broadest economic impact in Lake Charles. Bothindustries are the in the top 5 for Employment and Average Weekly Wages.
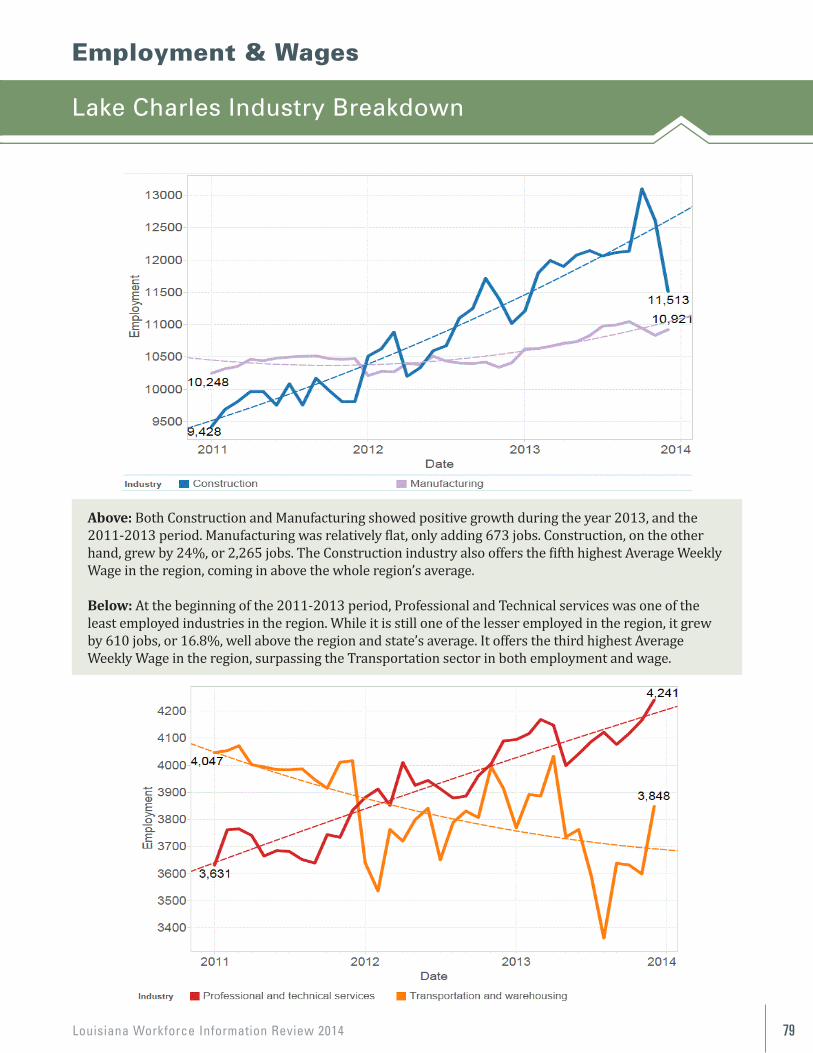
Louisiana Workforce Information Review 2014 79
Employment & Wages
Lake Charles Industry Breakdown
Above: Both Construction and Manufacturing showed positive growth during the year 2013, and the 2011-2013 period. Manufacturing was relatively flat, only adding 673 jobs. Construction, on the other hand, grew by 24%, or 2,265 jobs. The Construction industry also offers the fifth highest Average Weekly Wage in the region, coming in above the whole region’s average.
Below: At the beginning of the 2011-2013 period, Professional and Technical services was one of the least employed industries in the region. While it is still one of the lesser employed in the region, it grew by 610 jobs, or 16.8%, well above the region and state’s average. It offers the third highest Average Weekly Wage in the region, surpassing the Transportation sector in both employment and wage.
82
Above: Both Construction and Manufacturing showed positive growth during the year 2013, and the 2011-2013 period. Manufacturing was relatively flat, however, only adding 673 jobs. Construction, on the other hand, grew by 24%, or 2,265 jobs. The Construction industry also offers the fifth highest Average Weekly Wage in the region, coming in above the whole region’s average. Below: At the beginning of the 2011-2013 period, Professional and Technical services was one of the least employed industries in the region. While it is still one of the lesser employed in the region, it grew by 610 jobs, or 16.8%, well above the region and state’s average. It offers the third highest Average Weekly Wage in the region, surpassing the Transportation sector in both employment and wage.
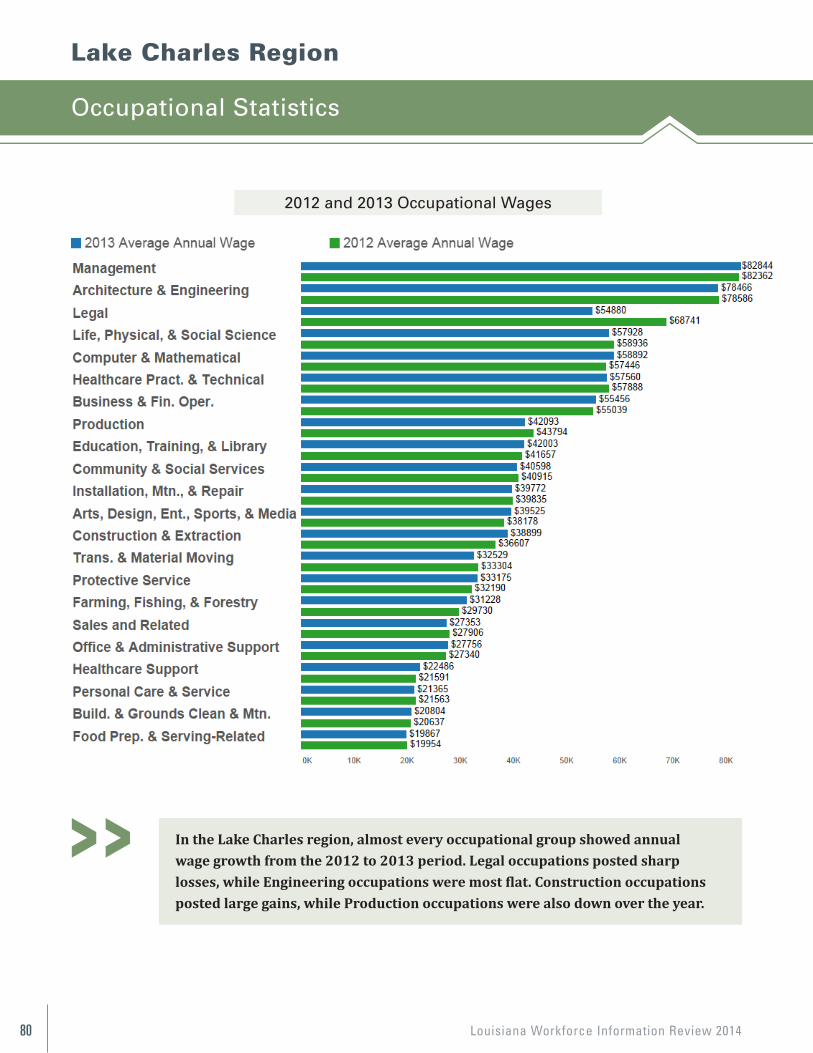
Louisiana Workforce Information Review 201480
Lake Charles Region
Occupational Statistics
83
Lake Charles Region
OCCUPATIONAL STATISTICS 2012 and 2013 Occupational Annual Wages
In the Lake Charles region, almost every occupational group showed annual wage growth from the 2012 to 2013 period. Legal occupations posted sharp losses, while Engineering occupations were most flat. Construction occupations posted large gains, while Production occupations were also down over the year.
In the Lake Charles region, almost every occupational group showed annualwage growth from the 2012 to 2013 period. Legal occupations posted sharplosses, while Engineering occupations were most flat. Construction occupationsposted large gains, while Production occupations were also down over the year.
2012 and 2013 Occupational Wages
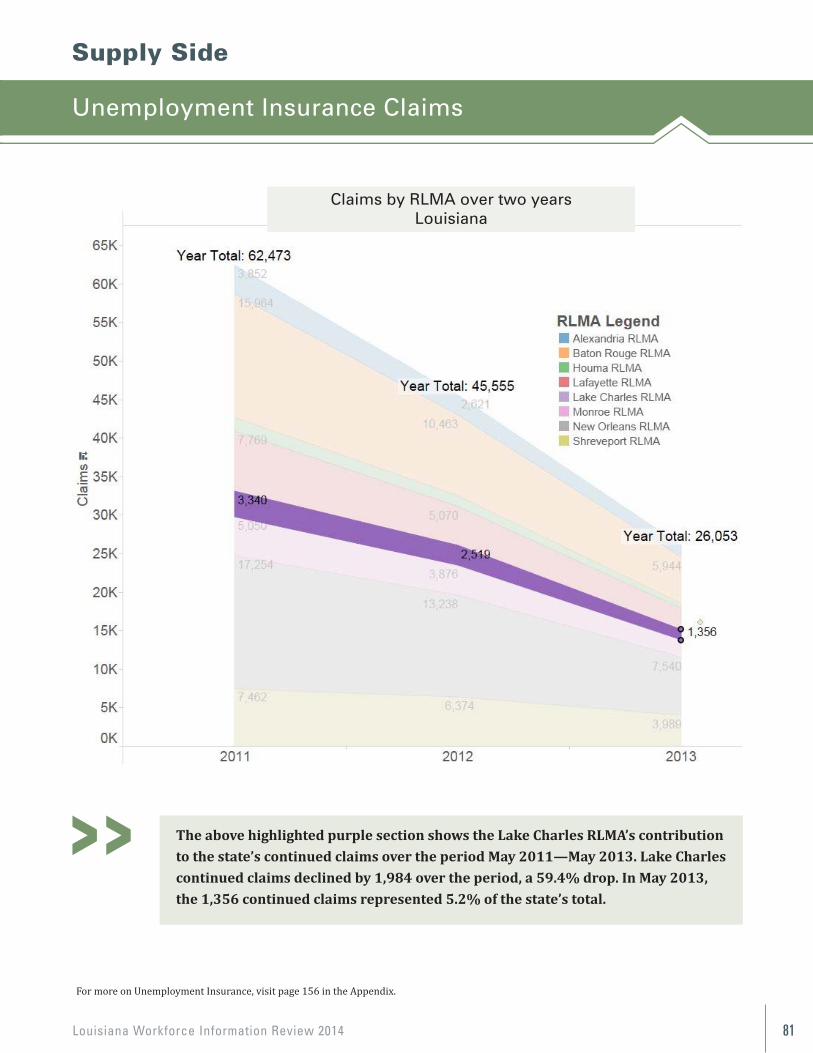
Louisiana Workforce Information Review 2014 81
Supply Side
Unemployment Insurance Claims
84
Supply Side
UNEMPLOYMENT INSURANCE CLAIMS
The above highlighted purple section shows the Lake Charles RLMA’s contribution to the state’s continued claims over the period May 2011—May 2013. Lake Charles continued claims declined by 1,984 over the period, a 59.4% drop. In May 2013, the 1,356 continued claims represented 5.2% of the state’s total.
For more on Unemployment Insurance, visit page 135 in the Appendix
The above highlighted purple section shows the Lake Charles RLMA’s contribution to the state’s continued claims over the period May 2011—May 2013. Lake Charles continued claims declined by 1,984 over the period, a 59.4% drop. In May 2013, the 1,356 continued claims represented 5.2% of the state’s total.
Claims by RLMA over two yearsLouisiana
For more on Unemployment Insurance, visit page 156 in the Appendix.
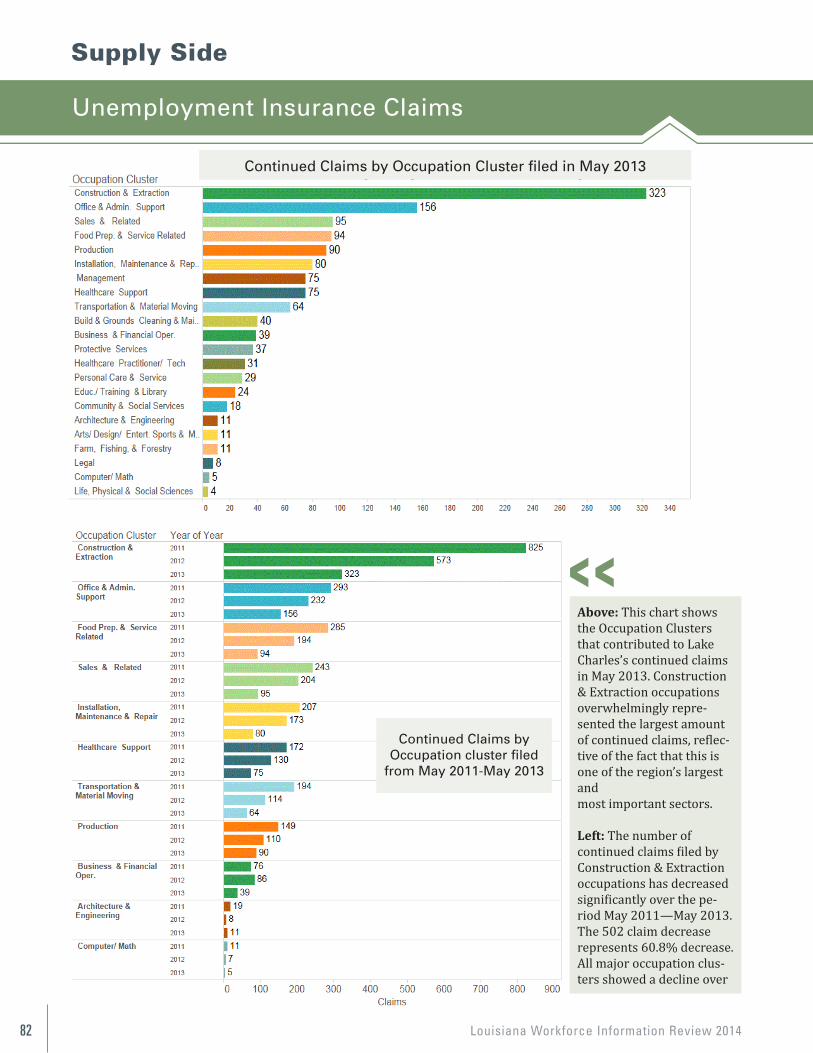
Louisiana Workforce Information Review 201482
Supply Side
Unemployment Insurance Claims
Above: This chart shows the Occupation Clusters that contributed to Lake Charles’s continued claims in May 2013. Construction & Extraction occupations overwhelmingly repre-sented the largest amount of continued claims, reflec-tive of the fact that this is one of the region’s largest andmost important sectors.
Left: The number of continued claims filed by Construction & Extraction occupations has decreased significantly over the pe-riod May 2011—May 2013. The 502 claim decrease represents 60.8% decrease. All major occupation clus-ters showed a decline over
85
Above: This chart shows the Occupation Clusters that contributed to Lake Charles’s continued claims in May 2013. Construction & Extraction occupations overwhelmingly represented the largest amount of continued claims, reflective of the fact that this is one of the region’s largest and most important sectors. Left: The number of continued claims filed by Construction & Extraction occupations has decreased significantly over the period May 2011—May 2013. The 502 claim decrease represents 60.8% decrease. All major occupation clusters showed a decline over the two year period
Continued Claims by Occupation Cluster filed in May 2013
Continued Claims by Occupation cluster
filed from May 2011—May 2013
Continued Claims by Occupation Cluster filed in May 2013
Continued Claims byOccupation cluster filed
from May 2011-May 2013
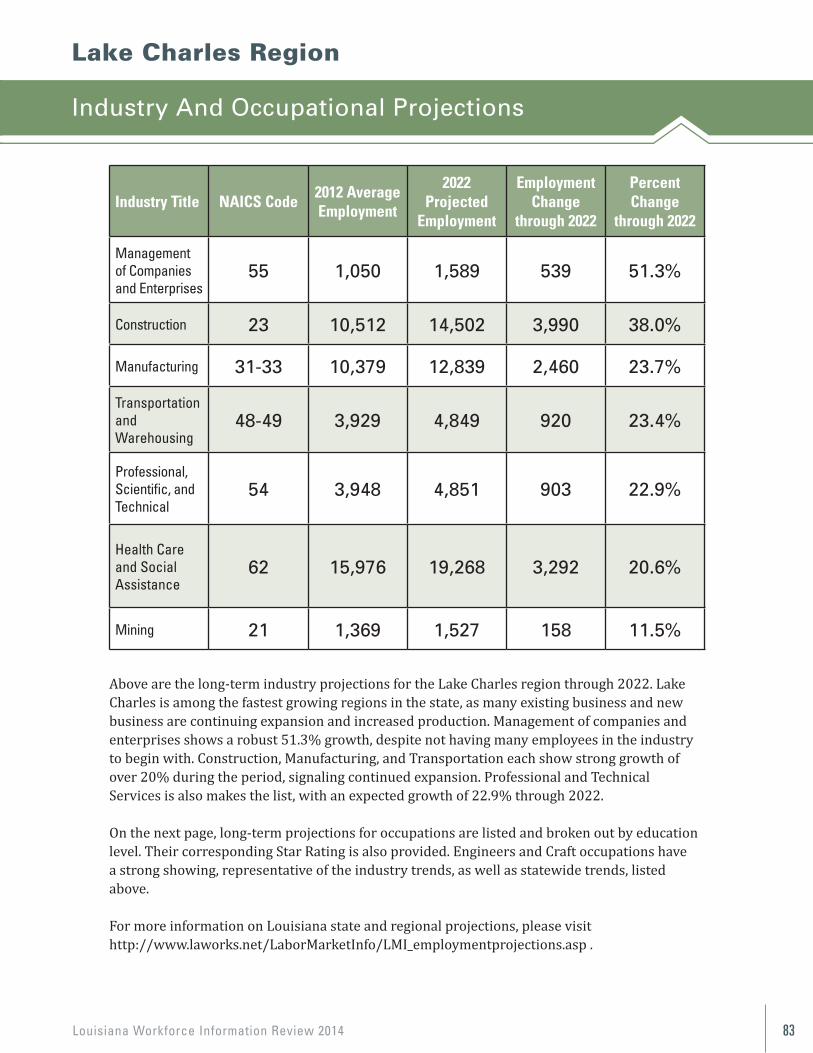
Louisiana Workforce Information Review 2014 83
Lake Charles Region
Industry And Occupational Projections
Industry Title NAICS Code2012 AverageEmployment
2022 Projected
Employment
EmploymentChange
through 2022
PercentChange
through 2022
Management of Companies and Enterprises
55 1,050 1,589 539 51.3%
Construction 23 10,512 14,502 3,990 38.0%
Manufacturing 31-33 10,379 12,839 2,460 23.7%
Transportationand Warehousing
48-49 3,929 4,849 920 23.4%
Professional,Scientific, andTechnical
54 3,948 4,851 903 22.9%
Health Care and Social Assistance
62 15,976 19,268 3,292 20.6%
Mining 21 1,369 1,527 158 11.5%
Above are the long-term industry projections for the Lake Charles region through 2022. LakeCharles is among the fastest growing regions in the state, as many existing business and newbusiness are continuing expansion and increased production. Management of companies andenterprises shows a robust 51.3% growth, despite not having many employees in the industryto begin with. Construction, Manufacturing, and Transportation each show strong growth ofover 20% during the period, signaling continued expansion. Professional and TechnicalServices is also makes the list, with an expected growth of 22.9% through 2022.
On the next page, long-term projections for occupations are listed and broken out by educationlevel. Their corresponding Star Rating is also provided. Engineers and Craft occupations havea strong showing, representative of the industry trends, as well as statewide trends, listedabove.
For more information on Louisiana state and regional projections, please visit http://www.laworks.net/LaborMarketInfo/LMI_employmentprojections.asp .
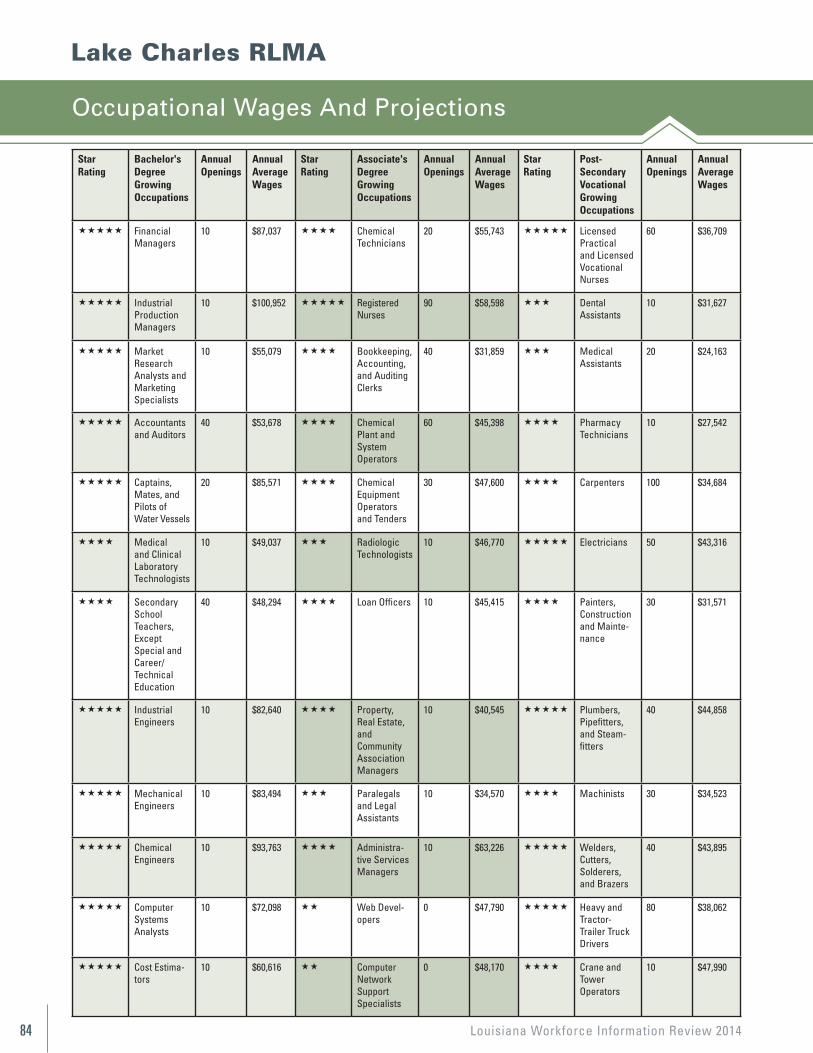
Louisiana Workforce Information Review 201484
Lake Charles RLMA
Occupational Wages And Projections
StarRating
Bachelor's Degree Growing Occupations
Annual Openings
Annual Average Wages
StarRating
Associate's Degree Growing Occupations
Annual Openings
Annual Average Wages
StarRating
Post-Secondary Vocational Growing Occupations
Annual Openings
Annual Average Wages
Financial Managers
10 $87,037 Chemical Technicians
20 $55,743 Licensed Practical and Licensed Vocational Nurses
60 $36,709
Industrial Production Managers
10 $100,952 Registered Nurses
90 $58,598 Dental Assistants
10 $31,627
Market Research Analysts and Marketing Specialists
10 $55,079 Bookkeeping, Accounting, and Auditing Clerks
40 $31,859 Medical Assistants
20 $24,163
Accountants and Auditors
40 $53,678 Chemical Plant and System Operators
60 $45,398 Pharmacy Technicians
10 $27,542
Captains, Mates, and Pilots of Water Vessels
20 $85,571 Chemical Equipment Operators and Tenders
30 $47,600 Carpenters 100 $34,684
Medical and Clinical Laboratory Technologists
10 $49,037 Radiologic Technologists
10 $46,770 Electricians 50 $43,316
Secondary School Teachers, Except Special and Career/Technical Education
40 $48,294 Loan Officers 10 $45,415 Painters, Construction and Mainte-nance
30 $31,571
Industrial Engineers
10 $82,640 Property, Real Estate, and Community Association Managers
10 $40,545 Plumbers, Pipefitters, and Steam-fitters
40 $44,858
Mechanical Engineers
10 $83,494 Paralegals and Legal Assistants
10 $34,570 Machinists 30 $34,523
Chemical Engineers
10 $93,763 Administra-tive Services Managers
10 $63,226 Welders, Cutters, Solderers, and Brazers
40 $43,895
Computer Systems Analysts
10 $72,098 Web Devel-opers
0 $47,790 Heavy and Tractor-Trailer Truck Drivers
80 $38,062
Cost Estima-tors
10 $60,616 Computer Network Support Specialists
0 $48,170 Crane and Tower Operators
10 $47,990
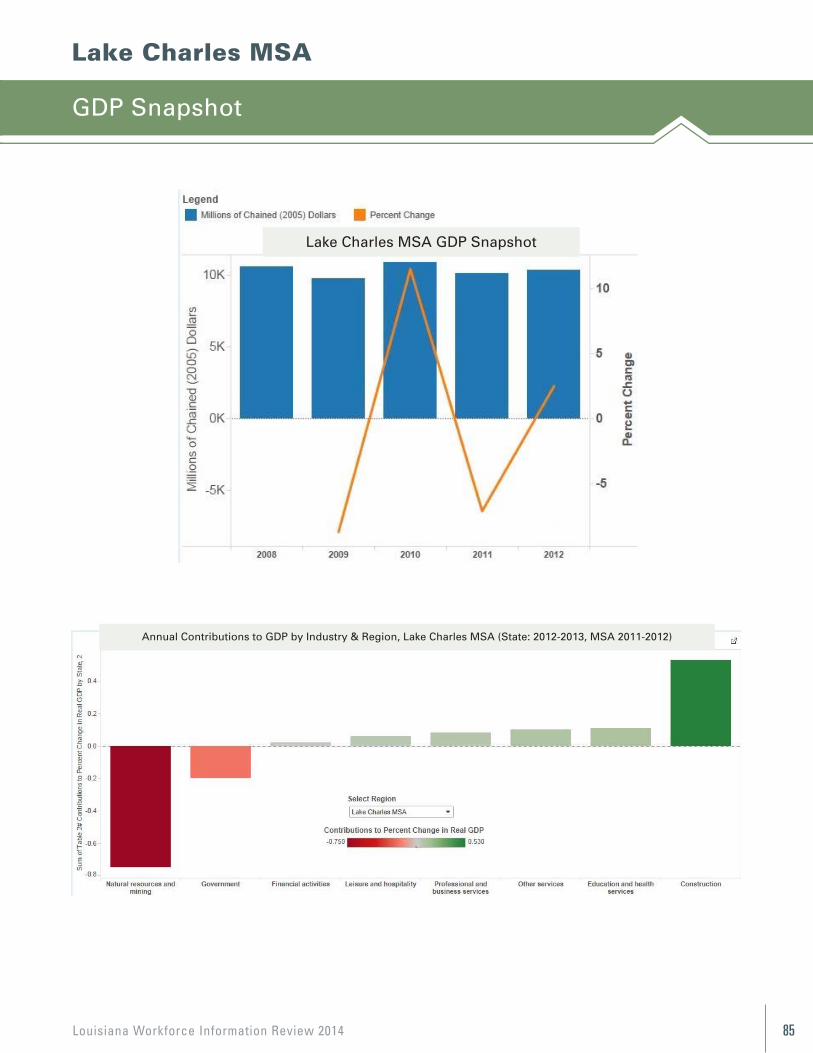
Louisiana Workforce Information Review 2014 85
Lake Charles MSA
GDP Snapshot
88
Volume 1, Issue 1 Newsletter Date
Lake Charles MSA
88
Volume 1, Issue 1 Newsletter Date
Lake Charles MSA Lake Charles MSA GDP Snapshot
Annual Contributions to GDP by Industry & Region, Lake Charles MSA (State: 2012-2013, MSA 2011-2012)
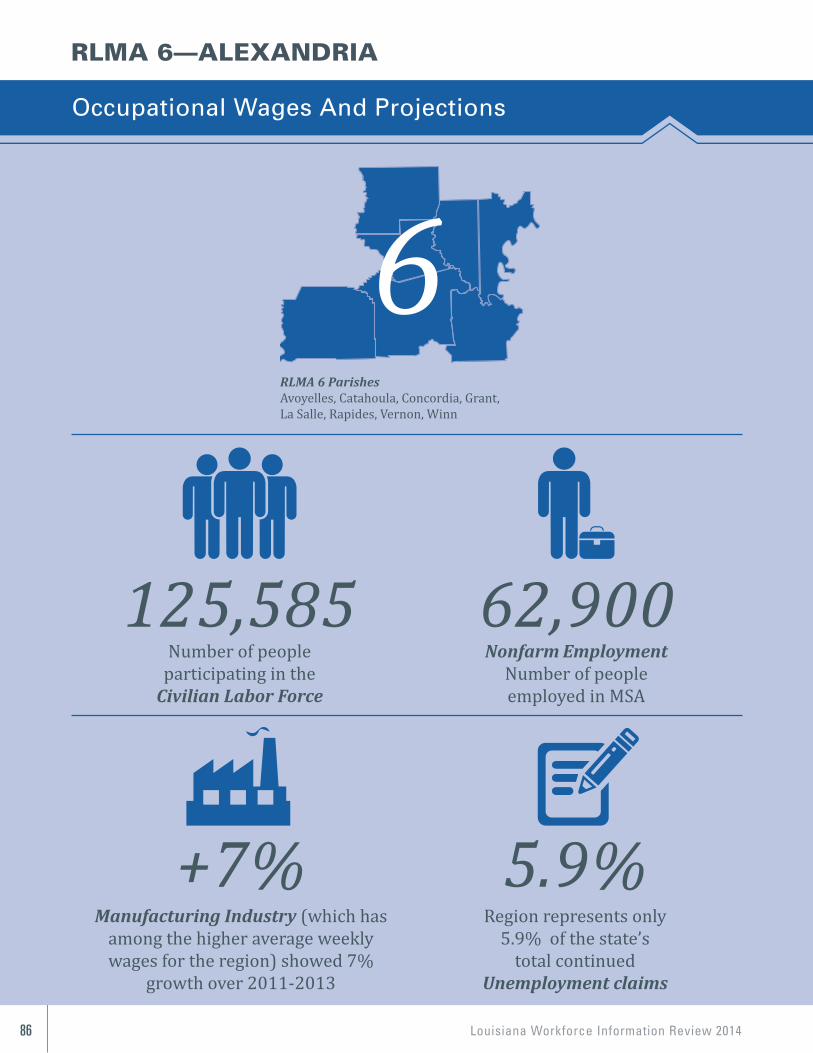
Louisiana Workforce Information Review 201486
RLMA 6—ALEXANDRIA
Occupational Wages And Projections
RLMA 6 ParishesAvoyelles, Catahoula, Concordia, Grant,La Salle, Rapides, Vernon, Winn
Nonfarm EmploymentNumber of peopleemployed in MSA
62,900Number of people
participating in theCivilian Labor Force
125,585
Manufacturing Industry (which has among the higher average weekly wages for the region) showed 7%
growth over 2011-2013
+7%Region represents only
5.9% of the state’stotal continued
Unemployment claims
5.9%
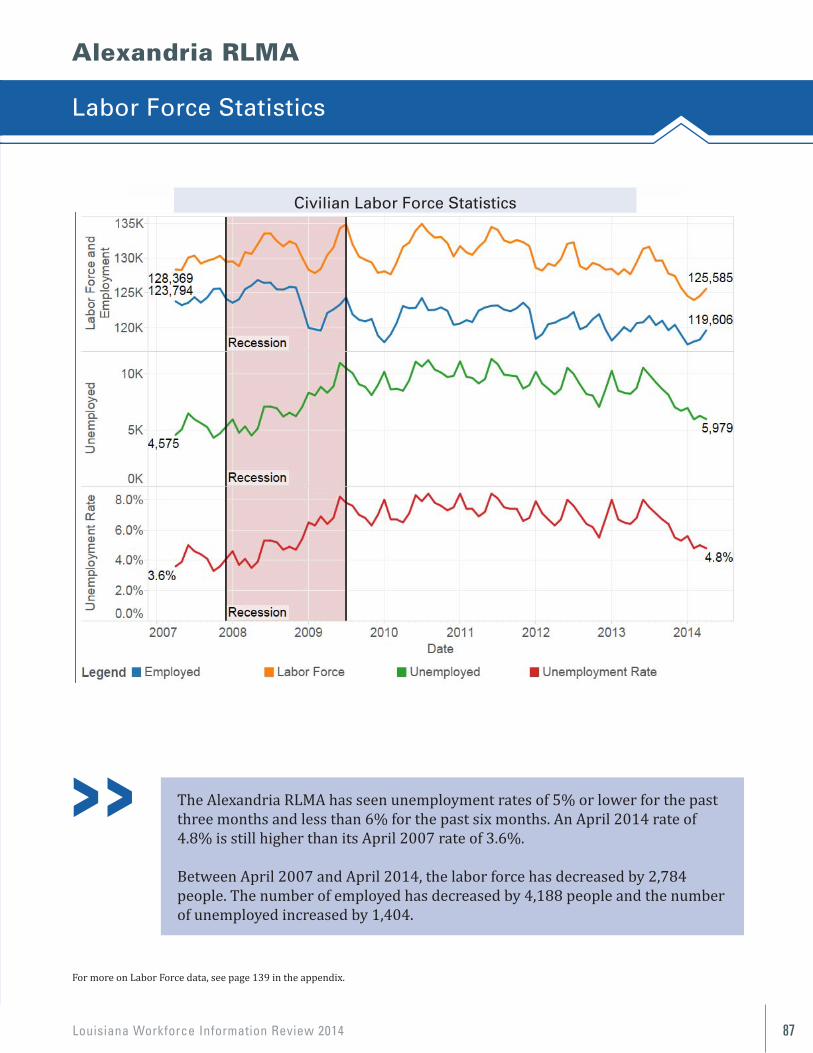
Louisiana Workforce Information Review 2014 87
Alexandria RLMA
Labor Force Statistics
90
Alexandria RLMA
LABOR FORCE STATISTICS The Alexandria RLMA has seen unemployment rates of 5% or lower for the past three months and less than 6% for the past six months. An April 2014 rate of 4.8% is still higher than its April 2007 rate of 3.6%.
Between April 2007 and April 2014, the labor force has decreased by 2,784 people. The number of employed has decreased by 4,188 people and the number of unemployed increased by 1,404.
For more on Labor Force data, see page 118 in the appendix.
Civilian Labor Force Statistics
The Alexandria RLMA has seen unemployment rates of 5% or lower for the past three months and less than 6% for the past six months. An April 2014 rate of 4.8% is still higher than its April 2007 rate of 3.6%.
Between April 2007 and April 2014, the labor force has decreased by 2,784 people. The number of employed has decreased by 4,188 people and the number of unemployed increased by 1,404.
For more on Labor Force data, see page 139 in the appendix.
Civilian Labor Force Statistics
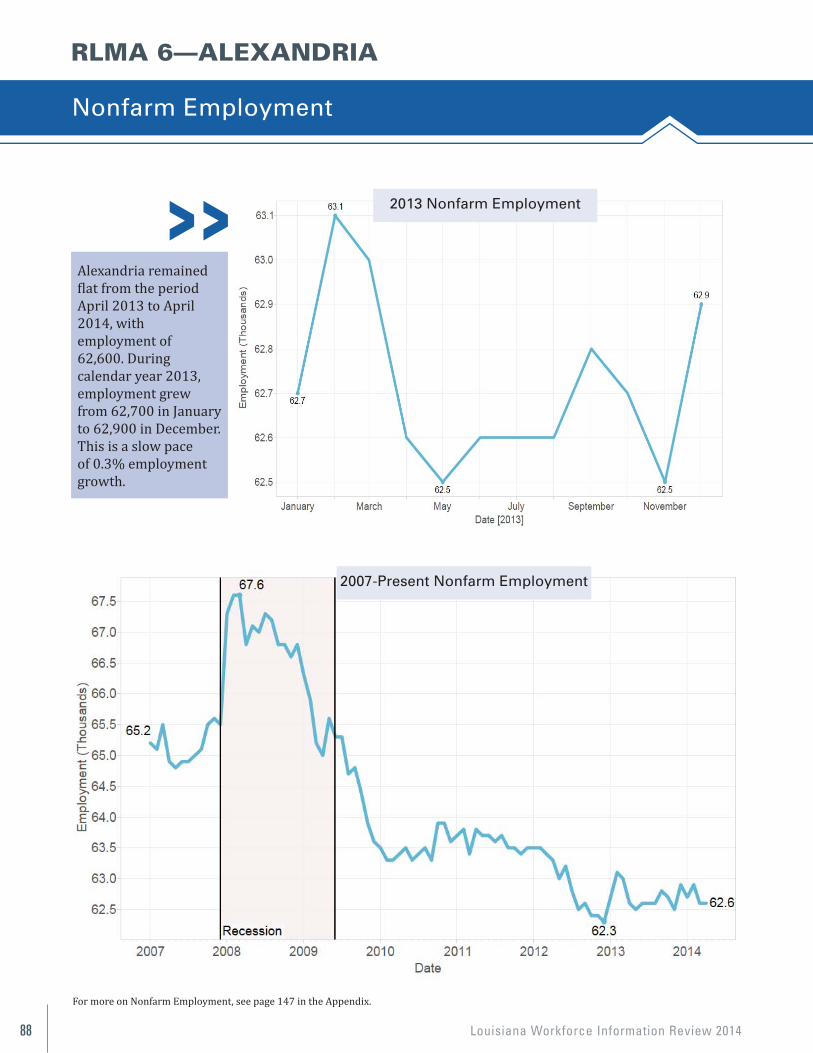
Louisiana Workforce Information Review 201488
RLMA 6—ALEXANDRIA
Nonfarm Employment
Alexandria remainedflat from the periodApril 2013 to April2014, with employment of62,600. During calendar year 2013, employment grew from 62,700 in January to 62,900 in December. This is a slow pace of 0.3% employment growth.
91
NONFARM EMPLOYMENT
Alexandria MSA
Alexandria remained flat from the period April 2013 to April 2014, with employment of 62,600.
During calendar year 2013, employment grew from 62,700 in January to 62,900 in December. This is a slow pace of 0.3% employment growth.
For more on Nonfarm Employment, see page 126 in the Appendix.
2013 Nonfarm Employment
2007—Present Nonfarm Employment
For more on Nonfarm Employment, see page 147 in the Appendix.
91
NONFARM EMPLOYMENT
Alexandria MSA
Alexandria remained flat from the period April 2013 to April 2014, with employment of 62,600.
During calendar year 2013, employment grew from 62,700 in January to 62,900 in December. This is a slow pace of 0.3% employment growth.
For more on Nonfarm Employment, see page 126 in the Appendix.
2013 Nonfarm Employment
2007—Present Nonfarm Employment
2013 Nonfarm Employment
2007-Present Nonfarm Employment
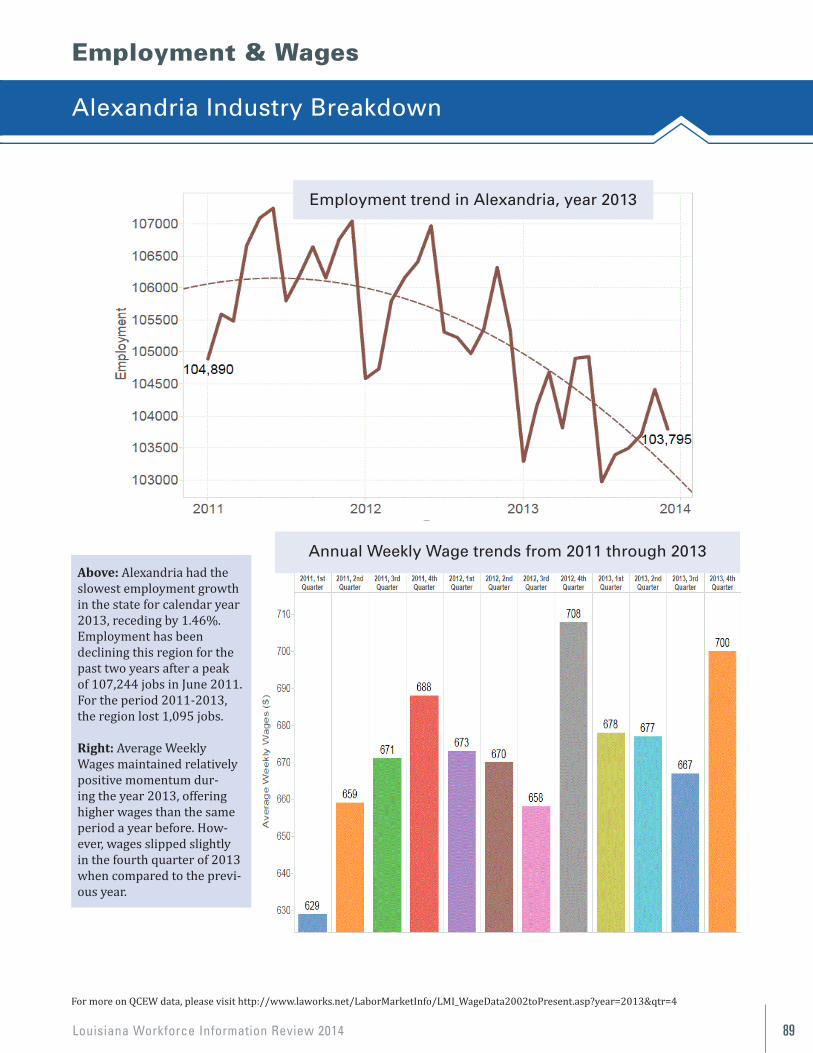
Louisiana Workforce Information Review 2014 89
Employment & Wages
Alexandria Industry Breakdown
For more on QCEW data, please visit http://www.laworks.net/LaborMarketInfo/LMI_WageData2002toPresent.asp?year=2013&qtr=4
Above: Alexandria had the slowest employment growth in the state for calendar year 2013, receding by 1.46%. Employment has been declining this region for the past two years after a peak of 107,244 jobs in June 2011. For the period 2011-2013,the region lost 1,095 jobs.
Right: Average Weekly Wages maintained relatively positive momentum dur-ing the year 2013, offering higher wages than the same period a year before. How-ever, wages slipped slightly in the fourth quarter of 2013 when compared to the previ-ous year.
92
QCEW
ALEXANDRIA INDUSTRY BREAKDOWN
Above: Alexandria had the slowest employment growth in the state for calendar year 2013, receding by 1.46%. Employment has been declining this region for the past two years after hitting a peak in June 2011 of 107,244 jobs. For the period 2011-2013, the region has lost 1,095 jobs. Right: Average Weekly Wages maintained relatively positive momentum during the year 2013, offering higher wages than the same period a year before. However, wages slipped slightly in the fourth quarter of 2013 when compared to the previous year.
For more on QCEW data, please visit http://www.laworks.net/LaborMarketInfo/LMI_WageData2002toPresent.asp?year=2013&qtr=4
Employment Trend in Alexandria, year 2013
Average Weekly Wage trends from 2011 through 2013
Employment trend in Alexandria, year 2013
Annual Weekly Wage trends from 2011 through 2013
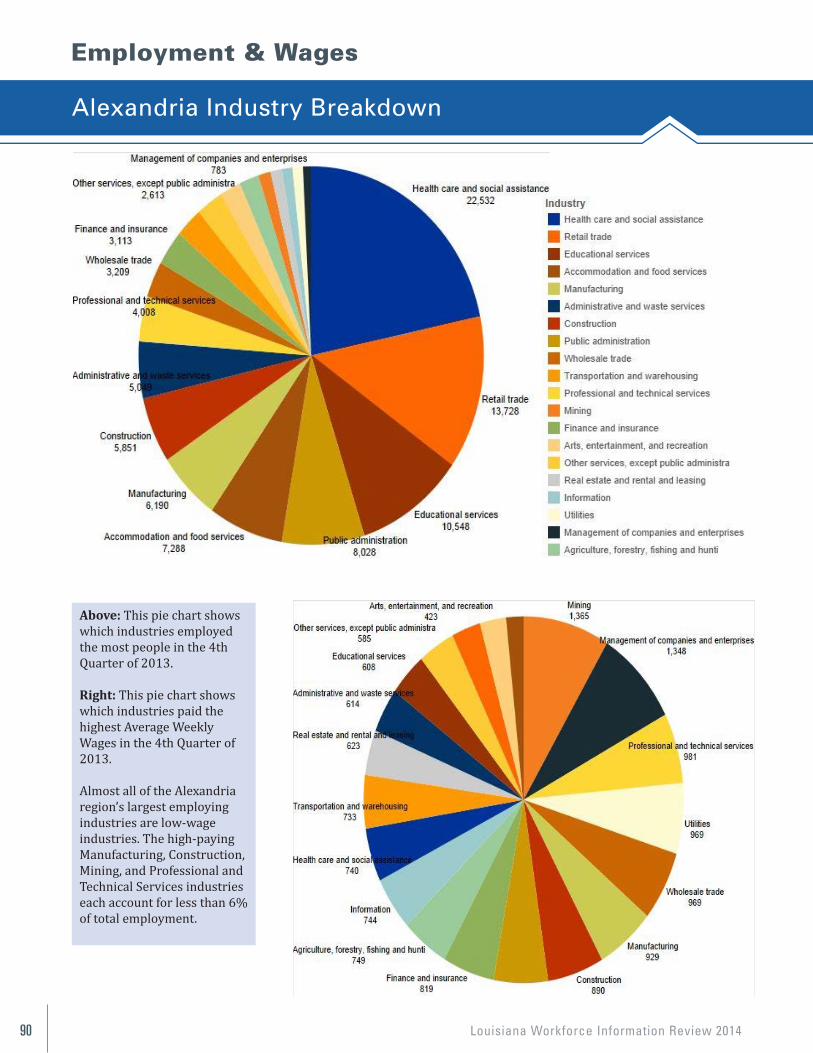
Louisiana Workforce Information Review 201490
Employment & Wages
Alexandria Industry Breakdown
93
Above: This Pie Chart shows which industries employed the most people in the 4th Quarter of 2013. Right: This Pie Chart shows which industries paid the highest Average Weekly Wages in the 4th Quarter of 2013 Almost all of the Alexandria region’s largest employing industries are low wage industries. The high paying Manufacturing, Construction, Mining, and Professional and Technical Services industries each account for less than 6% of total employment. 93
Above: This Pie Chart shows which industries employed the most people in the 4th Quarter of 2013. Right: This Pie Chart shows which industries paid the highest Average Weekly Wages in the 4th Quarter of 2013 Almost all of the Alexandria region’s largest employing industries are low wage industries. The high paying Manufacturing, Construction, Mining, and Professional and Technical Services industries each account for less than 6% of total employment.
Above: This pie chart shows which industries employed the most people in the 4thQuarter of 2013.
Right: This pie chart shows which industries paid the highest Average Weekly Wages in the 4th Quarter of2013.
Almost all of the Alexandria region’s largest employingindustries are low-wageindustries. The high-paying Manufacturing, Construction, Mining, and Professional andTechnical Services industries each account for less than 6% of total employment.
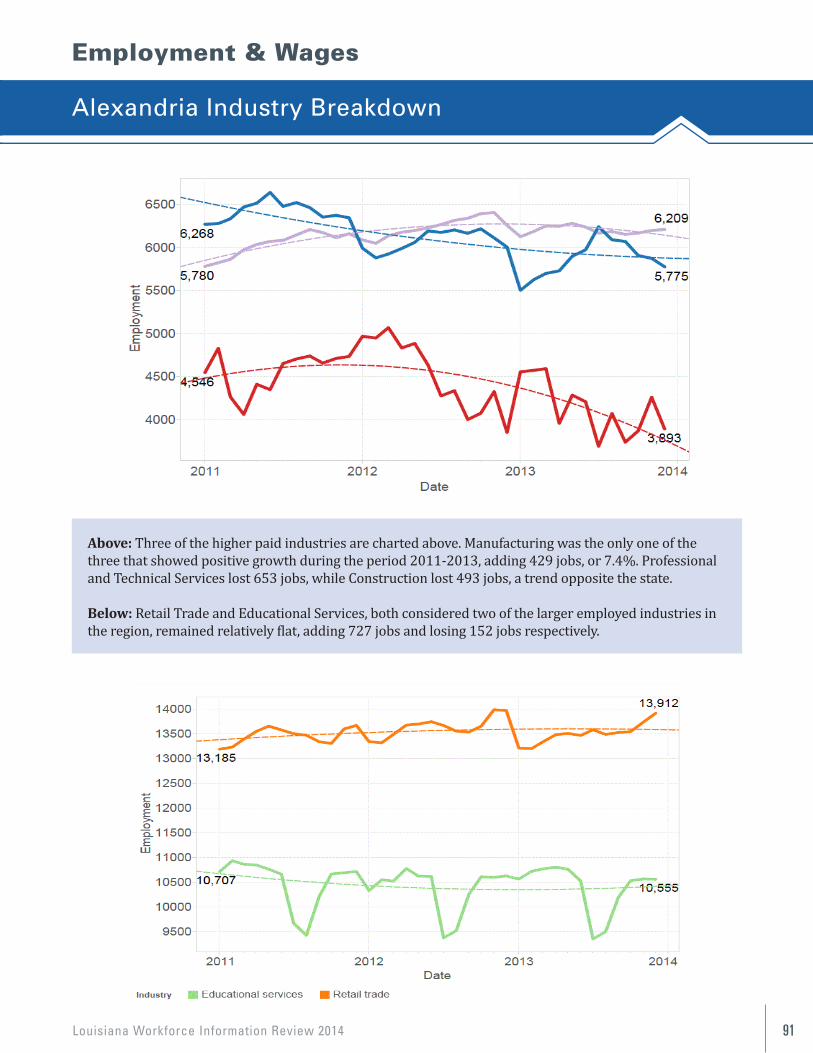
Louisiana Workforce Information Review 2014 91
Employment & Wages
Alexandria Industry Breakdown
Above: Three of the higher paid industries are charted above. Manufacturing was the only one of the three that showed positive growth during the period 2011-2013, adding 429 jobs, or 7.4%. Professional and Technical Services lost 653 jobs, while Construction lost 493 jobs, a trend opposite the state.
Below: Retail Trade and Educational Services, both considered two of the larger employed industries in the region, remained relatively flat, adding 727 jobs and losing 152 jobs respectively.
94
Above: Three of the higher paid industries are charted above. Manufacturing was the only one of the three that showed positive growth during the period 2011-2013, adding 429 jobs, or 7.4%. Professional and Technical Services lost 653 jobs, while Construction lost 493 jobs, a trend opposite the state. Below: Retail Trade and Educational Services, both considered two of the larger employed industries in the region, remained relatively flat, adding 727 jobs and losing 152 jobs respectively.
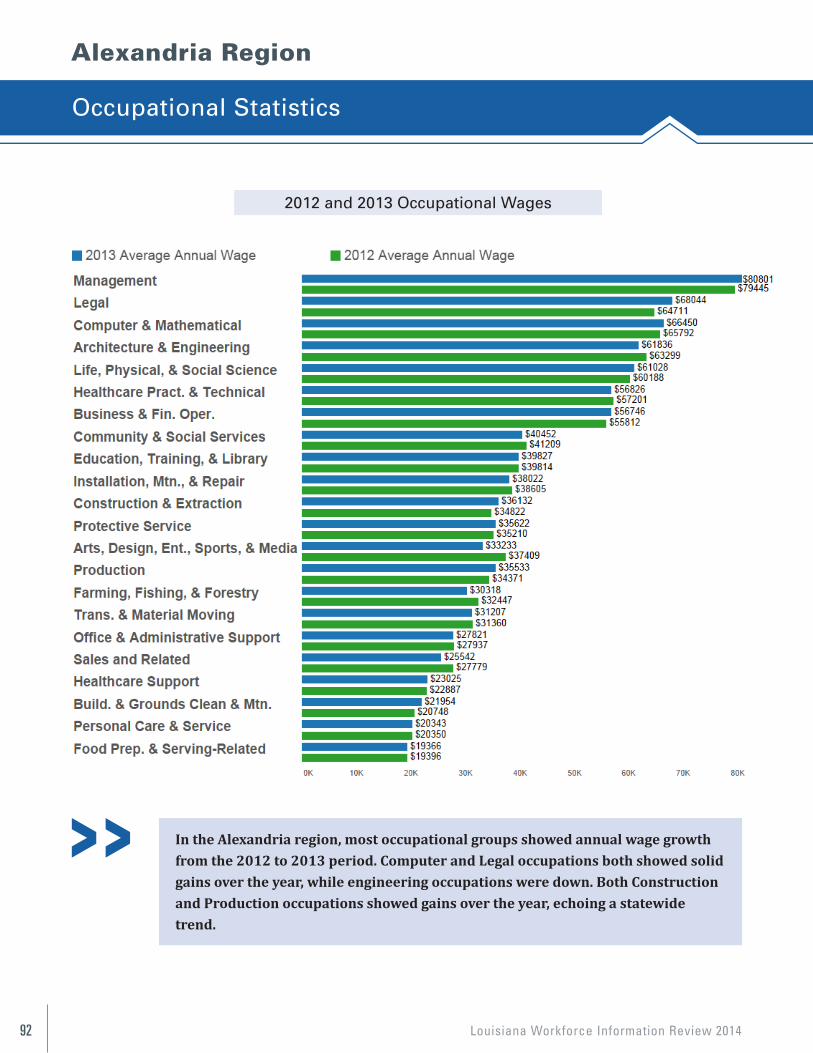
Louisiana Workforce Information Review 201492
Alexandria Region
Occupational Statistics
95
Alexandria Region
OCCUPATIONAL STATISTICS 2012 and 2013 Occupational Annual Wages
In the Alexandria region, most occupational groups showed annual wage growth from the 2012 to 2013 period. Computer and Legal occupations both showed solid gains over the year, while engineering occupations were down. Both Construction and Production occupations showed gains over the year, echoing a statewide trend.
In the Alexandria region, most occupational groups showed annual wage growthfrom the 2012 to 2013 period. Computer and Legal occupations both showed solidgains over the year, while engineering occupations were down. Both Constructionand Production occupations showed gains over the year, echoing a statewide trend.
2012 and 2013 Occupational Wages
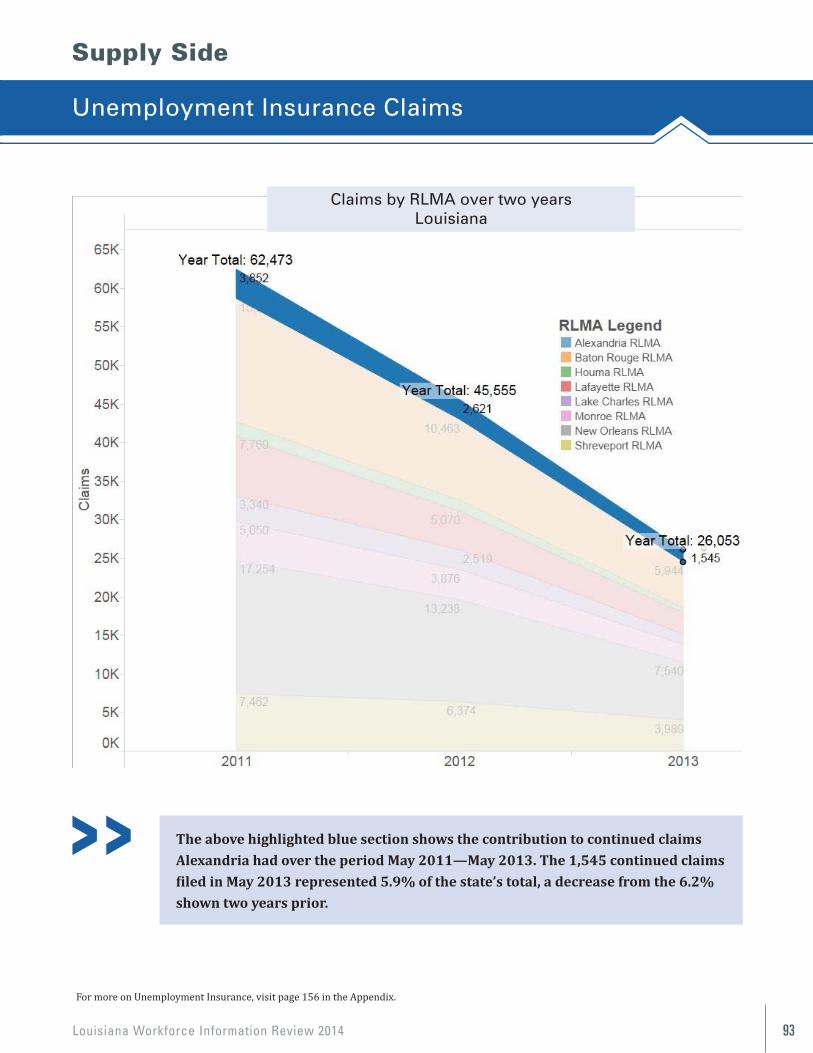
Louisiana Workforce Information Review 2014 93
Supply Side
Unemployment Insurance Claims
96
Supply Side
UNEMPLOYMENT INSURANCE CLAIMS
The above highlighted blue section shows the contribution to continued claims Alexandria had over the period May 2011—May 2013. The 1,545 continued claims filed in May 2013 represented 5.9% of the state’s total, a decrease from the 6.2% shown two years prior.
For more on Unemployment Insurance, visit page 135 in the Appendix
The above highlighted blue section shows the contribution to continued claims Alexandria had over the period May 2011—May 2013. The 1,545 continued claims filed in May 2013 represented 5.9% of the state’s total, a decrease from the 6.2% shown two years prior.
Claims by RLMA over two yearsLouisiana
For more on Unemployment Insurance, visit page 156 in the Appendix.
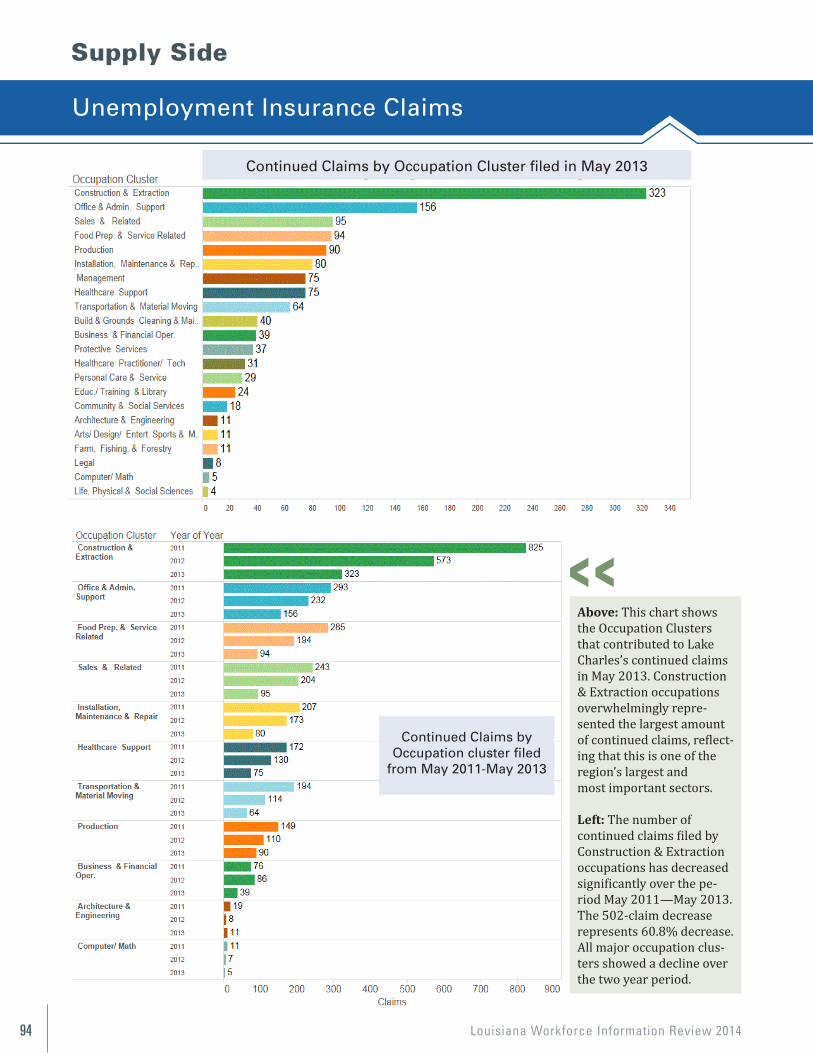
Louisiana Workforce Information Review 201494
Supply Side
Unemployment Insurance Claims
Above: This chart shows the Occupation Clusters that contributed to Lake Charles’s continued claims in May 2013. Construction & Extraction occupations overwhelmingly repre-sented the largest amount of continued claims, reflect-ing that this is one of the region’s largest andmost important sectors.
Left: The number of continued claims filed by Construction & Extraction occupations has decreased significantly over the pe-riod May 2011—May 2013. The 502-claim decrease represents 60.8% decrease. All major occupation clus-ters showed a decline over the two year period.
85
Above: This chart shows the Occupation Clusters that contributed to Lake Charles’s continued claims in May 2013. Construction & Extraction occupations overwhelmingly represented the largest amount of continued claims, reflective of the fact that this is one of the region’s largest and most important sectors. Left: The number of continued claims filed by Construction & Extraction occupations has decreased significantly over the period May 2011—May 2013. The 502 claim decrease represents 60.8% decrease. All major occupation clusters showed a decline over the two year period
Continued Claims by Occupation Cluster filed in May 2013
Continued Claims by Occupation cluster
filed from May 2011—May 2013
Continued Claims by Occupation Cluster filed in May 2013
Continued Claims byOccupation cluster filed
from May 2011-May 2013
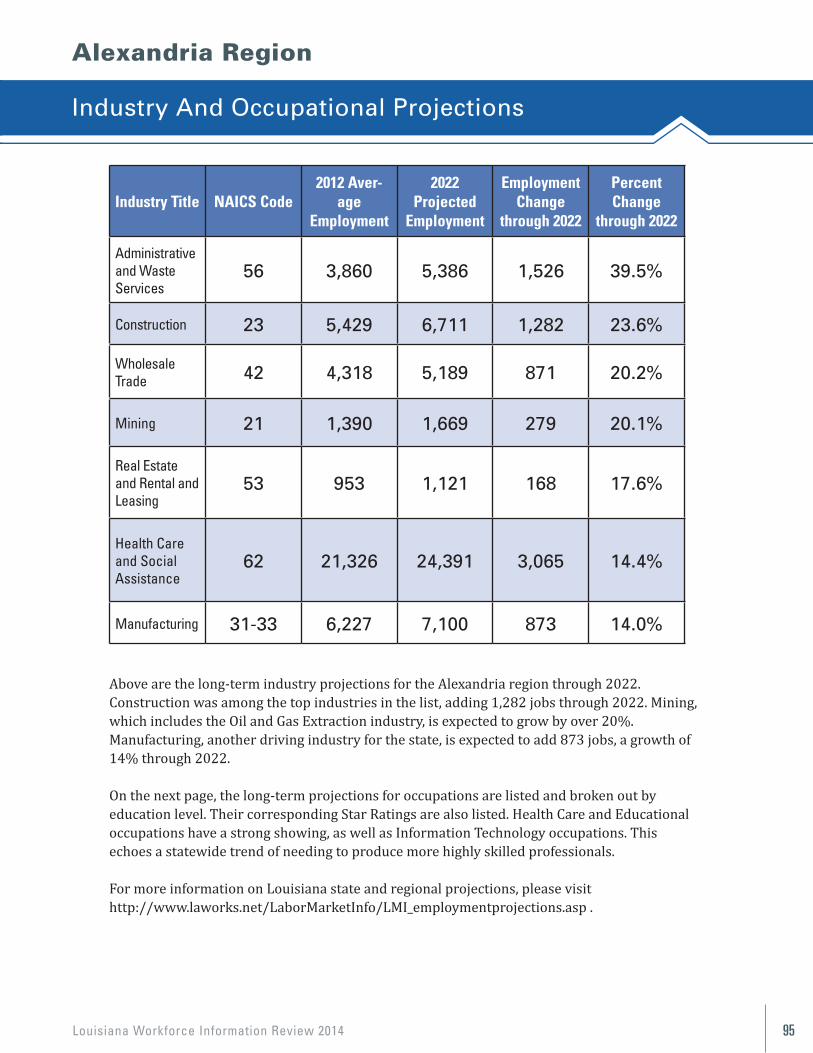
Louisiana Workforce Information Review 2014 95
Alexandria Region
Industry And Occupational Projections
Industry Title NAICS Code2012 Aver-
ageEmployment
2022 Projected
Employment
EmploymentChange
through 2022
PercentChange
through 2022
Administrative and Waste Services
56 3,860 5,386 1,526 39.5%
Construction 23 5,429 6,711 1,282 23.6%
Wholesale Trade 42 4,318 5,189 871 20.2%
Mining 21 1,390 1,669 279 20.1%
Real Estate and Rental and Leasing
53 953 1,121 168 17.6%
Health Care and Social Assistance
62 21,326 24,391 3,065 14.4%
Manufacturing 31-33 6,227 7,100 873 14.0%
Above are the long-term industry projections for the Alexandria region through 2022.Construction was among the top industries in the list, adding 1,282 jobs through 2022. Mining,which includes the Oil and Gas Extraction industry, is expected to grow by over 20%.Manufacturing, another driving industry for the state, is expected to add 873 jobs, a growth of14% through 2022.
On the next page, the long-term projections for occupations are listed and broken out byeducation level. Their corresponding Star Ratings are also listed. Health Care and Educationaloccupations have a strong showing, as well as Information Technology occupations. Thisechoes a statewide trend of needing to produce more highly skilled professionals.
For more information on Louisiana state and regional projections, please visithttp://www.laworks.net/LaborMarketInfo/LMI_employmentprojections.asp .
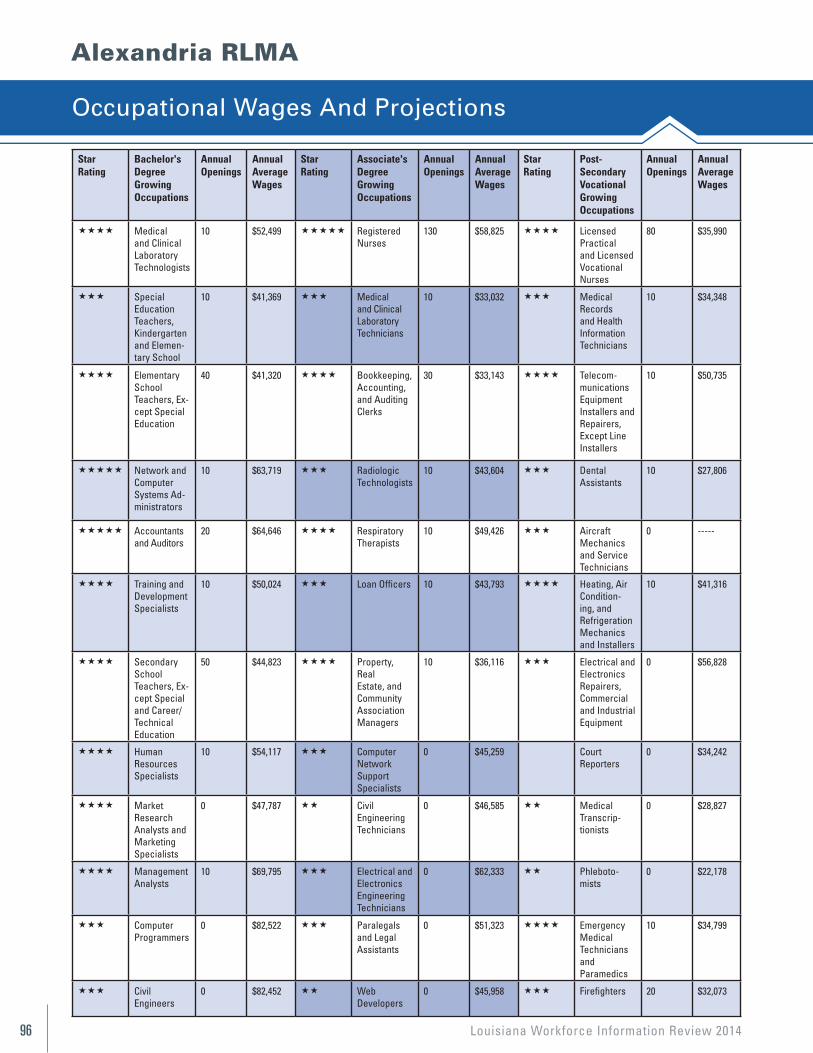
Louisiana Workforce Information Review 201496
Alexandria RLMA
Occupational Wages And Projections
StarRating
Bachelor's Degree Growing Occupations
Annual Openings
Annual Average Wages
StarRating
Associate's Degree Growing Occupations
Annual Openings
Annual Average Wages
StarRating
Post-Secondary Vocational Growing Occupations
Annual Openings
Annual Average Wages
Medical and Clinical Laboratory Technologists
10 $52,499 Registered Nurses
130 $58,825 Licensed Practical and Licensed Vocational Nurses
80 $35,990
Special Education Teachers, Kindergarten and Elemen-tary School
10 $41,369 Medical and Clinical Laboratory Technicians
10 $33,032 Medical Records and Health Information Technicians
10 $34,348
Elementary School Teachers, Ex-cept Special Education
40 $41,320 Bookkeeping, Accounting, and Auditing Clerks
30 $33,143 Telecom-munications Equipment Installers and Repairers, Except Line Installers
10 $50,735
Network and Computer Systems Ad-ministrators
10 $63,719 Radiologic Technologists
10 $43,604 Dental Assistants
10 $27,806
Accountants and Auditors
20 $64,646 Respiratory Therapists
10 $49,426 Aircraft Mechanics and Service Technicians
0 -----
Training and Development Specialists
10 $50,024 Loan Officers 10 $43,793 Heating, Air Condition-ing, and Refrigeration Mechanics and Installers
10 $41,316
Secondary School Teachers, Ex-cept Special and Career/Technical Education
50 $44,823 Property, Real Estate, and Community Association Managers
10 $36,116 Electrical and Electronics Repairers, Commercial and Industrial Equipment
0 $56,828
Human Resources Specialists
10 $54,117 Computer Network Support Specialists
0 $45,259 Court Reporters
0 $34,242
Market Research Analysts and Marketing Specialists
0 $47,787 Civil Engineering Technicians
0 $46,585 Medical Transcrip-tionists
0 $28,827
Management Analysts
10 $69,795 Electrical and Electronics Engineering Technicians
0 $62,333 Phleboto-mists
0 $22,178
Computer Programmers
0 $82,522 Paralegals and Legal Assistants
0 $51,323 Emergency Medical Technicians and Paramedics
10 $34,799
Civil Engineers
0 $82,452 Web Developers
0 $45,958 Firefighters 20 $32,073
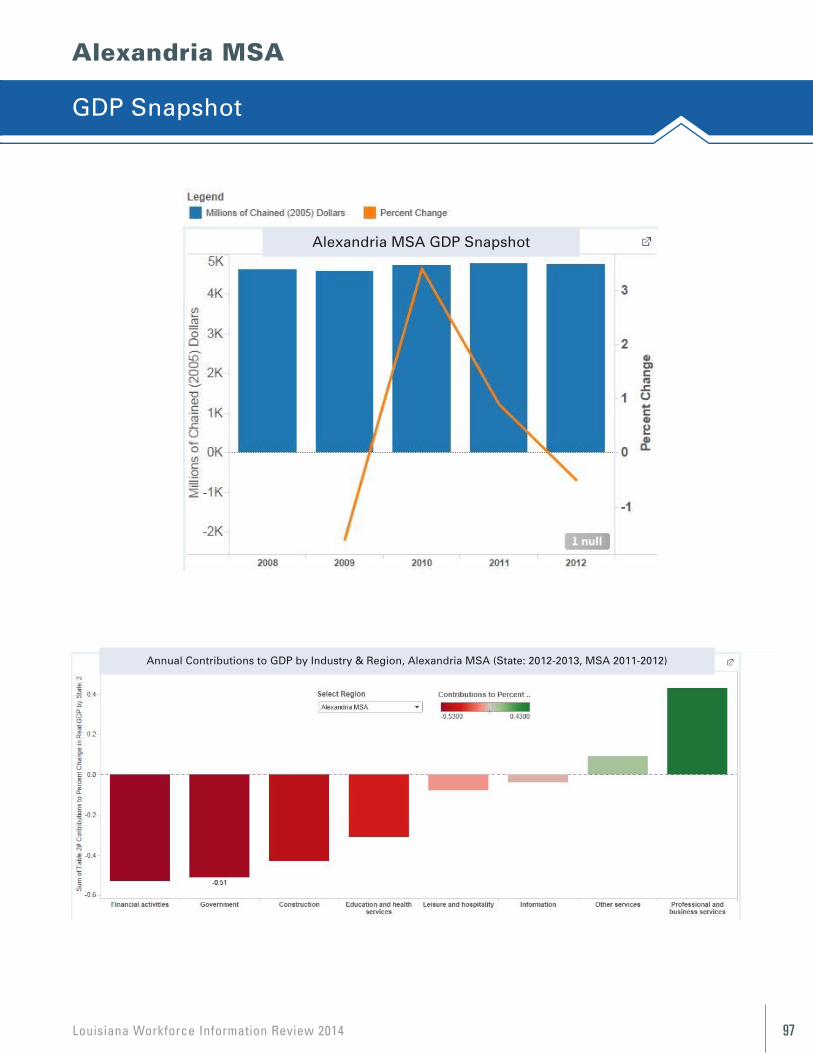
Louisiana Workforce Information Review 2014 97
Alexandria MSA
GDP Snapshot
100
Volume 1, Issue 1 Newsletter Date
Alexandria MSA
100
Volume 1, Issue 1 Newsletter Date
Alexandria MSA
Alexandria MSA GDP Snapshot
Annual Contributions to GDP by Industry & Region, Alexandria MSA (State: 2012-2013, MSA 2011-2012)
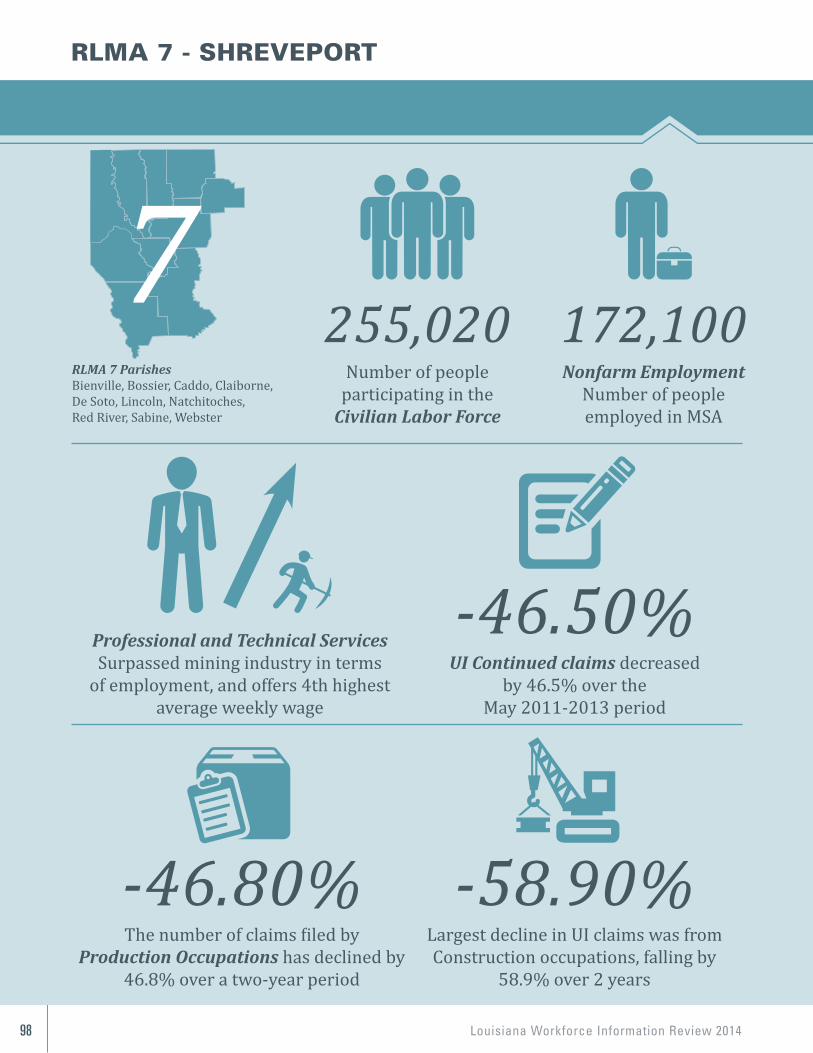
Louisiana Workforce Information Review 201498
RLMA 7 ParishesBienville, Bossier, Caddo, Claiborne, De Soto, Lincoln, Natchitoches, Red River, Sabine, Webster
Nonfarm EmploymentNumber of peopleemployed in MSA
172,100
Largest decline in UI claims was from Construction occupations, falling by
58.9% over 2 years
-58.90%
Number of people participating in the
Civilian Labor Force
255,020
UI Continued claims decreasedby 46.5% over the
May 2011-2013 period
-46.50%
RLMA 7 - SHREVEPORT
Professional and Technical Services Surpassed mining industry in terms
of employment, and offers 4th highest average weekly wage
The number of claims filed by Production Occupations has declined by
46.8% over a two-year period
-46.80%
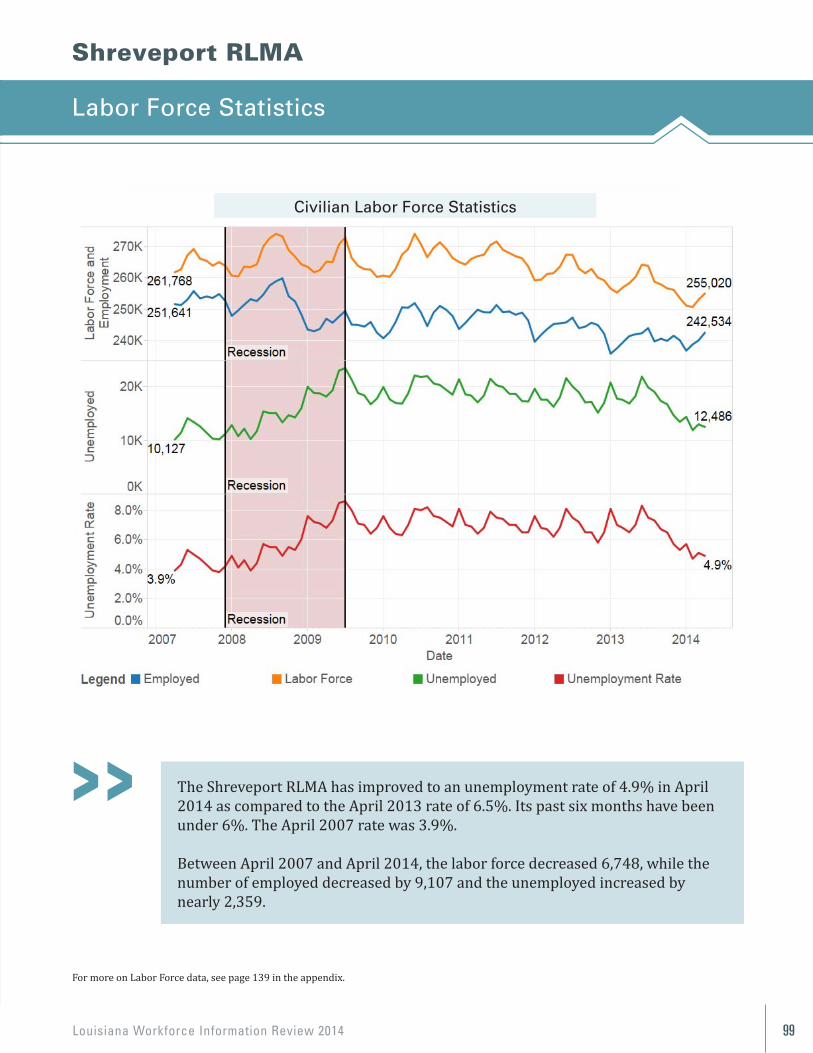
Louisiana Workforce Information Review 2014 99
102
Shreveport RLMA
LABOR FORCE STATISTICS The Shreveport RLMA has improved to an unemployment rate of 4.9% in April 2014 as compared to the April 2013 rate of 6.5%. It’s past six months have been under 6%. The April 2007 rate was 3.9%.
Between April 2007 and April 2014, the labor force decreased 6,748, while the number of employed decreased by 9,107 and the unemployed increased by nearly 2,359.
For more on Labor Force data, see page 118 in the appendix.
Civilian Labor Force Statistics
The Shreveport RLMA has improved to an unemployment rate of 4.9% in April 2014 as compared to the April 2013 rate of 6.5%. Its past six months have been under 6%. The April 2007 rate was 3.9%.
Between April 2007 and April 2014, the labor force decreased 6,748, while the number of employed decreased by 9,107 and the unemployed increased by nearly 2,359.
For more on Labor Force data, see page 139 in the appendix.
Shreveport RLMA
Labor Force Statistics
Civilian Labor Force Statistics
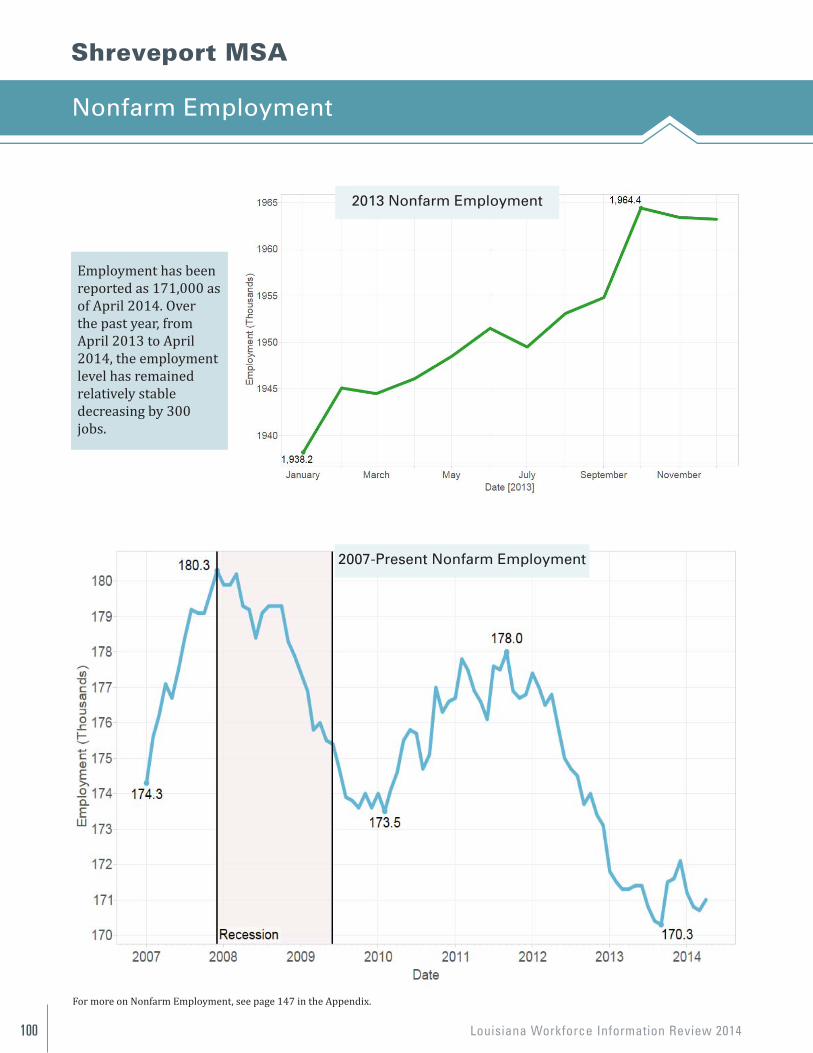
Louisiana Workforce Information Review 2014100
Shreveport MSA
Nonfarm Employment
Employment has been reported as 171,000 as of April 2014. Overthe past year, from April 2013 to April 2014, the employment level has remainedrelatively stable decreasing by 300 jobs.
103
NONFARM EMPLOYMENT
Shreveport MSA
Employment has been reported as 171,000 as of April 2014. Over the past year, from April 2013 to April 2014, the employment level has remained relatively stable decreasing by 300 jobs.
For more on Nonfarm Employment, see page 126 in the Appendix.
2013 Nonfarm Employment
2007—Present Nonfarm Employment
For more on Nonfarm Employment, see page 147 in the Appendix. 103
NONFARM EMPLOYMENT
Shreveport MSA
Employment has been reported as 171,000 as of April 2014. Over the past year, from April 2013 to April 2014, the employment level has remained relatively stable decreasing by 300 jobs.
For more on Nonfarm Employment, see page 126 in the Appendix.
2013 Nonfarm Employment
2007—Present Nonfarm Employment
2013 Nonfarm Employment
2007-Present Nonfarm Employment
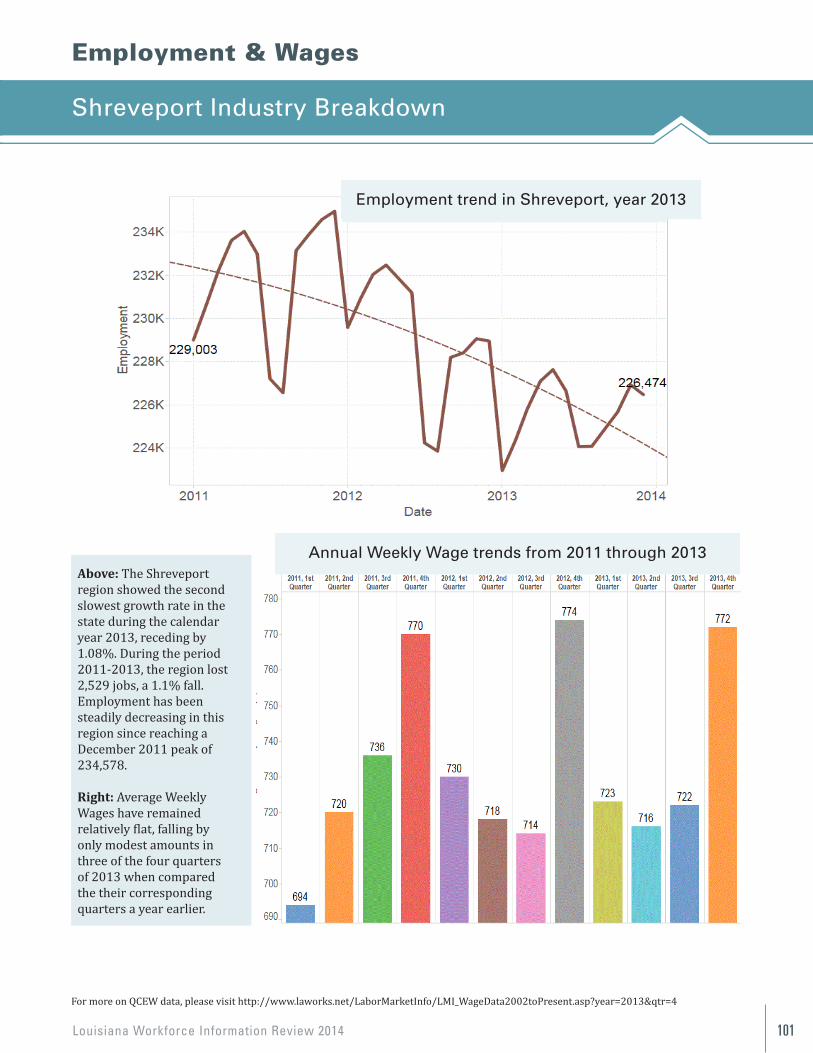
Louisiana Workforce Information Review 2014 101
Employment & Wages
Shreveport Industry Breakdown
For more on QCEW data, please visit http://www.laworks.net/LaborMarketInfo/LMI_WageData2002toPresent.asp?year=2013&qtr=4
Above: The Shreveportregion showed the secondslowest growth rate in thestate during the calendaryear 2013, receding by1.08%. During the period2011-2013, the region lost2,529 jobs, a 1.1% fall.Employment has beensteadily decreasing in thisregion since reaching aDecember 2011 peak of234,578.
Right: Average WeeklyWages have remainedrelatively flat, falling byonly modest amounts inthree of the four quartersof 2013 when comparedthe their correspondingquarters a year earlier.
104
SHREVEPORT INDUSTRY BREAKDOWN
QCEW
Above: The Shreveport region showed the second slowest growth rate in the state during the calendar year 2013, receding by 1.08%. During the period 2011-2013, the region lost 2,529 jobs, a 1.1% fall. Employment has been steadily decreasing in this region since reaching a December 2011 peak of 234,578. Right: Average Weekly Wages have remained relatively flat, falling by only modest amounts in three of the four quarters of 2013 when compared the their corresponding quarters a year earlier.
For more on QCEW data, please visit http://www.laworks.net/LaborMarketInfo/LMI_WageData2002toPresent.asp?year=2013&qtr=4
Employment Trend in Shreveport, year 2013
Average Weekly Wage trends from 2011 through 2013
Employment trend in Shreveport, year 2013
Annual Weekly Wage trends from 2011 through 2013
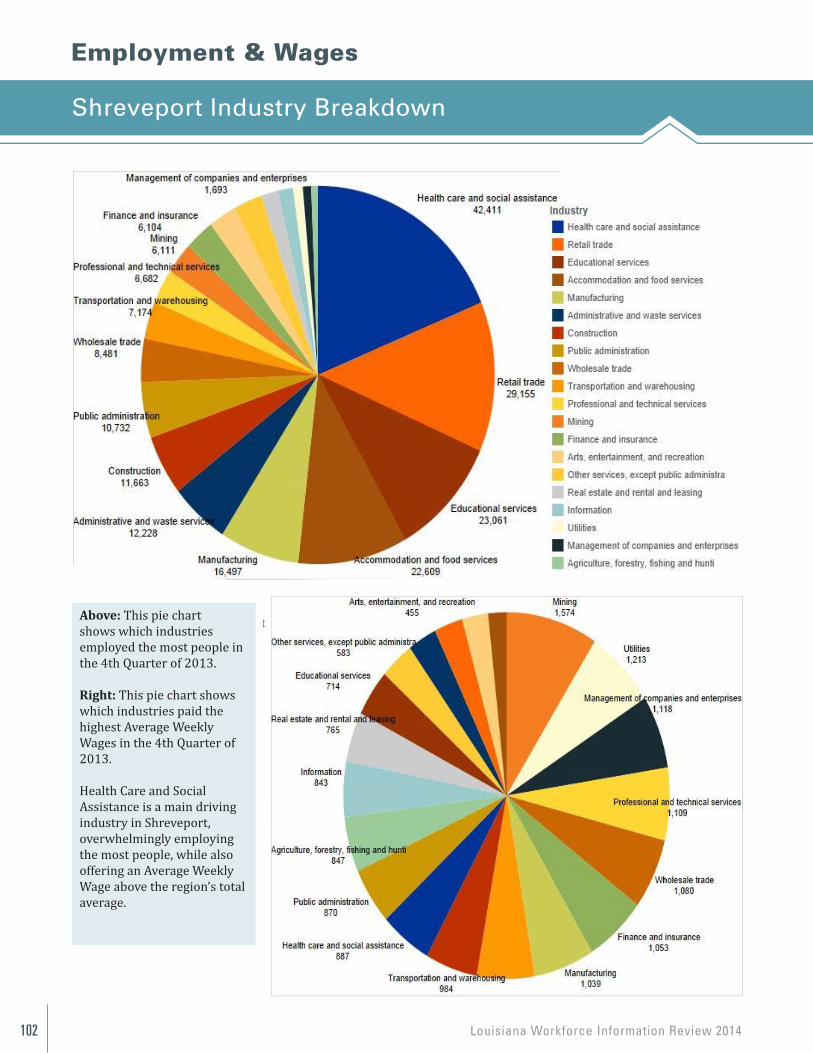
Louisiana Workforce Information Review 2014102
Employment & Wages
Shreveport Industry Breakdown
105
Above: This Pie Chart shows which industries employed the most people in the 4th Quarter of 2013. Right: This Pie Chart shows which industries paid the highest Average Weekly Wages in the 4th Quarter of 2013 Healthcare and Social Assistance is a main, driving industry in Shreveport, overwhelmingly employing the most people, while also offering an Average Weekly Wage above the region’s total average.
Above: This pie chartshows which industries employed the most people in the 4th Quarter of 2013.
Right: This pie chart shows which industries paid thehighest Average Weekly Wages in the 4th Quarter of 2013.
Health Care and SocialAssistance is a main driving industry in Shreveport,overwhelmingly employing the most people, while alsooffering an Average Weekly Wage above the region’s totalaverage.
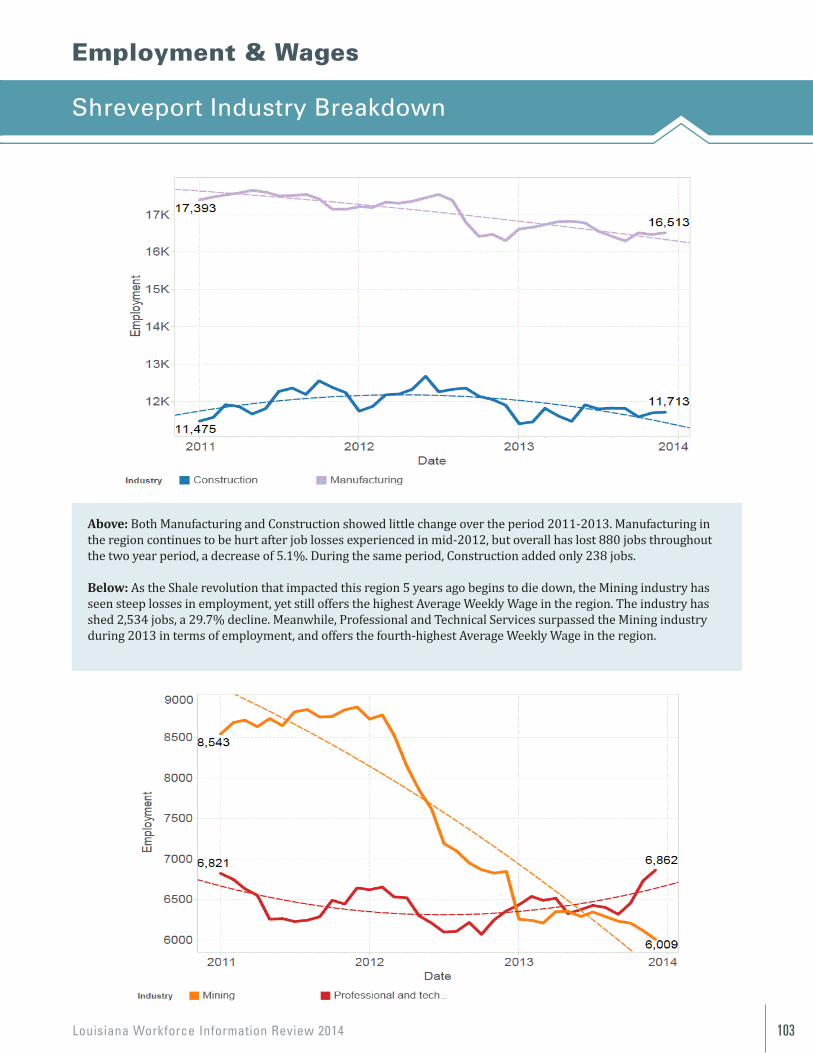
Louisiana Workforce Information Review 2014 103
Employment & Wages
Shreveport Industry Breakdown
Above: Both Manufacturing and Construction showed little change over the period 2011-2013. Manufacturing in the region continues to be hurt after job losses experienced in mid-2012, but overall has lost 880 jobs throughout the two year period, a decrease of 5.1%. During the same period, Construction added only 238 jobs.
Below: As the Shale revolution that impacted this region 5 years ago begins to die down, the Mining industry has seen steep losses in employment, yet still offers the highest Average Weekly Wage in the region. The industry has shed 2,534 jobs, a 29.7% decline. Meanwhile, Professional and Technical Services surpassed the Mining industry during 2013 in terms of employment, and offers the fourth-highest Average Weekly Wage in the region.
106
Above: Both Manufacturing and Construction showed little change over the period 2011-2013. Manufacturing in the region continues to be hurt after job losses experienced in mid-2012, but overall has lost 880 jobs throughout the two year period, a decrease of 5.1%. During the same period Construction added only 238 jobs. Below: As the Shale revolution that impacted this region 5 years ago begins to die down, the Mining industry has seen steep losses in employment, yet still offers the highest Average Weekly Wage in the region. The industry has shed 2,534 jobs, a 29.7% decline. Meanwhile, Professional and Technical Services surpassed the Mining industry during 2013 in terms of employment, and offers the fourth highest Average Weekly Wage in the region.
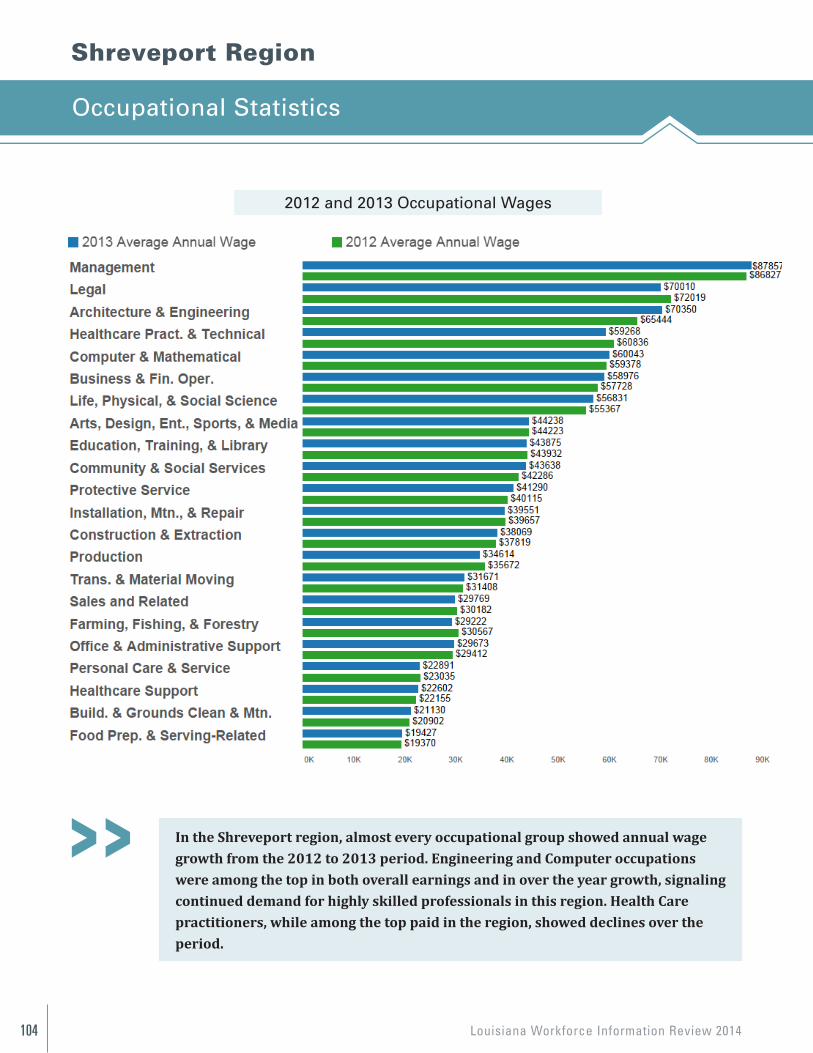
Louisiana Workforce Information Review 2014104
Shreveport Region
Occupational Statistics
107
Shreveport Region
OCCUPATIONAL STATISTICS 2012 and 2013 Occupational Annual Wages
In the Shreveport region, almost every occupational group showed annual wage growth from the 2012 to 2013 period. Engineering and Computer occupations were among the top in both overall earnings and in over the year growth, signaling continued demand for highly skilled professionals in this region. Health Care practitioners, while among the top paid in the region, showed declines over the period.
In the Shreveport region, almost every occupational group showed annual wagegrowth from the 2012 to 2013 period. Engineering and Computer occupations were among the top in both overall earnings and in over the year growth, signalingcontinued demand for highly skilled professionals in this region. Health Carepractitioners, while among the top paid in the region, showed declines over the period.
2012 and 2013 Occupational Wages
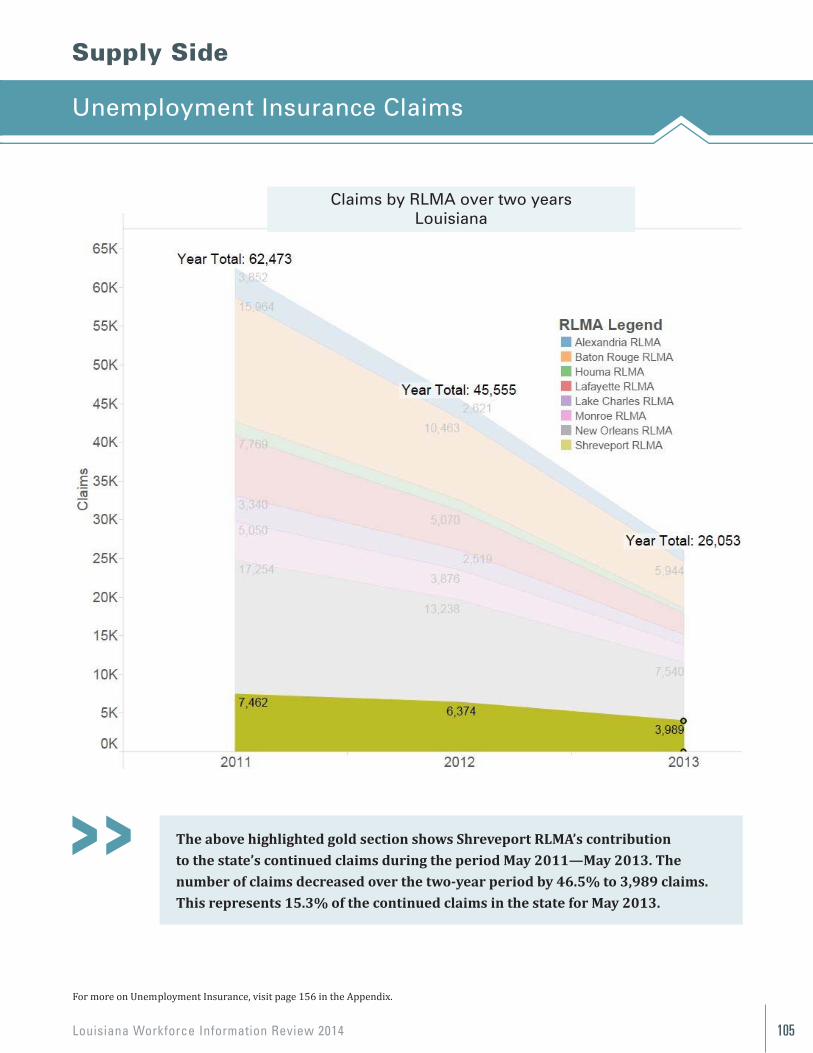
Louisiana Workforce Information Review 2014 105
Supply Side
Unemployment Insurance Claims
108
Supply Side
UNEMPLOYMENT INSURANCE CLAIMS
The above highlighted gold section shows Shreveport RLMA’s contribution to the state’s continued claims during the period May 2011—May 2013. The number of claims decreased over the two year period by 46.5% to 3,989 claims. This represents 15.3% of the continued claims in the state for May 2013.
For more on Unemployment Insurance, visit page 135 in the Appendix
The above highlighted gold section shows Shreveport RLMA’s contributionto the state’s continued claims during the period May 2011—May 2013. The number of claims decreased over the two-year period by 46.5% to 3,989 claims. This represents 15.3% of the continued claims in the state for May 2013.
Claims by RLMA over two yearsLouisiana
For more on Unemployment Insurance, visit page 156 in the Appendix.
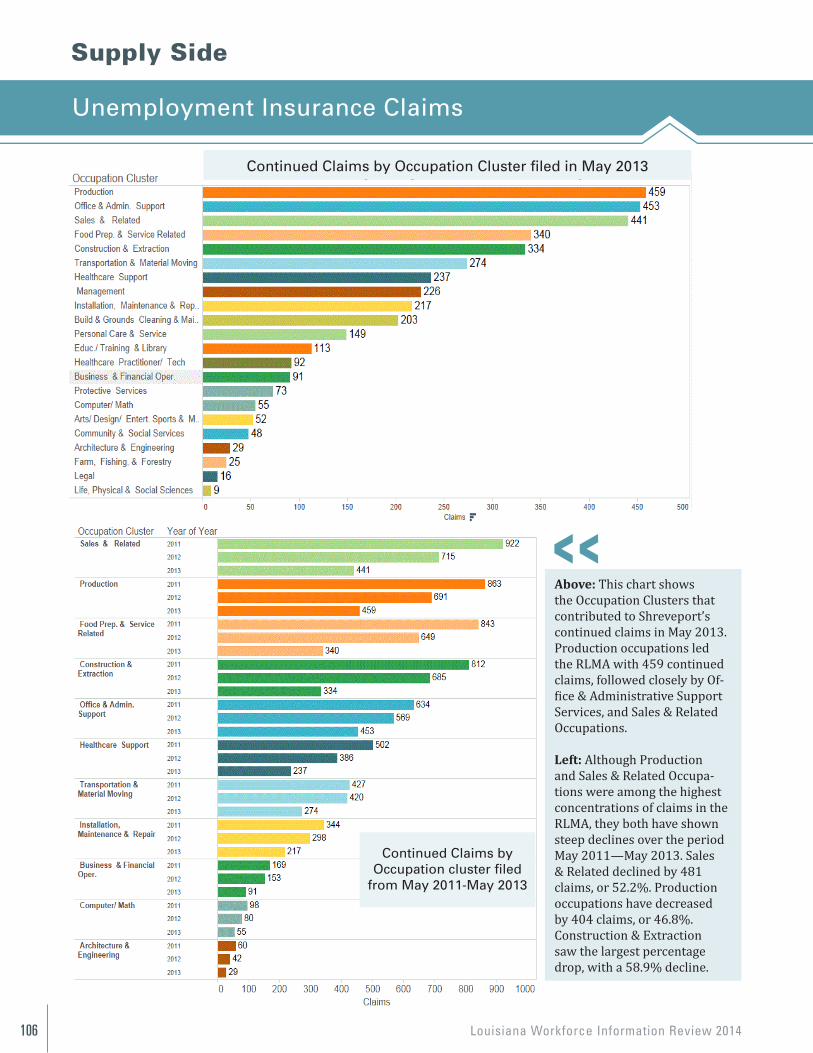
Louisiana Workforce Information Review 2014106
Supply Side
Unemployment Insurance Claims
Above: This chart shows the Occupation Clusters that contributed to Shreveport’s continued claims in May 2013. Production occupations led the RLMA with 459 continued claims, followed closely by Of-fice & Administrative SupportServices, and Sales & Related Occupations.
Left: Although Productionand Sales & Related Occupa-tions were among the highest concentrations of claims in the RLMA, they both have shown steep declines over the periodMay 2011—May 2013. Sales & Related declined by 481 claims, or 52.2%. Production occupations have decreasedby 404 claims, or 46.8%.Construction & Extractionsaw the largest percentagedrop, with a 58.9% decline.
109
Above: This chart shows the Occupation Clusters that contributed to Shreveport’s continued claims in May 2013. Production occupations led the RLMA with 459 continued claims, followed closely by Office & Administrative Support Services, and Sales & Related Occupations. Left Although Production and Sales & Related Occupations were among the highest concentrations of claims in the RLMA, they both have shown steep declines over the period May 2011—May 2013. Sales & Related has declined by 481 claims, or 52.2%. Production occupations have decreased by 404 claims, or 46.8%. Construction & Extraction saw the largest percentage drop, with a 58.9% decline.
Continued Claims by Occupation Cluster filed in May 2013
Continued Claims by Occupation cluster
filed from May 2011—May 2013
Continued Claims by Occupation Cluster filed in May 2013
Continued Claims byOccupation cluster filed
from May 2011-May 2013
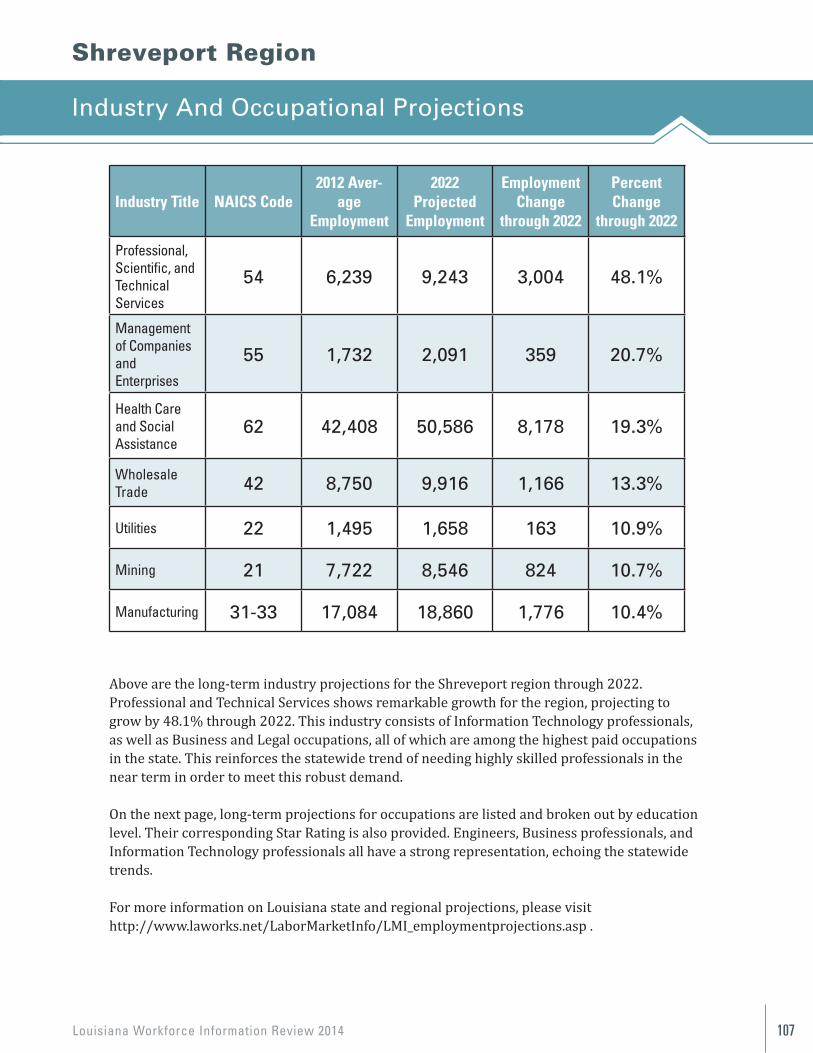
Louisiana Workforce Information Review 2014 107
Shreveport Region
Industry And Occupational Projections
Industry Title NAICS Code2012 Aver-
ageEmployment
2022 Projected
Employment
EmploymentChange
through 2022
PercentChange
through 2022
Professional,Scientific, andTechnical Services
54 6,239 9,243 3,004 48.1%
Management of Companies and Enterprises
55 1,732 2,091 359 20.7%
Health Care and Social Assistance
62 42,408 50,586 8,178 19.3%
Wholesale Trade 42 8,750 9,916 1,166 13.3%
Utilities 22 1,495 1,658 163 10.9%
Mining 21 7,722 8,546 824 10.7%
Manufacturing 31-33 17,084 18,860 1,776 10.4%
Above are the long-term industry projections for the Shreveport region through 2022. Professional and Technical Services shows remarkable growth for the region, projecting to grow by 48.1% through 2022. This industry consists of Information Technology professionals, as well as Business and Legal occupations, all of which are among the highest paid occupations in the state. This reinforces the statewide trend of needing highly skilled professionals in the near term in order to meet this robust demand.
On the next page, long-term projections for occupations are listed and broken out by educationlevel. Their corresponding Star Rating is also provided. Engineers, Business professionals, andInformation Technology professionals all have a strong representation, echoing the statewidetrends.
For more information on Louisiana state and regional projections, please visit http://www.laworks.net/LaborMarketInfo/LMI_employmentprojections.asp .
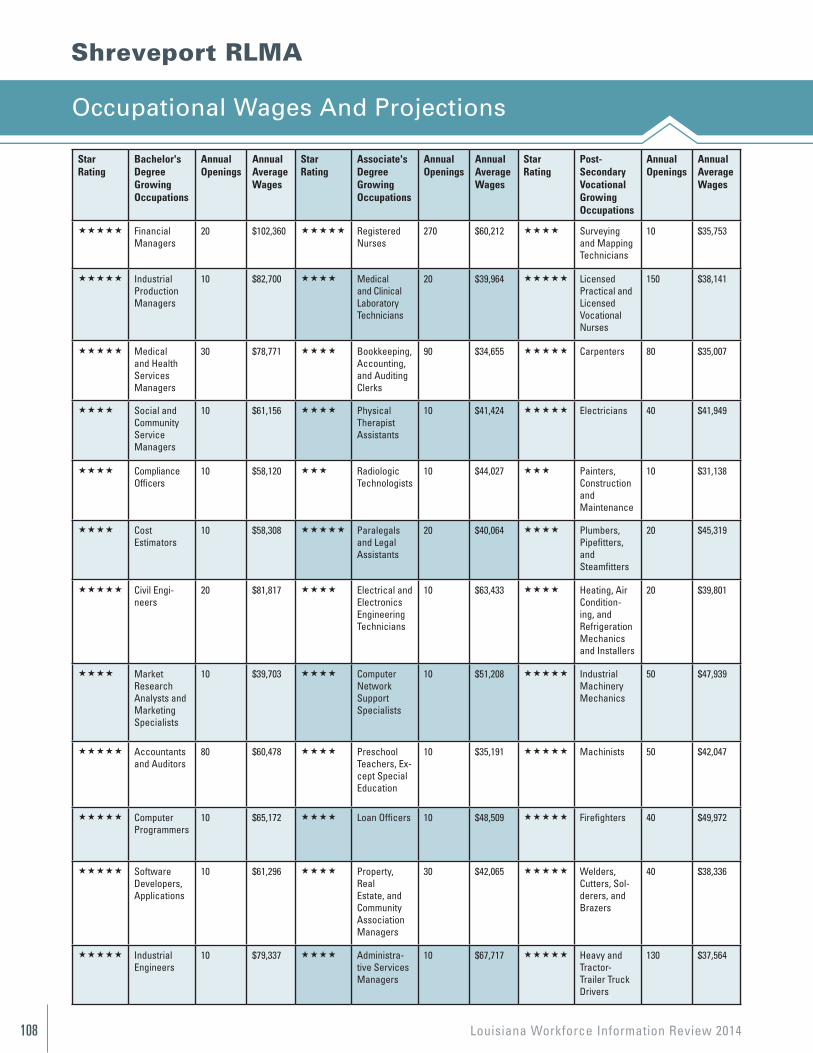
Louisiana Workforce Information Review 2014108
Shreveport RLMA
Occupational Wages And Projections
StarRating
Bachelor's Degree Growing Occupations
Annual Openings
Annual Average Wages
StarRating
Associate's Degree Growing Occupations
Annual Openings
Annual Average Wages
StarRating
Post-Secondary Vocational Growing Occupations
Annual Openings
Annual Average Wages
Financial Managers
20 $102,360 Registered Nurses
270 $60,212 Surveying and Mapping Technicians
10 $35,753
Industrial Production Managers
10 $82,700 Medical and Clinical Laboratory Technicians
20 $39,964 Licensed Practical and Licensed Vocational Nurses
150 $38,141
Medical and Health Services Managers
30 $78,771 Bookkeeping, Accounting, and Auditing Clerks
90 $34,655 Carpenters 80 $35,007
Social and Community Service Managers
10 $61,156 Physical Therapist Assistants
10 $41,424 Electricians 40 $41,949
Compliance Officers
10 $58,120 Radiologic Technologists
10 $44,027 Painters, Construction andMaintenance
10 $31,138
Cost Estimators
10 $58,308 Paralegals and Legal Assistants
20 $40,064 Plumbers, Pipefitters, and Steamfitters
20 $45,319
Civil Engi-neers
20 $81,817 Electrical and Electronics Engineering Technicians
10 $63,433 Heating, Air Condition-ing, and Refrigeration Mechanics and Installers
20 $39,801
Market Research Analysts and Marketing Specialists
10 $39,703 Computer Network Support Specialists
10 $51,208 Industrial Machinery Mechanics
50 $47,939
Accountants and Auditors
80 $60,478 Preschool Teachers, Ex-cept Special Education
10 $35,191 Machinists 50 $42,047
Computer Programmers
10 $65,172 Loan Officers 10 $48,509 Firefighters 40 $49,972
Software Developers, Applications
10 $61,296 Property,Real Estate, and Community Association Managers
30 $42,065 Welders, Cutters, Sol-derers, and Brazers
40 $38,336
Industrial Engineers
10 $79,337 Administra-tive Services Managers
10 $67,717 Heavy and Tractor-Trailer Truck Drivers
130 $37,564
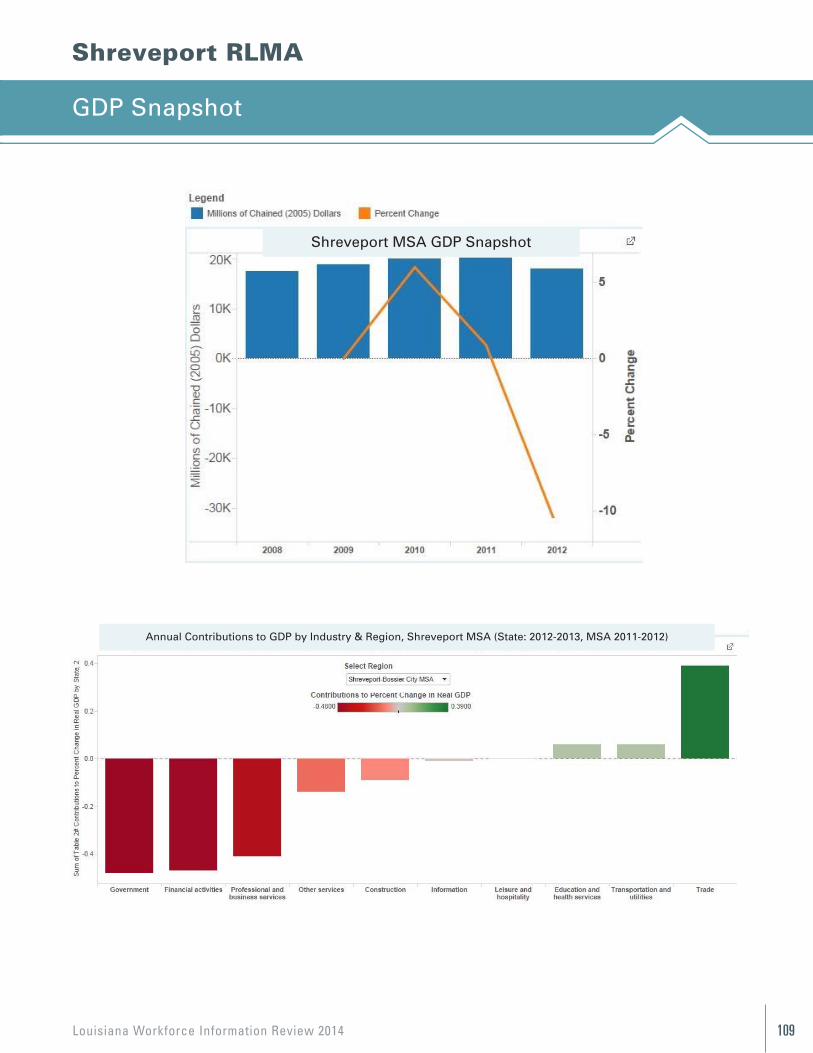
Louisiana Workforce Information Review 2014 109
Shreveport RLMA
GDP Snapshot
112
Volume 1, Issue 1 Newsletter Date
Shreveport RLMA
112
Volume 1, Issue 1 Newsletter Date
Shreveport RLMA
Shreveport MSA GDP Snapshot
Annual Contributions to GDP by Industry & Region, Shreveport MSA (State: 2012-2013, MSA 2011-2012)
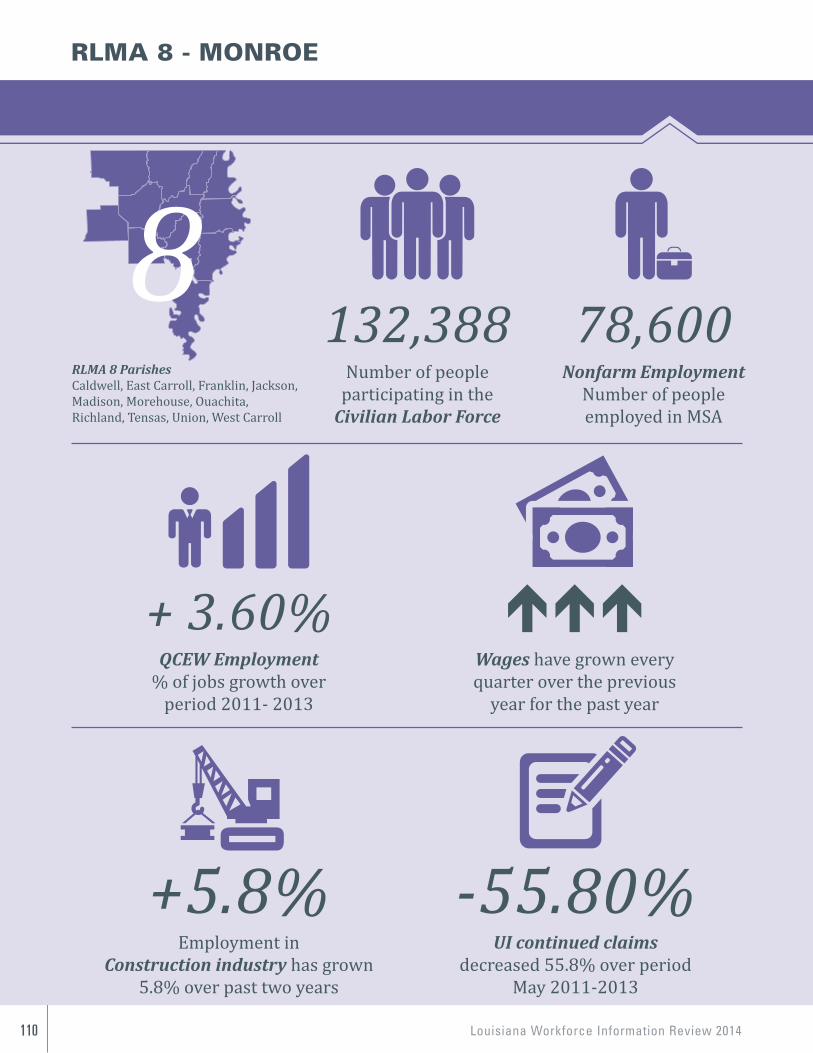
Louisiana Workforce Information Review 2014110
RLMA 8 ParishesCaldwell, East Carroll, Franklin, Jackson, Madison, Morehouse, Ouachita, Richland, Tensas, Union, West Carroll
Number of people participating in the
Civilian Labor Force
132,388
UI continued claims decreased 55.8% over period
May 2011-2013
-55.80%
RLMA 8 - MONROE
QCEW Employment% of jobs growth over
period 2011- 2013
+ 3.60%Wages have grown every quarter over the previous
year for the past year
Employment in Construction industry has grown
5.8% over past two years
+5.8%
Nonfarm EmploymentNumber of peopleemployed in MSA
78,600
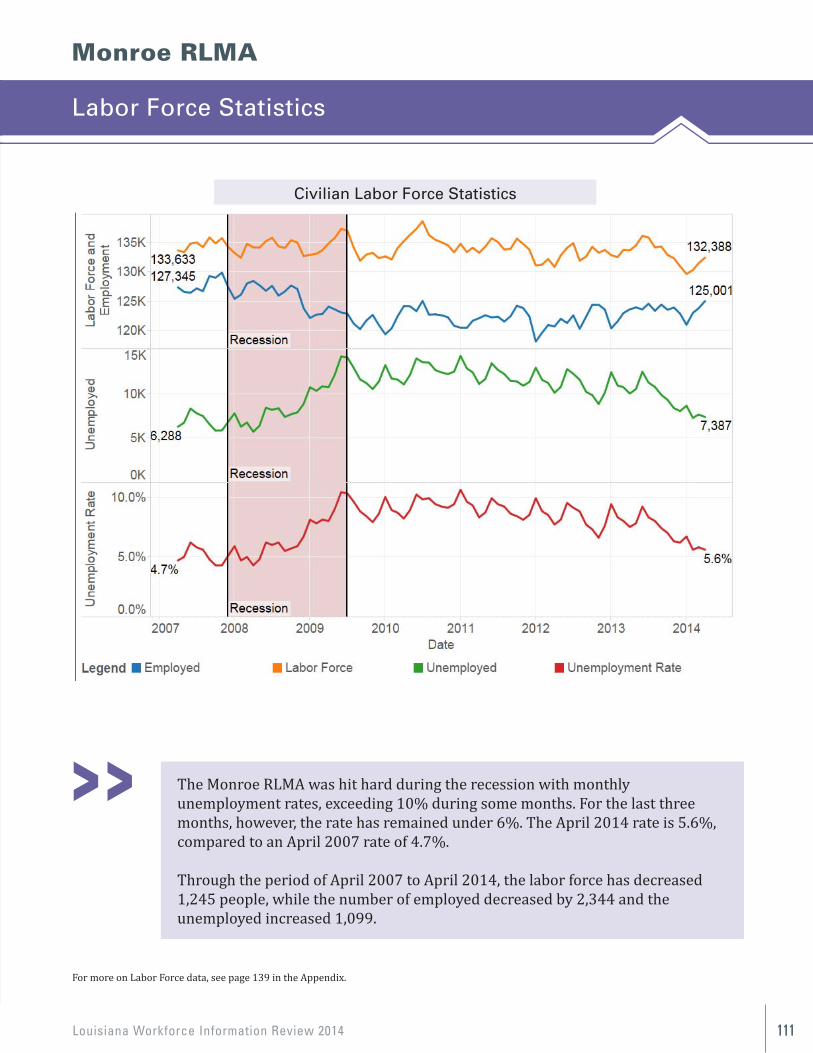
Louisiana Workforce Information Review 2014 111
114
Monroe RLMA
LABOR FORCE STATISTICS The Monroe RLMA was hit hard during the recession with monthly unemployment rates then exceeding 10% during some months. For the last three months, however, the rate has remained under 6%. The April 2014 rate is 5.6%, compared to an April 2007 rate of 4.7%.
Through the period of April 2007 to April 2014, the labor force has decreased 1,245 people, while the number of employed decreased by 2,344 and the unemployed increased 1,099.
For more on Labor Force data, see page 118 in the appendix.
Civilian Labor Force Statistics
The Monroe RLMA was hit hard during the recession with monthly unemployment rates, exceeding 10% during some months. For the last three months, however, the rate has remained under 6%. The April 2014 rate is 5.6%, compared to an April 2007 rate of 4.7%.
Through the period of April 2007 to April 2014, the labor force has decreased 1,245 people, while the number of employed decreased by 2,344 and the unemployed increased 1,099.
For more on Labor Force data, see page 139 in the Appendix.
Monroe RLMA
Labor Force Statistics
Civilian Labor Force StatisticsCivilian Labor Force Statistics
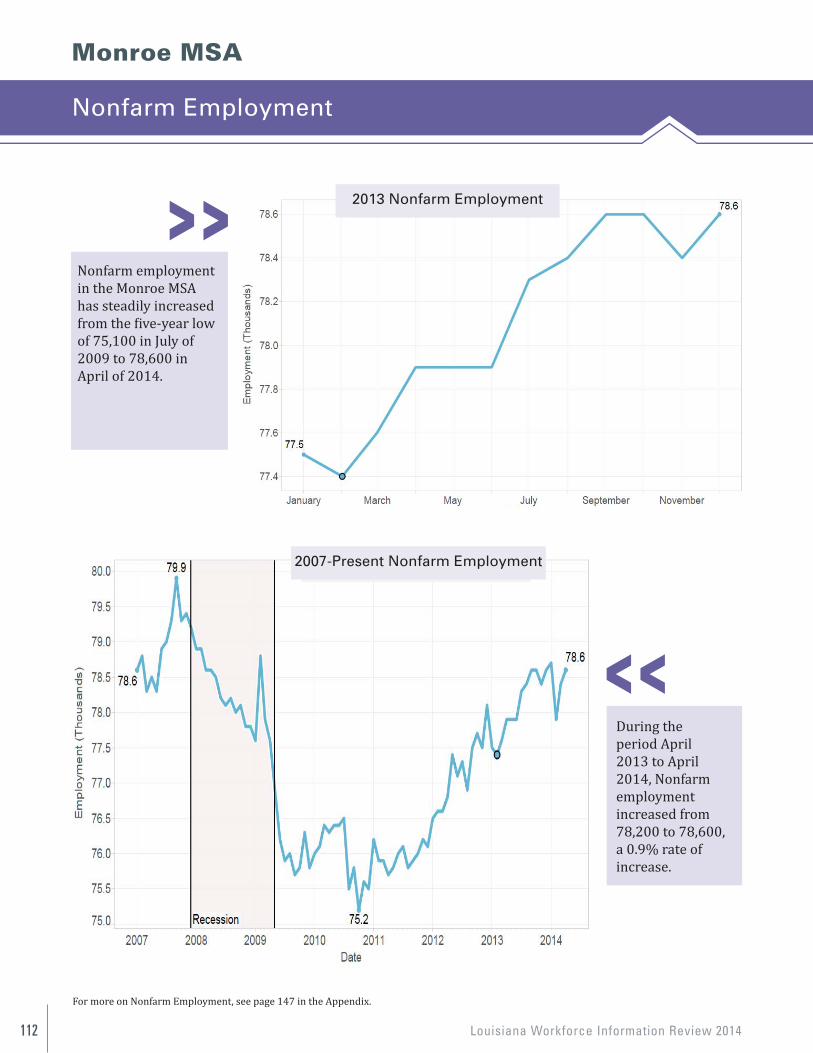
Louisiana Workforce Information Review 2014112
Monroe MSA
Nonfarm Employment
Nonfarm employment in the Monroe MSA has steadily increased from the five-year lowof 75,100 in July of 2009 to 78,600 in April of 2014.
115
NONFARM EMPLOYMENT
Monroe MSA
The nonfarm employment in the Monroe MSA has steadily increased from the five year low of 75,100 in July of 2009 to 78,600 in April of 2014.
During the period April 2013 to April 2014, Nonfarm employmentincreased from 78,200 to 78,600, a 0.9% rate of increase.
For more on Nonfarm Employment, see page 126 in the Appendix.
2013 Nonfarm Employment
2007—Present Nonfarm Employment
For more on Nonfarm Employment, see page 147 in the Appendix. 115
NONFARM EMPLOYMENT
Monroe MSA
The nonfarm employment in the Monroe MSA has steadily increased from the five year low of 75,100 in July of 2009 to 78,600 in April of 2014.
During the period April 2013 to April 2014, Nonfarm employmentincreased from 78,200 to 78,600, a 0.9% rate of increase.
For more on Nonfarm Employment, see page 126 in the Appendix.
2013 Nonfarm Employment
2007—Present Nonfarm Employment
During theperiod April2013 to April2014, Nonfarmemploymentincreased from78,200 to 78,600,a 0.9% rate ofincrease.
2013 Nonfarm Employment
2007-Present Nonfarm Employment
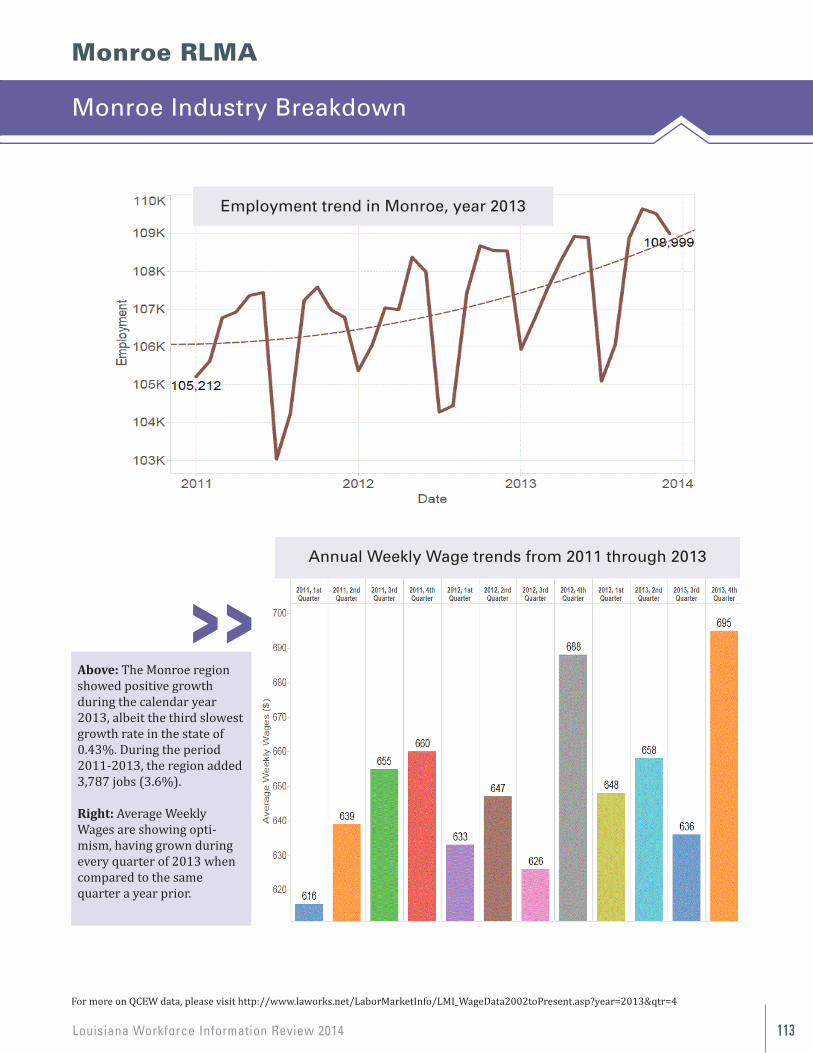
Louisiana Workforce Information Review 2014 113
Monroe RLMA
For more on QCEW data, please visit http://www.laworks.net/LaborMarketInfo/LMI_WageData2002toPresent.asp?year=2013&qtr=4
Above: The Monroe region showed positive growth during the calendar year 2013, albeit the third slowestgrowth rate in the state of 0.43%. During the period 2011-2013, the region added 3,787 jobs (3.6%).
Right: Average Weekly Wages are showing opti-mism, having grown during every quarter of 2013 when compared to the same quarter a year prior.
116
MONROE INDUSTRY BREAKDOWN
Business Name
Above: The Monroe region showed positive growth during the calendar year 2013, albeit the third slowest growth rate in the state of 0.43%. During the period 2011-2013, the region added 3,787 jobs, an addition of 3.6%. Right: Average Weekly Wages are showing optimism, having grown during every quarter of 2013 when compared to the same quarter a year prior.
For more on QCEW data, please visit http://www.laworks.net/LaborMarketInfo/LMI_WageData2002toPresent.asp?year=2013&qtr=4
Employment Trend in Monroe, year 2013
Average Weekly Wage trends from 2011 through 2013
Monroe Industry Breakdown
Employment trend in Monroe, year 2013
Annual Weekly Wage trends from 2011 through 2013
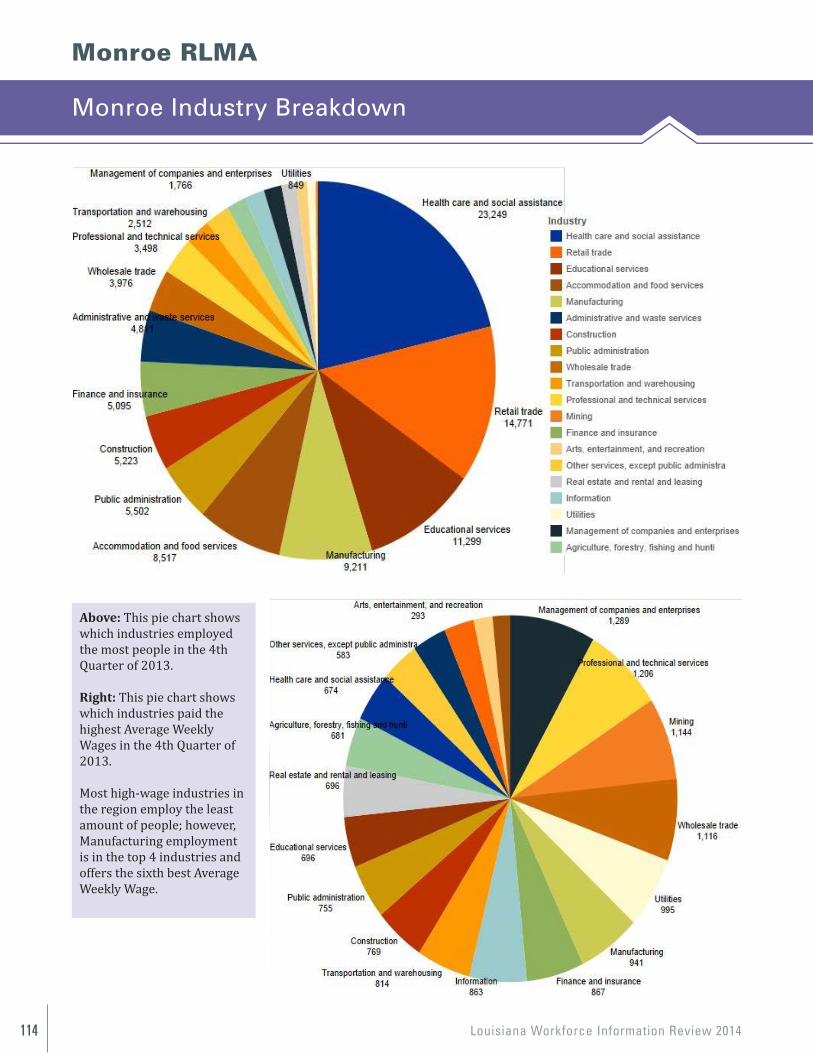
Louisiana Workforce Information Review 2014114
Monroe RLMA
Monroe Industry Breakdown
117
Above: This Pie Chart shows which industries employed the most people in the 4th Quarter of 2013. Right: This Pie Chart shows which industries paid the highest Average Weekly Wages in the 4th Quarter of 2013 Most of the high wage industries in the region employ the least amount of people. However, Manufacturing employment is in the top 4 industries, as well as offering the sixth best Average Weekly Wage. 117
Above: This Pie Chart shows which industries employed the most people in the 4th Quarter of 2013. Right: This Pie Chart shows which industries paid the highest Average Weekly Wages in the 4th Quarter of 2013 Most of the high wage industries in the region employ the least amount of people. However, Manufacturing employment is in the top 4 industries, as well as offering the sixth best Average Weekly Wage.
Above: This pie chart shows which industries employedthe most people in the 4th Quarter of 2013.
Right: This pie chart shows which industries paid thehighest Average Weekly Wages in the 4th Quarter of 2013.
Most high-wage industries in the region employ the least amount of people; however, Manufacturing employment is in the top 4 industries and offers the sixth best Average Weekly Wage.
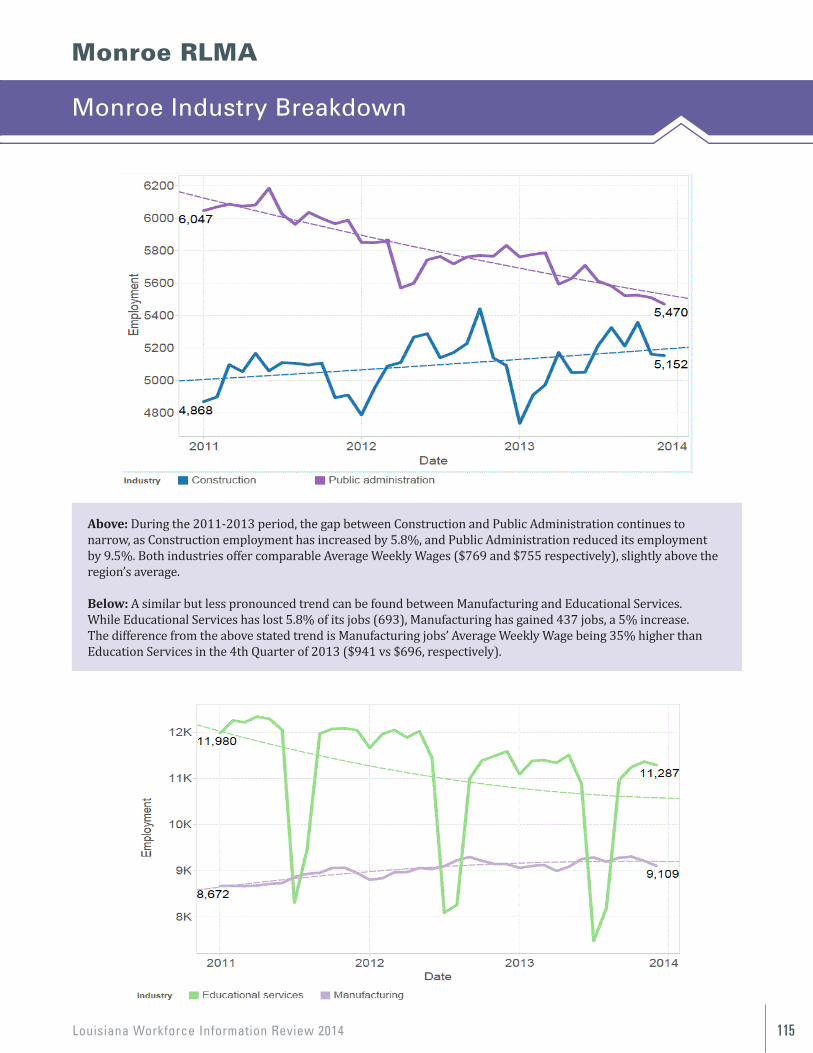
Louisiana Workforce Information Review 2014 115
Monroe RLMA
Monroe Industry Breakdown
Above: During the 2011-2013 period, the gap between Construction and Public Administration continues to narrow, as Construction employment has increased by 5.8%, and Public Administration reduced its employment by 9.5%. Both industries offer comparable Average Weekly Wages ($769 and $755 respectively), slightly above the region’s average.
Below: A similar but less pronounced trend can be found between Manufacturing and Educational Services. While Educational Services has lost 5.8% of its jobs (693), Manufacturing has gained 437 jobs, a 5% increase. The difference from the above stated trend is Manufacturing jobs’ Average Weekly Wage being 35% higher than Education Services in the 4th Quarter of 2013 ($941 vs $696, respectively).
118
Above: During the 2011-2013 period, the gap between Construction and Public Administration continues to narrow, as Construction employment has increased by 5.8%, and Public Administration reduced it’s employment by 9.5%. Both industries offer comparable Average Weekly Wages ($769 and $755 respectively), slightly above the region’s average. Below: A similar but less pronounced trend can be found between Manufacturing and Educational Services. While Educational Services has lost 5.8% of it’s jobs (693), Manufacturing has gained 437 jobs, a 5% increase. The difference from the stated trend above is that Manufacturing jobs offer an Average Weekly Wage that was 35% higher than Education Services in the 4th Quarter of 2013 ($941 vs $696 respectively).
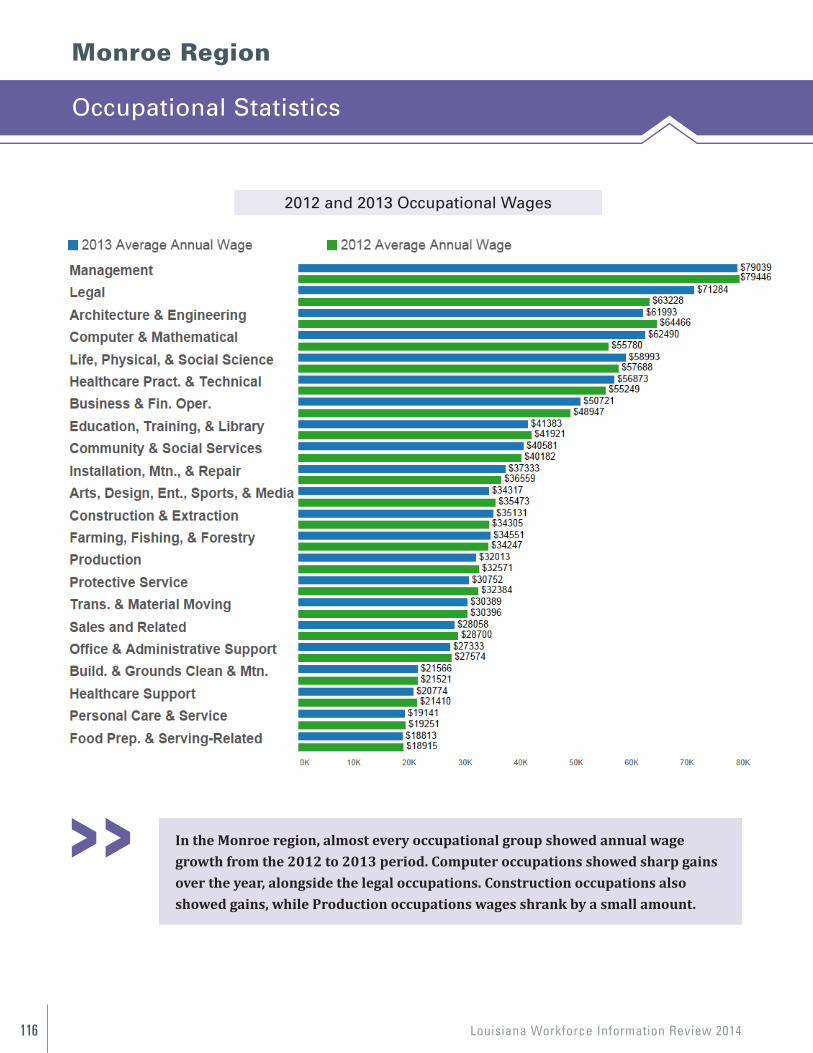
Louisiana Workforce Information Review 2014116
Monroe Region
Occupational Statistics
119
Monroe Region
OCCUPATIONAL STATISTICS 2012 and 2013 Occupational Annual Wages
In the Monroe region, almost every occupational group showed annual wage growth from the 2012 to 2013 period. Computer occupations showed sharp gains over the year, alongside the legal occupations. Construction occupations also showed gains, while Production occupations wages shrank by a small amount.
In the Monroe region, almost every occupational group showed annual wagegrowth from the 2012 to 2013 period. Computer occupations showed sharp gainsover the year, alongside the legal occupations. Construction occupations alsoshowed gains, while Production occupations wages shrank by a small amount.
2012 and 2013 Occupational Wages
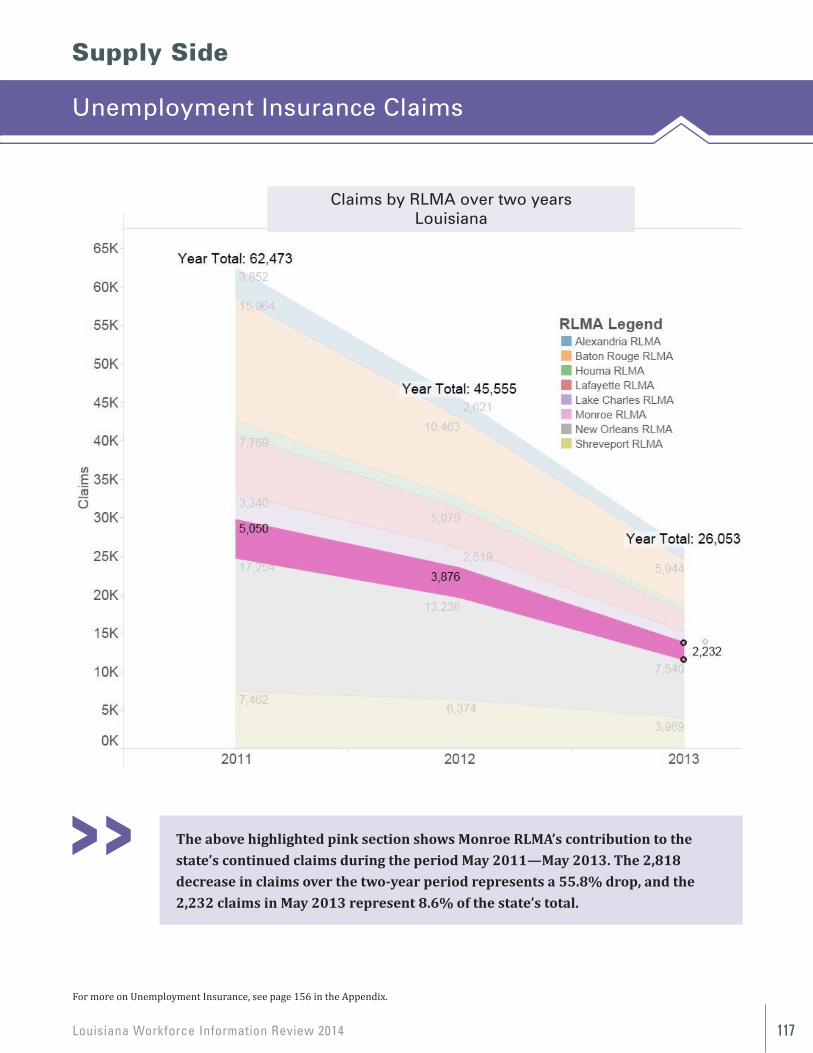
Louisiana Workforce Information Review 2014 117
Supply Side
Unemployment Insurance Claims
120
Supply Side
The above highlighted pink section shows Monroe RLMA’s contribution to the state’s continued claims during the period May 2011—May 2013. The 2,818 decrease in claims over the two year period represents a 55.8% drop, and the 2,232 claims in May 2013 represent 8.6% of the state’s total.
For more on Unemployment Insurance, visit page 135 in the Appendix
The above highlighted pink section shows Monroe RLMA’s contribution to the state’s continued claims during the period May 2011—May 2013. The 2,818 decrease in claims over the two-year period represents a 55.8% drop, and the 2,232 claims in May 2013 represent 8.6% of the state’s total.
Claims by RLMA over two yearsLouisiana
For more on Unemployment Insurance, see page 156 in the Appendix.
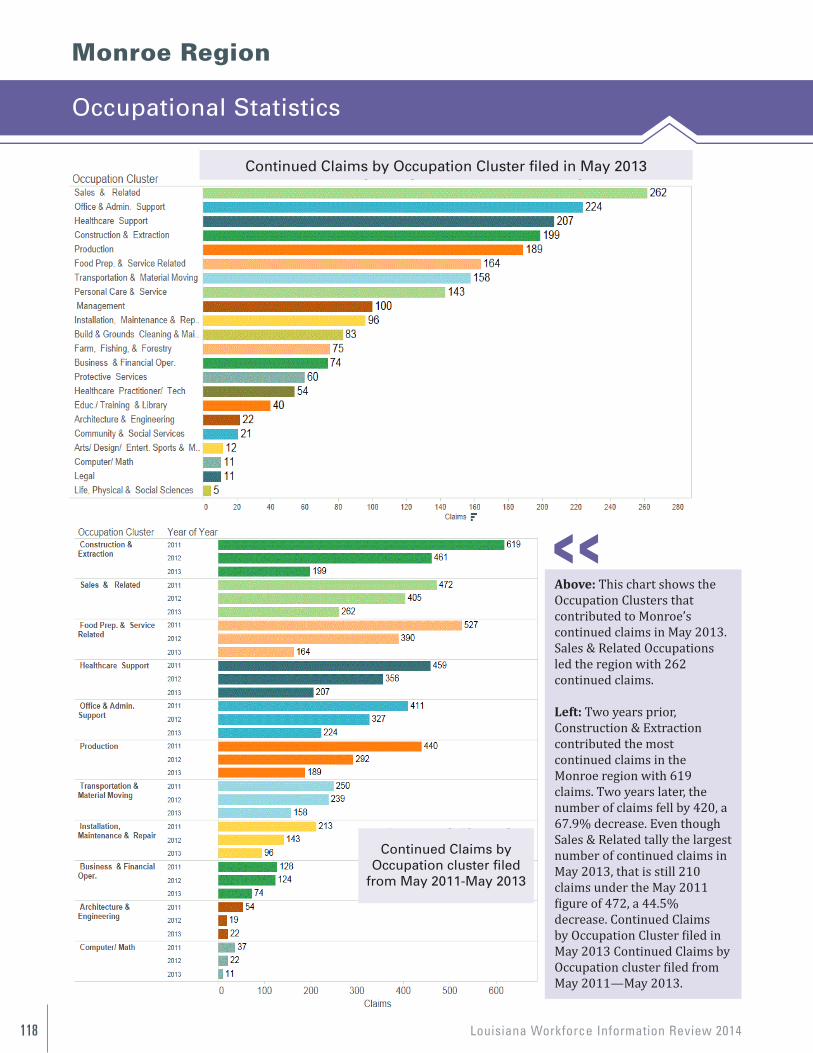
Louisiana Workforce Information Review 2014118
Monroe Region
Occupational Statistics
Above: This chart shows the Occupation Clusters that contributed to Monroe’s continued claims in May 2013. Sales & Related Occupations led the region with 262 continued claims.
Left: Two years prior, Construction & Extraction contributed the mostcontinued claims in the Monroe region with 619 claims. Two years later, the number of claims fell by 420, a 67.9% decrease. Even thoughSales & Related tally the largest number of continued claims in May 2013, that is still 210claims under the May 2011 figure of 472, a 44.5% decrease. Continued Claims by Occupation Cluster filed in May 2013 Continued Claims by Occupation cluster filed from May 2011—May 2013.
121
Above: This chart shows the Occupation Clusters that contributed to Monroe’s continued claims in May 2013. Sales & Related Occupations led the region with 262 continued claims. Left: This was not the case two years prior. Construction & Extraction contributed the most continued claims in the Monroe region then, with 619 claims. Two years later, the number of claims fell by 420, a 67.9% decrease. Even though Sales & Related tally the largest number of continued claims in May 2013, that is still 210 claims under the May 2011 figure of 472, a 44.5% decrease.
Continued Claims by Occupation Cluster filed in May 2013
Continued Claims by Occupation cluster
filed from May 2011—May 2013
Continued Claims by Occupation Cluster filed in May 2013
Continued Claims byOccupation cluster filed
from May 2011-May 2013
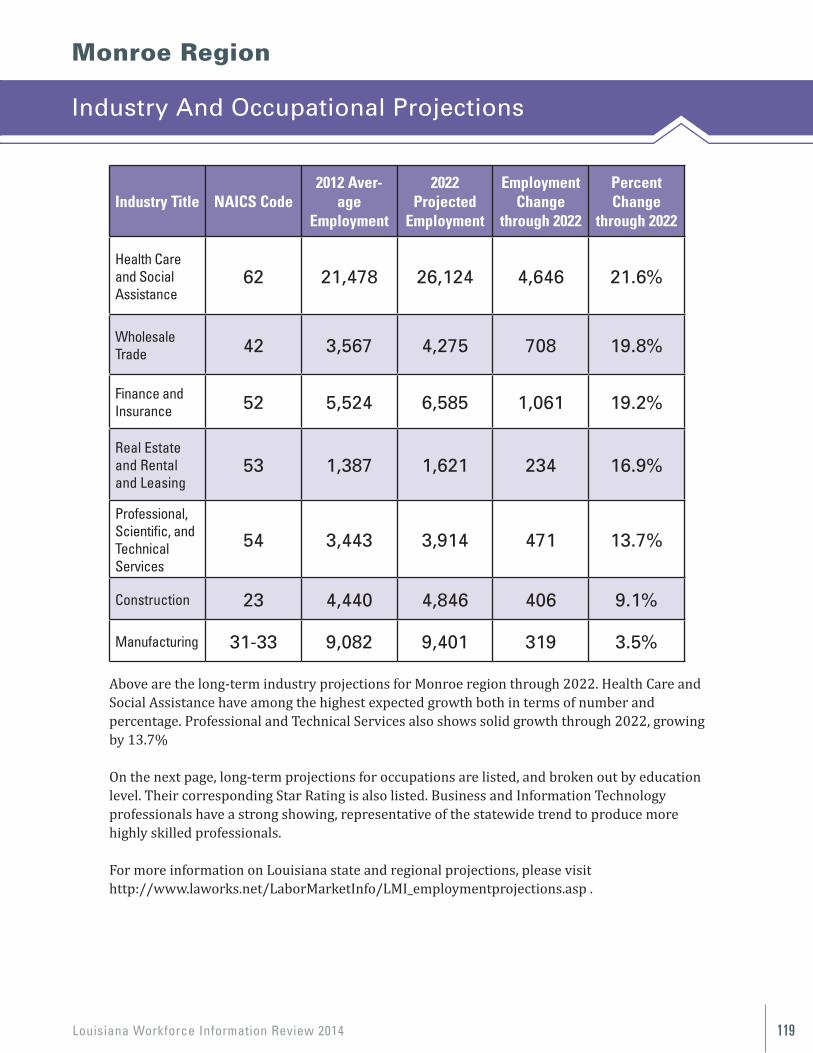
Louisiana Workforce Information Review 2014 119
Monroe Region
Industry And Occupational Projections
Industry Title NAICS Code2012 Aver-
ageEmployment
2022 Projected
Employment
EmploymentChange
through 2022
PercentChange
through 2022
Health Care and Social Assistance
62 21,478 26,124 4,646 21.6%
Wholesale Trade 42 3,567 4,275 708 19.8%
Finance andInsurance 52 5,524 6,585 1,061 19.2%
Real Estate and Rental and Leasing
53 1,387 1,621 234 16.9%
Professional,Scientific, andTechnical Services
54 3,443 3,914 471 13.7%
Construction 23 4,440 4,846 406 9.1%
Manufacturing 31-33 9,082 9,401 319 3.5%
Above are the long-term industry projections for Monroe region through 2022. Health Care andSocial Assistance have among the highest expected growth both in terms of number and percentage. Professional and Technical Services also shows solid growth through 2022, growingby 13.7%
On the next page, long-term projections for occupations are listed, and broken out by educationlevel. Their corresponding Star Rating is also listed. Business and Information Technologyprofessionals have a strong showing, representative of the statewide trend to produce morehighly skilled professionals.
For more information on Louisiana state and regional projections, please visit http://www.laworks.net/LaborMarketInfo/LMI_employmentprojections.asp .
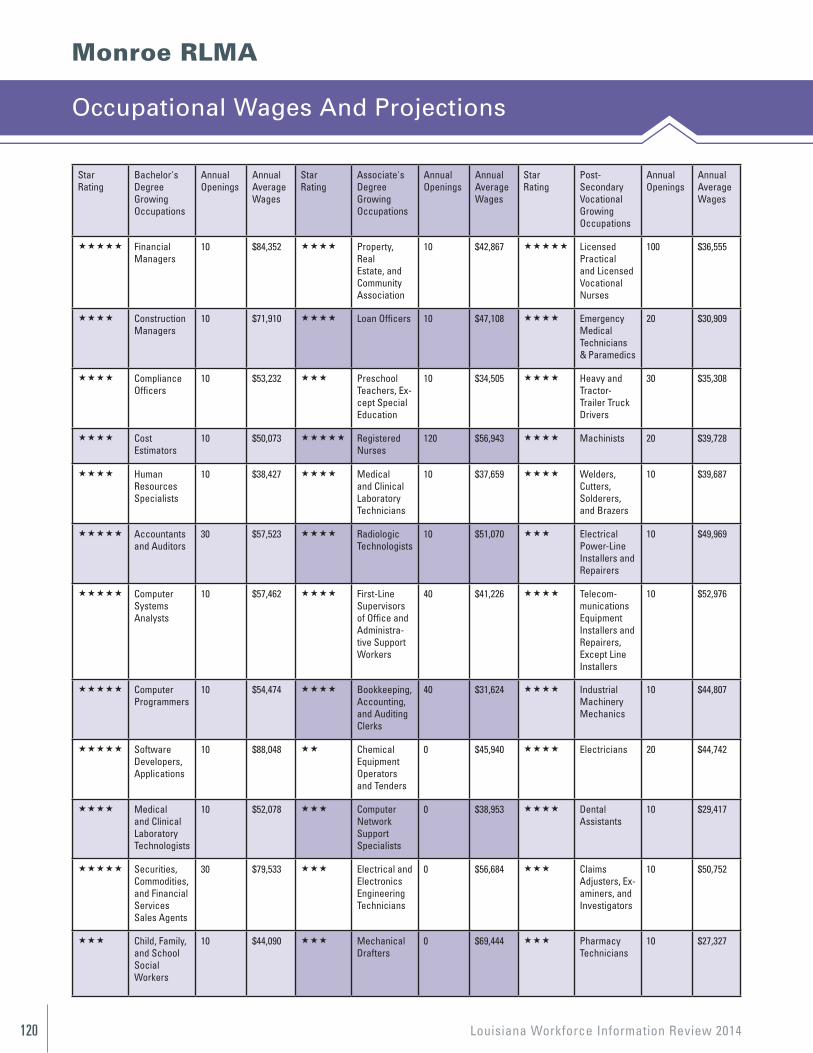
Louisiana Workforce Information Review 2014120
Monroe RLMA
Occupational Wages And Projections
StarRating
Bachelor's Degree Growing Occupations
Annual Openings
Annual Average Wages
StarRating
Associate's Degree Growing Occupations
Annual Openings
Annual Average Wages
StarRating
Post-Secondary Vocational Growing Occupations
Annual Openings
Annual Average Wages
Financial Managers
10 $84,352 Property, Real Estate, and Community Association
10 $42,867 Licensed Practical and Licensed Vocational Nurses
100 $36,555
Construction Managers
10 $71,910 Loan Officers 10 $47,108 Emergency Medical Technicians & Paramedics
20 $30,909
Compliance Officers
10 $53,232 Preschool Teachers, Ex-cept Special Education
10 $34,505 Heavy and Tractor-Trailer Truck Drivers
30 $35,308
CostEstimators
10 $50,073 Registered Nurses
120 $56,943 Machinists 20 $39,728
Human Resources Specialists
10 $38,427 Medical and Clinical Laboratory Technicians
10 $37,659 Welders, Cutters, Solderers, and Brazers
10 $39,687
Accountants and Auditors
30 $57,523 Radiologic Technologists
10 $51,070 Electrical Power-Line Installers and Repairers
10 $49,969
Computer Systems Analysts
10 $57,462 First-Line Supervisors of Office and Administra-tive Support Workers
40 $41,226 Telecom-munications Equipment Installers and Repairers, Except Line Installers
10 $52,976
Computer Programmers
10 $54,474 Bookkeeping, Accounting, and Auditing Clerks
40 $31,624 Industrial Machinery Mechanics
10 $44,807
Software Developers, Applications
10 $88,048 Chemical Equipment Operators and Tenders
0 $45,940 Electricians 20 $44,742
Medical and Clinical Laboratory Technologists
10 $52,078 Computer Network Support Specialists
0 $38,953 Dental Assistants
10 $29,417
Securities, Commodities, and Financial Services Sales Agents
30 $79,533 Electrical and Electronics Engineering Technicians
0 $56,684 Claims Adjusters, Ex-aminers, and Investigators
10 $50,752
Child, Family, and School Social Workers
10 $44,090 Mechanical Drafters
0 $69,444 Pharmacy Technicians
10 $27,327
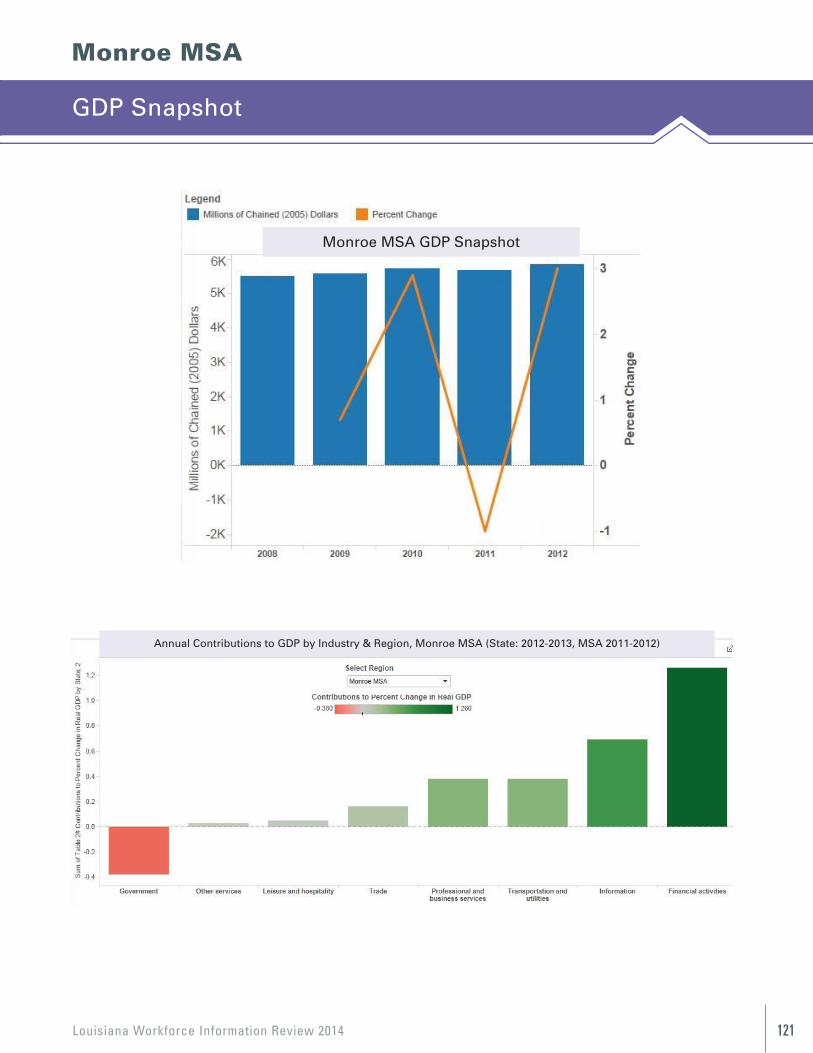
Louisiana Workforce Information Review 2014 121
Monroe MSA
GDP Snapshot
124
Volume 1, Issue 1 Newsletter Date
Monroe MSA
124
Volume 1, Issue 1 Newsletter Date
Monroe MSA
Monroe MSA GDP Snapshot
Annual Contributions to GDP by Industry & Region, Monroe MSA (State: 2012-2013, MSA 2011-2012)
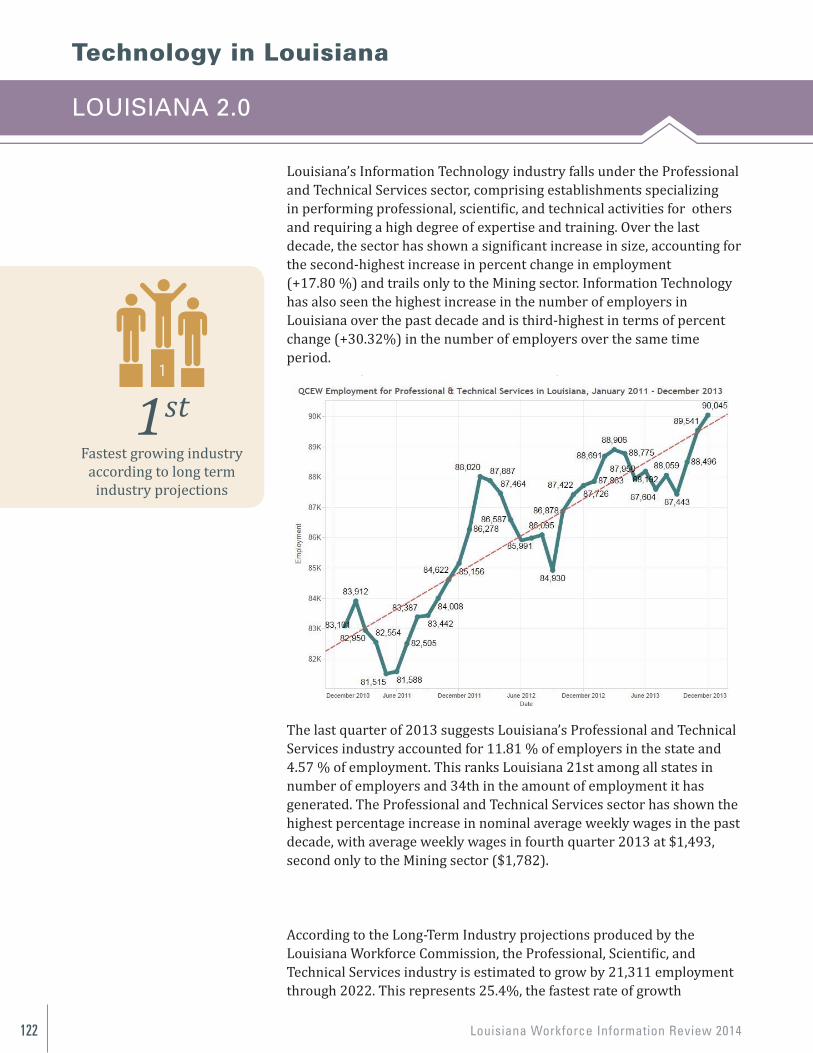
Louisiana Workforce Information Review 2014122
Technology in Louisiana
LOUISIANA 2.0
Louisiana’s Information Technology industry falls under the Professional and Technical Services sector, comprising establishments specializing in performing professional, scientific, and technical activities for others and requiring a high degree of expertise and training. Over the last decade, the sector has shown a significant increase in size, accounting for the second-highest increase in percent change in employment (+17.80 %) and trails only to the Mining sector. Information Technology has also seen the highest increase in the number of employers in Louisiana over the past decade and is third-highest in terms of percentchange (+30.32%) in the number of employers over the same time period.
The last quarter of 2013 suggests Louisiana’s Professional and Technical Services industry accounted for 11.81 % of employers in the state and 4.57 % of employment. This ranks Louisiana 21st among all states in number of employers and 34th in the amount of employment it has generated. The Professional and Technical Services sector has shown the highest percentage increase in nominal average weekly wages in the past decade, with average weekly wages in fourth quarter 2013 at $1,493, second only to the Mining sector ($1,782).
According to the Long-Term Industry projections produced by the Louisiana Workforce Commission, the Professional, Scientific, and Technical Services industry is estimated to grow by 21,311 employment through 2022. This represents 25.4%, the fastest rate of growth
2
Industry Breakdown: The “Demand Side” of the labor market refers to the employers’ demand for labor that a job seeker would supply. By looking at the trend of an IT-concentrated industry's employment, we can see that the sharp up-ward trend proves there has been consistent demand for IT professionals in Louisiana. Almost every industry employs an IT professional in some manner. Industries that are heavily based in IT, however, are usually classified in Professional & Technical Services. This industry, according to QCEW data, has shown robust growth over the previous two years, growing by 6,944 jobs over the period, or 8.4%. During the same period, wages followed a similar growth path, reaching it’s highest point ever in the 4th quarter of 2013 with an Average Weekly Wage of $1,493 (refer to page 12). The industry also boasts the second highest wages in the state, only to be bested by the lesser-employed Mining industry. The ex-ceptionally high wages coupled with rapid employment growth emphasize just how highly demanded IT professionals are in Louisiana. The growth in wages have not priced the IT job seeker out of competition. On the contrary, not only does employment continue it’s rapid ascension, but the fore-casted employment through 2022 shows the trend continues to press on for even higher levels of IT professional employment. Ac-cording to the Louisiana Workforce Commission’s Industry based projections, the Professional and Technical Services Industry is projected to grow by 21,311 jobs through 2022, or 25.4%.
Fastest growing industry according to long term
industry projections
1st
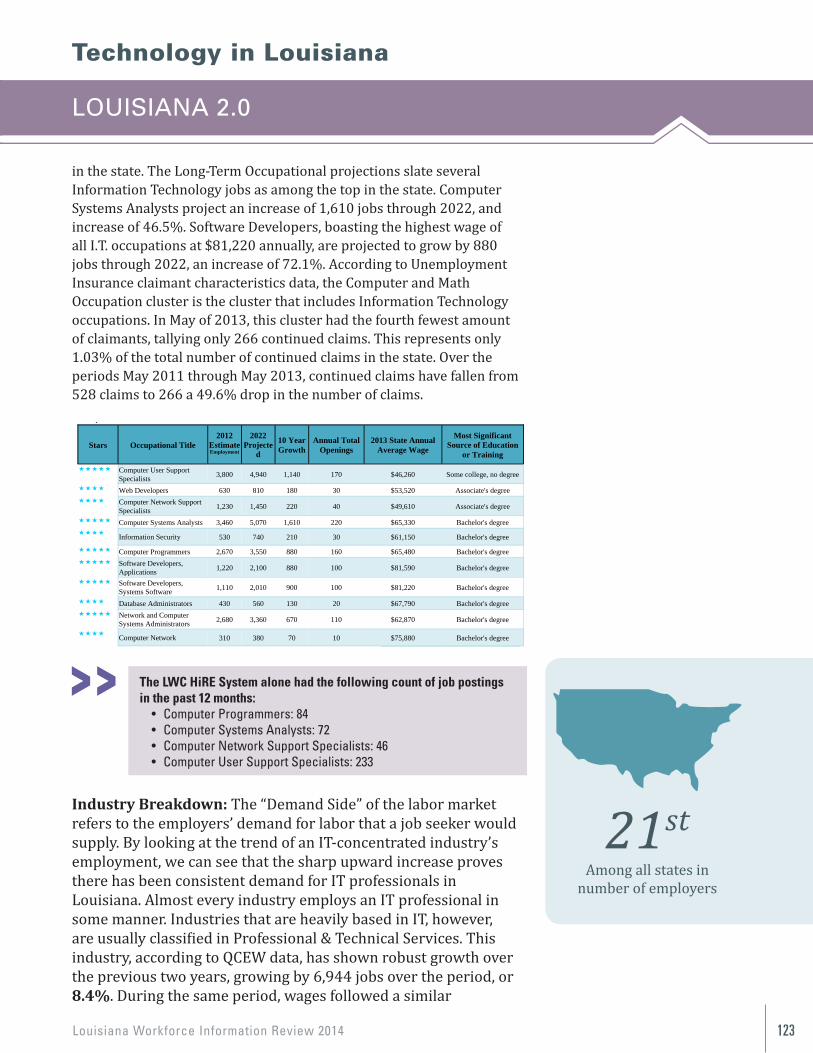
Louisiana Workforce Information Review 2014 123
in the state. The Long-Term Occupational projections slate several Information Technology jobs as among the top in the state. Computer Systems Analysts project an increase of 1,610 jobs through 2022, and increase of 46.5%. Software Developers, boasting the highest wage of all I.T. occupations at $81,220 annually, are projected to grow by 880 jobs through 2022, an increase of 72.1%. According to Unemployment Insurance claimant characteristics data, the Computer and Math Occupation cluster is the cluster that includes Information Technology occupations. In May of 2013, this cluster had the fourth fewest amount of claimants, tallying only 266 continued claims. This represents only 1.03% of the total number of continued claims in the state. Over the periods May 2011 through May 2013, continued claims have fallen from 528 claims to 266 a 49.6% drop in the number of claims.
Industry Breakdown: The “Demand Side” of the labor market refers to the employers’ demand for labor that a job seeker would supply. By looking at the trend of an IT-concentrated industry’s employment, we can see that the sharp upward increase proves there has been consistent demand for IT professionals in Louisiana. Almost every industry employs an IT professional in some manner. Industries that are heavily based in IT, however, are usually classified in Professional & Technical Services. This industry, according to QCEW data, has shown robust growth over the previous two years, growing by 6,944 jobs over the period, or 8.4%. During the same period, wages followed a similar
Technology in Louisiana
LOUISIANA 2.0
The LWC HiRE System alone had the following count of job postingsin the past 12 months:
• Computer Programmers: 84• Computer Systems Analysts: 72• Computer Network Support Specialists: 46• Computer User Support Specialists: 233
Among all states innumber of employers
21st
3
Occupation Information: Occupation projections also represent “demand side” information. We can use this information to look specifically at which jobs require certain levels of training, wage information, and how many of these employees will be demanded on an annual basis. Below is a table that provides this information for the top IT occupations across Louisiana.
For IT Professionals, while Some College experience or an Associate’s Degree offer opportunities, a Bachelor’s Degree from a program like Computer Science or Electrical Engineering offers the highest possibility of success. Computer Systems Analysts and Computer Programmers rank in the Top 10 of highest demanded occupations for a Bachelor’s Degree in the state when sorted by Annual Total Openings, as well as offering a wage well above the median income in the state. Unemployment Insurance Claimants: When we begin to look at the Unemployment Insurance claims characteristics, we shift gears to the “supply side” by looking at the characteristics of the people currently looking for a job, or put another way, who are looking to supply their labor and skills to a business. For IT professionals, we can look at the Industry level information and Occupation level information. For the Industry level information, like QCEW that was explored previously, we look at Professional & Technical Services and compare that to other industries in Louisiana. For the period May 2011—May 2013, unemployment insurance continued claims for this industry decreased by 59.3% to 1,294 claims, representative of the rapid increases in employment across the state as many job seekers found employment during this period. The number of claimants in this industry is also far less
The LWC HiRE System alone had the following count of Job Orders in the past 12 months: ● Computer Programmers: 84 postings
● Computer Systems Analysts: 72
● Computer Network Support Specialists: 46
● Computer User Support Specialists: 233
Stars Occupational Title 2012
EstimateEmployment
2022 Projecte
d
10 Year Growth
Annual Total Openings
2013 State Annual Average Wage
Most Significant Source of Education
or Training
Computer User Support Specialists 3,800 4,940 1,140 170 $46,260 Some college, no degree
Web Developers 630 810 180 30 $53,520 Associate's degree Computer Network Support
Specialists 1,230 1,450 220 40 $49,610 Associate's degree
Computer Systems Analysts 3,460 5,070 1,610 220 $65,330 Bachelor's degree Information Security 530 740 210 30 $61,150 Bachelor's degree
Computer Programmers 2,670 3,550 880 160 $65,480 Bachelor's degree Software Developers,
Applications 1,220 2,100 880 100 $81,590 Bachelor's degree
Software Developers, Systems Software 1,110 2,010 900 100 $81,220 Bachelor's degree
Database Administrators 430 560 130 20 $67,790 Bachelor's degree Network and Computer
Systems Administrators 2,680 3,360 670 110 $62,870 Bachelor's degree
Computer Network 310 380 70 10 $75,880 Bachelor's degree
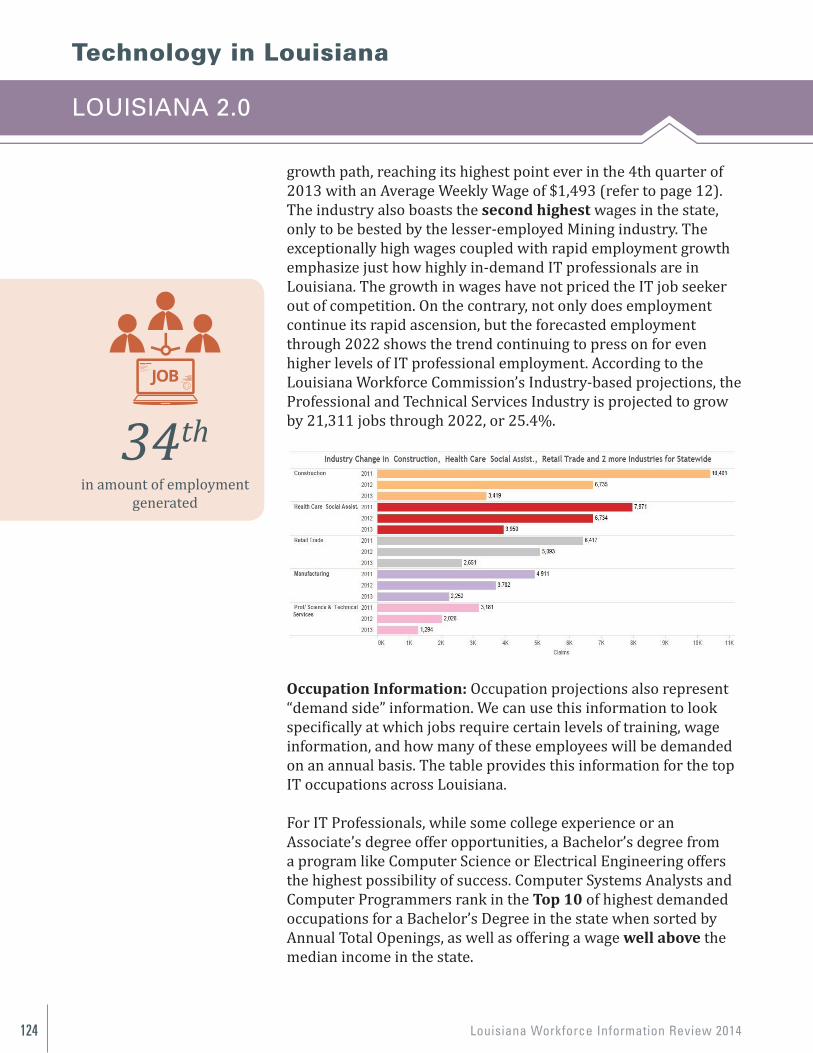
Louisiana Workforce Information Review 2014124
growth path, reaching its highest point ever in the 4th quarter of 2013 with an Average Weekly Wage of $1,493 (refer to page 12). The industry also boasts the second highest wages in the state, only to be bested by the lesser-employed Mining industry. The exceptionally high wages coupled with rapid employment growth emphasize just how highly in-demand IT professionals are in Louisiana. The growth in wages have not priced the IT job seeker out of competition. On the contrary, not only does employment continue its rapid ascension, but the forecasted employment through 2022 shows the trend continuing to press on for even higher levels of IT professional employment. According to the Louisiana Workforce Commission’s Industry-based projections, the Professional and Technical Services Industry is projected to grow by 21,311 jobs through 2022, or 25.4%.
Occupation Information: Occupation projections also represent “demand side” information. We can use this information to look specifically at which jobs require certain levels of training, wage information, and how many of these employees will be demandedon an annual basis. The table provides this information for the top IT occupations across Louisiana.
For IT Professionals, while some college experience or an Associate’s degree offer opportunities, a Bachelor’s degree from a program like Computer Science or Electrical Engineering offers the highest possibility of success. Computer Systems Analysts and Computer Programmers rank in the Top 10 of highest demanded occupations for a Bachelor’s Degree in the state when sorted by Annual Total Openings, as well as offering a wage well above the median income in the state.
Technology in Louisiana
LOUISIANA 2.0
25
Occupation Information: Occupation projections also represent “demand side” information. We can use this information to look specifically at which jobs require certain levels of training, wage information, and how many of these employees will be demanded on an annual basis. Below is a table that provides this information for the top IT occupations across Louisiana.
For IT Professionals, while Some College experience or an Associate’s Degree offer opportunities, a Bachelor’s Degree from a program like Computer Science or Electrical Engineering offers the highest possibility of success. Computer Systems Analysts and Computer Programmers rank in the Top 10 of highest demanded occupations for a Bachelor’s Degree in the state when sorted by Annual Total Openings, as well as offering a wage well above the median income in the state. Unemployment Insurance Claimants: When we begin to look at the Unemployment Insurance claims characteristics, we shift gears to the “supply side” by looking at the characteristics of the people currently looking for a job, or put another way, who are looking to supply their labor and skills to a business. For IT professionals, we can look at the Industry level information and Occupation level information. For the Industry level information, like QCEW that was explored previously, we look at Professional & Technical Services and compare that to other industries in Louisiana. For the period May 2011—May 2013, unemployment insurance continued claims for this industry decreased by 59.3% to 1,294 claims, representative of the rapid increases in employment across the state as many job seekers found employment during this period. The number of claimants in this industry is also far less
The LWC HiRE System alone had the following count of Job Orders in the past 12 months: ● Computer Programmers: 84 postings
● Computer Systems Analysts: 72
● Computer Network Support Specialists: 46
● Computer User Support Specialists: 233
Stars Occupational Title 2012
EstimateEmployment
2022 Projecte
d
10 Year Growth
Annual Total Openings
2013 State Annual Average Wage
Most Significant Source of Education
or Training
Computer User Support Specialists 3,800 4,940 1,140 170 $46,260 Some college, no degree
Web Developers 630 810 180 30 $53,520 Associate's degree Computer Network Support
Specialists 1,230 1,450 220 40 $49,610 Associate's degree
Computer Systems Analysts 3,460 5,070 1,610 220 $65,330 Bachelor's degree Information Security 530 740 210 30 $61,150 Bachelor's degree
Computer Programmers 2,670 3,550 880 160 $65,480 Bachelor's degree Software Developers,
Applications 1,220 2,100 880 100 $81,590 Bachelor's degree
Software Developers, Systems Software 1,110 2,010 900 100 $81,220 Bachelor's degree
Database Administrators 430 560 130 20 $67,790 Bachelor's degree Network and Computer
Systems Administrators 2,680 3,360 670 110 $62,870 Bachelor's degree
Computer Network 310 380 70 10 $75,880 Bachelor's degree
in amount of employment generated
34th
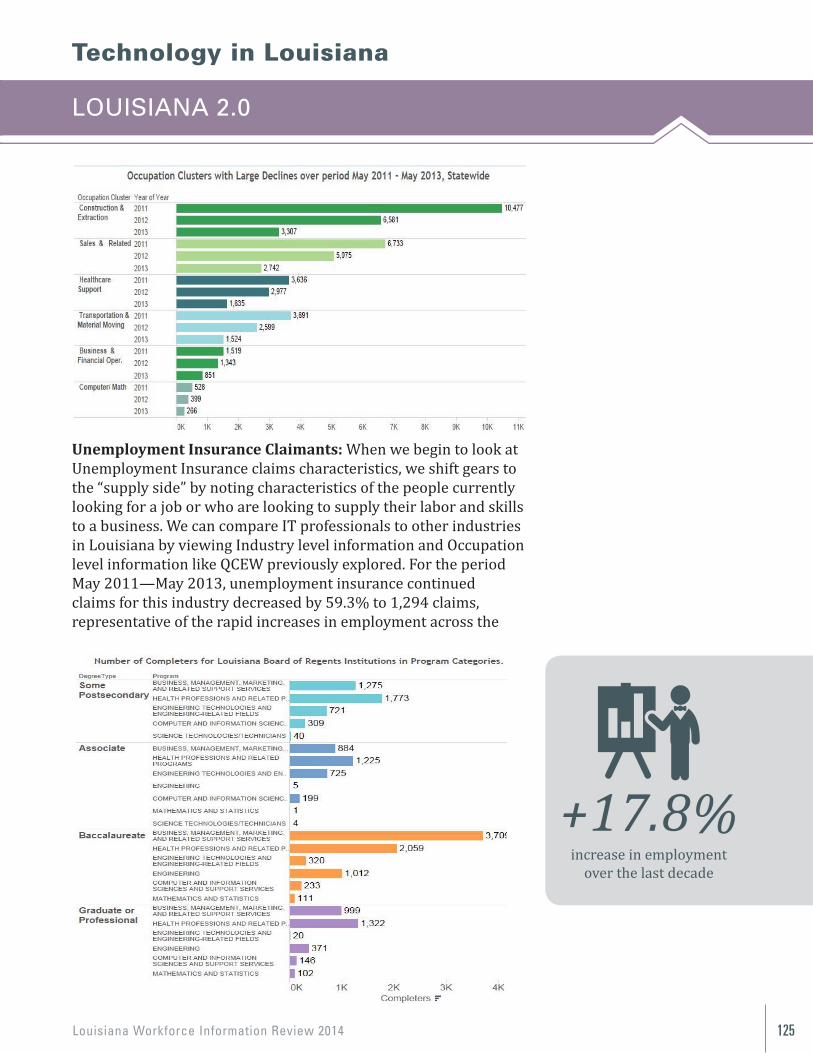
Louisiana Workforce Information Review 2014 125
Technology in Louisiana
LOUISIANA 2.0
26
Unemployment Insurance cont.: However, industry level information may not be granular enough to draw conclusions about IT professionals’ supply in Louisiana since most industries employ IT professionals. Occupation based claimant information offers a finer level of detail, highlighting the Computer/Math Occupations cluster. The number of claims in this occupation cluster show drastically low amounts of continued claims while still showing a large percentage drop over the May 2011—May 2013 timeframe at a 49.6% decrease. What this implies is that because IT occupations are in such high demand, the profession offers a much more stable working environment, employment security, and low turnover. Because of the increasing importance on technology in the workplace over the past three decades, IT professionals have become critical staff to firm operations, and are therefore less likely to be laid off in the first place (and subsequently file an unemployment insurance claim). The high wages offered by these occupations also increase the likelihood that an employee in this field is likely to stay where they are. The large percentage decrease also shows that these occupations continue to be highly sought after, as firms cannot afford to be without IT professionals for very long. Board of Regents Completers: The Board of Regents releases data on the number of people who completed an academic program annually. Using this data, we can look carefully at the number of completers who completed STEM oriented programs, including Computer and Information Sciences programs. For the school year 2012—2013, across four degree levels, 887 people completed Computer and Information Sciences programs, with the heaviest concentration in Some Postsecondary training. Only 233 people completed with a Bachelor’s degree, while according to Occupational Projections, there will be a demanded 750 annual openings for Bachelor’s-level occupations. Another issue to bear in mind is that not all Completers stay in Louisiana—they may be lured away by Silicon Valley, or perhaps they want to “Keep Austin Weird.” Coupled with the low number of Unemployment Insurance claimants in Computer/Math occupations, this leads to a shortage for highly skilled IT professionals across Louisiana.
increase in employment over the last decade
+17.8%
Unemployment Insurance Claimants: When we begin to look at Unemployment Insurance claims characteristics, we shift gears to the “supply side” by noting characteristics of the people currently looking for a job or who are looking to supply their labor and skills to a business. We can compare IT professionals to other industries in Louisiana by viewing Industry level information and Occupation level information like QCEW previously explored. For the period May 2011—May 2013, unemployment insurance continued claims for this industry decreased by 59.3% to 1,294 claims, representative of the rapid increases in employment across the
Louisiana Workforce Information Review 2014126
Technology in Louisiana
LOUISIANA 2.0
state as many job seekers found employment during this period. The number of claimants in this industry is also far fewer.
However, industry level information may not be granular enough to draw conclusions about IT professionals’ supply in Louisiana since most industries employ IT professionals. Occupation-based claimant information offers a finer level of detail, highlightingthe Computer/Math Occupations cluster. The number of claims in this occupation cluster show drastically low amounts of continued claims while still indicating a large percentage drop over the May 2011— May 2013 time frame at a 49.6% decrease. What this implies is that because IT occupations are in such high demand, the profession offers a much more stable working environment,employment security, and low turnover. With the increasing importance on technology in the workplace over the past three decades, IT professionals have become critical staff to firm operations, and are therefore less likely to be laid off (and subsequently file an unemployment insurance claim). High wages offered by these occupations also increase the likelihood that an employee in this field is likely to stay where they are. The large percentage decrease also shows that these occupations continue to be highly sought after, as firms cannot afford to be without IT professionals for very long.
Board of Regents Completers: The Board of Regents releases data on the number of people who completed an academic program annually. Using this data, we can look carefully at the number of completers who completed STEM-oriented programs,including Computer and Information Sciences programs. For the school year 2012—2013, across four degree levels, 887 people completed Computer and Information Sciences programs, with theheaviest concentration in some post-secondary training. Only 233 people completed with a Bachelor’s degree, while according to Occupational Projections, there will be a demanded 750 annual openings for Bachelor’s-level occupations. Another issue to bear inmind is that not all Completers stay in Louisiana—they may be lured away by Silicon Valley, or perhaps they want to“Keep Austin Weird.”
Average Weekly Wage
$1,493

Louisiana Workforce Information Review 2014 127
Coupled with the low number of Unemployment Insurance claimants in Computer/Math occupations, this leads to a shortage for highly skilled IT professionals across Louisiana.
CONCLUSION
It is important to not just consider the data that highlights past trends, or put emphasis on today’s labor shortage, but to consider the long-term implications of not meeting the future’s demand. In what is now a truly global economy where technology becomes outdated by newer technology every day and reliance on ITprofessionals also grows across every industry daily, the current importance of IT occupations cannot be overstated.
The economic impact of building an infrastructure and support for an industry that is intensely demanded on a global scale also cannot be emphasized enough. Consider some of the fastest growing and wealthiest areas of the United States—Silicon Valley, CA, Austin, TX, New York City, NY. These cities are technology mega-hubs, where the world’s top companies are developing tomorrow’s technologies. They are among the top cities in the world for information technology, if not at the very top. All of these areas not only meet their local societies’ demands — they meet the world’s demands, exporting goods and services that few other cities are even competing with. Their prosperity that arose from technology has spilled over into nearly every other industry in their region, having much broader economic impacts, ultimately improving their citizens’ quality of life.
Louisiana is met with a unique opportunity to invest in IT fields, whether it be by expanded Economic Development efforts to bring in new technology companies, or Workforce Development efforts where extra emphasis is put on training the labor force the skills they need to lead a successful IT career. By committing to aggressively supporting the technology industry in Louisiana today, we are committing to being on the forefront of the world tomorrow.
Technology in Louisiana
LOUISIANA 2.0

Louisiana Workforce Information Review 2014128
APPENDIX
Here you will find information on the data sourcesused and tables of data
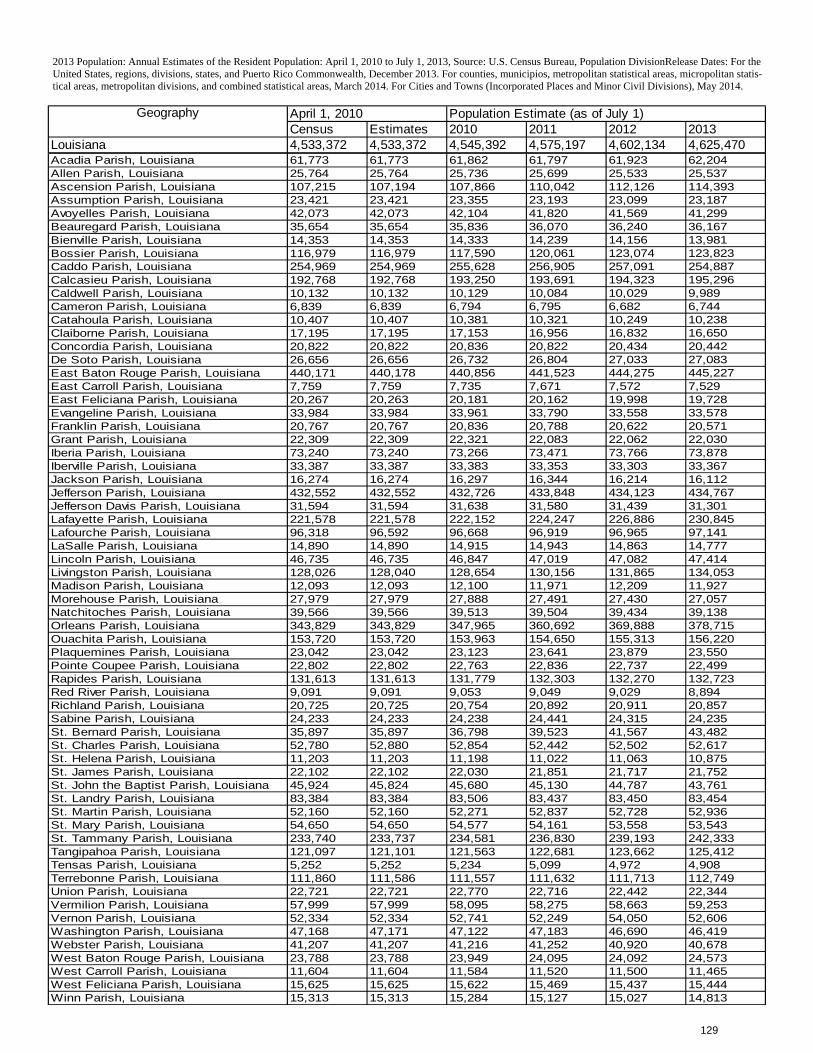
2013 Population: Annual Estimates of the Resident Population: April 1, 2010 to July 1, 2013, Source: U.S. Census Bureau, Population DivisionRelease Dates: For the United States, regions, divisions, states, and Puerto Rico Commonwealth, December 2013. For counties, municipios, metropolitan statistical areas, micropolitan statis-tical areas, metropolitan divisions, and combined statistical areas, March 2014. For Cities and Towns (Incorporated Places and Minor Civil Divisions), May 2014.
Estimates 2010 2011 2012 20134,533,372 4,545,392 4,575,197 4,602,134 4,625,470
Geography April 1, 2010 Population Estimate (as of July 1)Census
Louisiana 4,533,37261,773 61,862 61,797 61,923 62,20425,764 25,736 25,699 25,533 25,537107,194 107,866 110,042 112,126 114,39323,421 23,355 23,193 23,099 23,18742,073 42,104 41,820 41,569 41,29935,654 35,836 36,070 36,240 36,16714,353 14,333 14,239 14,156 13,981116,979 117,590 120,061 123,074 123,823254,969 255,628 256,905 257,091 254,887192,768 193,250 193,691 194,323 195,29610,132 10,129 10,084 10,029 9,9896,839 6,794 6,795 6,682 6,74410,407 10,381 10,321 10,249 10,23817,195 17,153 16,956 16,832 16,65020,822 20,836 20,822 20,434 20,44226,656 26,732 26,804 27,033 27,083440,178 440,856 441,523 444,275 445,2277,759 7,735 7,671 7,572 7,52920,263 20,181 20,162 19,998 19,72833,984 33,961 33,790 33,558 33,57820,767 20,836 20,788 20,622 20,57122,309 22,321 22,083 22,062 22,03073,240 73,266 73,471 73,766 73,87833,387 33,383 33,353 33,303 33,36716,274 16,297 16,344 16,214 16,112432,552 432,726 433,848 434,123 434,76731,594 31,638 31,580 31,439 31,301221,578 222,152 224,247 226,886 230,84596,592 96,668 96,919 96,965 97,14114,890 14,915 14,943 14,863 14,77746,735 46,847 47,019 47,082 47,414128,040 128,654 130,156 131,865 134,05312,093 12,100 11,971 12,209 11,92727,979 27,888 27,491 27,430 27,05739,566 39,513 39,504 39,434 39,138343,829 347,965 360,692 369,888 378,715153,720 153,963 154,650 155,313 156,22023,042 23,123 23,641 23,879 23,55022,802 22,763 22,836 22,737 22,499131,613 131,779 132,303 132,270 132,7239,091 9,053 9,049 9,029 8,89420,725 20,754 20,892 20,911 20,85724,233 24,238 24,441 24,315 24,23535,897 36,798 39,523 41,567 43,48252,880 52,854 52,442 52,502 52,61711,203 11,198 11,022 11,063 10,87522,102 22,030 21,851 21,717 21,75245,824 45,680 45,130 44,787 43,76183,384 83,506 83,437 83,450 83,45452,160 52,271 52,837 52,728 52,93654,650 54,577 54,161 53,558 53,543233,737 234,581 236,830 239,193 242,333121,101 121,563 122,681 123,662 125,4125,252 5,234 5,099 4,972 4,908111,586 111,557 111,632 111,713 112,74922,721 22,770 22,716 22,442 22,34457,999 58,095 58,275 58,663 59,25352,334 52,741 52,249 54,050 52,60647,171 47,122 47,183 46,690 46,41941,207 41,216 41,252 40,920 40,67823,788 23,949 24,095 24,092 24,57311,604 11,584 11,520 11,500 11,46515,625 15,622 15,469 15,437 15,44415,313 15,284 15,127 15,027 14,813Winn Parish, Louisiana 15,313
West Baton Rouge Parish, Louisiana 23,788West Carroll Parish, Louisiana 11,604West Feliciana Parish, Louisiana 15,625
Vernon Parish, Louisiana 52,334Washington Parish, Louisiana 47,168Webster Parish, Louisiana 41,207
Terrebonne Parish, Louisiana 111,860Union Parish, Louisiana 22,721Vermilion Parish, Louisiana 57,999
St. Tammany Parish, Louisiana 233,740Tangipahoa Parish, Louisiana 121,097Tensas Parish, Louisiana 5,252
St. Landry Parish, Louisiana 83,384St. Martin Parish, Louisiana 52,160St. Mary Parish, Louisiana 54,650
St. Helena Parish, Louisiana 11,203St. James Parish, Louisiana 22,102St. John the Baptist Parish, Louisiana 45,924
Sabine Parish, Louisiana 24,233St. Bernard Parish, Louisiana 35,897St. Charles Parish, Louisiana 52,780
Rapides Parish, Louisiana 131,613Red River Parish, Louisiana 9,091Richland Parish, Louisiana 20,725
Ouachita Parish, Louisiana 153,720Plaquemines Parish, Louisiana 23,042Pointe Coupee Parish, Louisiana 22,802
Morehouse Parish, Louisiana 27,979Natchitoches Parish, Louisiana 39,566Orleans Parish, Louisiana 343,829
Lincoln Parish, Louisiana 46,735Livingston Parish, Louisiana 128,026Madison Parish, Louisiana 12,093
Lafayette Parish, Louisiana 221,578Lafourche Parish, Louisiana 96,318LaSalle Parish, Louisiana 14,890
Jackson Parish, Louisiana 16,274Jefferson Parish, Louisiana 432,552Jefferson Davis Parish, Louisiana 31,594
Grant Parish, Louisiana 22,309Iberia Parish, Louisiana 73,240Iberville Parish, Louisiana 33,387
East Feliciana Parish, Louisiana 20,267Evangeline Parish, Louisiana 33,984Franklin Parish, Louisiana 20,767
De Soto Parish, Louisiana 26,656East Baton Rouge Parish, Louisiana 440,171East Carroll Parish, Louisiana 7,759
Catahoula Parish, Louisiana 10,407Claiborne Parish, Louisiana 17,195Concordia Parish, Louisiana 20,822
Calcasieu Parish, Louisiana 192,768Caldwell Parish, Louisiana 10,132Cameron Parish, Louisiana 6,839
Bienville Parish, Louisiana 14,353Bossier Parish, Louisiana 116,979Caddo Parish, Louisiana 254,969
Assumption Parish, Louisiana 23,421Avoyelles Parish, Louisiana 42,073Beauregard Parish, Louisiana 35,654
Acadia Parish, Louisiana 61,773Allen Parish, Louisiana 25,764Ascension Parish, Louisiana 107,215
129
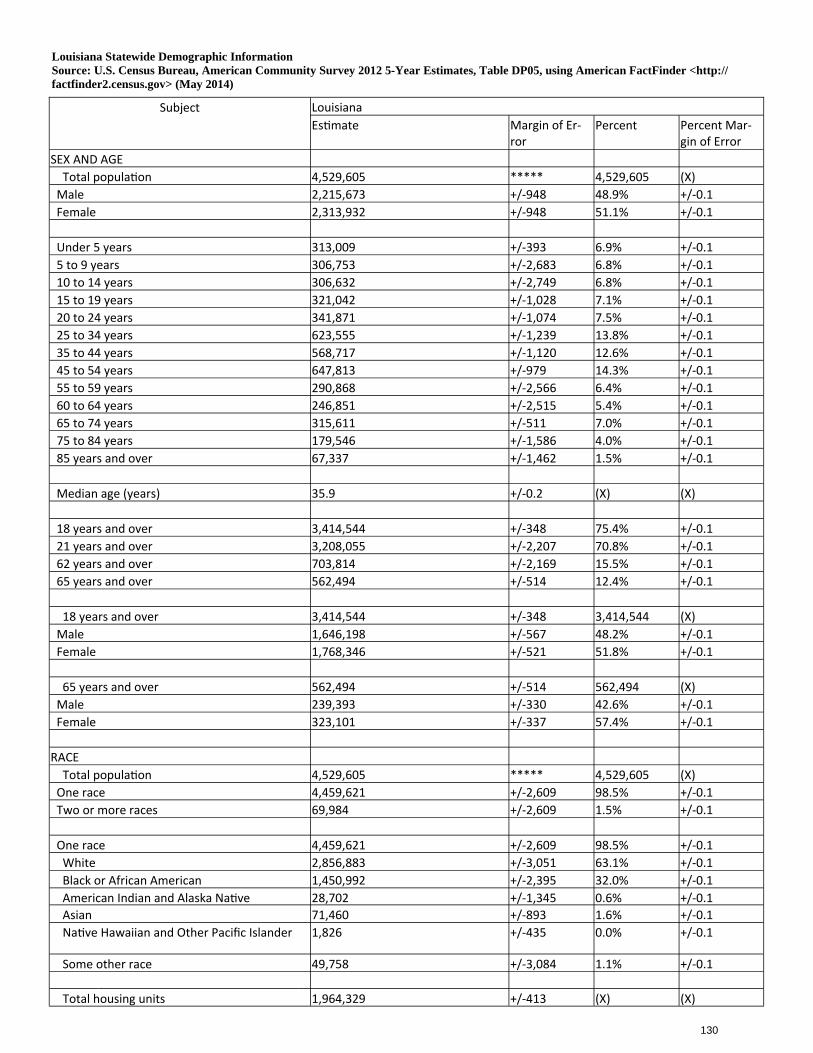
Subject Louisiana Es mate Margin of Er-
ror Percent Percent Mar-
gin of Error SEX AND AGE Total popula on 4,529,605 ***** 4,529,605 (X) Male 2,215,673 +/-948 48.9% +/-0.1 Female 2,313,932 +/-948 51.1% +/-0.1 Under 5 years 313,009 +/-393 6.9% +/-0.1 5 to 9 years 306,753 +/-2,683 6.8% +/-0.1 10 to 14 years 306,632 +/-2,749 6.8% +/-0.1 15 to 19 years 321,042 +/-1,028 7.1% +/-0.1 20 to 24 years 341,871 +/-1,074 7.5% +/-0.1 25 to 34 years 623,555 +/-1,239 13.8% +/-0.1 35 to 44 years 568,717 +/-1,120 12.6% +/-0.1 45 to 54 years 647,813 +/-979 14.3% +/-0.1 55 to 59 years 290,868 +/-2,566 6.4% +/-0.1 60 to 64 years 246,851 +/-2,515 5.4% +/-0.1 65 to 74 years 315,611 +/-511 7.0% +/-0.1 75 to 84 years 179,546 +/-1,586 4.0% +/-0.1 85 years and over 67,337 +/-1,462 1.5% +/-0.1 Median age (years) 35.9 +/-0.2 (X) (X) 18 years and over 3,414,544 +/-348 75.4% +/-0.1 21 years and over 3,208,055 +/-2,207 70.8% +/-0.1 62 years and over 703,814 +/-2,169 15.5% +/-0.1 65 years and over 562,494 +/-514 12.4% +/-0.1 18 years and over 3,414,544 +/-348 3,414,544 (X) Male 1,646,198 +/-567 48.2% +/-0.1 Female 1,768,346 +/-521 51.8% +/-0.1 65 years and over 562,494 +/-514 562,494 (X) Male 239,393 +/-330 42.6% +/-0.1 Female 323,101 +/-337 57.4% +/-0.1 RACE Total popula on 4,529,605 ***** 4,529,605 (X) One race 4,459,621 +/-2,609 98.5% +/-0.1 Two or more races 69,984 +/-2,609 1.5% +/-0.1 One race 4,459,621 +/-2,609 98.5% +/-0.1 White 2,856,883 +/-3,051 63.1% +/-0.1 Black or African American 1,450,992 +/-2,395 32.0% +/-0.1 American Indian and Alaska Na ve 28,702 +/-1,345 0.6% +/-0.1 Asian 71,460 +/-893 1.6% +/-0.1 Na ve Hawaiian and Other Pacific Islander 1,826 +/-435 0.0% +/-0.1
Some other race 49,758 +/-3,084 1.1% +/-0.1
Total housing units 1,964,329 +/-413 (X) (X)
Louisiana Statewide Demographic Information Source: U.S. Census Bureau, American Community Survey 2012 5-Year Estimates, Table DP05, using American FactFinder <http://factfinder2.census.gov> (May 2014)
130
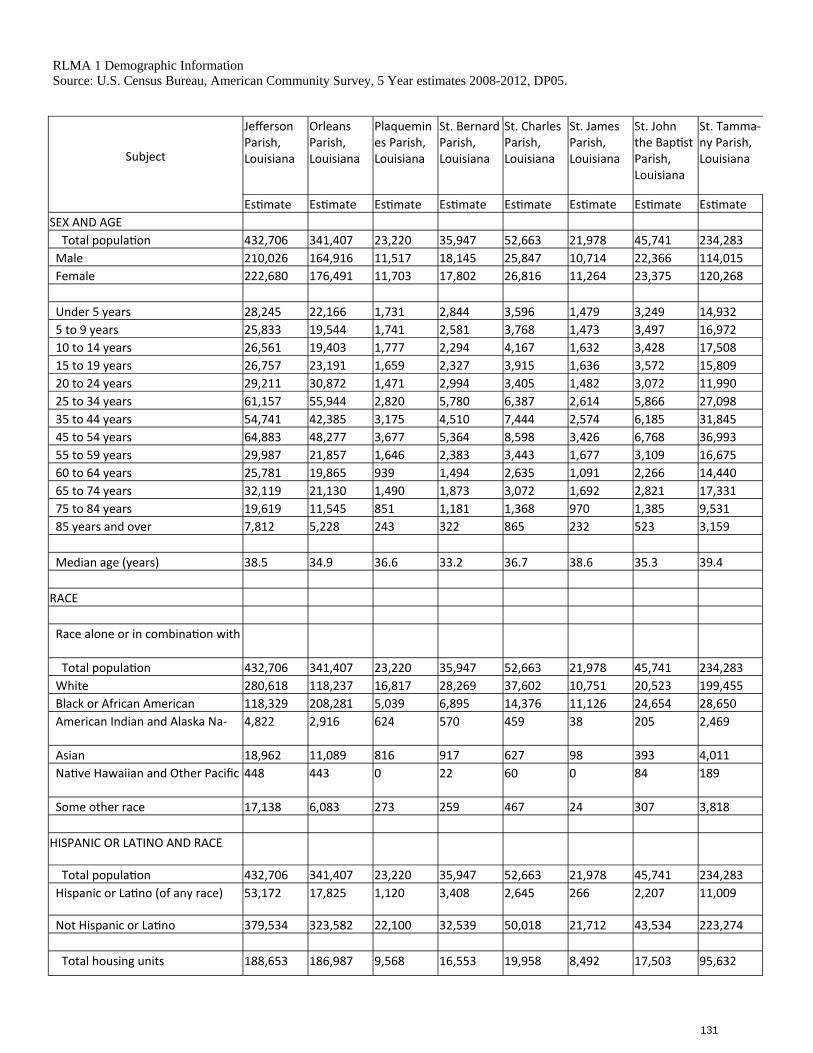
Subject
Jefferson Parish, Louisiana
Orleans Parish, Louisiana
Plaquemines Parish, Louisiana
St. Bernard Parish, Louisiana
St. Charles Parish, Louisiana
St. James Parish, Louisiana
St. John the Bap st Parish, Louisiana
St. Tamma-ny Parish, Louisiana
Es mate Es mate Es mate Es mate Es mate Es mate Es mate Es mate SEX AND AGE Total popula on 432,706 341,407 23,220 35,947 52,663 21,978 45,741 234,283 Male 210,026 164,916 11,517 18,145 25,847 10,714 22,366 114,015 Female 222,680 176,491 11,703 17,802 26,816 11,264 23,375 120,268 Under 5 years 28,245 22,166 1,731 2,844 3,596 1,479 3,249 14,932 5 to 9 years 25,833 19,544 1,741 2,581 3,768 1,473 3,497 16,972 10 to 14 years 26,561 19,403 1,777 2,294 4,167 1,632 3,428 17,508 15 to 19 years 26,757 23,191 1,659 2,327 3,915 1,636 3,572 15,809 20 to 24 years 29,211 30,872 1,471 2,994 3,405 1,482 3,072 11,990 25 to 34 years 61,157 55,944 2,820 5,780 6,387 2,614 5,866 27,098 35 to 44 years 54,741 42,385 3,175 4,510 7,444 2,574 6,185 31,845 45 to 54 years 64,883 48,277 3,677 5,364 8,598 3,426 6,768 36,993 55 to 59 years 29,987 21,857 1,646 2,383 3,443 1,677 3,109 16,675 60 to 64 years 25,781 19,865 939 1,494 2,635 1,091 2,266 14,440 65 to 74 years 32,119 21,130 1,490 1,873 3,072 1,692 2,821 17,331 75 to 84 years 19,619 11,545 851 1,181 1,368 970 1,385 9,531 85 years and over 7,812 5,228 243 322 865 232 523 3,159 Median age (years) 38.5 34.9 36.6 33.2 36.7 38.6 35.3 39.4 RACE Race alone or in combina on with
Total popula on 432,706 341,407 23,220 35,947 52,663 21,978 45,741 234,283 White 280,618 118,237 16,817 28,269 37,602 10,751 20,523 199,455 Black or African American 118,329 208,281 5,039 6,895 14,376 11,126 24,654 28,650 American Indian and Alaska Na- 4,822 2,916 624 570 459 38 205 2,469
Asian 18,962 11,089 816 917 627 98 393 4,011 Na ve Hawaiian and Other Pacific 448 443 0 22 60 0 84 189
Some other race 17,138 6,083 273 259 467 24 307 3,818 HISPANIC OR LATINO AND RACE
Total popula on 432,706 341,407 23,220 35,947 52,663 21,978 45,741 234,283 Hispanic or La no (of any race) 53,172 17,825 1,120 3,408 2,645 266 2,207 11,009
Not Hispanic or La no 379,534 323,582 22,100 32,539 50,018 21,712 43,534 223,274 Total housing units 188,653 186,987 9,568 16,553 19,958 8,492 17,503 95,632
RLMA 1 Demographic Information Source: U.S. Census Bureau, American Community Survey, 5 Year estimates 2008-2012, DP05.
131
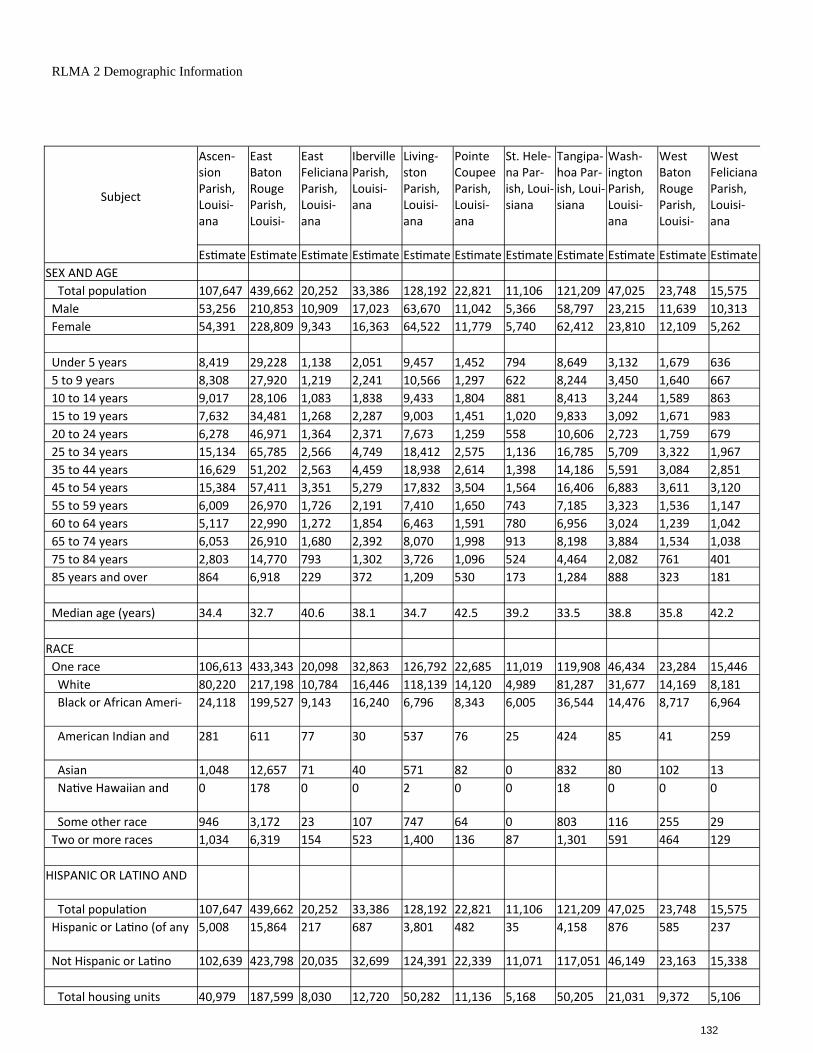
Subject
Ascen-sion Parish, Louisi-ana
East Baton Rouge Parish, Louisi-
East Feliciana Parish, Louisi-ana
Iberville Parish, Louisi-ana
Living-ston Parish, Louisi-ana
Pointe Coupee Parish, Louisi-ana
St. Hele-na Par-ish, Loui-siana
Tangipa-hoa Par-ish, Loui-siana
Wash-ington Parish, Louisi-ana
West Baton Rouge Parish, Louisi-
West Feliciana Parish, Louisi-ana
Es mate Es mate Es mate Es mate Es mate Es mate Es mate Es mate Es mate Es mate Es mate SEX AND AGE Total popula on 107,647 439,662 20,252 33,386 128,192 22,821 11,106 121,209 47,025 23,748 15,575 Male 53,256 210,853 10,909 17,023 63,670 11,042 5,366 58,797 23,215 11,639 10,313 Female 54,391 228,809 9,343 16,363 64,522 11,779 5,740 62,412 23,810 12,109 5,262 Under 5 years 8,419 29,228 1,138 2,051 9,457 1,452 794 8,649 3,132 1,679 636 5 to 9 years 8,308 27,920 1,219 2,241 10,566 1,297 622 8,244 3,450 1,640 667 10 to 14 years 9,017 28,106 1,083 1,838 9,433 1,804 881 8,413 3,244 1,589 863 15 to 19 years 7,632 34,481 1,268 2,287 9,003 1,451 1,020 9,833 3,092 1,671 983 20 to 24 years 6,278 46,971 1,364 2,371 7,673 1,259 558 10,606 2,723 1,759 679 25 to 34 years 15,134 65,785 2,566 4,749 18,412 2,575 1,136 16,785 5,709 3,322 1,967 35 to 44 years 16,629 51,202 2,563 4,459 18,938 2,614 1,398 14,186 5,591 3,084 2,851 45 to 54 years 15,384 57,411 3,351 5,279 17,832 3,504 1,564 16,406 6,883 3,611 3,120 55 to 59 years 6,009 26,970 1,726 2,191 7,410 1,650 743 7,185 3,323 1,536 1,147 60 to 64 years 5,117 22,990 1,272 1,854 6,463 1,591 780 6,956 3,024 1,239 1,042 65 to 74 years 6,053 26,910 1,680 2,392 8,070 1,998 913 8,198 3,884 1,534 1,038 75 to 84 years 2,803 14,770 793 1,302 3,726 1,096 524 4,464 2,082 761 401 85 years and over 864 6,918 229 372 1,209 530 173 1,284 888 323 181 Median age (years) 34.4 32.7 40.6 38.1 34.7 42.5 39.2 33.5 38.8 35.8 42.2 RACE One race 106,613 433,343 20,098 32,863 126,792 22,685 11,019 119,908 46,434 23,284 15,446 White 80,220 217,198 10,784 16,446 118,139 14,120 4,989 81,287 31,677 14,169 8,181 Black or African Ameri- 24,118 199,527 9,143 16,240 6,796 8,343 6,005 36,544 14,476 8,717 6,964
American Indian and 281 611 77 30 537 76 25 424 85 41 259
Asian 1,048 12,657 71 40 571 82 0 832 80 102 13 Na ve Hawaiian and 0 178 0 0 2 0 0 18 0 0 0
Some other race 946 3,172 23 107 747 64 0 803 116 255 29 Two or more races 1,034 6,319 154 523 1,400 136 87 1,301 591 464 129 HISPANIC OR LATINO AND
Total popula on 107,647 439,662 20,252 33,386 128,192 22,821 11,106 121,209 47,025 23,748 15,575 Hispanic or La no (of any 5,008 15,864 217 687 3,801 482 35 4,158 876 585 237
Not Hispanic or La no 102,639 423,798 20,035 32,699 124,391 22,339 11,071 117,051 46,149 23,163 15,338 Total housing units 40,979 187,599 8,030 12,720 50,282 11,136 5,168 50,205 21,031 9,372 5,106
RLMA 2 Demographic Information
132
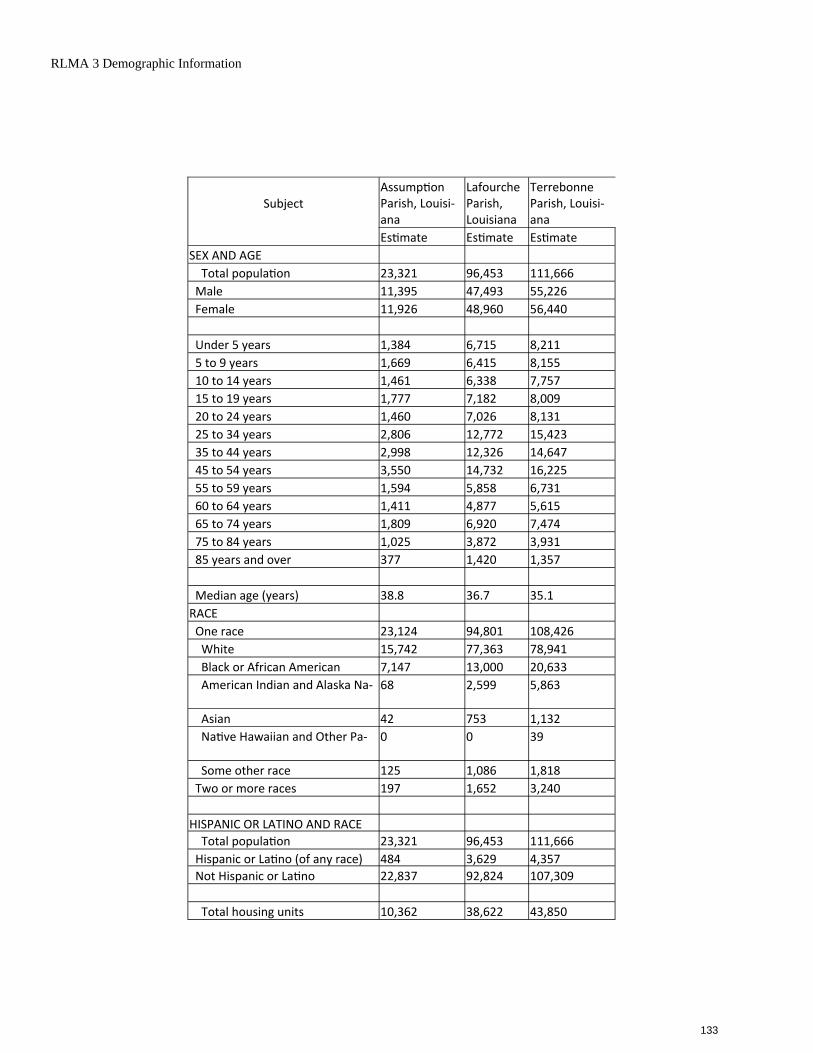
RLMA 3 Demographic Information
Subject Assump on Parish, Louisi-ana
Lafourche Parish, Louisiana
Terrebonne Parish, Louisi-ana
Es mate Es mate Es mate SEX AND AGE Total popula on 23,321 96,453 111,666 Male 11,395 47,493 55,226 Female 11,926 48,960 56,440 Under 5 years 1,384 6,715 8,211 5 to 9 years 1,669 6,415 8,155 10 to 14 years 1,461 6,338 7,757 15 to 19 years 1,777 7,182 8,009 20 to 24 years 1,460 7,026 8,131 25 to 34 years 2,806 12,772 15,423 35 to 44 years 2,998 12,326 14,647 45 to 54 years 3,550 14,732 16,225 55 to 59 years 1,594 5,858 6,731 60 to 64 years 1,411 4,877 5,615 65 to 74 years 1,809 6,920 7,474 75 to 84 years 1,025 3,872 3,931 85 years and over 377 1,420 1,357 Median age (years) 38.8 36.7 35.1 RACE One race 23,124 94,801 108,426 White 15,742 77,363 78,941 Black or African American 7,147 13,000 20,633 American Indian and Alaska Na- 68 2,599 5,863
Asian 42 753 1,132 Na ve Hawaiian and Other Pa- 0 0 39
Some other race 125 1,086 1,818 Two or more races 197 1,652 3,240 HISPANIC OR LATINO AND RACE Total popula on 23,321 96,453 111,666 Hispanic or La no (of any race) 484 3,629 4,357 Not Hispanic or La no 22,837 92,824 107,309 Total housing units 10,362 38,622 43,850
133
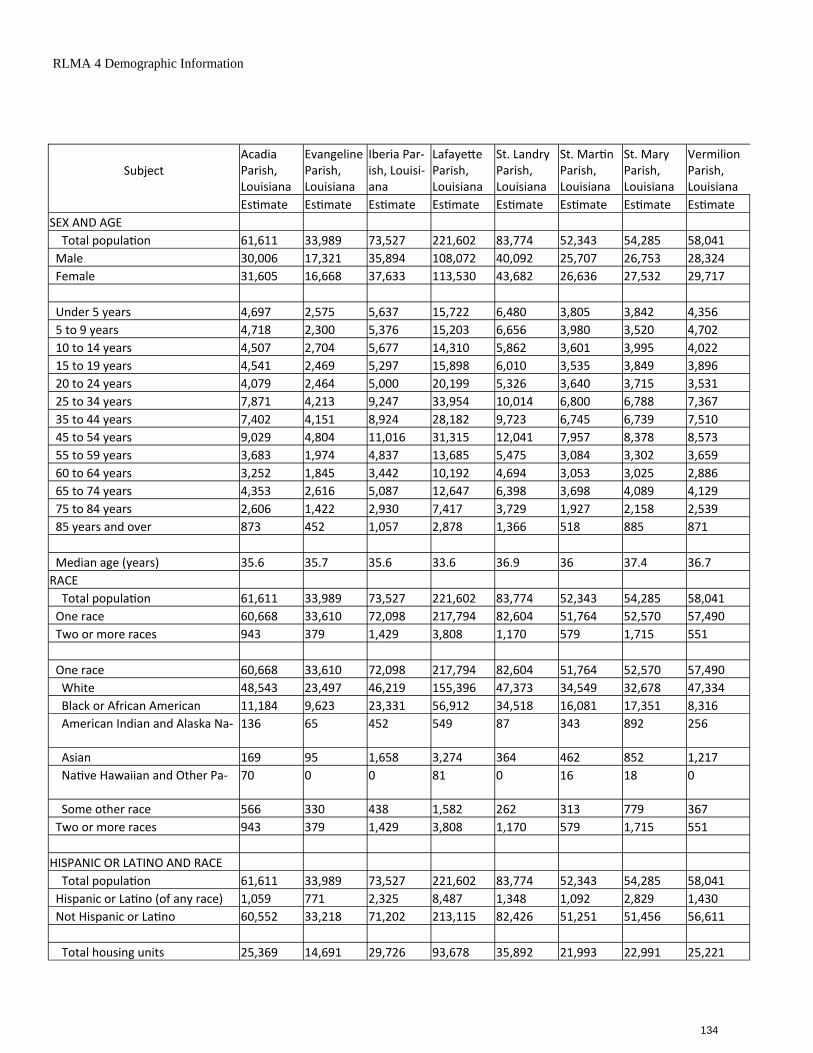
RLMA 4 Demographic Information
Subject Acadia Parish, Louisiana
Evangeline Parish, Louisiana
Iberia Par-ish, Louisi-ana
Lafaye e Parish, Louisiana
St. Landry Parish, Louisiana
St. Mar n Parish, Louisiana
St. Mary Parish, Louisiana
Vermilion Parish, Louisiana
Es mate Es mate Es mate Es mate Es mate Es mate Es mate Es mate SEX AND AGE Total popula on 61,611 33,989 73,527 221,602 83,774 52,343 54,285 58,041 Male 30,006 17,321 35,894 108,072 40,092 25,707 26,753 28,324 Female 31,605 16,668 37,633 113,530 43,682 26,636 27,532 29,717 Under 5 years 4,697 2,575 5,637 15,722 6,480 3,805 3,842 4,356 5 to 9 years 4,718 2,300 5,376 15,203 6,656 3,980 3,520 4,702 10 to 14 years 4,507 2,704 5,677 14,310 5,862 3,601 3,995 4,022 15 to 19 years 4,541 2,469 5,297 15,898 6,010 3,535 3,849 3,896 20 to 24 years 4,079 2,464 5,000 20,199 5,326 3,640 3,715 3,531 25 to 34 years 7,871 4,213 9,247 33,954 10,014 6,800 6,788 7,367 35 to 44 years 7,402 4,151 8,924 28,182 9,723 6,745 6,739 7,510 45 to 54 years 9,029 4,804 11,016 31,315 12,041 7,957 8,378 8,573 55 to 59 years 3,683 1,974 4,837 13,685 5,475 3,084 3,302 3,659 60 to 64 years 3,252 1,845 3,442 10,192 4,694 3,053 3,025 2,886 65 to 74 years 4,353 2,616 5,087 12,647 6,398 3,698 4,089 4,129 75 to 84 years 2,606 1,422 2,930 7,417 3,729 1,927 2,158 2,539 85 years and over 873 452 1,057 2,878 1,366 518 885 871 Median age (years) 35.6 35.7 35.6 33.6 36.9 36 37.4 36.7 RACE Total popula on 61,611 33,989 73,527 221,602 83,774 52,343 54,285 58,041 One race 60,668 33,610 72,098 217,794 82,604 51,764 52,570 57,490 Two or more races 943 379 1,429 3,808 1,170 579 1,715 551 One race 60,668 33,610 72,098 217,794 82,604 51,764 52,570 57,490 White 48,543 23,497 46,219 155,396 47,373 34,549 32,678 47,334 Black or African American 11,184 9,623 23,331 56,912 34,518 16,081 17,351 8,316 American Indian and Alaska Na- 136 65 452 549 87 343 892 256
Asian 169 95 1,658 3,274 364 462 852 1,217 Na ve Hawaiian and Other Pa- 70 0 0 81 0 16 18 0
Some other race 566 330 438 1,582 262 313 779 367 Two or more races 943 379 1,429 3,808 1,170 579 1,715 551 HISPANIC OR LATINO AND RACE Total popula on 61,611 33,989 73,527 221,602 83,774 52,343 54,285 58,041 Hispanic or La no (of any race) 1,059 771 2,325 8,487 1,348 1,092 2,829 1,430 Not Hispanic or La no 60,552 33,218 71,202 213,115 82,426 51,251 51,456 56,611 Total housing units 25,369 14,691 29,726 93,678 35,892 21,993 22,991 25,221
134
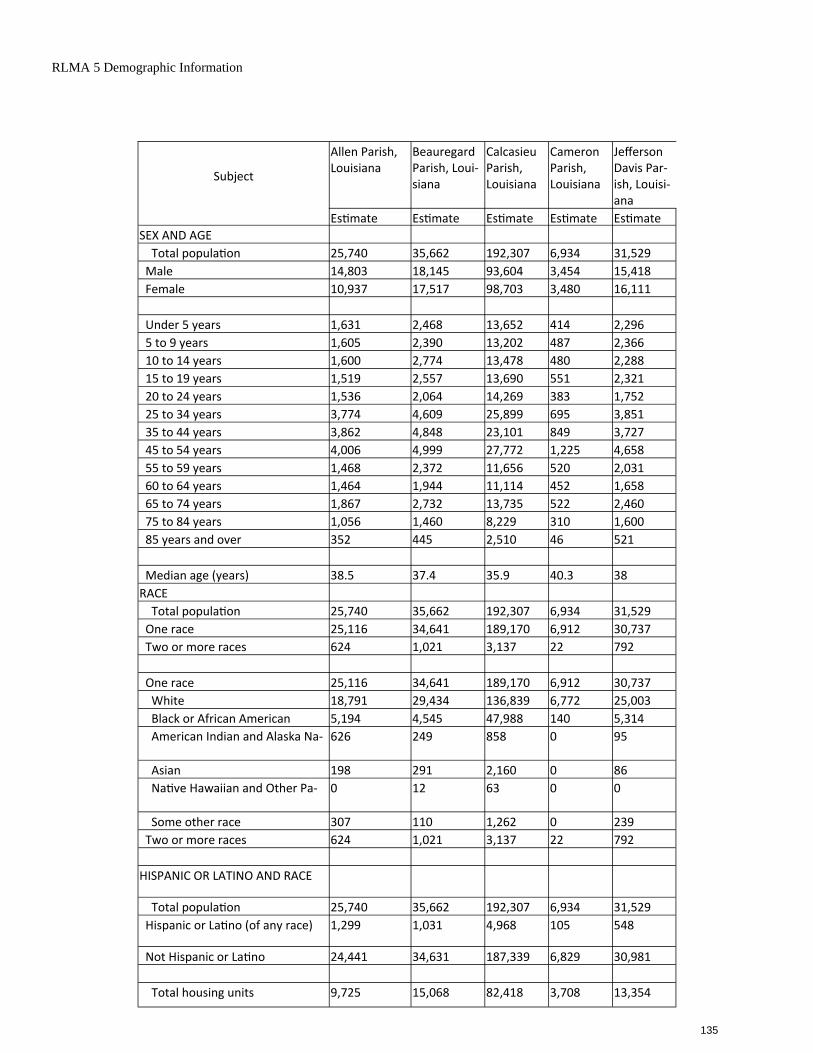
RLMA 5 Demographic Information
Subject
Allen Parish, Louisiana
Beauregard Parish, Loui-siana
Calcasieu Parish, Louisiana
Cameron Parish, Louisiana
Jefferson Davis Par-ish, Louisi-ana
Es mate Es mate Es mate Es mate Es mate SEX AND AGE Total popula on 25,740 35,662 192,307 6,934 31,529 Male 14,803 18,145 93,604 3,454 15,418 Female 10,937 17,517 98,703 3,480 16,111 Under 5 years 1,631 2,468 13,652 414 2,296 5 to 9 years 1,605 2,390 13,202 487 2,366 10 to 14 years 1,600 2,774 13,478 480 2,288 15 to 19 years 1,519 2,557 13,690 551 2,321 20 to 24 years 1,536 2,064 14,269 383 1,752 25 to 34 years 3,774 4,609 25,899 695 3,851 35 to 44 years 3,862 4,848 23,101 849 3,727 45 to 54 years 4,006 4,999 27,772 1,225 4,658 55 to 59 years 1,468 2,372 11,656 520 2,031 60 to 64 years 1,464 1,944 11,114 452 1,658 65 to 74 years 1,867 2,732 13,735 522 2,460 75 to 84 years 1,056 1,460 8,229 310 1,600 85 years and over 352 445 2,510 46 521 Median age (years) 38.5 37.4 35.9 40.3 38 RACE Total popula on 25,740 35,662 192,307 6,934 31,529 One race 25,116 34,641 189,170 6,912 30,737 Two or more races 624 1,021 3,137 22 792 One race 25,116 34,641 189,170 6,912 30,737 White 18,791 29,434 136,839 6,772 25,003 Black or African American 5,194 4,545 47,988 140 5,314 American Indian and Alaska Na- 626 249 858 0 95
Asian 198 291 2,160 0 86 Na ve Hawaiian and Other Pa- 0 12 63 0 0
Some other race 307 110 1,262 0 239 Two or more races 624 1,021 3,137 22 792 HISPANIC OR LATINO AND RACE
Total popula on 25,740 35,662 192,307 6,934 31,529 Hispanic or La no (of any race) 1,299 1,031 4,968 105 548
Not Hispanic or La no 24,441 34,631 187,339 6,829 30,981 Total housing units 9,725 15,068 82,418 3,708 13,354
135
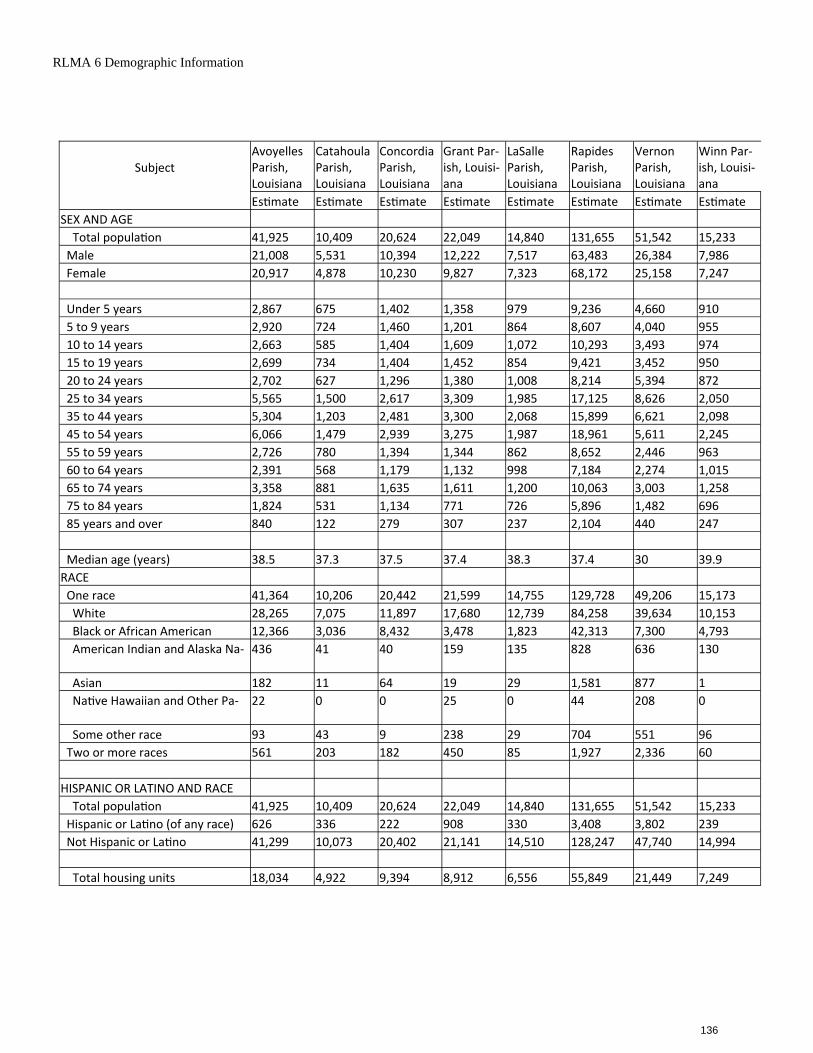
RLMA 6 Demographic Information
Subject Avoyelles Parish, Louisiana
Catahoula Parish, Louisiana
Concordia Parish, Louisiana
Grant Par-ish, Louisi-ana
LaSalle Parish, Louisiana
Rapides Parish, Louisiana
Vernon Parish, Louisiana
Winn Par-ish, Louisi-ana
Es mate Es mate Es mate Es mate Es mate Es mate Es mate Es mate SEX AND AGE Total popula on 41,925 10,409 20,624 22,049 14,840 131,655 51,542 15,233 Male 21,008 5,531 10,394 12,222 7,517 63,483 26,384 7,986 Female 20,917 4,878 10,230 9,827 7,323 68,172 25,158 7,247 Under 5 years 2,867 675 1,402 1,358 979 9,236 4,660 910 5 to 9 years 2,920 724 1,460 1,201 864 8,607 4,040 955 10 to 14 years 2,663 585 1,404 1,609 1,072 10,293 3,493 974 15 to 19 years 2,699 734 1,404 1,452 854 9,421 3,452 950 20 to 24 years 2,702 627 1,296 1,380 1,008 8,214 5,394 872 25 to 34 years 5,565 1,500 2,617 3,309 1,985 17,125 8,626 2,050 35 to 44 years 5,304 1,203 2,481 3,300 2,068 15,899 6,621 2,098 45 to 54 years 6,066 1,479 2,939 3,275 1,987 18,961 5,611 2,245 55 to 59 years 2,726 780 1,394 1,344 862 8,652 2,446 963 60 to 64 years 2,391 568 1,179 1,132 998 7,184 2,274 1,015 65 to 74 years 3,358 881 1,635 1,611 1,200 10,063 3,003 1,258 75 to 84 years 1,824 531 1,134 771 726 5,896 1,482 696 85 years and over 840 122 279 307 237 2,104 440 247 Median age (years) 38.5 37.3 37.5 37.4 38.3 37.4 30 39.9 RACE One race 41,364 10,206 20,442 21,599 14,755 129,728 49,206 15,173 White 28,265 7,075 11,897 17,680 12,739 84,258 39,634 10,153 Black or African American 12,366 3,036 8,432 3,478 1,823 42,313 7,300 4,793 American Indian and Alaska Na- 436 41 40 159 135 828 636 130
Asian 182 11 64 19 29 1,581 877 1 Na ve Hawaiian and Other Pa- 22 0 0 25 0 44 208 0
Some other race 93 43 9 238 29 704 551 96 Two or more races 561 203 182 450 85 1,927 2,336 60 HISPANIC OR LATINO AND RACE Total popula on 41,925 10,409 20,624 22,049 14,840 131,655 51,542 15,233 Hispanic or La no (of any race) 626 336 222 908 330 3,408 3,802 239 Not Hispanic or La no 41,299 10,073 20,402 21,141 14,510 128,247 47,740 14,994 Total housing units 18,034 4,922 9,394 8,912 6,556 55,849 21,449 7,249
136
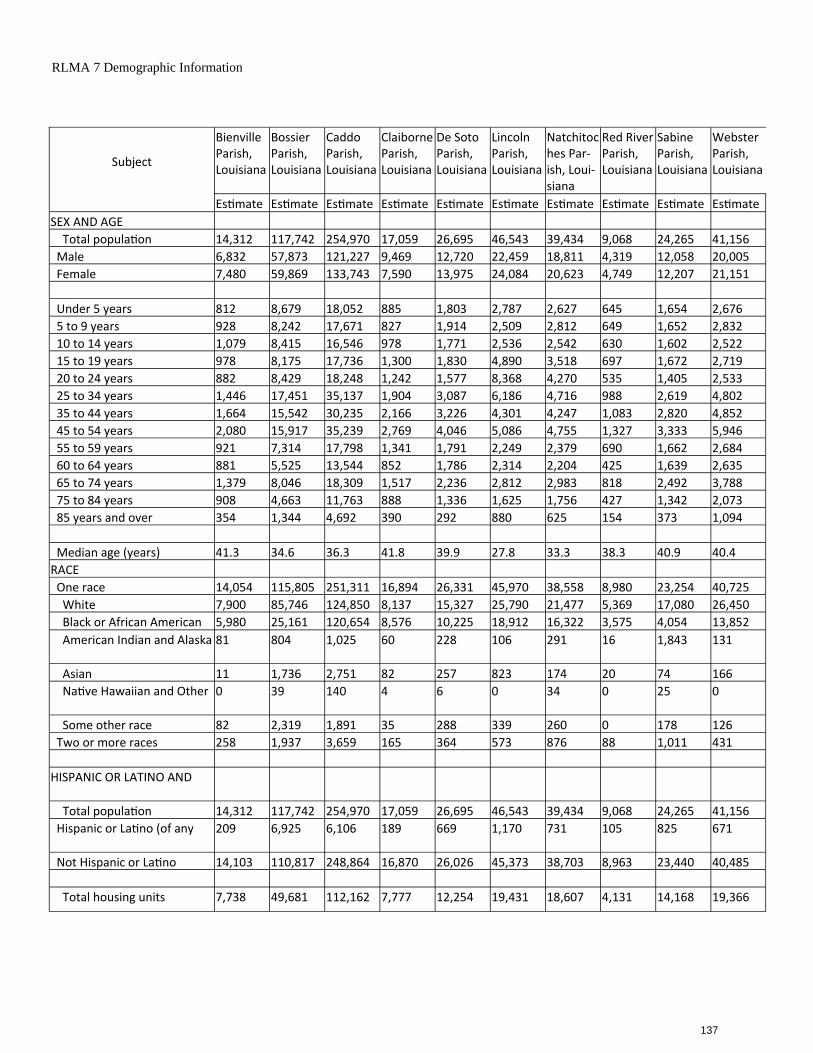
RLMA 7 Demographic Information
Subject
Bienville Parish, Louisiana
Bossier Parish, Louisiana
Caddo Parish, Louisiana
Claiborne Parish, Louisiana
De Soto Parish, Louisiana
Lincoln Parish, Louisiana
Natchitoches Par-ish, Loui-siana
Red River Parish, Louisiana
Sabine Parish, Louisiana
Webster Parish, Louisiana
Es mate Es mate Es mate Es mate Es mate Es mate Es mate Es mate Es mate Es mate SEX AND AGE Total popula on 14,312 117,742 254,970 17,059 26,695 46,543 39,434 9,068 24,265 41,156 Male 6,832 57,873 121,227 9,469 12,720 22,459 18,811 4,319 12,058 20,005 Female 7,480 59,869 133,743 7,590 13,975 24,084 20,623 4,749 12,207 21,151 Under 5 years 812 8,679 18,052 885 1,803 2,787 2,627 645 1,654 2,676 5 to 9 years 928 8,242 17,671 827 1,914 2,509 2,812 649 1,652 2,832 10 to 14 years 1,079 8,415 16,546 978 1,771 2,536 2,542 630 1,602 2,522 15 to 19 years 978 8,175 17,736 1,300 1,830 4,890 3,518 697 1,672 2,719 20 to 24 years 882 8,429 18,248 1,242 1,577 8,368 4,270 535 1,405 2,533 25 to 34 years 1,446 17,451 35,137 1,904 3,087 6,186 4,716 988 2,619 4,802 35 to 44 years 1,664 15,542 30,235 2,166 3,226 4,301 4,247 1,083 2,820 4,852 45 to 54 years 2,080 15,917 35,239 2,769 4,046 5,086 4,755 1,327 3,333 5,946 55 to 59 years 921 7,314 17,798 1,341 1,791 2,249 2,379 690 1,662 2,684 60 to 64 years 881 5,525 13,544 852 1,786 2,314 2,204 425 1,639 2,635 65 to 74 years 1,379 8,046 18,309 1,517 2,236 2,812 2,983 818 2,492 3,788 75 to 84 years 908 4,663 11,763 888 1,336 1,625 1,756 427 1,342 2,073 85 years and over 354 1,344 4,692 390 292 880 625 154 373 1,094 Median age (years) 41.3 34.6 36.3 41.8 39.9 27.8 33.3 38.3 40.9 40.4 RACE One race 14,054 115,805 251,311 16,894 26,331 45,970 38,558 8,980 23,254 40,725 White 7,900 85,746 124,850 8,137 15,327 25,790 21,477 5,369 17,080 26,450 Black or African American 5,980 25,161 120,654 8,576 10,225 18,912 16,322 3,575 4,054 13,852 American Indian and Alaska 81 804 1,025 60 228 106 291 16 1,843 131
Asian 11 1,736 2,751 82 257 823 174 20 74 166 Na ve Hawaiian and Other 0 39 140 4 6 0 34 0 25 0
Some other race 82 2,319 1,891 35 288 339 260 0 178 126 Two or more races 258 1,937 3,659 165 364 573 876 88 1,011 431 HISPANIC OR LATINO AND
Total popula on 14,312 117,742 254,970 17,059 26,695 46,543 39,434 9,068 24,265 41,156 Hispanic or La no (of any 209 6,925 6,106 189 669 1,170 731 105 825 671
Not Hispanic or La no 14,103 110,817 248,864 16,870 26,026 45,373 38,703 8,963 23,440 40,485 Total housing units 7,738 49,681 112,162 7,777 12,254 19,431 18,607 4,131 14,168 19,366
137
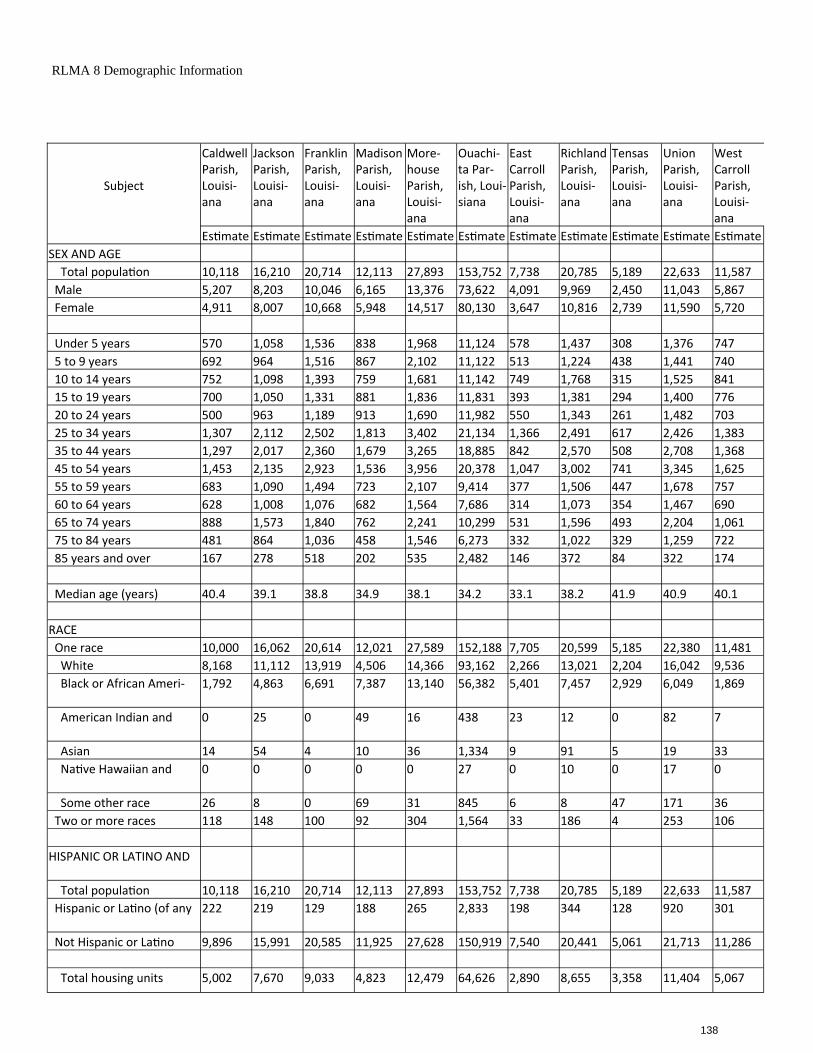
Subject
Caldwell Parish, Louisi-ana
Jackson Parish, Louisi-ana
Franklin Parish, Louisi-ana
Madison Parish, Louisi-ana
More-house Parish, Louisi-ana
Ouachi-ta Par-ish, Loui-siana
East Carroll Parish, Louisi-ana
Richland Parish, Louisi-ana
Tensas Parish, Louisi-ana
Union Parish, Louisi-ana
West Carroll Parish, Louisi-ana
Es mate Es mate Es mate Es mate Es mate Es mate Es mate Es mate Es mate Es mate Es mate SEX AND AGE Total popula on 10,118 16,210 20,714 12,113 27,893 153,752 7,738 20,785 5,189 22,633 11,587 Male 5,207 8,203 10,046 6,165 13,376 73,622 4,091 9,969 2,450 11,043 5,867 Female 4,911 8,007 10,668 5,948 14,517 80,130 3,647 10,816 2,739 11,590 5,720 Under 5 years 570 1,058 1,536 838 1,968 11,124 578 1,437 308 1,376 747 5 to 9 years 692 964 1,516 867 2,102 11,122 513 1,224 438 1,441 740 10 to 14 years 752 1,098 1,393 759 1,681 11,142 749 1,768 315 1,525 841 15 to 19 years 700 1,050 1,331 881 1,836 11,831 393 1,381 294 1,400 776 20 to 24 years 500 963 1,189 913 1,690 11,982 550 1,343 261 1,482 703 25 to 34 years 1,307 2,112 2,502 1,813 3,402 21,134 1,366 2,491 617 2,426 1,383 35 to 44 years 1,297 2,017 2,360 1,679 3,265 18,885 842 2,570 508 2,708 1,368 45 to 54 years 1,453 2,135 2,923 1,536 3,956 20,378 1,047 3,002 741 3,345 1,625 55 to 59 years 683 1,090 1,494 723 2,107 9,414 377 1,506 447 1,678 757 60 to 64 years 628 1,008 1,076 682 1,564 7,686 314 1,073 354 1,467 690 65 to 74 years 888 1,573 1,840 762 2,241 10,299 531 1,596 493 2,204 1,061 75 to 84 years 481 864 1,036 458 1,546 6,273 332 1,022 329 1,259 722 85 years and over 167 278 518 202 535 2,482 146 372 84 322 174 Median age (years) 40.4 39.1 38.8 34.9 38.1 34.2 33.1 38.2 41.9 40.9 40.1 RACE One race 10,000 16,062 20,614 12,021 27,589 152,188 7,705 20,599 5,185 22,380 11,481 White 8,168 11,112 13,919 4,506 14,366 93,162 2,266 13,021 2,204 16,042 9,536 Black or African Ameri- 1,792 4,863 6,691 7,387 13,140 56,382 5,401 7,457 2,929 6,049 1,869
American Indian and 0 25 0 49 16 438 23 12 0 82 7
Asian 14 54 4 10 36 1,334 9 91 5 19 33 Na ve Hawaiian and 0 0 0 0 0 27 0 10 0 17 0
Some other race 26 8 0 69 31 845 6 8 47 171 36 Two or more races 118 148 100 92 304 1,564 33 186 4 253 106 HISPANIC OR LATINO AND
Total popula on 10,118 16,210 20,714 12,113 27,893 153,752 7,738 20,785 5,189 22,633 11,587 Hispanic or La no (of any 222 219 129 188 265 2,833 198 344 128 920 301
Not Hispanic or La no 9,896 15,991 20,585 11,925 27,628 150,919 7,540 20,441 5,061 21,713 11,286 Total housing units 5,002 7,670 9,033 4,823 12,479 64,626 2,890 8,655 3,358 11,404 5,067
RLMA 8 Demographic Information
138
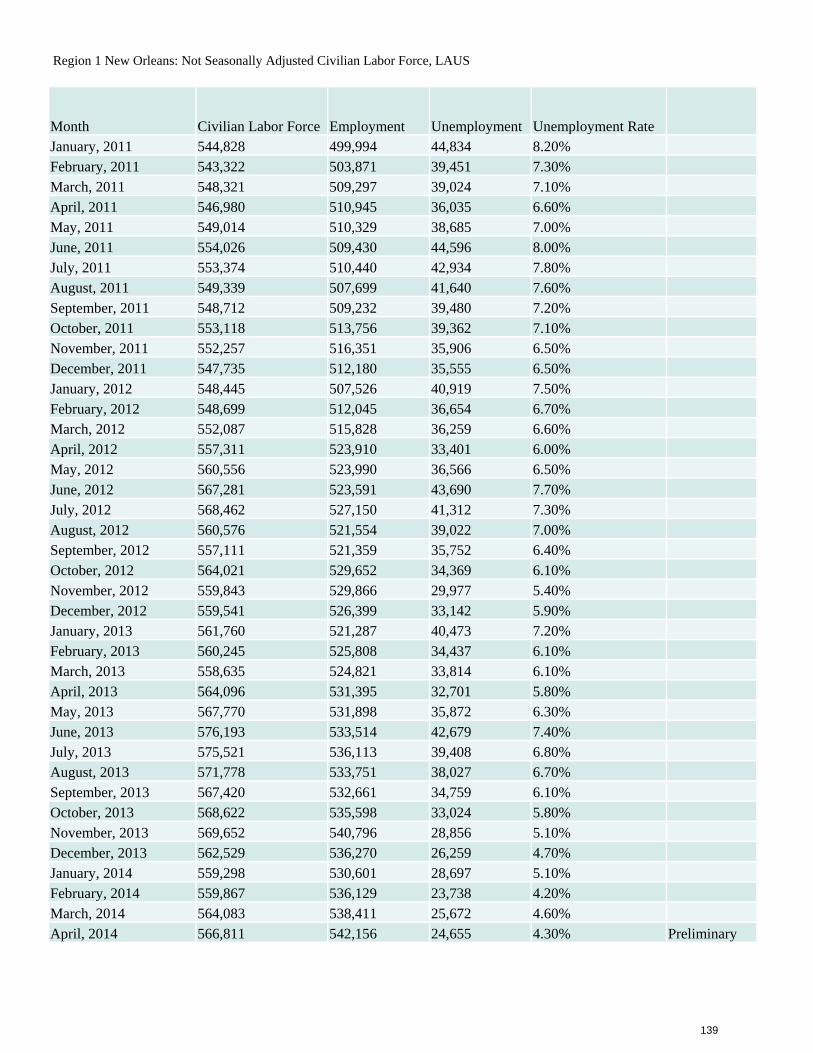
Region 1 New Orleans: Not Seasonally Adjusted Civilian Labor Force, LAUS
January, 2011 544,828 499,994 44,834 8.20% February, 2011 543,322 503,871 39,451 7.30% March, 2011 548,321 509,297 39,024 7.10% April, 2011 546,980 510,945 36,035 6.60% May, 2011 549,014 510,329 38,685 7.00% June, 2011 554,026 509,430 44,596 8.00% July, 2011 553,374 510,440 42,934 7.80% August, 2011 549,339 507,699 41,640 7.60% September, 2011 548,712 509,232 39,480 7.20% October, 2011 553,118 513,756 39,362 7.10% November, 2011 552,257 516,351 35,906 6.50% December, 2011 547,735 512,180 35,555 6.50% January, 2012 548,445 507,526 40,919 7.50% February, 2012 548,699 512,045 36,654 6.70% March, 2012 552,087 515,828 36,259 6.60% April, 2012 557,311 523,910 33,401 6.00% May, 2012 560,556 523,990 36,566 6.50% June, 2012 567,281 523,591 43,690 7.70% July, 2012 568,462 527,150 41,312 7.30% August, 2012 560,576 521,554 39,022 7.00% September, 2012 557,111 521,359 35,752 6.40% October, 2012 564,021 529,652 34,369 6.10% November, 2012 559,843 529,866 29,977 5.40% December, 2012 559,541 526,399 33,142 5.90% January, 2013 561,760 521,287 40,473 7.20% February, 2013 560,245 525,808 34,437 6.10% March, 2013 558,635 524,821 33,814 6.10% April, 2013 564,096 531,395 32,701 5.80% May, 2013 567,770 531,898 35,872 6.30% June, 2013 576,193 533,514 42,679 7.40% July, 2013 575,521 536,113 39,408 6.80% August, 2013 571,778 533,751 38,027 6.70% September, 2013 567,420 532,661 34,759 6.10% October, 2013 568,622 535,598 33,024 5.80% November, 2013 569,652 540,796 28,856 5.10% December, 2013 562,529 536,270 26,259 4.70% January, 2014 559,298 530,601 28,697 5.10% February, 2014 559,867 536,129 23,738 4.20% March, 2014 564,083 538,411 25,672 4.60% April, 2014 566,811 542,156 24,655 4.30% Preliminary
Month Civilian Labor Force Employment Unemployment Unemployment Rate
139
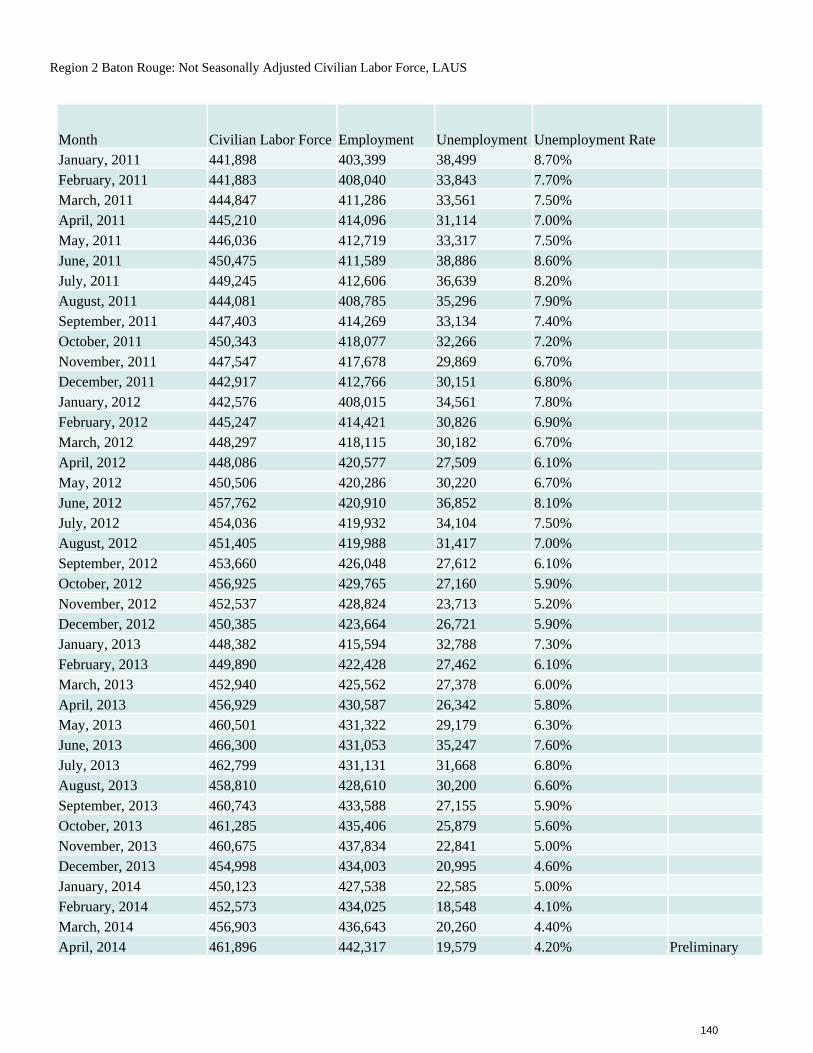
Region 2 Baton Rouge: Not Seasonally Adjusted Civilian Labor Force, LAUS
January, 2011 441,898 403,399 38,499 8.70% February, 2011 441,883 408,040 33,843 7.70% March, 2011 444,847 411,286 33,561 7.50% April, 2011 445,210 414,096 31,114 7.00% May, 2011 446,036 412,719 33,317 7.50% June, 2011 450,475 411,589 38,886 8.60% July, 2011 449,245 412,606 36,639 8.20% August, 2011 444,081 408,785 35,296 7.90% September, 2011 447,403 414,269 33,134 7.40% October, 2011 450,343 418,077 32,266 7.20% November, 2011 447,547 417,678 29,869 6.70% December, 2011 442,917 412,766 30,151 6.80% January, 2012 442,576 408,015 34,561 7.80% February, 2012 445,247 414,421 30,826 6.90% March, 2012 448,297 418,115 30,182 6.70% April, 2012 448,086 420,577 27,509 6.10% May, 2012 450,506 420,286 30,220 6.70% June, 2012 457,762 420,910 36,852 8.10% July, 2012 454,036 419,932 34,104 7.50% August, 2012 451,405 419,988 31,417 7.00% September, 2012 453,660 426,048 27,612 6.10% October, 2012 456,925 429,765 27,160 5.90% November, 2012 452,537 428,824 23,713 5.20% December, 2012 450,385 423,664 26,721 5.90% January, 2013 448,382 415,594 32,788 7.30% February, 2013 449,890 422,428 27,462 6.10% March, 2013 452,940 425,562 27,378 6.00% April, 2013 456,929 430,587 26,342 5.80% May, 2013 460,501 431,322 29,179 6.30% June, 2013 466,300 431,053 35,247 7.60% July, 2013 462,799 431,131 31,668 6.80% August, 2013 458,810 428,610 30,200 6.60% September, 2013 460,743 433,588 27,155 5.90% October, 2013 461,285 435,406 25,879 5.60% November, 2013 460,675 437,834 22,841 5.00% December, 2013 454,998 434,003 20,995 4.60% January, 2014 450,123 427,538 22,585 5.00% February, 2014 452,573 434,025 18,548 4.10% March, 2014 456,903 436,643 20,260 4.40% April, 2014 461,896 442,317 19,579 4.20% Preliminary
Month Civilian Labor Force Employment Unemployment Unemployment Rate
140
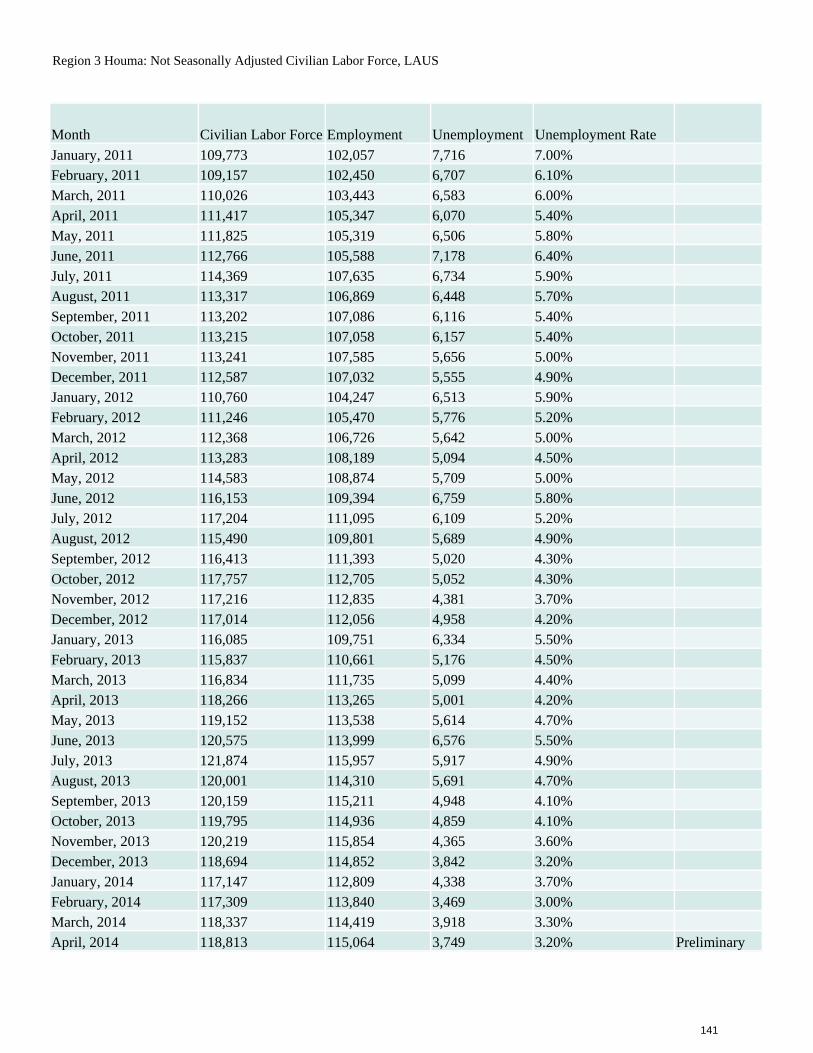
Region 3 Houma: Not Seasonally Adjusted Civilian Labor Force, LAUS
January, 2011 109,773 102,057 7,716 7.00% February, 2011 109,157 102,450 6,707 6.10% March, 2011 110,026 103,443 6,583 6.00% April, 2011 111,417 105,347 6,070 5.40% May, 2011 111,825 105,319 6,506 5.80% June, 2011 112,766 105,588 7,178 6.40% July, 2011 114,369 107,635 6,734 5.90% August, 2011 113,317 106,869 6,448 5.70% September, 2011 113,202 107,086 6,116 5.40% October, 2011 113,215 107,058 6,157 5.40% November, 2011 113,241 107,585 5,656 5.00% December, 2011 112,587 107,032 5,555 4.90% January, 2012 110,760 104,247 6,513 5.90% February, 2012 111,246 105,470 5,776 5.20% March, 2012 112,368 106,726 5,642 5.00% April, 2012 113,283 108,189 5,094 4.50% May, 2012 114,583 108,874 5,709 5.00% June, 2012 116,153 109,394 6,759 5.80% July, 2012 117,204 111,095 6,109 5.20% August, 2012 115,490 109,801 5,689 4.90% September, 2012 116,413 111,393 5,020 4.30% October, 2012 117,757 112,705 5,052 4.30% November, 2012 117,216 112,835 4,381 3.70% December, 2012 117,014 112,056 4,958 4.20% January, 2013 116,085 109,751 6,334 5.50% February, 2013 115,837 110,661 5,176 4.50% March, 2013 116,834 111,735 5,099 4.40% April, 2013 118,266 113,265 5,001 4.20% May, 2013 119,152 113,538 5,614 4.70% June, 2013 120,575 113,999 6,576 5.50% July, 2013 121,874 115,957 5,917 4.90% August, 2013 120,001 114,310 5,691 4.70% September, 2013 120,159 115,211 4,948 4.10% October, 2013 119,795 114,936 4,859 4.10% November, 2013 120,219 115,854 4,365 3.60% December, 2013 118,694 114,852 3,842 3.20% January, 2014 117,147 112,809 4,338 3.70% February, 2014 117,309 113,840 3,469 3.00% March, 2014 118,337 114,419 3,918 3.30% April, 2014 118,813 115,064 3,749 3.20% Preliminary
Month Civilian Labor Force Employment Unemployment Unemployment Rate
141
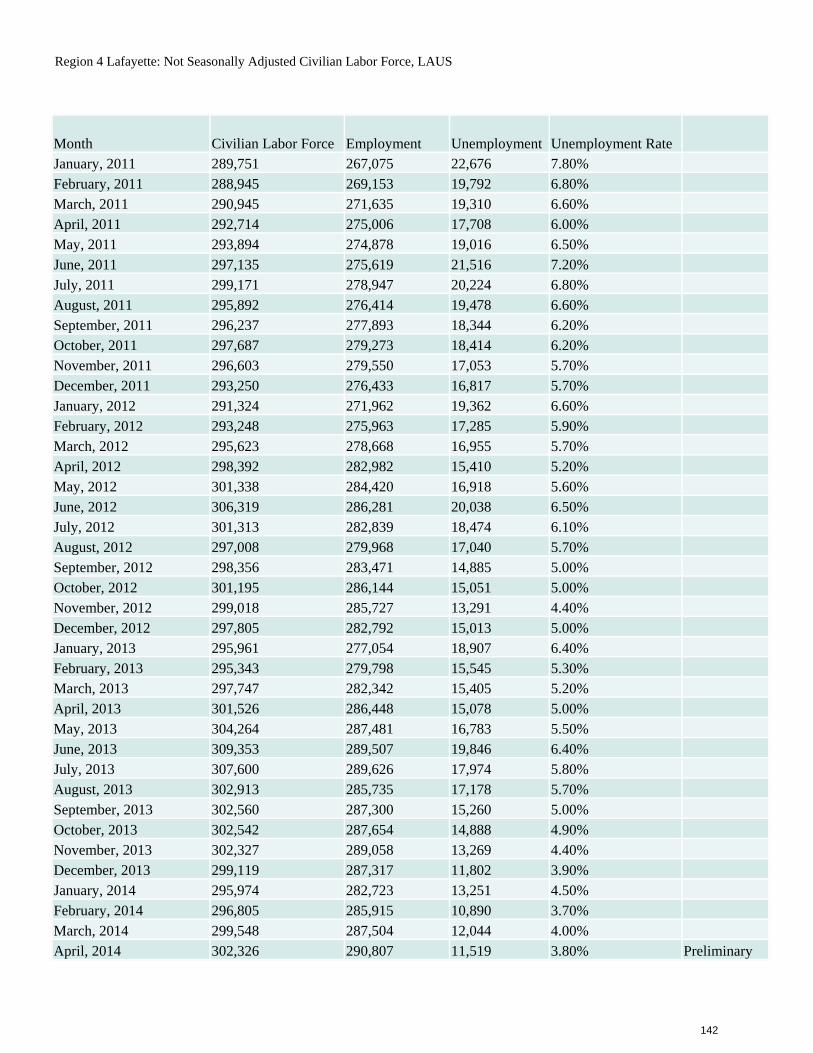
Region 4 Lafayette: Not Seasonally Adjusted Civilian Labor Force, LAUS
January, 2011 289,751 267,075 22,676 7.80% February, 2011 288,945 269,153 19,792 6.80% March, 2011 290,945 271,635 19,310 6.60% April, 2011 292,714 275,006 17,708 6.00% May, 2011 293,894 274,878 19,016 6.50% June, 2011 297,135 275,619 21,516 7.20% July, 2011 299,171 278,947 20,224 6.80% August, 2011 295,892 276,414 19,478 6.60% September, 2011 296,237 277,893 18,344 6.20% October, 2011 297,687 279,273 18,414 6.20% November, 2011 296,603 279,550 17,053 5.70% December, 2011 293,250 276,433 16,817 5.70% January, 2012 291,324 271,962 19,362 6.60% February, 2012 293,248 275,963 17,285 5.90% March, 2012 295,623 278,668 16,955 5.70% April, 2012 298,392 282,982 15,410 5.20% May, 2012 301,338 284,420 16,918 5.60% June, 2012 306,319 286,281 20,038 6.50% July, 2012 301,313 282,839 18,474 6.10% August, 2012 297,008 279,968 17,040 5.70% September, 2012 298,356 283,471 14,885 5.00% October, 2012 301,195 286,144 15,051 5.00% November, 2012 299,018 285,727 13,291 4.40% December, 2012 297,805 282,792 15,013 5.00% January, 2013 295,961 277,054 18,907 6.40% February, 2013 295,343 279,798 15,545 5.30% March, 2013 297,747 282,342 15,405 5.20% April, 2013 301,526 286,448 15,078 5.00% May, 2013 304,264 287,481 16,783 5.50% June, 2013 309,353 289,507 19,846 6.40% July, 2013 307,600 289,626 17,974 5.80% August, 2013 302,913 285,735 17,178 5.70% September, 2013 302,560 287,300 15,260 5.00% October, 2013 302,542 287,654 14,888 4.90% November, 2013 302,327 289,058 13,269 4.40% December, 2013 299,119 287,317 11,802 3.90% January, 2014 295,974 282,723 13,251 4.50% February, 2014 296,805 285,915 10,890 3.70% March, 2014 299,548 287,504 12,044 4.00% April, 2014 302,326 290,807 11,519 3.80% Preliminary
Month Civilian Labor Force Employment Unemployment Unemployment Rate
142
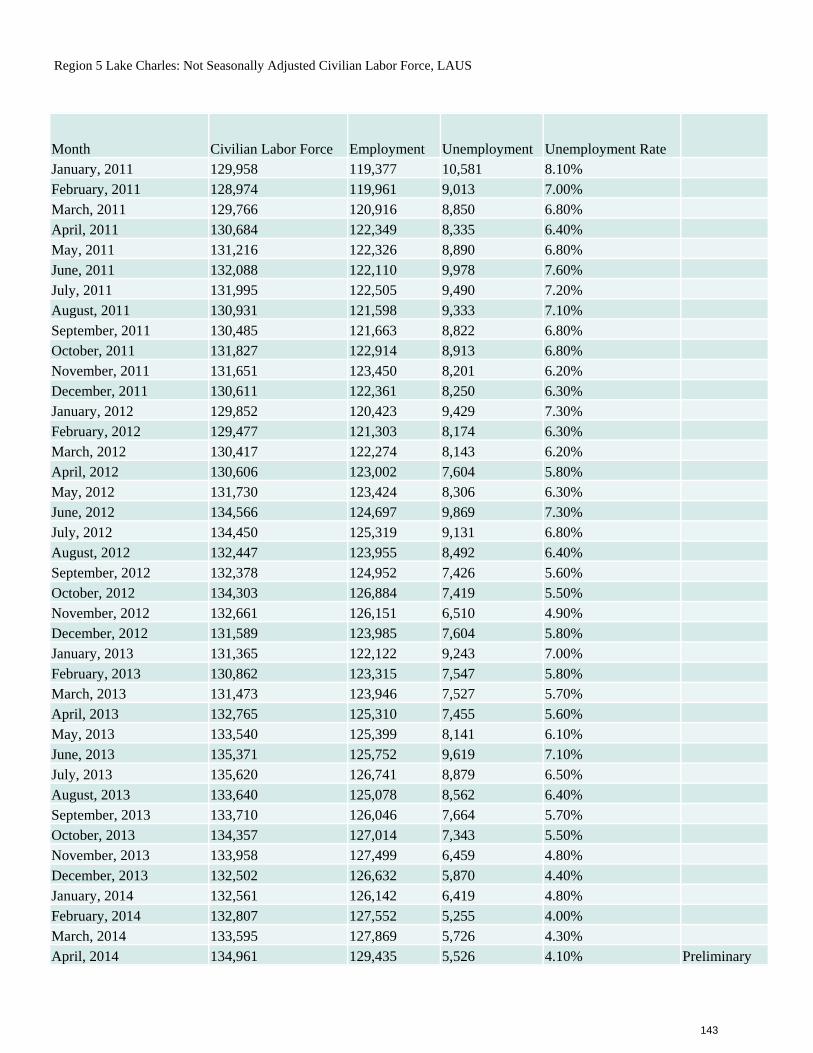
Region 5 Lake Charles: Not Seasonally Adjusted Civilian Labor Force, LAUS
January, 2011 129,958 119,377 10,581 8.10% February, 2011 128,974 119,961 9,013 7.00% March, 2011 129,766 120,916 8,850 6.80% April, 2011 130,684 122,349 8,335 6.40% May, 2011 131,216 122,326 8,890 6.80% June, 2011 132,088 122,110 9,978 7.60% July, 2011 131,995 122,505 9,490 7.20% August, 2011 130,931 121,598 9,333 7.10% September, 2011 130,485 121,663 8,822 6.80% October, 2011 131,827 122,914 8,913 6.80% November, 2011 131,651 123,450 8,201 6.20% December, 2011 130,611 122,361 8,250 6.30% January, 2012 129,852 120,423 9,429 7.30% February, 2012 129,477 121,303 8,174 6.30% March, 2012 130,417 122,274 8,143 6.20% April, 2012 130,606 123,002 7,604 5.80% May, 2012 131,730 123,424 8,306 6.30% June, 2012 134,566 124,697 9,869 7.30% July, 2012 134,450 125,319 9,131 6.80% August, 2012 132,447 123,955 8,492 6.40% September, 2012 132,378 124,952 7,426 5.60% October, 2012 134,303 126,884 7,419 5.50% November, 2012 132,661 126,151 6,510 4.90% December, 2012 131,589 123,985 7,604 5.80% January, 2013 131,365 122,122 9,243 7.00% February, 2013 130,862 123,315 7,547 5.80% March, 2013 131,473 123,946 7,527 5.70% April, 2013 132,765 125,310 7,455 5.60% May, 2013 133,540 125,399 8,141 6.10% June, 2013 135,371 125,752 9,619 7.10% July, 2013 135,620 126,741 8,879 6.50% August, 2013 133,640 125,078 8,562 6.40% September, 2013 133,710 126,046 7,664 5.70% October, 2013 134,357 127,014 7,343 5.50% November, 2013 133,958 127,499 6,459 4.80% December, 2013 132,502 126,632 5,870 4.40% January, 2014 132,561 126,142 6,419 4.80% February, 2014 132,807 127,552 5,255 4.00% March, 2014 133,595 127,869 5,726 4.30% April, 2014 134,961 129,435 5,526 4.10% Preliminary
Month Civilian Labor Force Employment Unemployment Unemployment Rate
143
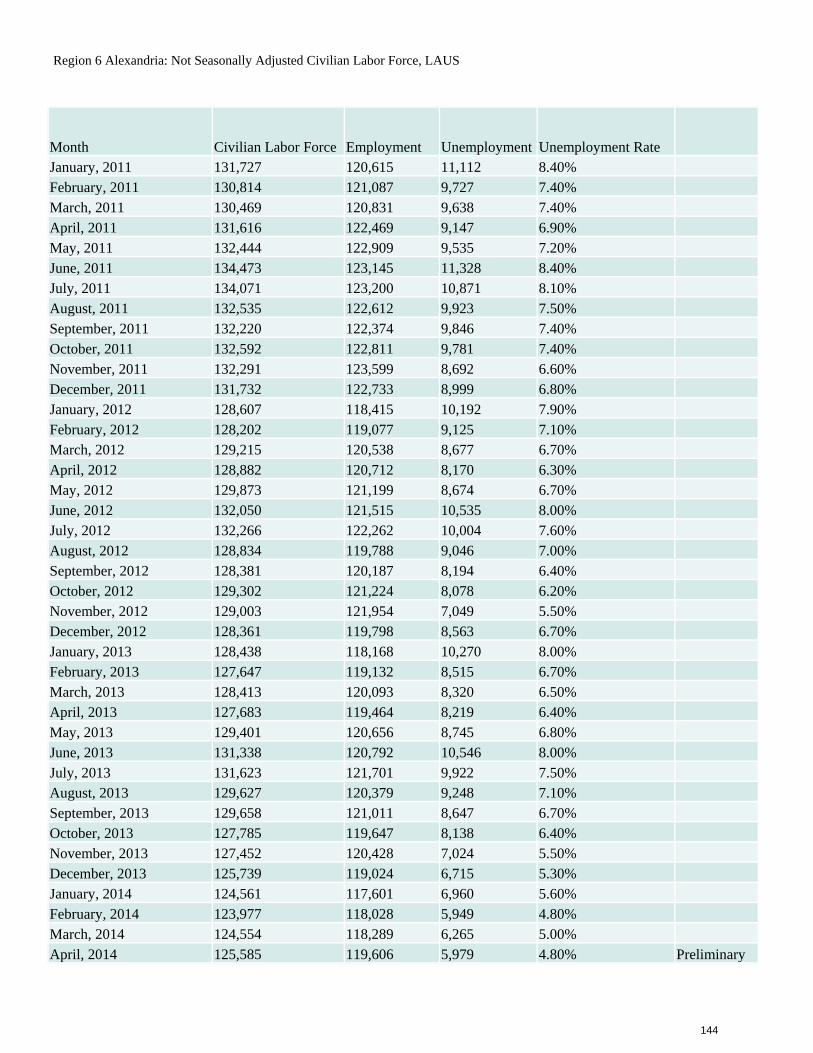
Region 6 Alexandria: Not Seasonally Adjusted Civilian Labor Force, LAUS
January, 2011 131,727 120,615 11,112 8.40% February, 2011 130,814 121,087 9,727 7.40% March, 2011 130,469 120,831 9,638 7.40% April, 2011 131,616 122,469 9,147 6.90% May, 2011 132,444 122,909 9,535 7.20% June, 2011 134,473 123,145 11,328 8.40% July, 2011 134,071 123,200 10,871 8.10% August, 2011 132,535 122,612 9,923 7.50% September, 2011 132,220 122,374 9,846 7.40% October, 2011 132,592 122,811 9,781 7.40% November, 2011 132,291 123,599 8,692 6.60% December, 2011 131,732 122,733 8,999 6.80% January, 2012 128,607 118,415 10,192 7.90% February, 2012 128,202 119,077 9,125 7.10% March, 2012 129,215 120,538 8,677 6.70% April, 2012 128,882 120,712 8,170 6.30% May, 2012 129,873 121,199 8,674 6.70% June, 2012 132,050 121,515 10,535 8.00% July, 2012 132,266 122,262 10,004 7.60% August, 2012 128,834 119,788 9,046 7.00% September, 2012 128,381 120,187 8,194 6.40% October, 2012 129,302 121,224 8,078 6.20% November, 2012 129,003 121,954 7,049 5.50% December, 2012 128,361 119,798 8,563 6.70% January, 2013 128,438 118,168 10,270 8.00% February, 2013 127,647 119,132 8,515 6.70% March, 2013 128,413 120,093 8,320 6.50% April, 2013 127,683 119,464 8,219 6.40% May, 2013 129,401 120,656 8,745 6.80% June, 2013 131,338 120,792 10,546 8.00% July, 2013 131,623 121,701 9,922 7.50% August, 2013 129,627 120,379 9,248 7.10% September, 2013 129,658 121,011 8,647 6.70% October, 2013 127,785 119,647 8,138 6.40% November, 2013 127,452 120,428 7,024 5.50% December, 2013 125,739 119,024 6,715 5.30% January, 2014 124,561 117,601 6,960 5.60% February, 2014 123,977 118,028 5,949 4.80% March, 2014 124,554 118,289 6,265 5.00% April, 2014 125,585 119,606 5,979 4.80% Preliminary
Month Civilian Labor Force Employment Unemployment Unemployment Rate
144
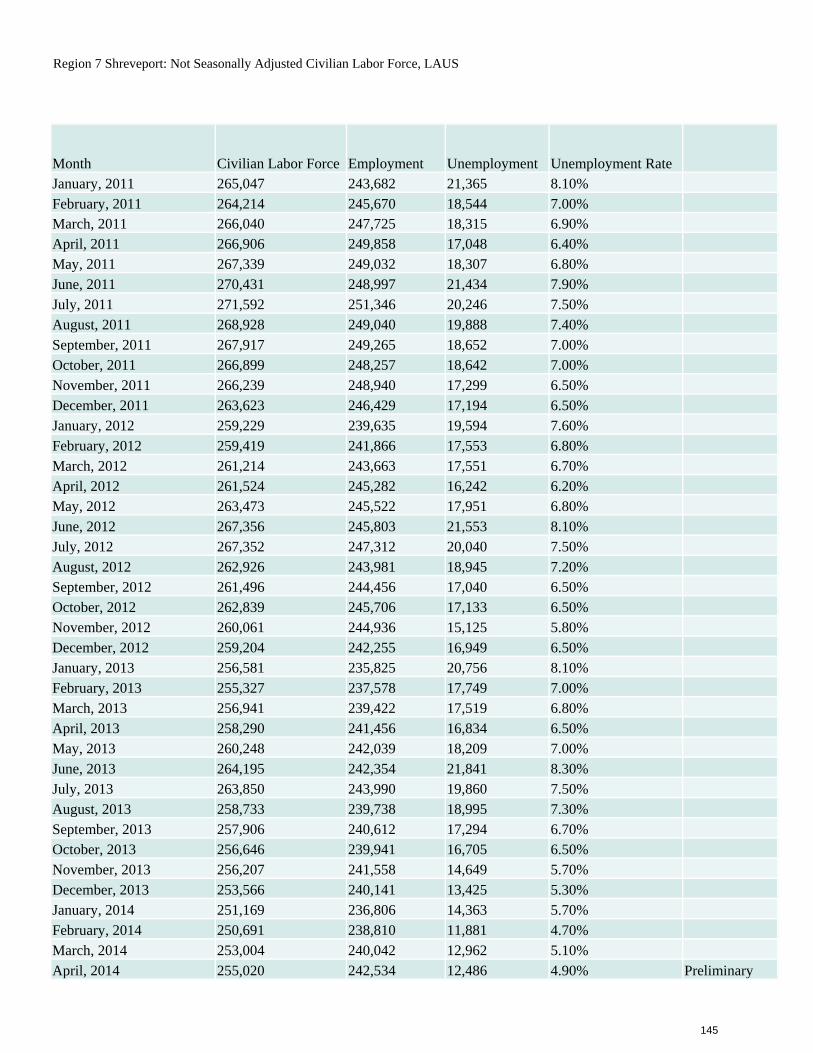
Region 7 Shreveport: Not Seasonally Adjusted Civilian Labor Force, LAUS
January, 2011 265,047 243,682 21,365 8.10% February, 2011 264,214 245,670 18,544 7.00% March, 2011 266,040 247,725 18,315 6.90% April, 2011 266,906 249,858 17,048 6.40% May, 2011 267,339 249,032 18,307 6.80% June, 2011 270,431 248,997 21,434 7.90% July, 2011 271,592 251,346 20,246 7.50% August, 2011 268,928 249,040 19,888 7.40% September, 2011 267,917 249,265 18,652 7.00% October, 2011 266,899 248,257 18,642 7.00% November, 2011 266,239 248,940 17,299 6.50% December, 2011 263,623 246,429 17,194 6.50% January, 2012 259,229 239,635 19,594 7.60% February, 2012 259,419 241,866 17,553 6.80% March, 2012 261,214 243,663 17,551 6.70% April, 2012 261,524 245,282 16,242 6.20% May, 2012 263,473 245,522 17,951 6.80% June, 2012 267,356 245,803 21,553 8.10% July, 2012 267,352 247,312 20,040 7.50% August, 2012 262,926 243,981 18,945 7.20% September, 2012 261,496 244,456 17,040 6.50% October, 2012 262,839 245,706 17,133 6.50% November, 2012 260,061 244,936 15,125 5.80% December, 2012 259,204 242,255 16,949 6.50% January, 2013 256,581 235,825 20,756 8.10% February, 2013 255,327 237,578 17,749 7.00% March, 2013 256,941 239,422 17,519 6.80% April, 2013 258,290 241,456 16,834 6.50% May, 2013 260,248 242,039 18,209 7.00% June, 2013 264,195 242,354 21,841 8.30% July, 2013 263,850 243,990 19,860 7.50% August, 2013 258,733 239,738 18,995 7.30% September, 2013 257,906 240,612 17,294 6.70% October, 2013 256,646 239,941 16,705 6.50% November, 2013 256,207 241,558 14,649 5.70% December, 2013 253,566 240,141 13,425 5.30% January, 2014 251,169 236,806 14,363 5.70% February, 2014 250,691 238,810 11,881 4.70% March, 2014 253,004 240,042 12,962 5.10% April, 2014 255,020 242,534 12,486 4.90% Preliminary
Month Civilian Labor Force Employment Unemployment Unemployment Rate
145
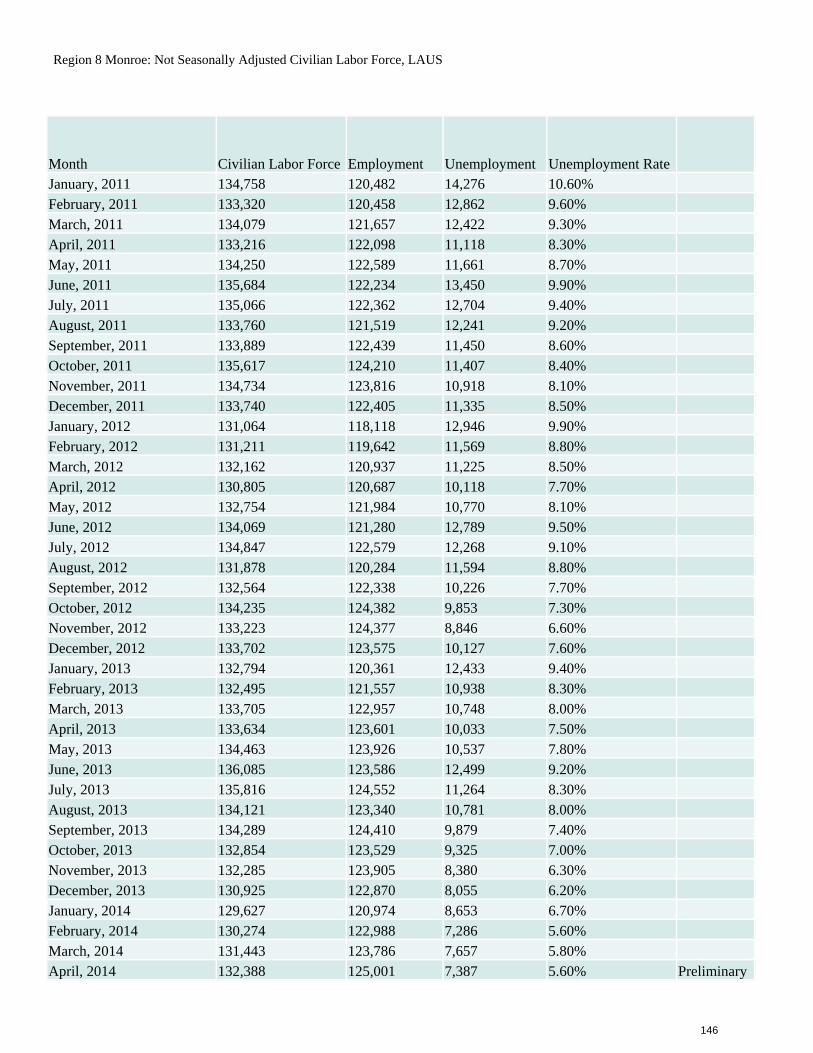
Region 8 Monroe: Not Seasonally Adjusted Civilian Labor Force, LAUS
January, 2011 134,758 120,482 14,276 10.60% February, 2011 133,320 120,458 12,862 9.60% March, 2011 134,079 121,657 12,422 9.30% April, 2011 133,216 122,098 11,118 8.30% May, 2011 134,250 122,589 11,661 8.70% June, 2011 135,684 122,234 13,450 9.90% July, 2011 135,066 122,362 12,704 9.40% August, 2011 133,760 121,519 12,241 9.20% September, 2011 133,889 122,439 11,450 8.60% October, 2011 135,617 124,210 11,407 8.40% November, 2011 134,734 123,816 10,918 8.10% December, 2011 133,740 122,405 11,335 8.50% January, 2012 131,064 118,118 12,946 9.90% February, 2012 131,211 119,642 11,569 8.80% March, 2012 132,162 120,937 11,225 8.50% April, 2012 130,805 120,687 10,118 7.70% May, 2012 132,754 121,984 10,770 8.10% June, 2012 134,069 121,280 12,789 9.50% July, 2012 134,847 122,579 12,268 9.10% August, 2012 131,878 120,284 11,594 8.80% September, 2012 132,564 122,338 10,226 7.70% October, 2012 134,235 124,382 9,853 7.30% November, 2012 133,223 124,377 8,846 6.60% December, 2012 133,702 123,575 10,127 7.60% January, 2013 132,794 120,361 12,433 9.40% February, 2013 132,495 121,557 10,938 8.30% March, 2013 133,705 122,957 10,748 8.00% April, 2013 133,634 123,601 10,033 7.50% May, 2013 134,463 123,926 10,537 7.80% June, 2013 136,085 123,586 12,499 9.20% July, 2013 135,816 124,552 11,264 8.30% August, 2013 134,121 123,340 10,781 8.00% September, 2013 134,289 124,410 9,879 7.40% October, 2013 132,854 123,529 9,325 7.00% November, 2013 132,285 123,905 8,380 6.30% December, 2013 130,925 122,870 8,055 6.20% January, 2014 129,627 120,974 8,653 6.70% February, 2014 130,274 122,988 7,286 5.60% March, 2014 131,443 123,786 7,657 5.80% April, 2014 132,388 125,001 7,387 5.60% Preliminary
Month Civilian Labor Force Employment Unemployment Unemployment Rate
146

Louisiana Nonfarm Employment Current Employment Statistics
State and Area Employment, Hours, and Seasonally Adjusted
Year Jan Feb Mar Apr May Jun Jul Aug Sep Oct Nov Dec Annual 2007 1897.8 1903.9 1913.2 1903.7 1905.7 1912.4 1911.9 1918.5 1923.3 1928.4 1931.3 1935.1 2008 1931.9 1937.8 1937.1 1938.4 1939.0 1939.7 1936.7 1944.0 1924.1 1940.6 1942.5 1940.6 2009 1931.4 1928.7 1917.4 1904.0 1904.4 1896.7 1894.1 1894.2 1892.7 1885.7 1886.0 1878.6 2010 1876.3 1875.0 1880.8 1883.4 1889.3 1895.5 1885.6 1884.3 1882.1 1885.6 1885.0 1889.2 2011 1892.5 1897.2 1897.6 1899.1 1899.0 1894.3 1905.0 1903.4 1906.0 1907.2 1908.8 1910.9 2012 1914.8 1917.4 1919.2 1929.4 1930.6 1928.1 1924.2 1923.1 1923.7 1927.5 1933.8 1934.8 2013 1938.2 1945.1 1944.5 1946.1 1948.5 1951.5 1949.5 1953.1 1954.8 1964.4 1963.4 1963.2 2014 1953.1 1954.5 1955.8 1960.5
State and Area Employment, Hours, and Not Seasonally Adjusted
Year Jan Feb Mar Apr May Jun Jul Aug Sep Oct Nov Dec Annual 2007 1876.5 1895.4 1915.5 1904.5 1911.6 1917.7 1894.0 1911.3 1922.0 1936.5 1947.1 1953.5 1915.5 2008 1910.6 1928.5 1937.6 1939.9 1945.5 1940.8 1919.8 1938.0 1922.5 1950.4 1957.5 1958.8 1937.5 2009 1910.3 1917.9 1918.2 1909.5 1912.0 1897.0 1881.1 1885.9 1890.9 1894.3 1901.4 1895.4 1901.2 2010 1855.7 1864.1 1881.1 1889.7 1897.7 1895.6 1873.0 1876.1 1885.6 1895.5 1900.5 1902.2 1884.7 2011 1871.5 1885.6 1897.6 1906.3 1908.0 1896.3 1887.3 1894.6 1909.0 1917.2 1924.1 1923.4 1901.7 2012 1893.6 1907.9 1919.2 1933.8 1940.0 1930.4 1906.7 1916.3 1920.4 1937.9 1950.9 1950.1 1925.6 2013 1917.0 1935.7 1944.5 1951.1 1954.6 1952.1 1932.1 1945.9 1951.1 1973.1 1979.6 1974.9 1951.0 2014 1939.0 1950.0 1959.3 1967.5
147
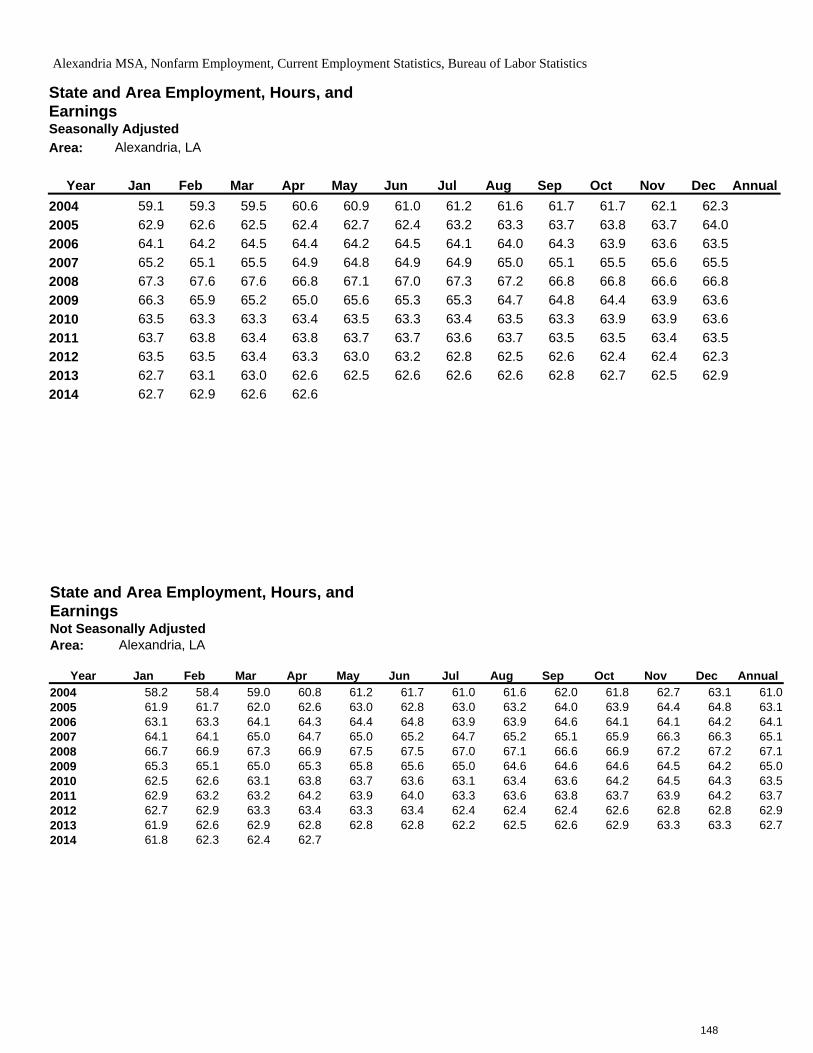
Alexandria MSA, Nonfarm Employment, Current Employment Statistics, Bureau of Labor Statistics
State and Area Employment, Hours, and Earnings Seasonally Adjusted Area: Alexandria, LA
Year Jan Feb Mar Apr May Jun Jul Aug Sep Oct Nov Dec Annual 2004 59.1 59.3 59.5 60.6 60.9 61.0 61.2 61.6 61.7 61.7 62.1 62.3 2005 62.9 62.6 62.5 62.4 62.7 62.4 63.2 63.3 63.7 63.8 63.7 64.0 2006 64.1 64.2 64.5 64.4 64.2 64.5 64.1 64.0 64.3 63.9 63.6 63.5 2007 65.2 65.1 65.5 64.9 64.8 64.9 64.9 65.0 65.1 65.5 65.6 65.5 2008 67.3 67.6 67.6 66.8 67.1 67.0 67.3 67.2 66.8 66.8 66.6 66.8 2009 66.3 65.9 65.2 65.0 65.6 65.3 65.3 64.7 64.8 64.4 63.9 63.6 2010 63.5 63.3 63.3 63.4 63.5 63.3 63.4 63.5 63.3 63.9 63.9 63.6 2011 63.7 63.8 63.4 63.8 63.7 63.7 63.6 63.7 63.5 63.5 63.4 63.5 2012 63.5 63.5 63.4 63.3 63.0 63.2 62.8 62.5 62.6 62.4 62.4 62.3 2013 62.7 63.1 63.0 62.6 62.5 62.6 62.6 62.6 62.8 62.7 62.5 62.9 2014 62.7 62.9 62.6 62.6
State and Area Employment, Hours, and Earnings Not Seasonally Adjusted Area: Alexandria, LA
Year Jan Feb Mar Apr May Jun Jul Aug Sep Oct Nov Dec Annual 2004 58.2 58.4 59.0 60.8 61.2 61.7 61.0 61.6 62.0 61.8 62.7 63.1 61.0 2005 61.9 61.7 62.0 62.6 63.0 62.8 63.0 63.2 64.0 63.9 64.4 64.8 63.1 2006 63.1 63.3 64.1 64.3 64.4 64.8 63.9 63.9 64.6 64.1 64.1 64.2 64.1 2007 64.1 64.1 65.0 64.7 65.0 65.2 64.7 65.2 65.1 65.9 66.3 66.3 65.1 2008 66.7 66.9 67.3 66.9 67.5 67.5 67.0 67.1 66.6 66.9 67.2 67.2 67.1 2009 65.3 65.1 65.0 65.3 65.8 65.6 65.0 64.6 64.6 64.6 64.5 64.2 65.0 2010 62.5 62.6 63.1 63.8 63.7 63.6 63.1 63.4 63.6 64.2 64.5 64.3 63.5 2011 62.9 63.2 63.2 64.2 63.9 64.0 63.3 63.6 63.8 63.7 63.9 64.2 63.7 2012 62.7 62.9 63.3 63.4 63.3 63.4 62.4 62.4 62.4 62.6 62.8 62.8 62.9 2013 61.9 62.6 62.9 62.8 62.8 62.8 62.2 62.5 62.6 62.9 63.3 63.3 62.7 2014 61.8 62.3 62.4 62.7
148
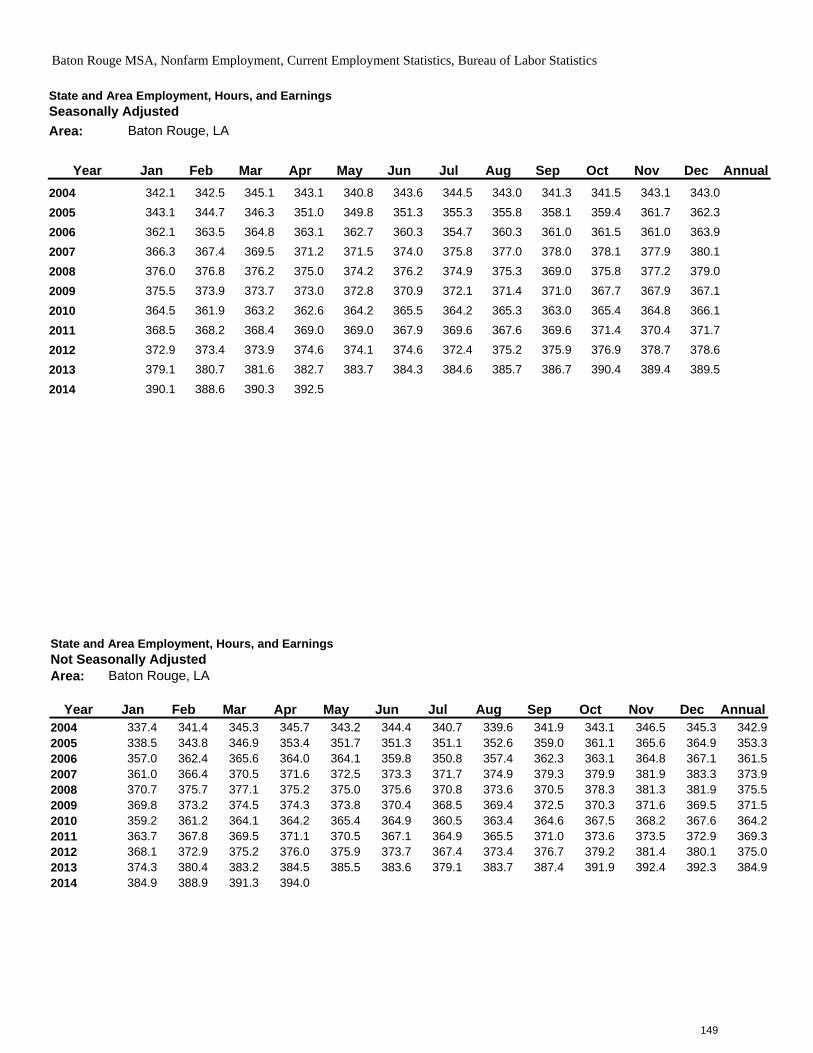
State and Area Employment, Hours, and Earnings Seasonally Adjusted Area: Baton Rouge, LA
Year Jan Feb Mar Apr May Jun Jul Aug Sep Oct Nov Dec Annual 2004 342.1 342.5 345.1 343.1 340.8 343.6 344.5 343.0 341.3 341.5 343.1 343.0
2005 343.1 344.7 346.3 351.0 349.8 351.3 355.3 355.8 358.1 359.4 361.7 362.3
2006 362.1 363.5 364.8 363.1 362.7 360.3 354.7 360.3 361.0 361.5 361.0 363.9
2007 366.3 367.4 369.5 371.2 371.5 374.0 375.8 377.0 378.0 378.1 377.9 380.1
2008 376.0 376.8 376.2 375.0 374.2 376.2 374.9 375.3 369.0 375.8 377.2 379.0
2009 375.5 373.9 373.7 373.0 372.8 370.9 372.1 371.4 371.0 367.7 367.9 367.1
2010 364.5 361.9 363.2 362.6 364.2 365.5 364.2 365.3 363.0 365.4 364.8 366.1
2011 368.5 368.2 368.4 369.0 369.0 367.9 369.6 367.6 369.6 371.4 370.4 371.7
2012 372.9 373.4 373.9 374.6 374.1 374.6 372.4 375.2 375.9 376.9 378.7 378.6
2013 379.1 380.7 381.6 382.7 383.7 384.3 384.6 385.7 386.7 390.4 389.4 389.5
2014 390.1 388.6 390.3 392.5
State and Area Employment, Hours, and Earnings Not Seasonally Adjusted Area: Baton Rouge, LA
Year Jan Feb Mar Apr May Jun Jul Aug Sep Oct Nov Dec Annual 2004 337.4 341.4 345.3 345.7 343.2 344.4 340.7 339.6 341.9 343.1 346.5 345.3 342.9 2005 338.5 343.8 346.9 353.4 351.7 351.3 351.1 352.6 359.0 361.1 365.6 364.9 353.3 2006 357.0 362.4 365.6 364.0 364.1 359.8 350.8 357.4 362.3 363.1 364.8 367.1 361.5 2007 361.0 366.4 370.5 371.6 372.5 373.3 371.7 374.9 379.3 379.9 381.9 383.3 373.9 2008 370.7 375.7 377.1 375.2 375.0 375.6 370.8 373.6 370.5 378.3 381.3 381.9 375.5 2009 369.8 373.2 374.5 374.3 373.8 370.4 368.5 369.4 372.5 370.3 371.6 369.5 371.5 2010 359.2 361.2 364.1 364.2 365.4 364.9 360.5 363.4 364.6 367.5 368.2 367.6 364.2 2011 363.7 367.8 369.5 371.1 370.5 367.1 364.9 365.5 371.0 373.6 373.5 372.9 369.3 2012 368.1 372.9 375.2 376.0 375.9 373.7 367.4 373.4 376.7 379.2 381.4 380.1 375.0 2013 374.3 380.4 383.2 384.5 385.5 383.6 379.1 383.7 387.4 391.9 392.4 392.3 384.9 2014 384.9 388.9 391.3 394.0
Baton Rouge MSA, Nonfarm Employment, Current Employment Statistics, Bureau of Labor Statistics
149
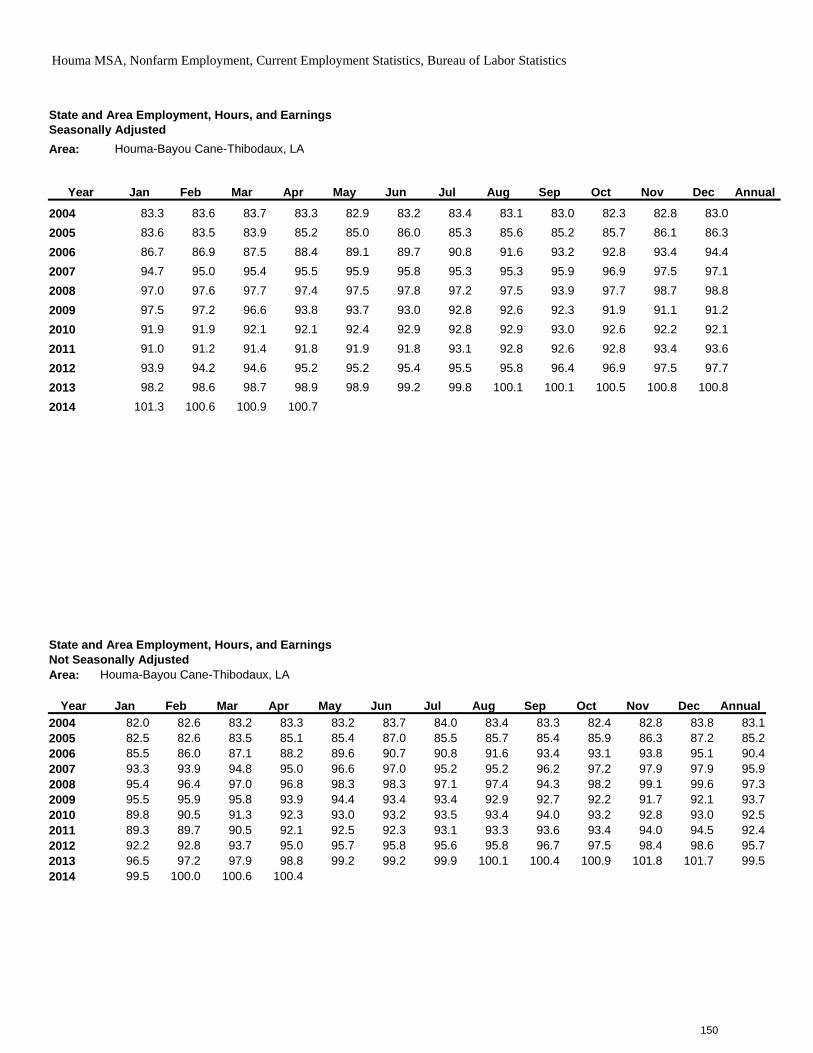
State and Area Employment, Hours, and Earnings Seasonally Adjusted Area: Houma-Bayou Cane-Thibodaux, LA
Year Jan Feb Mar Apr May Jun Jul Aug Sep Oct Nov Dec Annual
2004 83.3 83.6 83.7 83.3 82.9 83.2 83.4 83.1 83.0 82.3 82.8 83.0 2005 83.6 83.5 83.9 85.2 85.0 86.0 85.3 85.6 85.2 85.7 86.1 86.3 2006 86.7 86.9 87.5 88.4 89.1 89.7 90.8 91.6 93.2 92.8 93.4 94.4 2007 94.7 95.0 95.4 95.5 95.9 95.8 95.3 95.3 95.9 96.9 97.5 97.1 2008 97.0 97.6 97.7 97.4 97.5 97.8 97.2 97.5 93.9 97.7 98.7 98.8 2009 97.5 97.2 96.6 93.8 93.7 93.0 92.8 92.6 92.3 91.9 91.1 91.2 2010 91.9 91.9 92.1 92.1 92.4 92.9 92.8 92.9 93.0 92.6 92.2 92.1 2011 91.0 91.2 91.4 91.8 91.9 91.8 93.1 92.8 92.6 92.8 93.4 93.6 2012 93.9 94.2 94.6 95.2 95.2 95.4 95.5 95.8 96.4 96.9 97.5 97.7 2013 98.2 98.6 98.7 98.9 98.9 99.2 99.8 100.1 100.1 100.5 100.8 100.8 2014 101.3 100.6 100.9 100.7
State and Area Employment, Hours, and Earnings Not Seasonally Adjusted Area: Houma-Bayou Cane-Thibodaux, LA
Year Jan Feb Mar Apr May Jun Jul Aug Sep Oct Nov Dec Annual 2004 82.0 82.6 83.2 83.3 83.2 83.7 84.0 83.4 83.3 82.4 82.8 83.8 83.1 2005 82.5 82.6 83.5 85.1 85.4 87.0 85.5 85.7 85.4 85.9 86.3 87.2 85.2 2006 85.5 86.0 87.1 88.2 89.6 90.7 90.8 91.6 93.4 93.1 93.8 95.1 90.4 2007 93.3 93.9 94.8 95.0 96.6 97.0 95.2 95.2 96.2 97.2 97.9 97.9 95.9 2008 95.4 96.4 97.0 96.8 98.3 98.3 97.1 97.4 94.3 98.2 99.1 99.6 97.3 2009 95.5 95.9 95.8 93.9 94.4 93.4 93.4 92.9 92.7 92.2 91.7 92.1 93.7 2010 89.8 90.5 91.3 92.3 93.0 93.2 93.5 93.4 94.0 93.2 92.8 93.0 92.5 2011 89.3 89.7 90.5 92.1 92.5 92.3 93.1 93.3 93.6 93.4 94.0 94.5 92.4 2012 92.2 92.8 93.7 95.0 95.7 95.8 95.6 95.8 96.7 97.5 98.4 98.6 95.7 2013 96.5 97.2 97.9 98.8 99.2 99.2 99.9 100.1 100.4 100.9 101.8 101.7 99.5 2014 99.5 100.0 100.6 100.4
Houma MSA, Nonfarm Employment, Current Employment Statistics, Bureau of Labor Statistics
150
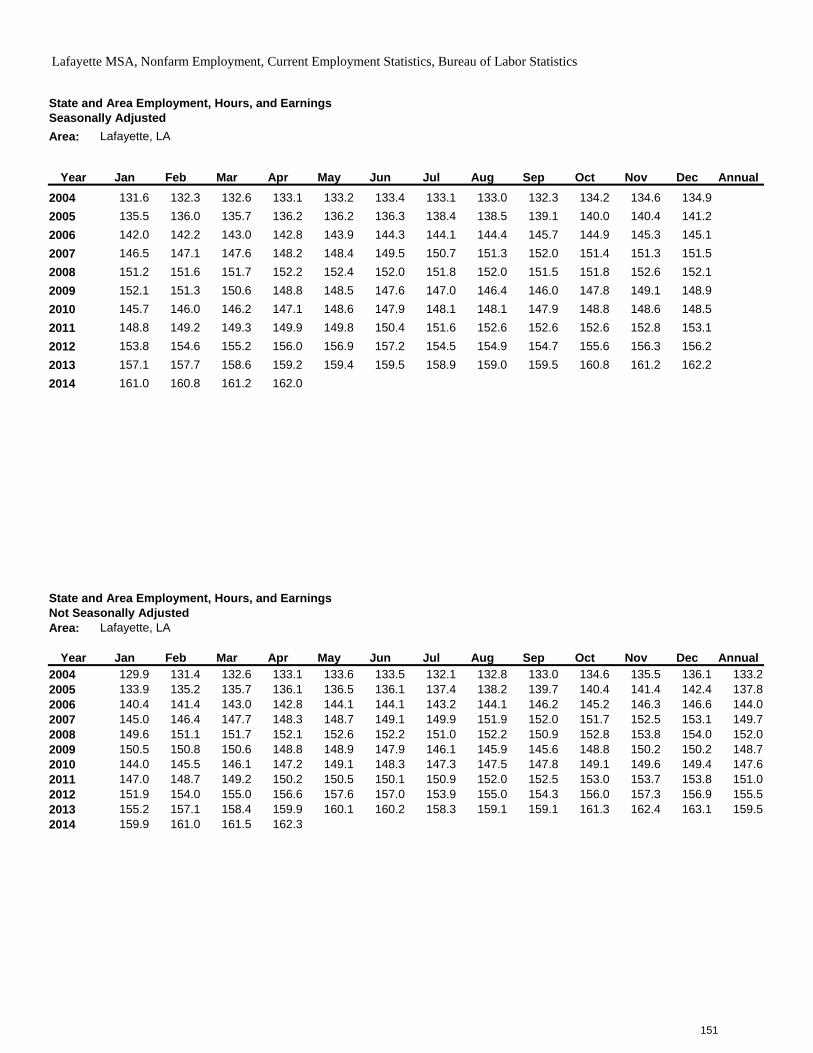
State and Area Employment, Hours, and Earnings Seasonally Adjusted Area: Lafayette, LA
Year Jan Feb Mar Apr May Jun Jul Aug Sep Oct Nov Dec Annual 2004 131.6 132.3 132.6 133.1 133.2 133.4 133.1 133.0 132.3 134.2 134.6 134.9 2005 135.5 136.0 135.7 136.2 136.2 136.3 138.4 138.5 139.1 140.0 140.4 141.2 2006 142.0 142.2 143.0 142.8 143.9 144.3 144.1 144.4 145.7 144.9 145.3 145.1 2007 146.5 147.1 147.6 148.2 148.4 149.5 150.7 151.3 152.0 151.4 151.3 151.5 2008 151.2 151.6 151.7 152.2 152.4 152.0 151.8 152.0 151.5 151.8 152.6 152.1 2009 152.1 151.3 150.6 148.8 148.5 147.6 147.0 146.4 146.0 147.8 149.1 148.9 2010 145.7 146.0 146.2 147.1 148.6 147.9 148.1 148.1 147.9 148.8 148.6 148.5 2011 148.8 149.2 149.3 149.9 149.8 150.4 151.6 152.6 152.6 152.6 152.8 153.1 2012 153.8 154.6 155.2 156.0 156.9 157.2 154.5 154.9 154.7 155.6 156.3 156.2 2013 157.1 157.7 158.6 159.2 159.4 159.5 158.9 159.0 159.5 160.8 161.2 162.2 2014 161.0 160.8 161.2 162.0
Lafayette MSA, Nonfarm Employment, Current Employment Statistics, Bureau of Labor Statistics
State and Area Employment, Hours, and Earnings Not Seasonally Adjusted Area: Lafayette, LA
Year Jan Feb Mar Apr May Jun Jul Aug Sep Oct Nov Dec Annual 2004 129.9 131.4 132.6 133.1 133.6 133.5 132.1 132.8 133.0 134.6 135.5 136.1 133.2 2005 133.9 135.2 135.7 136.1 136.5 136.1 137.4 138.2 139.7 140.4 141.4 142.4 137.8 2006 140.4 141.4 143.0 142.8 144.1 144.1 143.2 144.1 146.2 145.2 146.3 146.6 144.0 2007 145.0 146.4 147.7 148.3 148.7 149.1 149.9 151.9 152.0 151.7 152.5 153.1 149.7 2008 149.6 151.1 151.7 152.1 152.6 152.2 151.0 152.2 150.9 152.8 153.8 154.0 152.0 2009 150.5 150.8 150.6 148.8 148.9 147.9 146.1 145.9 145.6 148.8 150.2 150.2 148.7 2010 144.0 145.5 146.1 147.2 149.1 148.3 147.3 147.5 147.8 149.1 149.6 149.4 147.6 2011 147.0 148.7 149.2 150.2 150.5 150.1 150.9 152.0 152.5 153.0 153.7 153.8 151.0 2012 151.9 154.0 155.0 156.6 157.6 157.0 153.9 155.0 154.3 156.0 157.3 156.9 155.5 2013 155.2 157.1 158.4 159.9 160.1 160.2 158.3 159.1 159.1 161.3 162.4 163.1 159.5 2014 159.9 161.0 161.5 162.3
151
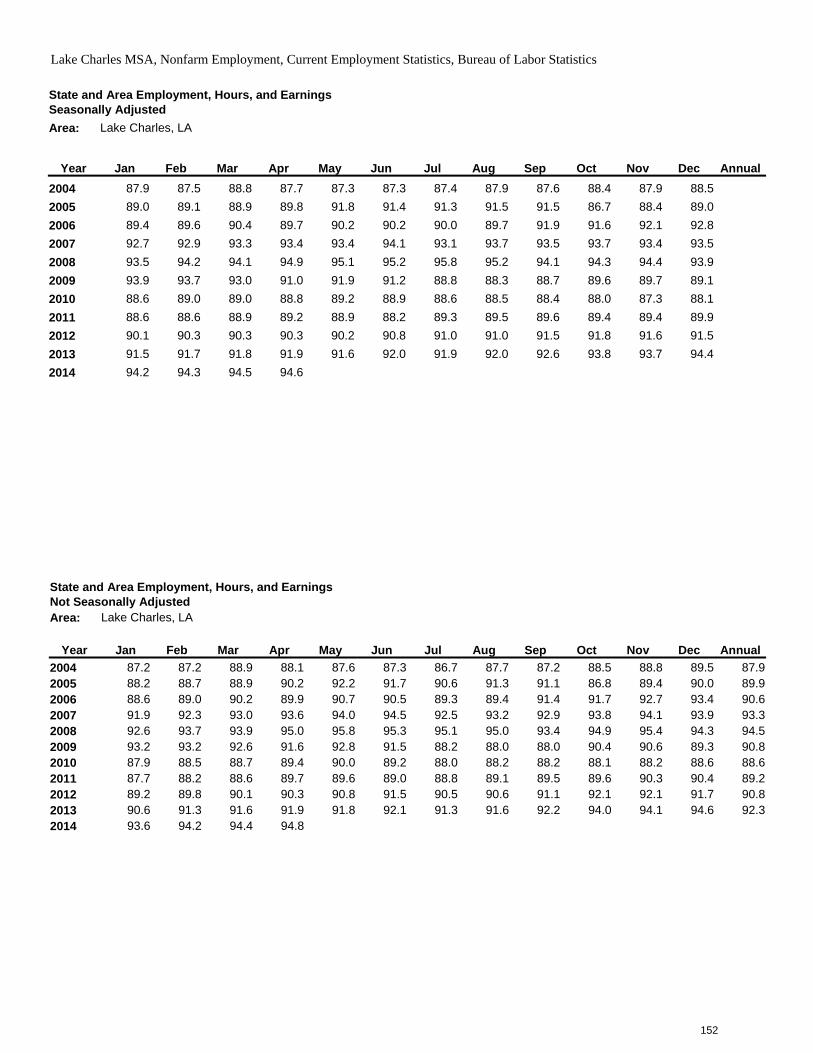
State and Area Employment, Hours, and Earnings Seasonally Adjusted Area: Lake Charles, LA
Year Jan Feb Mar Apr May Jun Jul Aug Sep Oct Nov Dec Annual 2004 87.9 87.5 88.8 87.7 87.3 87.3 87.4 87.9 87.6 88.4 87.9 88.5 2005 89.0 89.1 88.9 89.8 91.8 91.4 91.3 91.5 91.5 86.7 88.4 89.0 2006 89.4 89.6 90.4 89.7 90.2 90.2 90.0 89.7 91.9 91.6 92.1 92.8 2007 92.7 92.9 93.3 93.4 93.4 94.1 93.1 93.7 93.5 93.7 93.4 93.5 2008 93.5 94.2 94.1 94.9 95.1 95.2 95.8 95.2 94.1 94.3 94.4 93.9 2009 93.9 93.7 93.0 91.0 91.9 91.2 88.8 88.3 88.7 89.6 89.7 89.1 2010 88.6 89.0 89.0 88.8 89.2 88.9 88.6 88.5 88.4 88.0 87.3 88.1 2011 88.6 88.6 88.9 89.2 88.9 88.2 89.3 89.5 89.6 89.4 89.4 89.9 2012 90.1 90.3 90.3 90.3 90.2 90.8 91.0 91.0 91.5 91.8 91.6 91.5 2013 91.5 91.7 91.8 91.9 91.6 92.0 91.9 92.0 92.6 93.8 93.7 94.4 2014 94.2 94.3 94.5 94.6
State and Area Employment, Hours, and Earnings Not Seasonally Adjusted Area: Lake Charles, LA
Year Jan Feb Mar Apr May Jun Jul Aug Sep Oct Nov Dec Annual 2004 87.2 87.2 88.9 88.1 87.6 87.3 86.7 87.7 87.2 88.5 88.8 89.5 87.9 2005 88.2 88.7 88.9 90.2 92.2 91.7 90.6 91.3 91.1 86.8 89.4 90.0 89.9 2006 88.6 89.0 90.2 89.9 90.7 90.5 89.3 89.4 91.4 91.7 92.7 93.4 90.6 2007 91.9 92.3 93.0 93.6 94.0 94.5 92.5 93.2 92.9 93.8 94.1 93.9 93.3 2008 92.6 93.7 93.9 95.0 95.8 95.3 95.1 95.0 93.4 94.9 95.4 94.3 94.5 2009 93.2 93.2 92.6 91.6 92.8 91.5 88.2 88.0 88.0 90.4 90.6 89.3 90.8 2010 87.9 88.5 88.7 89.4 90.0 89.2 88.0 88.2 88.2 88.1 88.2 88.6 88.6 2011 87.7 88.2 88.6 89.7 89.6 89.0 88.8 89.1 89.5 89.6 90.3 90.4 89.2 2012 89.2 89.8 90.1 90.3 90.8 91.5 90.5 90.6 91.1 92.1 92.1 91.7 90.8 2013 90.6 91.3 91.6 91.9 91.8 92.1 91.3 91.6 92.2 94.0 94.1 94.6 92.3 2014 93.6 94.2 94.4 94.8
Lake Charles MSA, Nonfarm Employment, Current Employment Statistics, Bureau of Labor Statistics
152
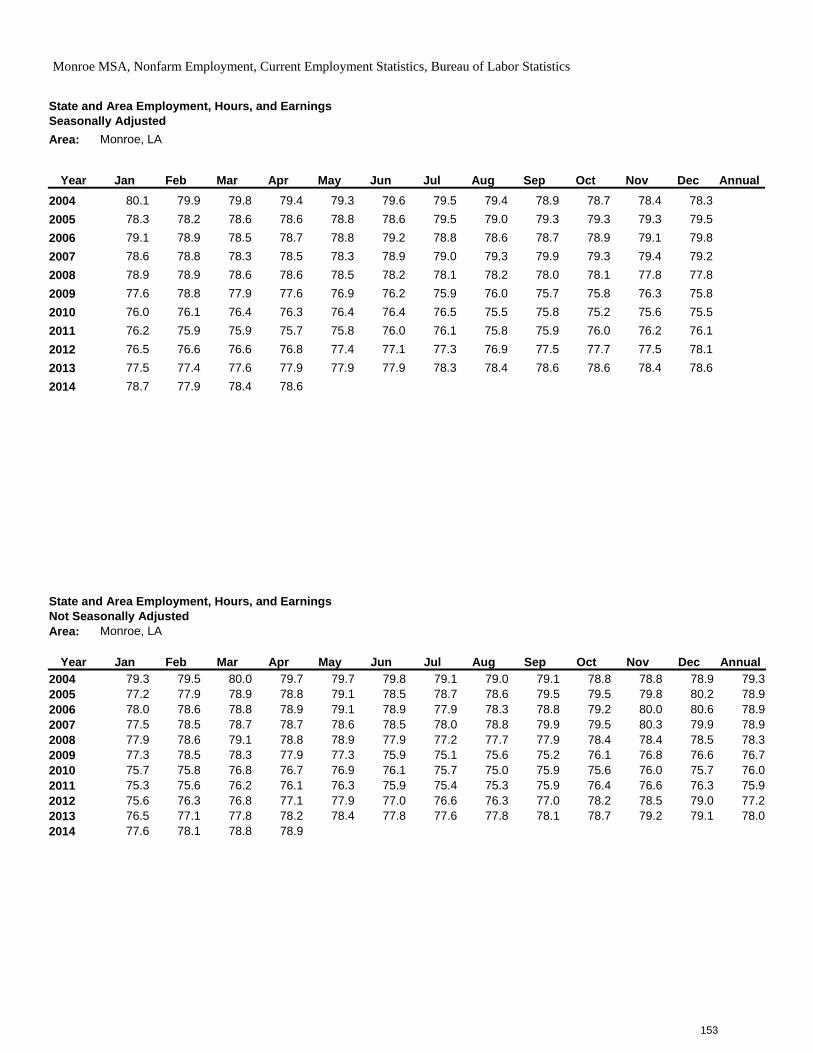
State and Area Employment, Hours, and Earnings Seasonally Adjusted Area: Monroe, LA
Year Jan Feb Mar Apr May Jun Jul Aug Sep Oct Nov Dec Annual 2004 80.1 79.9 79.8 79.4 79.3 79.6 79.5 79.4 78.9 78.7 78.4 78.3 2005 78.3 78.2 78.6 78.6 78.8 78.6 79.5 79.0 79.3 79.3 79.3 79.5 2006 79.1 78.9 78.5 78.7 78.8 79.2 78.8 78.6 78.7 78.9 79.1 79.8 2007 78.6 78.8 78.3 78.5 78.3 78.9 79.0 79.3 79.9 79.3 79.4 79.2 2008 78.9 78.9 78.6 78.6 78.5 78.2 78.1 78.2 78.0 78.1 77.8 77.8 2009 77.6 78.8 77.9 77.6 76.9 76.2 75.9 76.0 75.7 75.8 76.3 75.8 2010 76.0 76.1 76.4 76.3 76.4 76.4 76.5 75.5 75.8 75.2 75.6 75.5 2011 76.2 75.9 75.9 75.7 75.8 76.0 76.1 75.8 75.9 76.0 76.2 76.1 2012 76.5 76.6 76.6 76.8 77.4 77.1 77.3 76.9 77.5 77.7 77.5 78.1 2013 77.5 77.4 77.6 77.9 77.9 77.9 78.3 78.4 78.6 78.6 78.4 78.6 2014 78.7 77.9 78.4 78.6
State and Area Employment, Hours, and Earnings Not Seasonally Adjusted Area: Monroe, LA
Year Jan Feb Mar Apr May Jun Jul Aug Sep Oct Nov Dec Annual 2004 79.3 79.5 80.0 79.7 79.7 79.8 79.1 79.0 79.1 78.8 78.8 78.9 79.3 2005 77.2 77.9 78.9 78.8 79.1 78.5 78.7 78.6 79.5 79.5 79.8 80.2 78.9 2006 78.0 78.6 78.8 78.9 79.1 78.9 77.9 78.3 78.8 79.2 80.0 80.6 78.9 2007 77.5 78.5 78.7 78.7 78.6 78.5 78.0 78.8 79.9 79.5 80.3 79.9 78.9 2008 77.9 78.6 79.1 78.8 78.9 77.9 77.2 77.7 77.9 78.4 78.4 78.5 78.3 2009 77.3 78.5 78.3 77.9 77.3 75.9 75.1 75.6 75.2 76.1 76.8 76.6 76.7 2010 75.7 75.8 76.8 76.7 76.9 76.1 75.7 75.0 75.9 75.6 76.0 75.7 76.0 2011 75.3 75.6 76.2 76.1 76.3 75.9 75.4 75.3 75.9 76.4 76.6 76.3 75.9 2012 75.6 76.3 76.8 77.1 77.9 77.0 76.6 76.3 77.0 78.2 78.5 79.0 77.2 2013 76.5 77.1 77.8 78.2 78.4 77.8 77.6 77.8 78.1 78.7 79.2 79.1 78.0 2014 77.6 78.1 78.8 78.9
Monroe MSA, Nonfarm Employment, Current Employment Statistics, Bureau of Labor Statistics
153
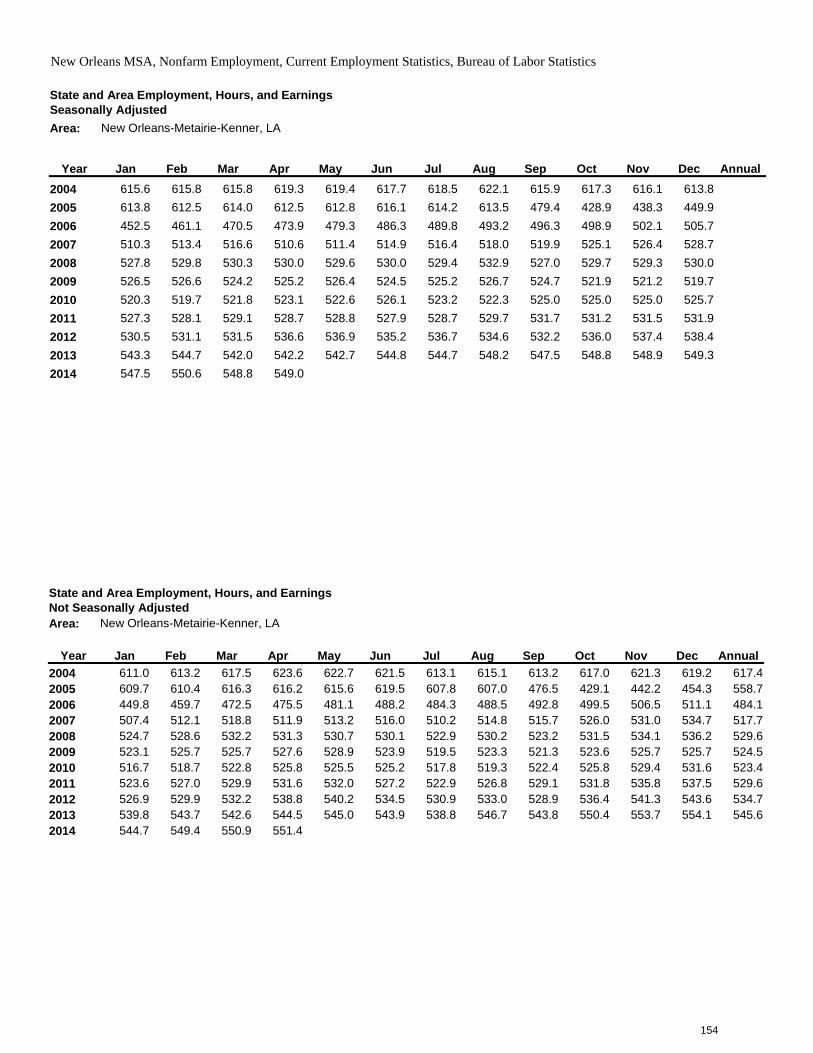
State and Area Employment, Hours, and Earnings Seasonally Adjusted Area: New Orleans-Metairie-Kenner, LA
Year Jan Feb Mar Apr May Jun Jul Aug Sep Oct Nov Dec Annual 2004 615.6 615.8 615.8 619.3 619.4 617.7 618.5 622.1 615.9 617.3 616.1 613.8 2005 613.8 612.5 614.0 612.5 612.8 616.1 614.2 613.5 479.4 428.9 438.3 449.9 2006 452.5 461.1 470.5 473.9 479.3 486.3 489.8 493.2 496.3 498.9 502.1 505.7 2007 510.3 513.4 516.6 510.6 511.4 514.9 516.4 518.0 519.9 525.1 526.4 528.7 2008 527.8 529.8 530.3 530.0 529.6 530.0 529.4 532.9 527.0 529.7 529.3 530.0 2009 526.5 526.6 524.2 525.2 526.4 524.5 525.2 526.7 524.7 521.9 521.2 519.7 2010 520.3 519.7 521.8 523.1 522.6 526.1 523.2 522.3 525.0 525.0 525.0 525.7 2011 527.3 528.1 529.1 528.7 528.8 527.9 528.7 529.7 531.7 531.2 531.5 531.9 2012 530.5 531.1 531.5 536.6 536.9 535.2 536.7 534.6 532.2 536.0 537.4 538.4 2013 543.3 544.7 542.0 542.2 542.7 544.8 544.7 548.2 547.5 548.8 548.9 549.3 2014 547.5 550.6 548.8 549.0
State and Area Employment, Hours, and Earnings Not Seasonally Adjusted Area: New Orleans-Metairie-Kenner, LA
Year Jan Feb Mar Apr May Jun Jul Aug Sep Oct Nov Dec Annual 2004 611.0 613.2 617.5 623.6 622.7 621.5 613.1 615.1 613.2 617.0 621.3 619.2 617.4 2005 609.7 610.4 616.3 616.2 615.6 619.5 607.8 607.0 476.5 429.1 442.2 454.3 558.7 2006 449.8 459.7 472.5 475.5 481.1 488.2 484.3 488.5 492.8 499.5 506.5 511.1 484.1 2007 507.4 512.1 518.8 511.9 513.2 516.0 510.2 514.8 515.7 526.0 531.0 534.7 517.7 2008 524.7 528.6 532.2 531.3 530.7 530.1 522.9 530.2 523.2 531.5 534.1 536.2 529.6 2009 523.1 525.7 525.7 527.6 528.9 523.9 519.5 523.3 521.3 523.6 525.7 525.7 524.5 2010 516.7 518.7 522.8 525.8 525.5 525.2 517.8 519.3 522.4 525.8 529.4 531.6 523.4 2011 523.6 527.0 529.9 531.6 532.0 527.2 522.9 526.8 529.1 531.8 535.8 537.5 529.6 2012 526.9 529.9 532.2 538.8 540.2 534.5 530.9 533.0 528.9 536.4 541.3 543.6 534.7 2013 539.8 543.7 542.6 544.5 545.0 543.9 538.8 546.7 543.8 550.4 553.7 554.1 545.6 2014 544.7 549.4 550.9 551.4
New Orleans MSA, Nonfarm Employment, Current Employment Statistics, Bureau of Labor Statistics
154
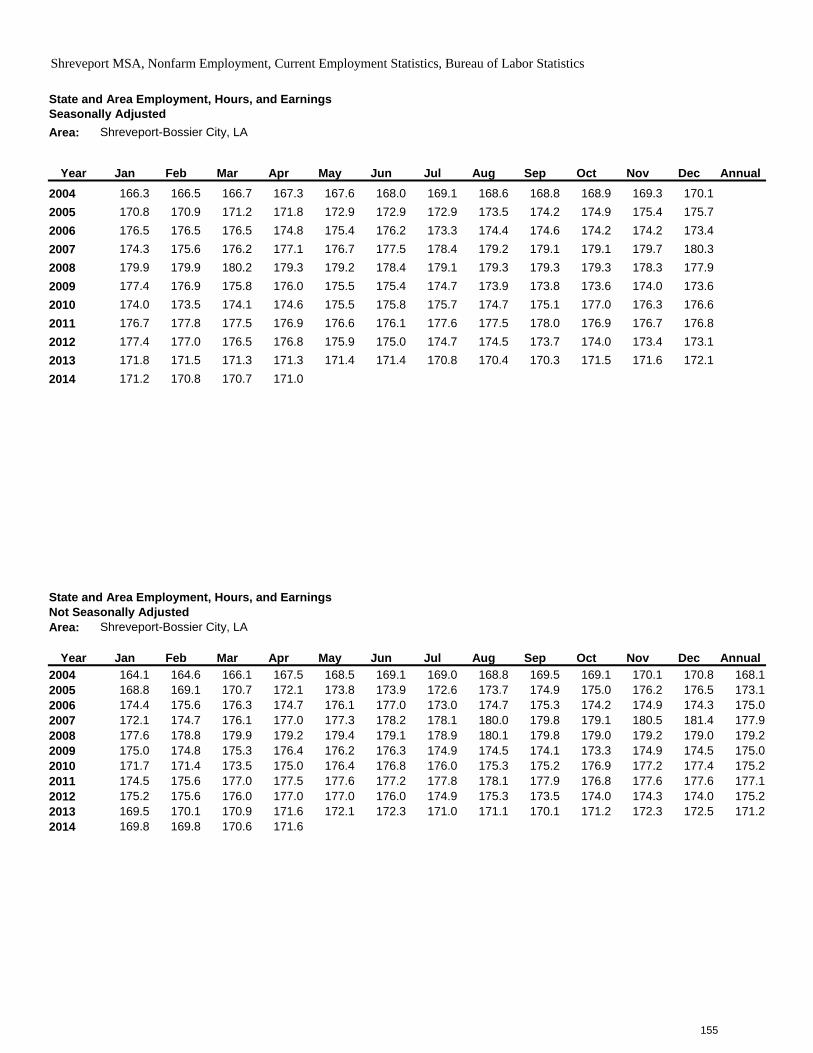
State and Area Employment, Hours, and Earnings Seasonally Adjusted Area: Shreveport-Bossier City, LA
Year Jan Feb Mar Apr May Jun Jul Aug Sep Oct Nov Dec Annual 2004 166.3 166.5 166.7 167.3 167.6 168.0 169.1 168.6 168.8 168.9 169.3 170.1 2005 170.8 170.9 171.2 171.8 172.9 172.9 172.9 173.5 174.2 174.9 175.4 175.7 2006 176.5 176.5 176.5 174.8 175.4 176.2 173.3 174.4 174.6 174.2 174.2 173.4 2007 174.3 175.6 176.2 177.1 176.7 177.5 178.4 179.2 179.1 179.1 179.7 180.3 2008 179.9 179.9 180.2 179.3 179.2 178.4 179.1 179.3 179.3 179.3 178.3 177.9 2009 177.4 176.9 175.8 176.0 175.5 175.4 174.7 173.9 173.8 173.6 174.0 173.6 2010 174.0 173.5 174.1 174.6 175.5 175.8 175.7 174.7 175.1 177.0 176.3 176.6 2011 176.7 177.8 177.5 176.9 176.6 176.1 177.6 177.5 178.0 176.9 176.7 176.8 2012 177.4 177.0 176.5 176.8 175.9 175.0 174.7 174.5 173.7 174.0 173.4 173.1 2013 171.8 171.5 171.3 171.3 171.4 171.4 170.8 170.4 170.3 171.5 171.6 172.1 2014 171.2 170.8 170.7 171.0
State and Area Employment, Hours, and Earnings Not Seasonally Adjusted Area: Shreveport-Bossier City, LA
Year Jan Feb Mar Apr May Jun Jul Aug Sep Oct Nov Dec Annual 2004 164.1 164.6 166.1 167.5 168.5 169.1 169.0 168.8 169.5 169.1 170.1 170.8 168.1 2005 168.8 169.1 170.7 172.1 173.8 173.9 172.6 173.7 174.9 175.0 176.2 176.5 173.1 2006 174.4 175.6 176.3 174.7 176.1 177.0 173.0 174.7 175.3 174.2 174.9 174.3 175.0 2007 172.1 174.7 176.1 177.0 177.3 178.2 178.1 180.0 179.8 179.1 180.5 181.4 177.9 2008 177.6 178.8 179.9 179.2 179.4 179.1 178.9 180.1 179.8 179.0 179.2 179.0 179.2 2009 175.0 174.8 175.3 176.4 176.2 176.3 174.9 174.5 174.1 173.3 174.9 174.5 175.0 2010 171.7 171.4 173.5 175.0 176.4 176.8 176.0 175.3 175.2 176.9 177.2 177.4 175.2 2011 174.5 175.6 177.0 177.5 177.6 177.2 177.8 178.1 177.9 176.8 177.6 177.6 177.1 2012 175.2 175.6 176.0 177.0 177.0 176.0 174.9 175.3 173.5 174.0 174.3 174.0 175.2 2013 169.5 170.1 170.9 171.6 172.1 172.3 171.0 171.1 170.1 171.2 172.3 172.5 171.2 2014 169.8 169.8 170.6 171.6
Shreveport MSA, Nonfarm Employment, Current Employment Statistics, Bureau of Labor Statistics
155
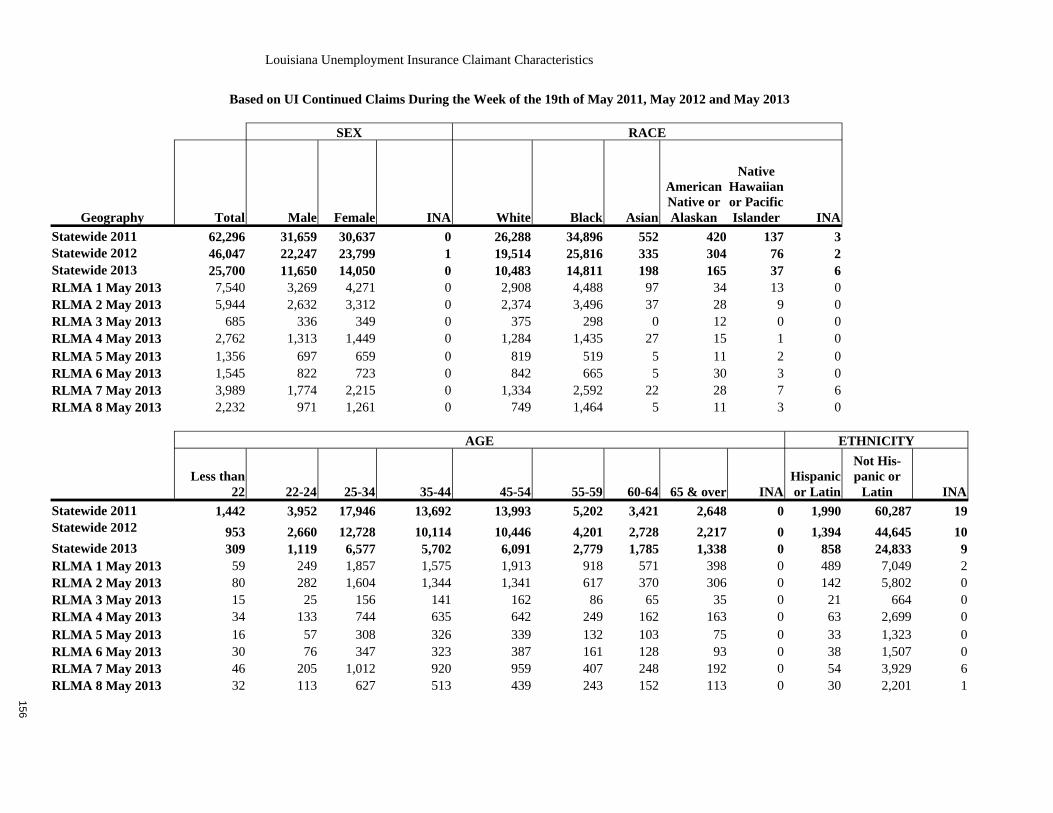
Based on UI Continued Claims During the Week of the 19th of May 2011, May 2012 and May 2013 SEX RACE
Geography Total Male Female INA White Black Asian
American Native or Alaskan
Native Hawaiian or Pacific Islander INA
Statewide 2011 62,296 31,659 30,637 0 26,288 34,896 552 420 137 3 Statewide 2012 46,047 22,247 23,799 1 19,514 25,816 335 304 76 2 Statewide 2013 25,700 11,650 14,050 0 10,483 14,811 198 165 37 6 RLMA 1 May 2013 7,540 3,269 4,271 0 2,908 4,488 97 34 13 0 RLMA 2 May 2013 5,944 2,632 3,312 0 2,374 3,496 37 28 9 0 RLMA 3 May 2013 685 336 349 0 375 298 0 12 0 0 RLMA 4 May 2013 2,762 1,313 1,449 0 1,284 1,435 27 15 1 0 RLMA 5 May 2013 1,356 697 659 0 819 519 5 11 2 0 RLMA 6 May 2013 1,545 822 723 0 842 665 5 30 3 0 RLMA 7 May 2013 3,989 1,774 2,215 0 1,334 2,592 22 28 7 6 RLMA 8 May 2013 2,232 971 1,261 0 749 1,464 5 11 3 0
AGE ETHNICITY
Less than
22 22-24 25-34 35-44 45-54 55-59 60-64 65 & over INA Hispanic or Latin
Not His-panic or
Latin INA
Statewide 2011 1,442 3,952 17,946 13,692 13,993 5,202 3,421 2,648 0 1,990 60,287 19 Statewide 2012 953 2,660 12,728 10,114 10,446 4,201 2,728 2,217 0 1,394 44,645 10 Statewide 2013 309 1,119 6,577 5,702 6,091 2,779 1,785 1,338 0 858 24,833 9 RLMA 1 May 2013 59 249 1,857 1,575 1,913 918 571 398 0 489 7,049 2 RLMA 2 May 2013 80 282 1,604 1,344 1,341 617 370 306 0 142 5,802 0 RLMA 3 May 2013 15 25 156 141 162 86 65 35 0 21 664 0 RLMA 4 May 2013 34 133 744 635 642 249 162 163 0 63 2,699 0 RLMA 5 May 2013 16 57 308 326 339 132 103 75 0 33 1,323 0 RLMA 6 May 2013 30 76 347 323 387 161 128 93 0 38 1,507 0 RLMA 7 May 2013 46 205 1,012 920 959 407 248 192 0 54 3,929 6 RLMA 8 May 2013 32 113 627 513 439 243 152 113 0 30 2,201 1
Louisiana Unemployment Insurance Claimant Characteristics
156
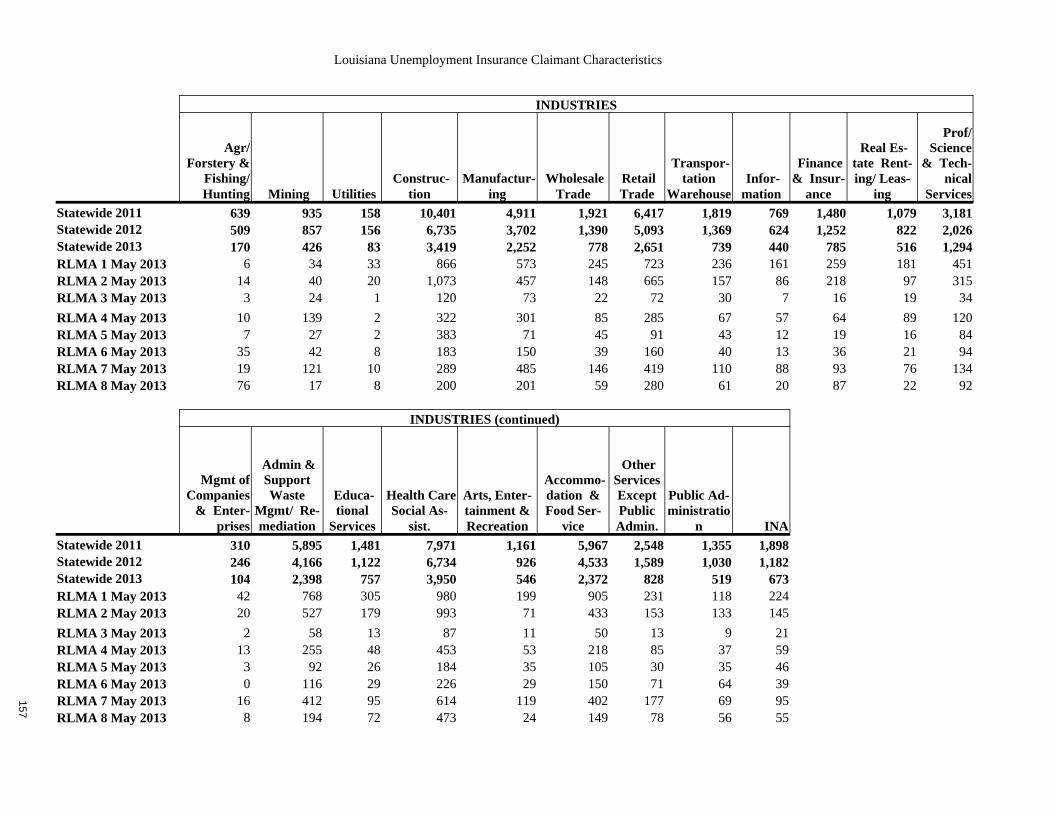
INDUSTRIES
Agr/Forstery &
Fishing/ Hunting Mining Utilities
Construc-tion
Manufactur-ing
Wholesale Trade
Retail Trade
Transpor-tation
Warehouse Infor-mation
Finance & Insur-
ance
Real Es-tate Rent-ing/ Leas-
ing
Prof/ Science
& Tech-nical
Services
Statewide 2011 639 935 158 10,401 4,911 1,921 6,417 1,819 769 1,480 1,079 3,181 Statewide 2012 509 857 156 6,735 3,702 1,390 5,093 1,369 624 1,252 822 2,026 Statewide 2013 170 426 83 3,419 2,252 778 2,651 739 440 785 516 1,294 RLMA 1 May 2013 6 34 33 866 573 245 723 236 161 259 181 451 RLMA 2 May 2013 14 40 20 1,073 457 148 665 157 86 218 97 315 RLMA 3 May 2013 3 24 1 120 73 22 72 30 7 16 19 34 RLMA 4 May 2013 10 139 2 322 301 85 285 67 57 64 89 120 RLMA 5 May 2013 7 27 2 383 71 45 91 43 12 19 16 84 RLMA 6 May 2013 35 42 8 183 150 39 160 40 13 36 21 94 RLMA 7 May 2013 19 121 10 289 485 146 419 110 88 93 76 134 RLMA 8 May 2013 76 17 8 200 201 59 280 61 20 87 22 92
INDUSTRIES (continued)
Mgmt of Companies
& Enter-prises
Admin & Support Waste
Mgmt/ Re-mediation
Educa-tional
Services
Health Care Social As-
sist.
Arts, Enter-tainment & Recreation
Accommo-dation & Food Ser-
vice
Other Services Except Public Admin.
Public Ad-ministratio
n INA Statewide 2011 310 5,895 1,481 7,971 1,161 5,967 2,548 1,355 1,898 Statewide 2012 246 4,166 1,122 6,734 926 4,533 1,589 1,030 1,182 Statewide 2013 104 2,398 757 3,950 546 2,372 828 519 673 RLMA 1 May 2013 42 768 305 980 199 905 231 118 224 RLMA 2 May 2013 20 527 179 993 71 433 153 133 145 RLMA 3 May 2013 2 58 13 87 11 50 13 9 21 RLMA 4 May 2013 13 255 48 453 53 218 85 37 59 RLMA 5 May 2013 3 92 26 184 35 105 30 35 46 RLMA 6 May 2013 0 116 29 226 29 150 71 64 39 RLMA 7 May 2013 16 412 95 614 119 402 177 69 95 RLMA 8 May 2013 8 194 72 473 24 149 78 56 55
Louisiana Unemployment Insurance Claimant Characteristics
157
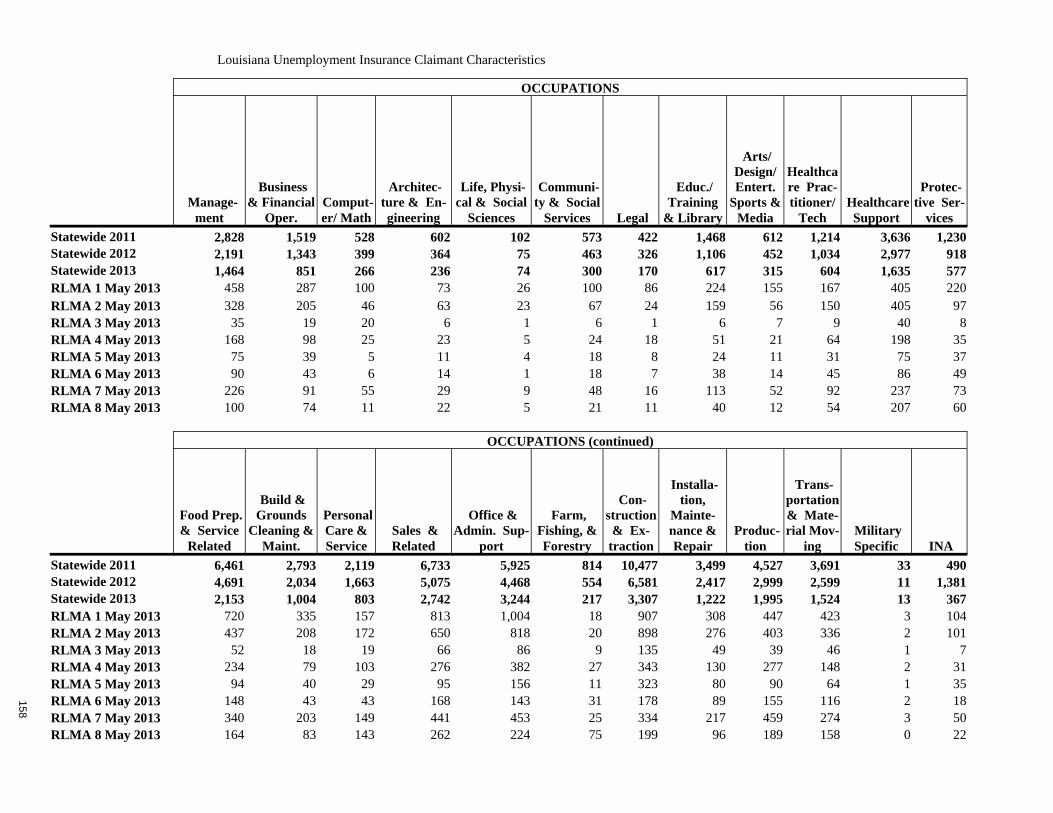
OCCUPATIONS
Manage-
ment
Business & Financial
Oper. Comput-er/ Math
Architec-ture & En-gineering
Life, Physi-cal & Social
Sciences
Communi-ty & Social
Services Legal
Educ./ Training
& Library
Arts/ Design/ Entert.
Sports & Media
Healthcare Prac-titioner/
Tech Healthcare
Support
Protec-tive Ser-
vices
Statewide 2011 2,828 1,519 528 602 102 573 422 1,468 612 1,214 3,636 1,230 Statewide 2012 2,191 1,343 399 364 75 463 326 1,106 452 1,034 2,977 918 Statewide 2013 1,464 851 266 236 74 300 170 617 315 604 1,635 577 RLMA 1 May 2013 458 287 100 73 26 100 86 224 155 167 405 220 RLMA 2 May 2013 328 205 46 63 23 67 24 159 56 150 405 97 RLMA 3 May 2013 35 19 20 6 1 6 1 6 7 9 40 8 RLMA 4 May 2013 168 98 25 23 5 24 18 51 21 64 198 35 RLMA 5 May 2013 75 39 5 11 4 18 8 24 11 31 75 37 RLMA 6 May 2013 90 43 6 14 1 18 7 38 14 45 86 49 RLMA 7 May 2013 226 91 55 29 9 48 16 113 52 92 237 73 RLMA 8 May 2013 100 74 11 22 5 21 11 40 12 54 207 60
OCCUPATIONS (continued)
Food Prep. & Service
Related
Build & Grounds
Cleaning & Maint.
Personal Care & Service
Sales & Related
Office & Admin. Sup-
port
Farm, Fishing, & Forestry
Con-struction & Ex-
traction
Installa-tion,
Mainte-nance & Repair
Produc-tion
Trans-portation & Mate-rial Mov-
ing Military Specific INA
Statewide 2011 6,461 2,793 2,119 6,733 5,925 814 10,477 3,499 4,527 3,691 33 490 Statewide 2012 4,691 2,034 1,663 5,075 4,468 554 6,581 2,417 2,999 2,599 11 1,381 Statewide 2013 2,153 1,004 803 2,742 3,244 217 3,307 1,222 1,995 1,524 13 367 RLMA 1 May 2013 720 335 157 813 1,004 18 907 308 447 423 3 104 RLMA 2 May 2013 437 208 172 650 818 20 898 276 403 336 2 101 RLMA 3 May 2013 52 18 19 66 86 9 135 49 39 46 1 7 RLMA 4 May 2013 234 79 103 276 382 27 343 130 277 148 2 31 RLMA 5 May 2013 94 40 29 95 156 11 323 80 90 64 1 35 RLMA 6 May 2013 148 43 43 168 143 31 178 89 155 116 2 18 RLMA 7 May 2013 340 203 149 441 453 25 334 217 459 274 3 50 RLMA 8 May 2013 164 83 143 262 224 75 199 96 189 158 0 22
Louisiana Unemployment Insurance Claimant Characteristics
158
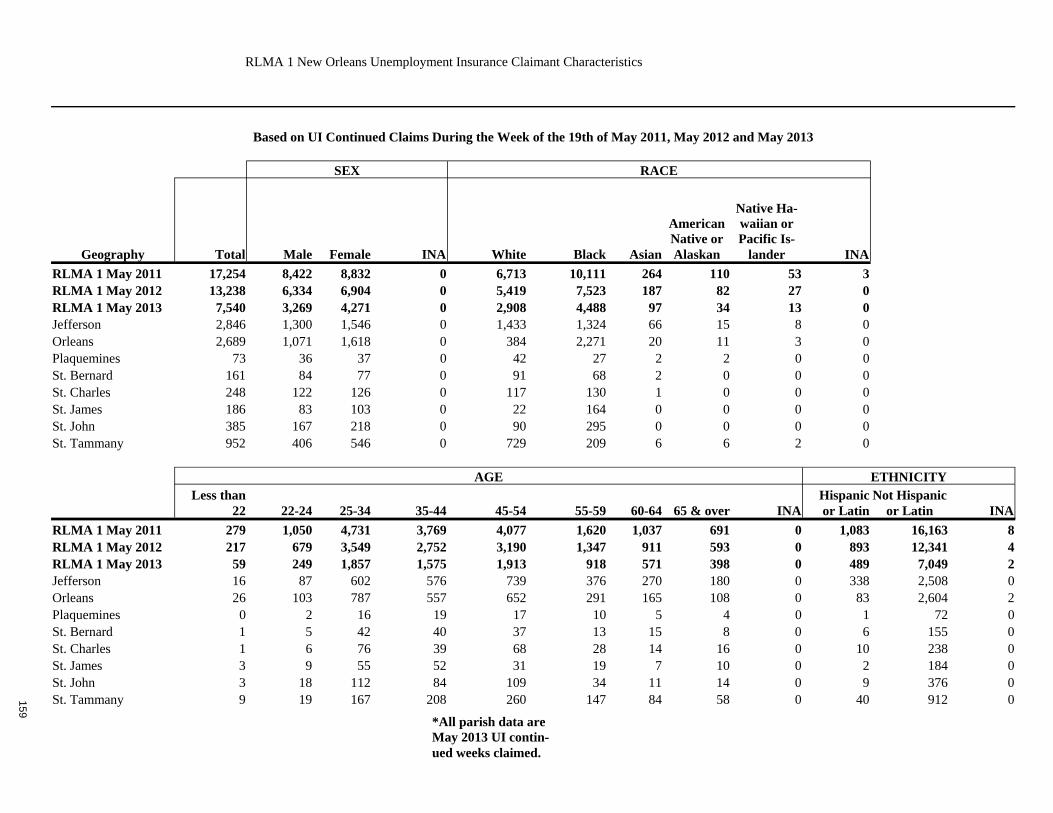
Based on UI Continued Claims During the Week of the 19th of May 2011, May 2012 and May 2013
SEX RACE
Geography Total Male Female INA White Black Asian
American Native or Alaskan
Native Ha-waiian or Pacific Is-
lander INA RLMA 1 May 2011 17,254 8,422 8,832 0 6,713 10,111 264 110 53 3 RLMA 1 May 2012 13,238 6,334 6,904 0 5,419 7,523 187 82 27 0 RLMA 1 May 2013 7,540 3,269 4,271 0 2,908 4,488 97 34 13 0 Jefferson 2,846 1,300 1,546 0 1,433 1,324 66 15 8 0 Orleans 2,689 1,071 1,618 0 384 2,271 20 11 3 0 Plaquemines 73 36 37 0 42 27 2 2 0 0 St. Bernard 161 84 77 0 91 68 2 0 0 0 St. Charles 248 122 126 0 117 130 1 0 0 0 St. James 186 83 103 0 22 164 0 0 0 0 St. John 385 167 218 0 90 295 0 0 0 0 St. Tammany 952 406 546 0 729 209 6 6 2 0
AGE ETHNICITY
Less than
22 22-24 25-34 35-44 45-54 55-59 60-64 65 & over INA Hispanic or Latin
Not Hispanic or Latin INA
RLMA 1 May 2011 279 1,050 4,731 3,769 4,077 1,620 1,037 691 0 1,083 16,163 8 RLMA 1 May 2012 217 679 3,549 2,752 3,190 1,347 911 593 0 893 12,341 4 RLMA 1 May 2013 59 249 1,857 1,575 1,913 918 571 398 0 489 7,049 2 Jefferson 16 87 602 576 739 376 270 180 0 338 2,508 0 Orleans 26 103 787 557 652 291 165 108 0 83 2,604 2 Plaquemines 0 2 16 19 17 10 5 4 0 1 72 0 St. Bernard 1 5 42 40 37 13 15 8 0 6 155 0 St. Charles 1 6 76 39 68 28 14 16 0 10 238 0 St. James 3 9 55 52 31 19 7 10 0 2 184 0 St. John 3 18 112 84 109 34 11 14 0 9 376 0 St. Tammany 9 19 167 208 260 147 84 58 0 40 912 0
*All parish data are May 2013 UI contin-ued weeks claimed.
RLMA 1 New Orleans Unemployment Insurance Claimant Characteristics
159
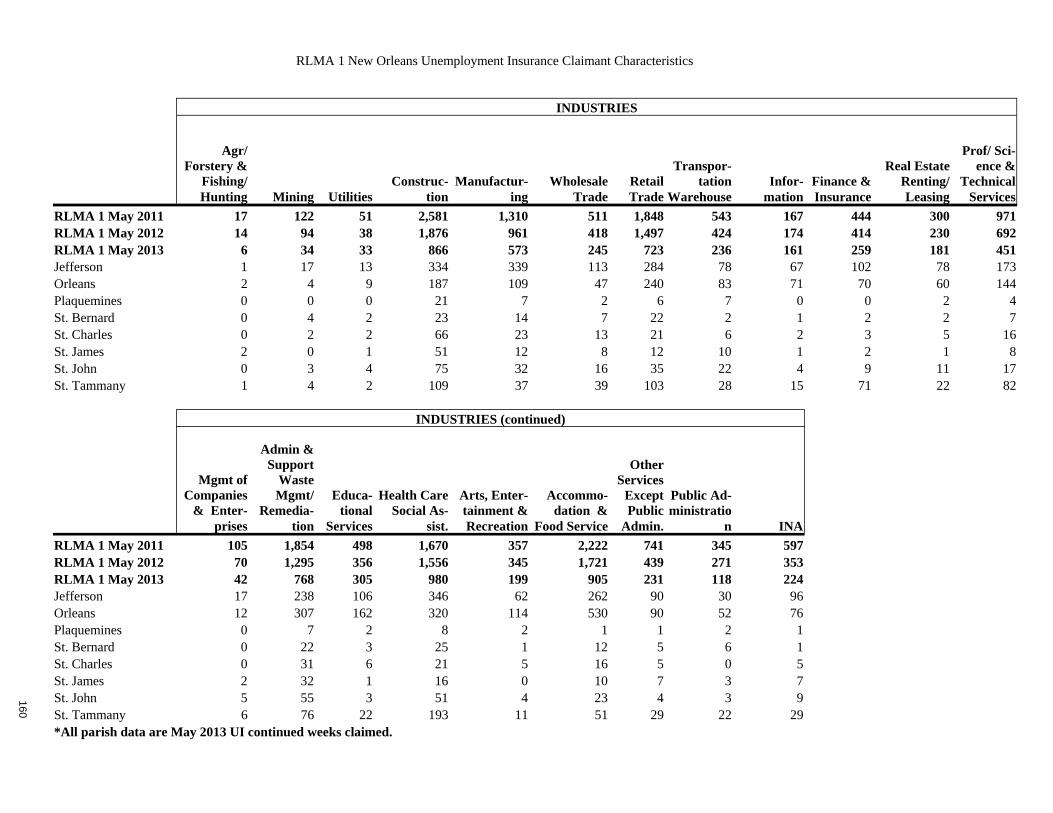
INDUSTRIES
Agr/Forstery &
Fishing/ Hunting Mining Utilities
Construc-tion
Manufactur-ing
Wholesale Trade
Retail Trade
Transpor-tation
Warehouse Infor-mation
Finance & Insurance
Real Estate Renting/ Leasing
Prof/ Sci-ence &
Technical Services
RLMA 1 May 2011 17 122 51 2,581 1,310 511 1,848 543 167 444 300 971 RLMA 1 May 2012 14 94 38 1,876 961 418 1,497 424 174 414 230 692 RLMA 1 May 2013 6 34 33 866 573 245 723 236 161 259 181 451 Jefferson 1 17 13 334 339 113 284 78 67 102 78 173 Orleans 2 4 9 187 109 47 240 83 71 70 60 144 Plaquemines 0 0 0 21 7 2 6 7 0 0 2 4 St. Bernard 0 4 2 23 14 7 22 2 1 2 2 7 St. Charles 0 2 2 66 23 13 21 6 2 3 5 16 St. James 2 0 1 51 12 8 12 10 1 2 1 8 St. John 0 3 4 75 32 16 35 22 4 9 11 17 St. Tammany 1 4 2 109 37 39 103 28 15 71 22 82
INDUSTRIES (continued)
Mgmt of Companies
& Enter-prises
Admin & Support
Waste Mgmt/
Remedia-tion
Educa-tional
Services
Health Care Social As-
sist.
Arts, Enter-tainment & Recreation
Accommo-dation &
Food Service
Other Services
Except Public
Admin.
Public Ad-ministratio
n INA RLMA 1 May 2011 105 1,854 498 1,670 357 2,222 741 345 597 RLMA 1 May 2012 70 1,295 356 1,556 345 1,721 439 271 353 RLMA 1 May 2013 42 768 305 980 199 905 231 118 224 Jefferson 17 238 106 346 62 262 90 30 96 Orleans 12 307 162 320 114 530 90 52 76 Plaquemines 0 7 2 8 2 1 1 2 1 St. Bernard 0 22 3 25 1 12 5 6 1 St. Charles 0 31 6 21 5 16 5 0 5 St. James 2 32 1 16 0 10 7 3 7 St. John 5 55 3 51 4 23 4 3 9 St. Tammany 6 76 22 193 11 51 29 22 29 *All parish data are May 2013 UI continued weeks claimed.
RLMA 1 New Orleans Unemployment Insurance Claimant Characteristics
160
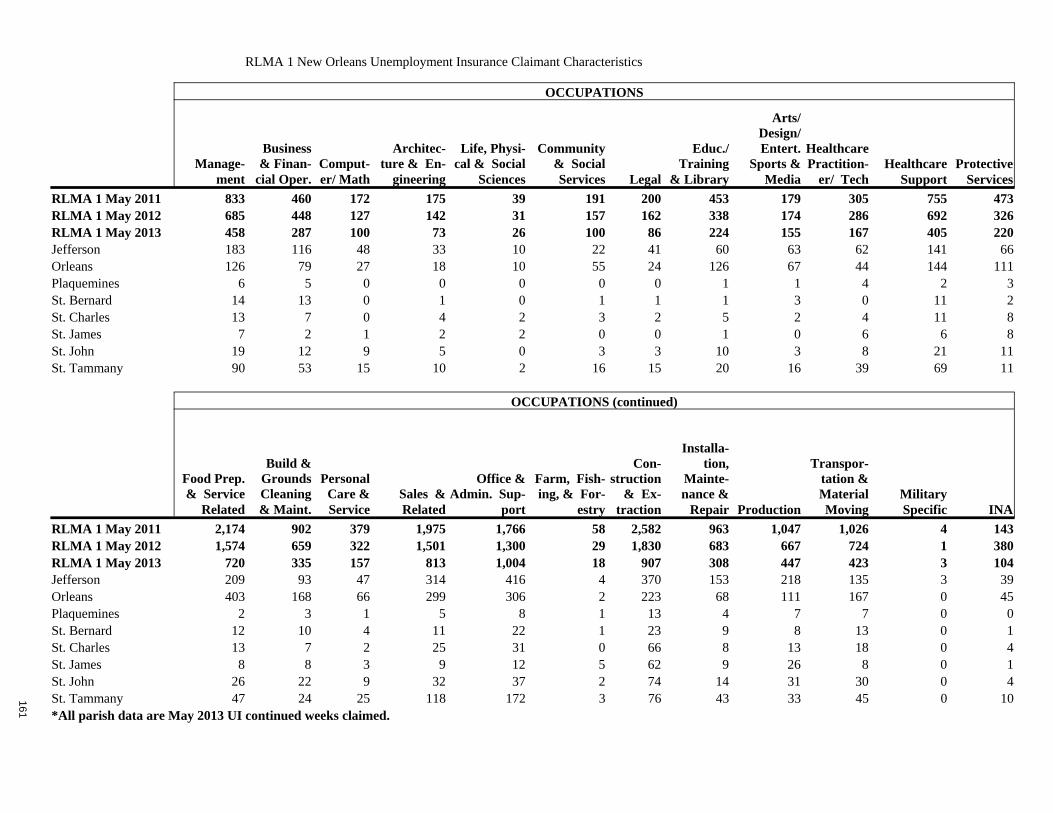
OCCUPATIONS
Manage-
ment
Business & Finan-
cial Oper. Comput-er/ Math
Architec-ture & En-
gineering
Life, Physi-cal & Social
Sciences
Community & Social Services Legal
Educ./ Training
& Library
Arts/ Design/ Entert.
Sports & Media
Healthcare Practition-
er/ Tech Healthcare
Support Protective
Services
RLMA 1 May 2011 833 460 172 175 39 191 200 453 179 305 755 473 RLMA 1 May 2012 685 448 127 142 31 157 162 338 174 286 692 326 RLMA 1 May 2013 458 287 100 73 26 100 86 224 155 167 405 220 Jefferson 183 116 48 33 10 22 41 60 63 62 141 66 Orleans 126 79 27 18 10 55 24 126 67 44 144 111 Plaquemines 6 5 0 0 0 0 0 1 1 4 2 3 St. Bernard 14 13 0 1 0 1 1 1 3 0 11 2 St. Charles 13 7 0 4 2 3 2 5 2 4 11 8 St. James 7 2 1 2 2 0 0 1 0 6 6 8 St. John 19 12 9 5 0 3 3 10 3 8 21 11 St. Tammany 90 53 15 10 2 16 15 20 16 39 69 11
OCCUPATIONS (continued)
Food Prep. & Service
Related
Build & Grounds Cleaning & Maint.
Personal Care & Service
Sales & Related
Office & Admin. Sup-
port
Farm, Fish-ing, & For-
estry
Con-struction
& Ex-traction
Installa-tion,
Mainte-nance &
Repair Production
Transpor-tation & Material Moving
Military Specific INA
RLMA 1 May 2011 2,174 902 379 1,975 1,766 58 2,582 963 1,047 1,026 4 143 RLMA 1 May 2012 1,574 659 322 1,501 1,300 29 1,830 683 667 724 1 380 RLMA 1 May 2013 720 335 157 813 1,004 18 907 308 447 423 3 104 Jefferson 209 93 47 314 416 4 370 153 218 135 3 39 Orleans 403 168 66 299 306 2 223 68 111 167 0 45 Plaquemines 2 3 1 5 8 1 13 4 7 7 0 0 St. Bernard 12 10 4 11 22 1 23 9 8 13 0 1 St. Charles 13 7 2 25 31 0 66 8 13 18 0 4 St. James 8 8 3 9 12 5 62 9 26 8 0 1 St. John 26 22 9 32 37 2 74 14 31 30 0 4 St. Tammany 47 24 25 118 172 3 76 43 33 45 0 10 *All parish data are May 2013 UI continued weeks claimed.
RLMA 1 New Orleans Unemployment Insurance Claimant Characteristics
161
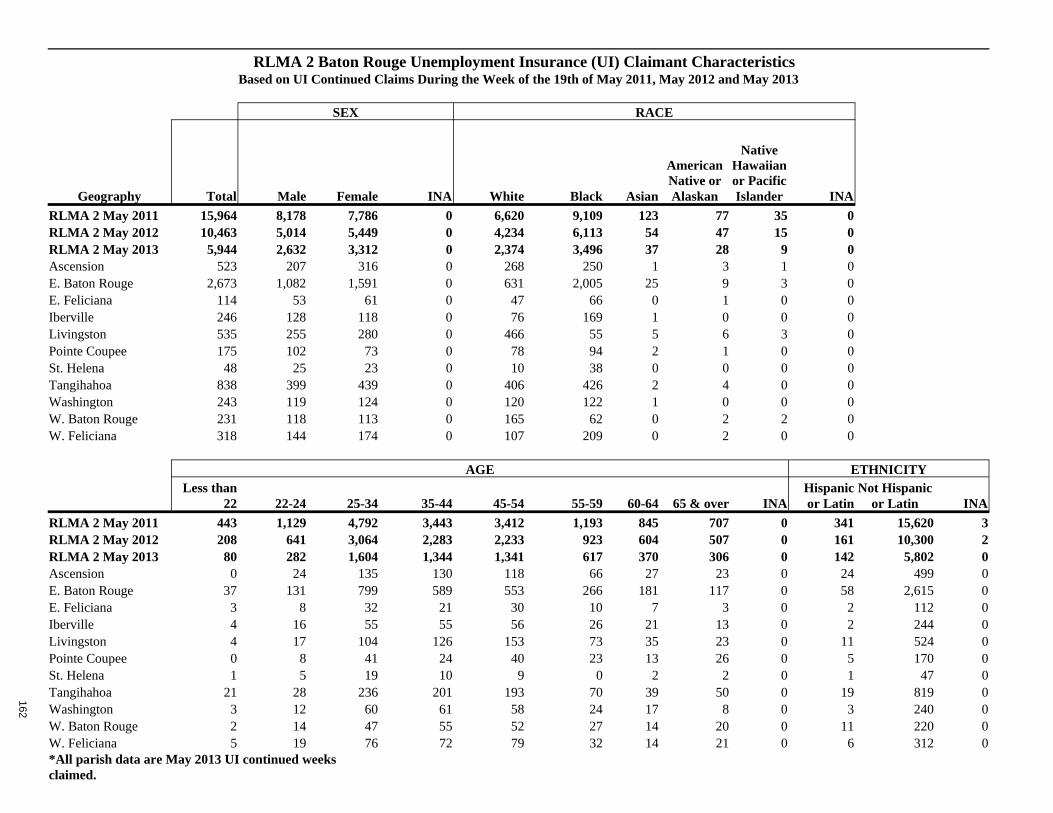
Based on UI Continued Claims During the Week of the 19th of May 2011, May 2012 and May 2013
SEX RACE
Geography Total Male Female INA White Black Asian
American Native or Alaskan
Native Hawaiian or Pacific Islander INA
RLMA 2 May 2011 15,964 8,178 7,786 0 6,620 9,109 123 77 35 0 RLMA 2 May 2012 10,463 5,014 5,449 0 4,234 6,113 54 47 15 0 RLMA 2 May 2013 5,944 2,632 3,312 0 2,374 3,496 37 28 9 0 Ascension 523 207 316 0 268 250 1 3 1 0 E. Baton Rouge 2,673 1,082 1,591 0 631 2,005 25 9 3 0 E. Feliciana 114 53 61 0 47 66 0 1 0 0 Iberville 246 128 118 0 76 169 1 0 0 0 Livingston 535 255 280 0 466 55 5 6 3 0 Pointe Coupee 175 102 73 0 78 94 2 1 0 0 St. Helena 48 25 23 0 10 38 0 0 0 0 Tangihahoa 838 399 439 0 406 426 2 4 0 0 Washington 243 119 124 0 120 122 1 0 0 0 W. Baton Rouge 231 118 113 0 165 62 0 2 2 0 W. Feliciana 318 144 174 0 107 209 0 2 0 0
AGE ETHNICITY
Less than
22 22-24 25-34 35-44 45-54 55-59 60-64 65 & over INA Hispanic or Latin
Not Hispanic or Latin INA
RLMA 2 May 2011 443 1,129 4,792 3,443 3,412 1,193 845 707 0 341 15,620 3 RLMA 2 May 2012 208 641 3,064 2,283 2,233 923 604 507 0 161 10,300 2 RLMA 2 May 2013 80 282 1,604 1,344 1,341 617 370 306 0 142 5,802 0 Ascension 0 24 135 130 118 66 27 23 0 24 499 0 E. Baton Rouge 37 131 799 589 553 266 181 117 0 58 2,615 0 E. Feliciana 3 8 32 21 30 10 7 3 0 2 112 0 Iberville 4 16 55 55 56 26 21 13 0 2 244 0 Livingston 4 17 104 126 153 73 35 23 0 11 524 0 Pointe Coupee 0 8 41 24 40 23 13 26 0 5 170 0 St. Helena 1 5 19 10 9 0 2 2 0 1 47 0 Tangihahoa 21 28 236 201 193 70 39 50 0 19 819 0 Washington 3 12 60 61 58 24 17 8 0 3 240 0 W. Baton Rouge 2 14 47 55 52 27 14 20 0 11 220 0 W. Feliciana 5 19 76 72 79 32 14 21 0 6 312 0 *All parish data are May 2013 UI continued weeks claimed.
RLMA 2 Baton Rouge Unemployment Insurance (UI) Claimant Characteristics
162
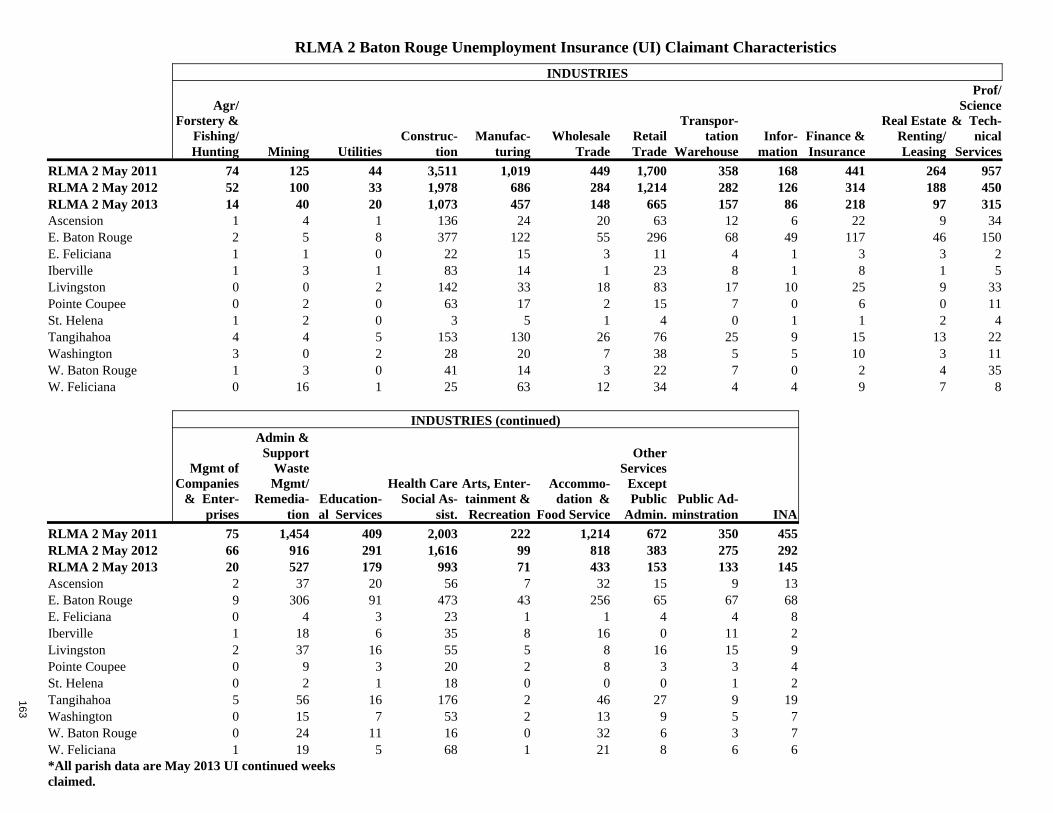
INDUSTRIES
Agr/Forstery &
Fishing/ Hunting Mining Utilities
Construc-tion
Manufac-turing
Wholesale Trade
Retail Trade
Transpor-tation
Warehouse Infor-mation
Finance & Insurance
Real Estate Renting/ Leasing
Prof/ Science
& Tech-nical
Services
RLMA 2 May 2011 74 125 44 3,511 1,019 449 1,700 358 168 441 264 957 RLMA 2 May 2012 52 100 33 1,978 686 284 1,214 282 126 314 188 450 RLMA 2 May 2013 14 40 20 1,073 457 148 665 157 86 218 97 315 Ascension 1 4 1 136 24 20 63 12 6 22 9 34 E. Baton Rouge 2 5 8 377 122 55 296 68 49 117 46 150 E. Feliciana 1 1 0 22 15 3 11 4 1 3 3 2 Iberville 1 3 1 83 14 1 23 8 1 8 1 5 Livingston 0 0 2 142 33 18 83 17 10 25 9 33 Pointe Coupee 0 2 0 63 17 2 15 7 0 6 0 11 St. Helena 1 2 0 3 5 1 4 0 1 1 2 4 Tangihahoa 4 4 5 153 130 26 76 25 9 15 13 22 Washington 3 0 2 28 20 7 38 5 5 10 3 11 W. Baton Rouge 1 3 0 41 14 3 22 7 0 2 4 35 W. Feliciana 0 16 1 25 63 12 34 4 4 9 7 8
INDUSTRIES (continued)
Mgmt of Companies
& Enter-prises
Admin & Support
Waste Mgmt/
Remedia-tion
Education-al Services
Health Care Social As-
sist.
Arts, Enter-tainment & Recreation
Accommo-dation &
Food Service
Other Services
Except Public
Admin. Public Ad-
minstration INA RLMA 2 May 2011 75 1,454 409 2,003 222 1,214 672 350 455 RLMA 2 May 2012 66 916 291 1,616 99 818 383 275 292 RLMA 2 May 2013 20 527 179 993 71 433 153 133 145 Ascension 2 37 20 56 7 32 15 9 13 E. Baton Rouge 9 306 91 473 43 256 65 67 68 E. Feliciana 0 4 3 23 1 1 4 4 8 Iberville 1 18 6 35 8 16 0 11 2 Livingston 2 37 16 55 5 8 16 15 9 Pointe Coupee 0 9 3 20 2 8 3 3 4 St. Helena 0 2 1 18 0 0 0 1 2 Tangihahoa 5 56 16 176 2 46 27 9 19 Washington 0 15 7 53 2 13 9 5 7 W. Baton Rouge 0 24 11 16 0 32 6 3 7 W. Feliciana 1 19 5 68 1 21 8 6 6 *All parish data are May 2013 UI continued weeks claimed.
RLMA 2 Baton Rouge Unemployment Insurance (UI) Claimant Characteristics
163
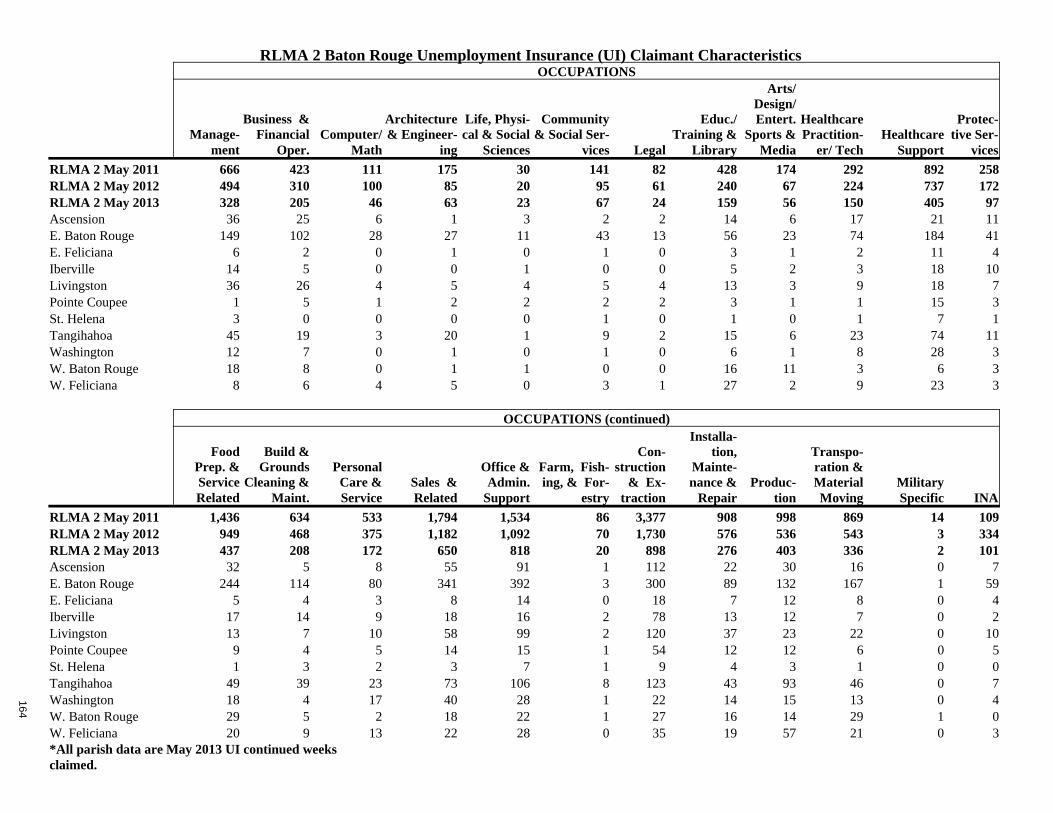
OCCUPATIONS
Manage-
ment
Business & Financial
Oper. Computer/
Math
Architecture & Engineer-
ing
Life, Physi-cal & Social
Sciences
Community & Social Ser-
vices Legal
Educ./ Training &
Library
Arts/ Design/ Entert.
Sports & Media
Healthcare Practition-
er/ Tech Healthcare
Support
Protec-tive Ser-
vices
RLMA 2 May 2011 666 423 111 175 30 141 82 428 174 292 892 258 RLMA 2 May 2012 494 310 100 85 20 95 61 240 67 224 737 172 RLMA 2 May 2013 328 205 46 63 23 67 24 159 56 150 405 97 Ascension 36 25 6 1 3 2 2 14 6 17 21 11 E. Baton Rouge 149 102 28 27 11 43 13 56 23 74 184 41 E. Feliciana 6 2 0 1 0 1 0 3 1 2 11 4 Iberville 14 5 0 0 1 0 0 5 2 3 18 10 Livingston 36 26 4 5 4 5 4 13 3 9 18 7 Pointe Coupee 1 5 1 2 2 2 2 3 1 1 15 3 St. Helena 3 0 0 0 0 1 0 1 0 1 7 1 Tangihahoa 45 19 3 20 1 9 2 15 6 23 74 11 Washington 12 7 0 1 0 1 0 6 1 8 28 3 W. Baton Rouge 18 8 0 1 1 0 0 16 11 3 6 3 W. Feliciana 8 6 4 5 0 3 1 27 2 9 23 3
OCCUPATIONS (continued)
Food Prep. & Service Related
Build & Grounds
Cleaning & Maint.
Personal Care & Service
Sales & Related
Office & Admin.
Support
Farm, Fish-ing, & For-
estry
Con-struction
& Ex-traction
Installa-tion,
Mainte-nance &
Repair Produc-
tion
Transpo-ration & Material Moving
Military Specific INA
RLMA 2 May 2011 1,436 634 533 1,794 1,534 86 3,377 908 998 869 14 109 RLMA 2 May 2012 949 468 375 1,182 1,092 70 1,730 576 536 543 3 334 RLMA 2 May 2013 437 208 172 650 818 20 898 276 403 336 2 101 Ascension 32 5 8 55 91 1 112 22 30 16 0 7 E. Baton Rouge 244 114 80 341 392 3 300 89 132 167 1 59 E. Feliciana 5 4 3 8 14 0 18 7 12 8 0 4 Iberville 17 14 9 18 16 2 78 13 12 7 0 2 Livingston 13 7 10 58 99 2 120 37 23 22 0 10 Pointe Coupee 9 4 5 14 15 1 54 12 12 6 0 5 St. Helena 1 3 2 3 7 1 9 4 3 1 0 0 Tangihahoa 49 39 23 73 106 8 123 43 93 46 0 7 Washington 18 4 17 40 28 1 22 14 15 13 0 4 W. Baton Rouge 29 5 2 18 22 1 27 16 14 29 1 0 W. Feliciana 20 9 13 22 28 0 35 19 57 21 0 3 *All parish data are May 2013 UI continued weeks claimed.
RLMA 2 Baton Rouge Unemployment Insurance (UI) Claimant Characteristics
164
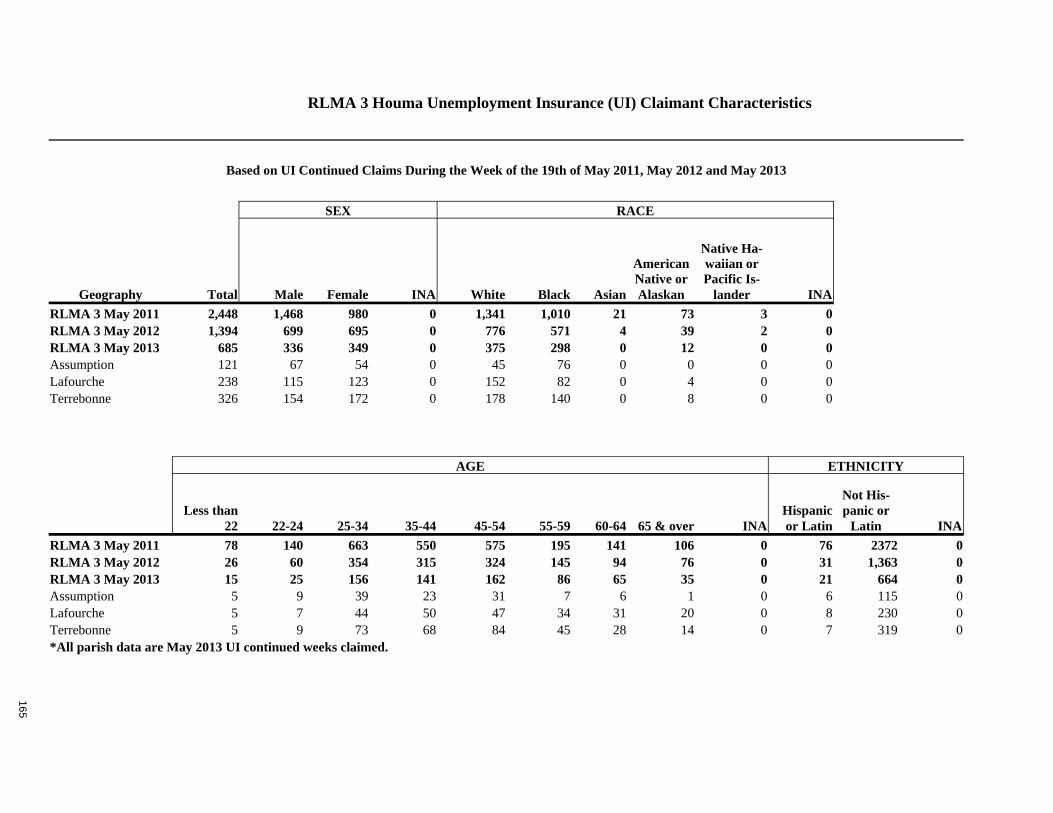
Based on UI Continued Claims During the Week of the 19th of May 2011, May 2012 and May 2013
SEX RACE
Geography Total Male Female INA White Black Asian
American Native or Alaskan
Native Ha-waiian or Pacific Is-
lander INA RLMA 3 May 2011 2,448 1,468 980 0 1,341 1,010 21 73 3 0 RLMA 3 May 2012 1,394 699 695 0 776 571 4 39 2 0 RLMA 3 May 2013 685 336 349 0 375 298 0 12 0 0 Assumption 121 67 54 0 45 76 0 0 0 0 Lafourche 238 115 123 0 152 82 0 4 0 0 Terrebonne 326 154 172 0 178 140 0 8 0 0
AGE ETHNICITY
Less than
22 22-24 25-34 35-44 45-54 55-59 60-64 65 & over INA Hispanic or Latin
Not His-panic or
Latin INA
RLMA 3 May 2011 78 140 663 550 575 195 141 106 0 76 2372 0 RLMA 3 May 2012 26 60 354 315 324 145 94 76 0 31 1,363 0 RLMA 3 May 2013 15 25 156 141 162 86 65 35 0 21 664 0 Assumption 5 9 39 23 31 7 6 1 0 6 115 0 Lafourche 5 7 44 50 47 34 31 20 0 8 230 0 Terrebonne 5 9 73 68 84 45 28 14 0 7 319 0 *All parish data are May 2013 UI continued weeks claimed.
RLMA 3 Houma Unemployment Insurance (UI) Claimant Characteristics
165
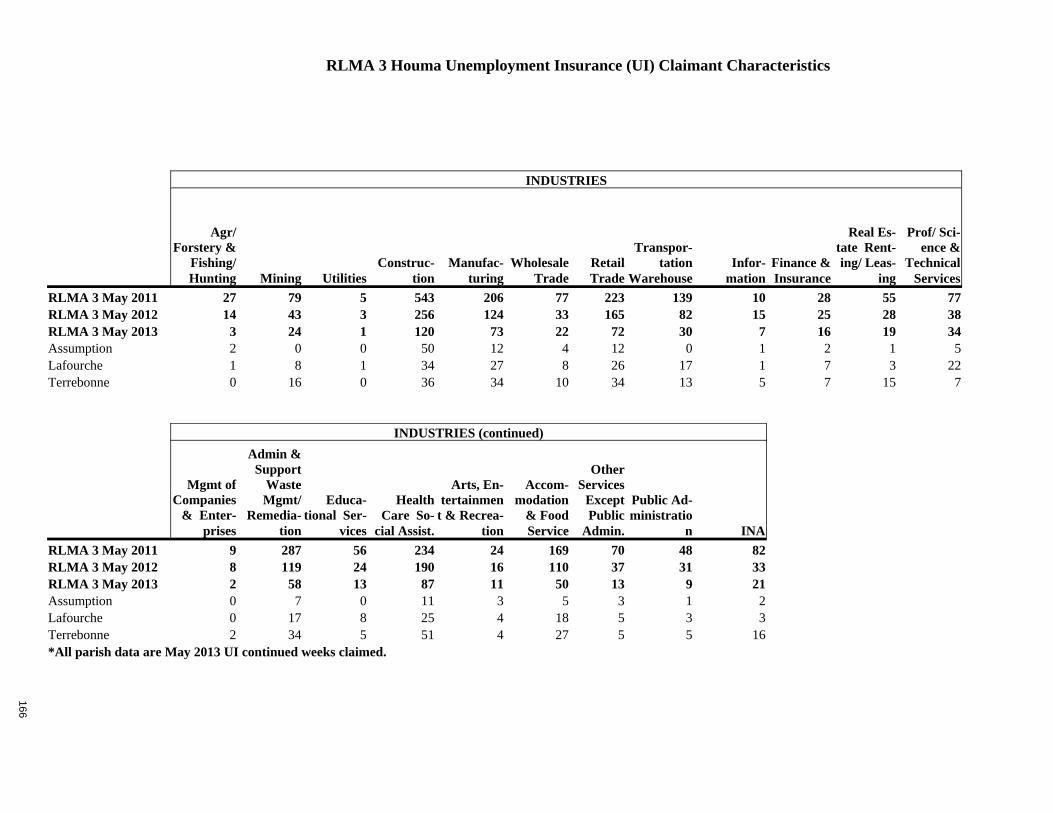
INDUSTRIES
Agr/Forstery &
Fishing/ Hunting Mining Utilities
Construc-tion
Manufac-turing
Wholesale Trade
Retail Trade
Transpor-tation
Warehouse Infor-mation
Finance & Insurance
Real Es-tate Rent-ing/ Leas-
ing
Prof/ Sci-ence &
Technical Services
RLMA 3 May 2011 27 79 5 543 206 77 223 139 10 28 55 77 RLMA 3 May 2012 14 43 3 256 124 33 165 82 15 25 28 38 RLMA 3 May 2013 3 24 1 120 73 22 72 30 7 16 19 34 Assumption 2 0 0 50 12 4 12 0 1 2 1 5 Lafourche 1 8 1 34 27 8 26 17 1 7 3 22 Terrebonne 0 16 0 36 34 10 34 13 5 7 15 7
INDUSTRIES (continued)
Mgmt of Companies
& Enter-prises
Admin & Support
Waste Mgmt/
Remedia-tion
Educa-tional Ser-
vices
Health Care So-
cial Assist.
Arts, En-tertainmen
t & Recrea-tion
Accom-modation
& Food Service
Other Services
Except Public
Admin.
Public Ad-ministratio
n INA RLMA 3 May 2011 9 287 56 234 24 169 70 48 82 RLMA 3 May 2012 8 119 24 190 16 110 37 31 33 RLMA 3 May 2013 2 58 13 87 11 50 13 9 21 Assumption 0 7 0 11 3 5 3 1 2 Lafourche 0 17 8 25 4 18 5 3 3 Terrebonne 2 34 5 51 4 27 5 5 16 *All parish data are May 2013 UI continued weeks claimed.
RLMA 3 Houma Unemployment Insurance (UI) Claimant Characteristics
166
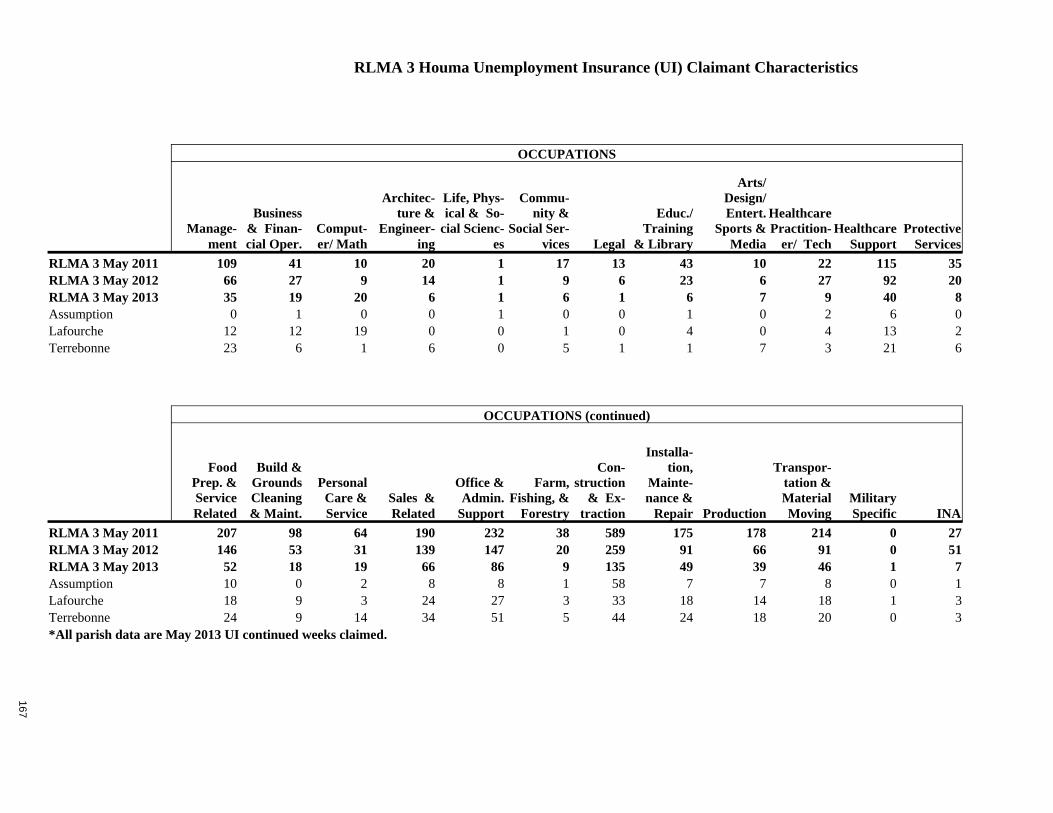
OCCUPATIONS
Manage-
ment
Business & Finan-cial Oper.
Comput-er/ Math
Architec-ture &
Engineer-ing
Life, Phys-ical & So-
cial Scienc-es
Commu-nity &
Social Ser-vices Legal
Educ./ Training
& Library
Arts/ Design/ Entert.
Sports & Media
Healthcare Practition-
er/ Tech
Healthcare
Support Protective
Services
RLMA 3 May 2011 109 41 10 20 1 17 13 43 10 22 115 35 RLMA 3 May 2012 66 27 9 14 1 9 6 23 6 27 92 20 RLMA 3 May 2013 35 19 20 6 1 6 1 6 7 9 40 8 Assumption 0 1 0 0 1 0 0 1 0 2 6 0 Lafourche 12 12 19 0 0 1 0 4 0 4 13 2 Terrebonne 23 6 1 6 0 5 1 1 7 3 21 6
OCCUPATIONS (continued)
Food Prep. & Service Related
Build & Grounds Cleaning & Maint.
Personal Care & Service
Sales & Related
Office & Admin.
Support
Farm, Fishing, &
Forestry
Con-struction
& Ex-traction
Installa-tion,
Mainte-nance &
Repair Production
Transpor-tation & Material Moving
Military Specific INA
RLMA 3 May 2011 207 98 64 190 232 38 589 175 178 214 0 27 RLMA 3 May 2012 146 53 31 139 147 20 259 91 66 91 0 51 RLMA 3 May 2013 52 18 19 66 86 9 135 49 39 46 1 7 Assumption 10 0 2 8 8 1 58 7 7 8 0 1 Lafourche 18 9 3 24 27 3 33 18 14 18 1 3 Terrebonne 24 9 14 34 51 5 44 24 18 20 0 3 *All parish data are May 2013 UI continued weeks claimed.
RLMA 3 Houma Unemployment Insurance (UI) Claimant Characteristics
167
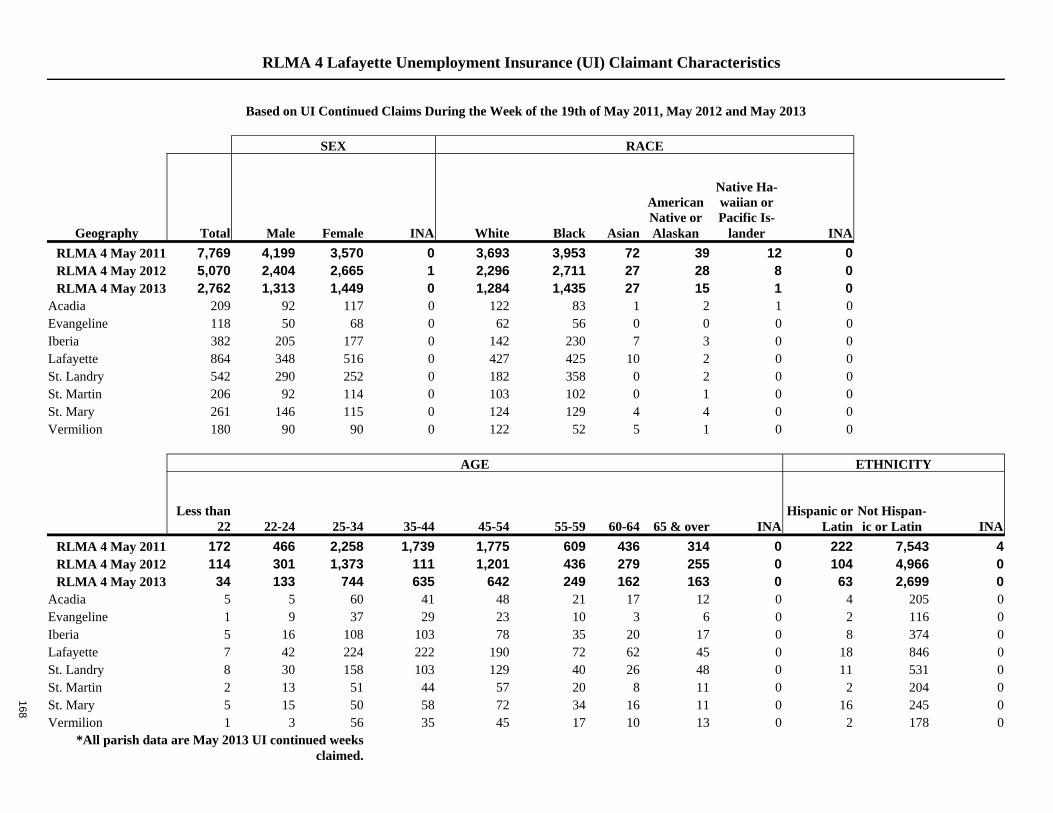
Based on UI Continued Claims During the Week of the 19th of May 2011, May 2012 and May 2013
SEX RACE
Geography Total Male Female INA White Black Asian
American Native or Alaskan
Native Ha-waiian or Pacific Is-
lander INA RLMA 4 May 2011 7,769 4,199 3,570 0 3,693 3,953 72 39 12 0 RLMA 4 May 2012 5,070 2,404 2,665 1 2,296 2,711 27 28 8 0 RLMA 4 May 2013 2,762 1,313 1,449 0 1,284 1,435 27 15 1 0
Acadia 209 92 117 0 122 83 1 2 1 0 Evangeline 118 50 68 0 62 56 0 0 0 0 Iberia 382 205 177 0 142 230 7 3 0 0 Lafayette 864 348 516 0 427 425 10 2 0 0 St. Landry 542 290 252 0 182 358 0 2 0 0 St. Martin 206 92 114 0 103 102 0 1 0 0 St. Mary 261 146 115 0 124 129 4 4 0 0 Vermilion 180 90 90 0 122 52 5 1 0 0
AGE ETHNICITY
Less than
22 22-24 25-34 35-44 45-54 55-59 60-64 65 & over INA Hispanic or
Latin Not Hispan-ic or Latin INA
RLMA 4 May 2011 172 466 2,258 1,739 1,775 609 436 314 0 222 7,543 4 RLMA 4 May 2012 114 301 1,373 111 1,201 436 279 255 0 104 4,966 0 RLMA 4 May 2013 34 133 744 635 642 249 162 163 0 63 2,699 0
Acadia 5 5 60 41 48 21 17 12 0 4 205 0 Evangeline 1 9 37 29 23 10 3 6 0 2 116 0 Iberia 5 16 108 103 78 35 20 17 0 8 374 0 Lafayette 7 42 224 222 190 72 62 45 0 18 846 0 St. Landry 8 30 158 103 129 40 26 48 0 11 531 0 St. Martin 2 13 51 44 57 20 8 11 0 2 204 0 St. Mary 5 15 50 58 72 34 16 11 0 16 245 0 Vermilion 1 3 56 35 45 17 10 13 0 2 178 0
*All parish data are May 2013 UI continued weeks claimed.
RLMA 4 Lafayette Unemployment Insurance (UI) Claimant Characteristics
168
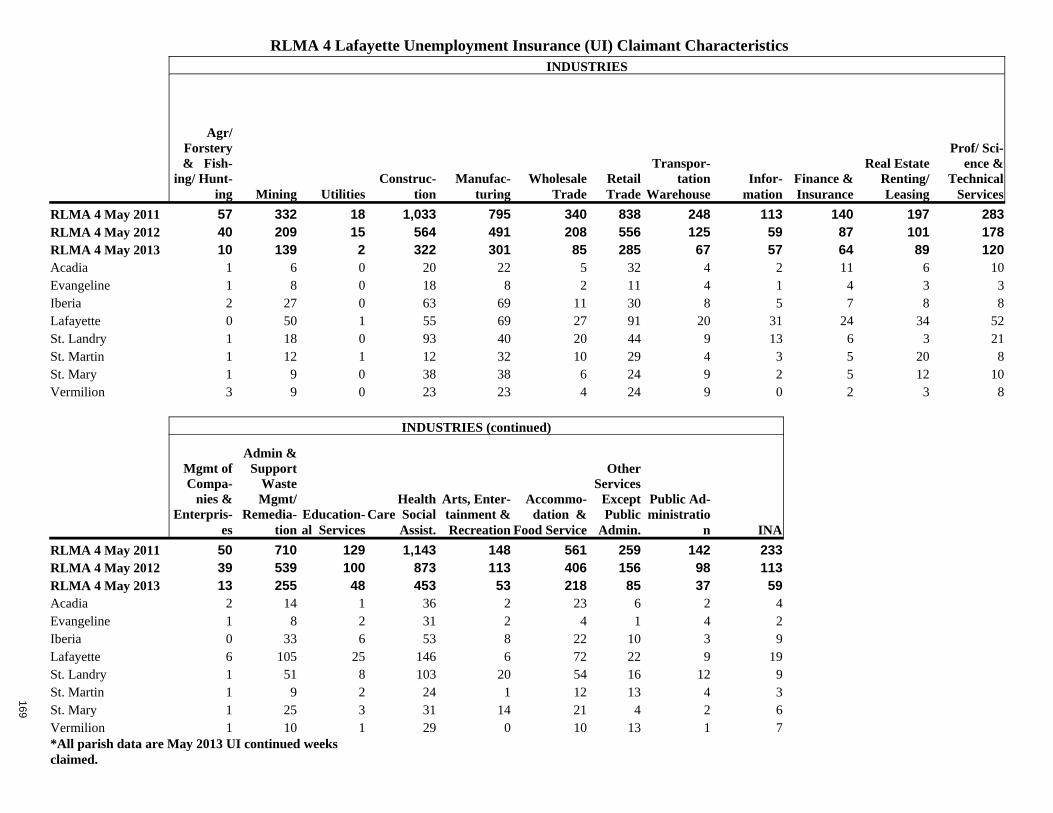
INDUSTRIES
Agr/Forstery & Fish-
ing/ Hunt-ing Mining Utilities
Construc-tion
Manufac-turing
Wholesale Trade
Retail Trade
Transpor-tation
Warehouse Infor-mation
Finance & Insurance
Real Estate Renting/ Leasing
Prof/ Sci-ence &
Technical Services
RLMA 4 May 2011 57 332 18 1,033 795 340 838 248 113 140 197 283 RLMA 4 May 2012 40 209 15 564 491 208 556 125 59 87 101 178 RLMA 4 May 2013 10 139 2 322 301 85 285 67 57 64 89 120 Acadia 1 6 0 20 22 5 32 4 2 11 6 10 Evangeline 1 8 0 18 8 2 11 4 1 4 3 3 Iberia 2 27 0 63 69 11 30 8 5 7 8 8 Lafayette 0 50 1 55 69 27 91 20 31 24 34 52 St. Landry 1 18 0 93 40 20 44 9 13 6 3 21 St. Martin 1 12 1 12 32 10 29 4 3 5 20 8 St. Mary 1 9 0 38 38 6 24 9 2 5 12 10 Vermilion 3 9 0 23 23 4 24 9 0 2 3 8
INDUSTRIES (continued)
Mgmt of Compa-
nies & Enterpris-
es
Admin & Support
Waste Mgmt/
Remedia-tion
Education-al Services
Health Care Social
Assist.
Arts, Enter-tainment & Recreation
Accommo-dation &
Food Service
Other Services
Except Public
Admin.
Public Ad-ministratio
n INA RLMA 4 May 2011 50 710 129 1,143 148 561 259 142 233 RLMA 4 May 2012 39 539 100 873 113 406 156 98 113 RLMA 4 May 2013 13 255 48 453 53 218 85 37 59 Acadia 2 14 1 36 2 23 6 2 4 Evangeline 1 8 2 31 2 4 1 4 2 Iberia 0 33 6 53 8 22 10 3 9 Lafayette 6 105 25 146 6 72 22 9 19 St. Landry 1 51 8 103 20 54 16 12 9 St. Martin 1 9 2 24 1 12 13 4 3 St. Mary 1 25 3 31 14 21 4 2 6 Vermilion 1 10 1 29 0 10 13 1 7 *All parish data are May 2013 UI continued weeks claimed.
RLMA 4 Lafayette Unemployment Insurance (UI) Claimant Characteristics
169
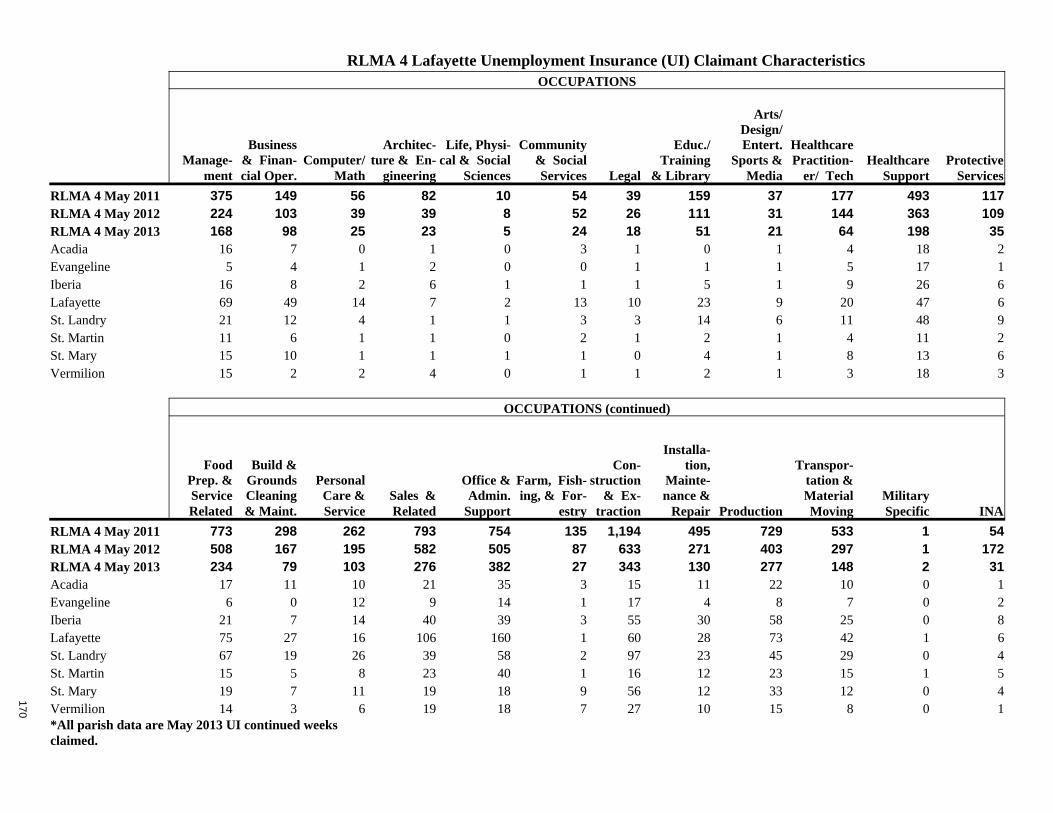
OCCUPATIONS
Manage-
ment
Business & Finan-cial Oper.
Computer/ Math
Architec-ture & En-
gineering
Life, Physi-cal & Social
Sciences
Community & Social Services Legal
Educ./ Training
& Library
Arts/ Design/ Entert.
Sports & Media
Healthcare Practition-
er/ Tech Healthcare
Support Protective
Services
RLMA 4 May 2011 375 149 56 82 10 54 39 159 37 177 493 117 RLMA 4 May 2012 224 103 39 39 8 52 26 111 31 144 363 109 RLMA 4 May 2013 168 98 25 23 5 24 18 51 21 64 198 35 Acadia 16 7 0 1 0 3 1 0 1 4 18 2 Evangeline 5 4 1 2 0 0 1 1 1 5 17 1 Iberia 16 8 2 6 1 1 1 5 1 9 26 6 Lafayette 69 49 14 7 2 13 10 23 9 20 47 6 St. Landry 21 12 4 1 1 3 3 14 6 11 48 9 St. Martin 11 6 1 1 0 2 1 2 1 4 11 2 St. Mary 15 10 1 1 1 1 0 4 1 8 13 6 Vermilion 15 2 2 4 0 1 1 2 1 3 18 3
OCCUPATIONS (continued)
Food Prep. & Service Related
Build & Grounds Cleaning & Maint.
Personal Care & Service
Sales & Related
Office & Admin.
Support
Farm, Fish-ing, & For-
estry
Con-struction
& Ex-traction
Installa-tion,
Mainte-nance &
Repair Production
Transpor-tation & Material Moving
Military Specific INA
RLMA 4 May 2011 773 298 262 793 754 135 1,194 495 729 533 1 54 RLMA 4 May 2012 508 167 195 582 505 87 633 271 403 297 1 172 RLMA 4 May 2013 234 79 103 276 382 27 343 130 277 148 2 31 Acadia 17 11 10 21 35 3 15 11 22 10 0 1 Evangeline 6 0 12 9 14 1 17 4 8 7 0 2 Iberia 21 7 14 40 39 3 55 30 58 25 0 8 Lafayette 75 27 16 106 160 1 60 28 73 42 1 6 St. Landry 67 19 26 39 58 2 97 23 45 29 0 4 St. Martin 15 5 8 23 40 1 16 12 23 15 1 5 St. Mary 19 7 11 19 18 9 56 12 33 12 0 4 Vermilion 14 3 6 19 18 7 27 10 15 8 0 1 *All parish data are May 2013 UI continued weeks claimed.
RLMA 4 Lafayette Unemployment Insurance (UI) Claimant Characteristics
170
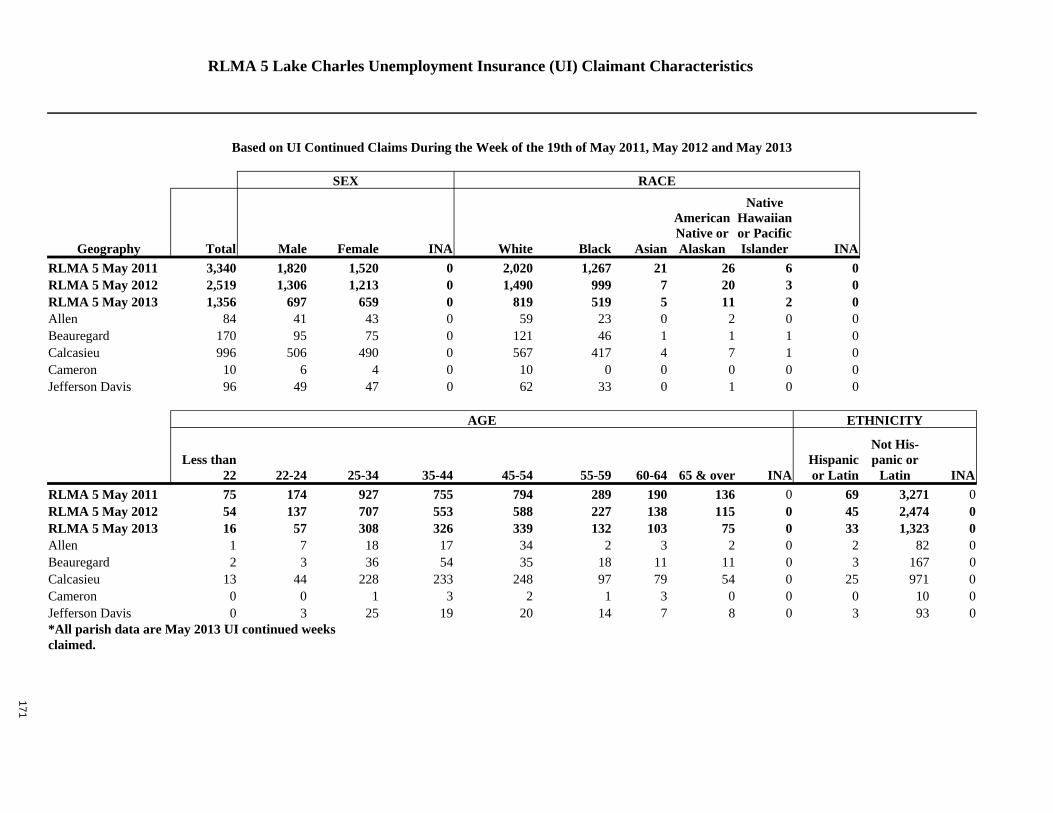
Based on UI Continued Claims During the Week of the 19th of May 2011, May 2012 and May 2013
SEX RACE
Geography Total Male Female INA White Black Asian
American Native or Alaskan
Native Hawaiian or Pacific Islander INA
RLMA 5 May 2011 3,340 1,820 1,520 0 2,020 1,267 21 26 6 0 RLMA 5 May 2012 2,519 1,306 1,213 0 1,490 999 7 20 3 0 RLMA 5 May 2013 1,356 697 659 0 819 519 5 11 2 0 Allen 84 41 43 0 59 23 0 2 0 0 Beauregard 170 95 75 0 121 46 1 1 1 0 Calcasieu 996 506 490 0 567 417 4 7 1 0 Cameron 10 6 4 0 10 0 0 0 0 0 Jefferson Davis 96 49 47 0 62 33 0 1 0 0
AGE ETHNICITY
Less than
22 22-24 25-34 35-44 45-54 55-59 60-64 65 & over INA Hispanic or Latin
Not His-panic or
Latin INA
RLMA 5 May 2011 75 174 927 755 794 289 190 136 0 69 3,271 0 RLMA 5 May 2012 54 137 707 553 588 227 138 115 0 45 2,474 0 RLMA 5 May 2013 16 57 308 326 339 132 103 75 0 33 1,323 0 Allen 1 7 18 17 34 2 3 2 0 2 82 0 Beauregard 2 3 36 54 35 18 11 11 0 3 167 0 Calcasieu 13 44 228 233 248 97 79 54 0 25 971 0 Cameron 0 0 1 3 2 1 3 0 0 0 10 0 Jefferson Davis 0 3 25 19 20 14 7 8 0 3 93 0 *All parish data are May 2013 UI continued weeks claimed.
RLMA 5 Lake Charles Unemployment Insurance (UI) Claimant Characteristics
171
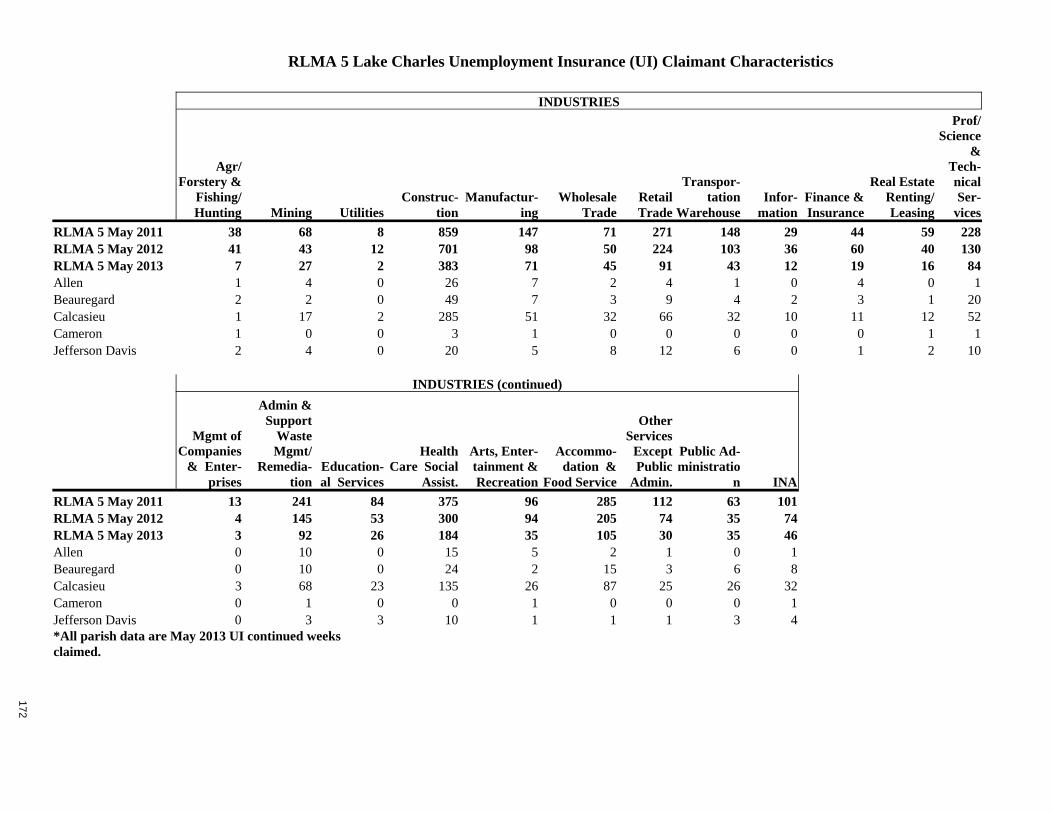
INDUSTRIES
Agr/Forstery &
Fishing/ Hunting Mining Utilities
Construc-tion
Manufactur-ing
Wholesale Trade
Retail Trade
Transpor-tation
Warehouse Infor-mation
Finance & Insurance
Real Estate Renting/ Leasing
Prof/ Science
& Tech-nical Ser-
vices
RLMA 5 May 2011 38 68 8 859 147 71 271 148 29 44 59 228 RLMA 5 May 2012 41 43 12 701 98 50 224 103 36 60 40 130 RLMA 5 May 2013 7 27 2 383 71 45 91 43 12 19 16 84 Allen 1 4 0 26 7 2 4 1 0 4 0 1 Beauregard 2 2 0 49 7 3 9 4 2 3 1 20 Calcasieu 1 17 2 285 51 32 66 32 10 11 12 52 Cameron 1 0 0 3 1 0 0 0 0 0 1 1 Jefferson Davis 2 4 0 20 5 8 12 6 0 1 2 10
INDUSTRIES (continued)
Mgmt of Companies
& Enter-prises
Admin & Support
Waste Mgmt/
Remedia-tion
Education-al Services
Health Care Social
Assist.
Arts, Enter-tainment & Recreation
Accommo-dation &
Food Service
Other Services
Except Public
Admin.
Public Ad-ministratio
n INA RLMA 5 May 2011 13 241 84 375 96 285 112 63 101 RLMA 5 May 2012 4 145 53 300 94 205 74 35 74 RLMA 5 May 2013 3 92 26 184 35 105 30 35 46 Allen 0 10 0 15 5 2 1 0 1 Beauregard 0 10 0 24 2 15 3 6 8 Calcasieu 3 68 23 135 26 87 25 26 32 Cameron 0 1 0 0 1 0 0 0 1 Jefferson Davis 0 3 3 10 1 1 1 3 4 *All parish data are May 2013 UI continued weeks claimed.
RLMA 5 Lake Charles Unemployment Insurance (UI) Claimant Characteristics
172
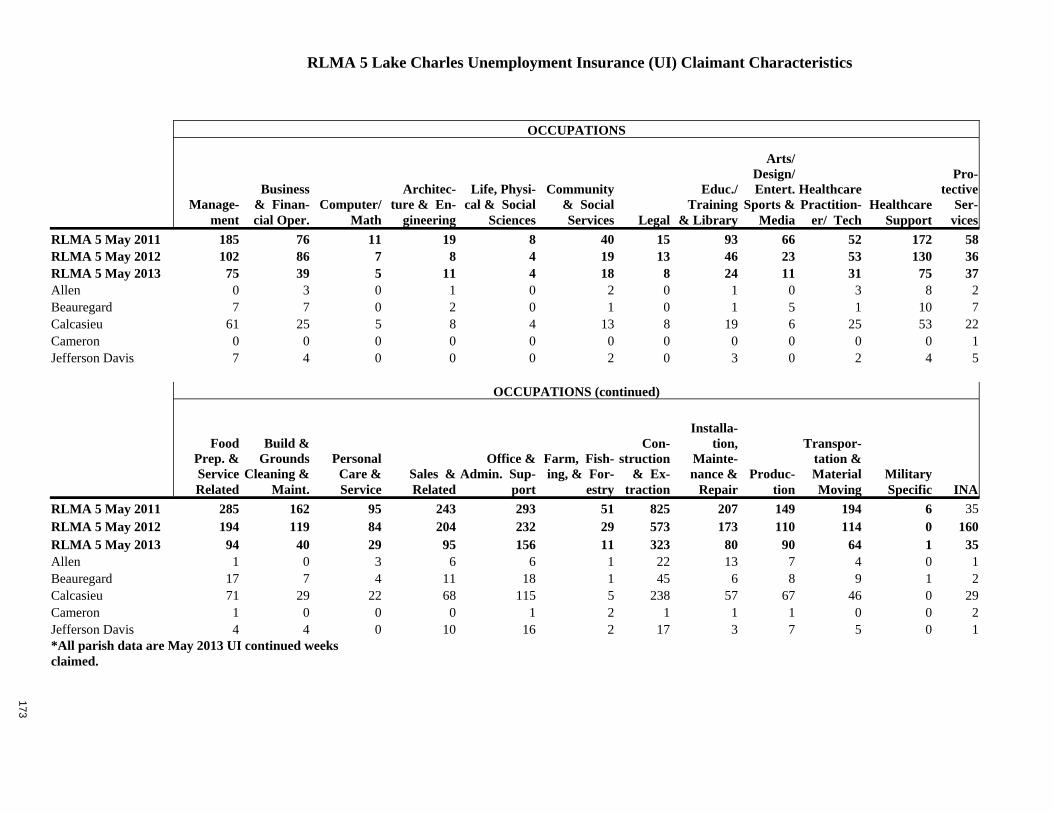
OCCUPATIONS
Manage-
ment
Business & Finan-cial Oper.
Computer/ Math
Architec-ture & En-
gineering
Life, Physi-cal & Social
Sciences
Community & Social Services Legal
Educ./ Training
& Library
Arts/ Design/ Entert.
Sports & Media
Healthcare Practition-
er/ Tech Healthcare
Support
Pro-tective
Ser-vices
RLMA 5 May 2011 185 76 11 19 8 40 15 93 66 52 172 58 RLMA 5 May 2012 102 86 7 8 4 19 13 46 23 53 130 36 RLMA 5 May 2013 75 39 5 11 4 18 8 24 11 31 75 37 Allen 0 3 0 1 0 2 0 1 0 3 8 2 Beauregard 7 7 0 2 0 1 0 1 5 1 10 7 Calcasieu 61 25 5 8 4 13 8 19 6 25 53 22 Cameron 0 0 0 0 0 0 0 0 0 0 0 1 Jefferson Davis 7 4 0 0 0 2 0 3 0 2 4 5
OCCUPATIONS (continued)
Food Prep. & Service Related
Build & Grounds
Cleaning & Maint.
Personal Care & Service
Sales & Related
Office & Admin. Sup-
port
Farm, Fish-ing, & For-
estry
Con-struction
& Ex-traction
Installa-tion,
Mainte-nance &
Repair Produc-
tion
Transpor-tation & Material Moving
Military Specific INA
RLMA 5 May 2011 285 162 95 243 293 51 825 207 149 194 6 35 RLMA 5 May 2012 194 119 84 204 232 29 573 173 110 114 0 160 RLMA 5 May 2013 94 40 29 95 156 11 323 80 90 64 1 35 Allen 1 0 3 6 6 1 22 13 7 4 0 1 Beauregard 17 7 4 11 18 1 45 6 8 9 1 2 Calcasieu 71 29 22 68 115 5 238 57 67 46 0 29 Cameron 1 0 0 0 1 2 1 1 1 0 0 2 Jefferson Davis 4 4 0 10 16 2 17 3 7 5 0 1 *All parish data are May 2013 UI continued weeks claimed.
RLMA 5 Lake Charles Unemployment Insurance (UI) Claimant Characteristics
173
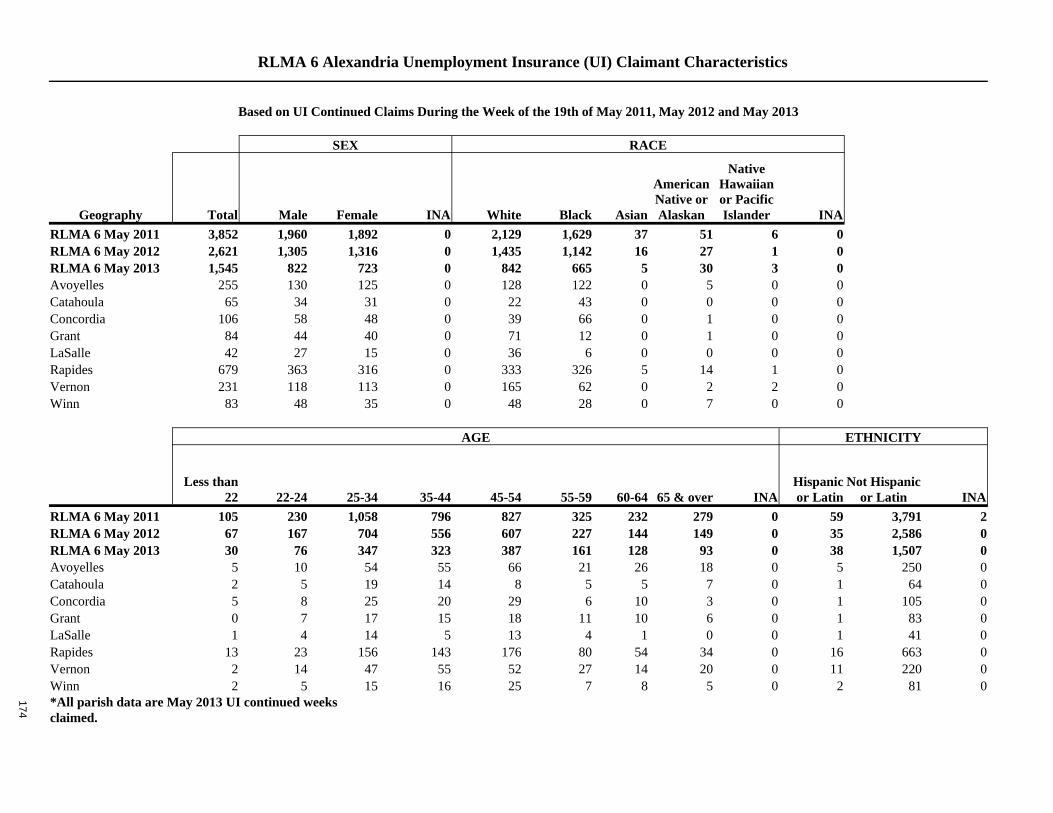
Based on UI Continued Claims During the Week of the 19th of May 2011, May 2012 and May 2013
SEX RACE
Geography Total Male Female INA White Black Asian
American Native or Alaskan
Native Hawaiian or Pacific Islander INA
RLMA 6 May 2011 3,852 1,960 1,892 0 2,129 1,629 37 51 6 0 RLMA 6 May 2012 2,621 1,305 1,316 0 1,435 1,142 16 27 1 0 RLMA 6 May 2013 1,545 822 723 0 842 665 5 30 3 0 Avoyelles 255 130 125 0 128 122 0 5 0 0 Catahoula 65 34 31 0 22 43 0 0 0 0 Concordia 106 58 48 0 39 66 0 1 0 0 Grant 84 44 40 0 71 12 0 1 0 0 LaSalle 42 27 15 0 36 6 0 0 0 0 Rapides 679 363 316 0 333 326 5 14 1 0 Vernon 231 118 113 0 165 62 0 2 2 0 Winn 83 48 35 0 48 28 0 7 0 0
AGE ETHNICITY
Less than
22 22-24 25-34 35-44 45-54 55-59 60-64 65 & over INA Hispanic or Latin
Not Hispanic or Latin INA
RLMA 6 May 2011 105 230 1,058 796 827 325 232 279 0 59 3,791 2 RLMA 6 May 2012 67 167 704 556 607 227 144 149 0 35 2,586 0 RLMA 6 May 2013 30 76 347 323 387 161 128 93 0 38 1,507 0 Avoyelles 5 10 54 55 66 21 26 18 0 5 250 0 Catahoula 2 5 19 14 8 5 5 7 0 1 64 0 Concordia 5 8 25 20 29 6 10 3 0 1 105 0 Grant 0 7 17 15 18 11 10 6 0 1 83 0 LaSalle 1 4 14 5 13 4 1 0 0 1 41 0 Rapides 13 23 156 143 176 80 54 34 0 16 663 0 Vernon 2 14 47 55 52 27 14 20 0 11 220 0 Winn 2 5 15 16 25 7 8 5 0 2 81 0 *All parish data are May 2013 UI continued weeks claimed.
RLMA 6 Alexandria Unemployment Insurance (UI) Claimant Characteristics
174
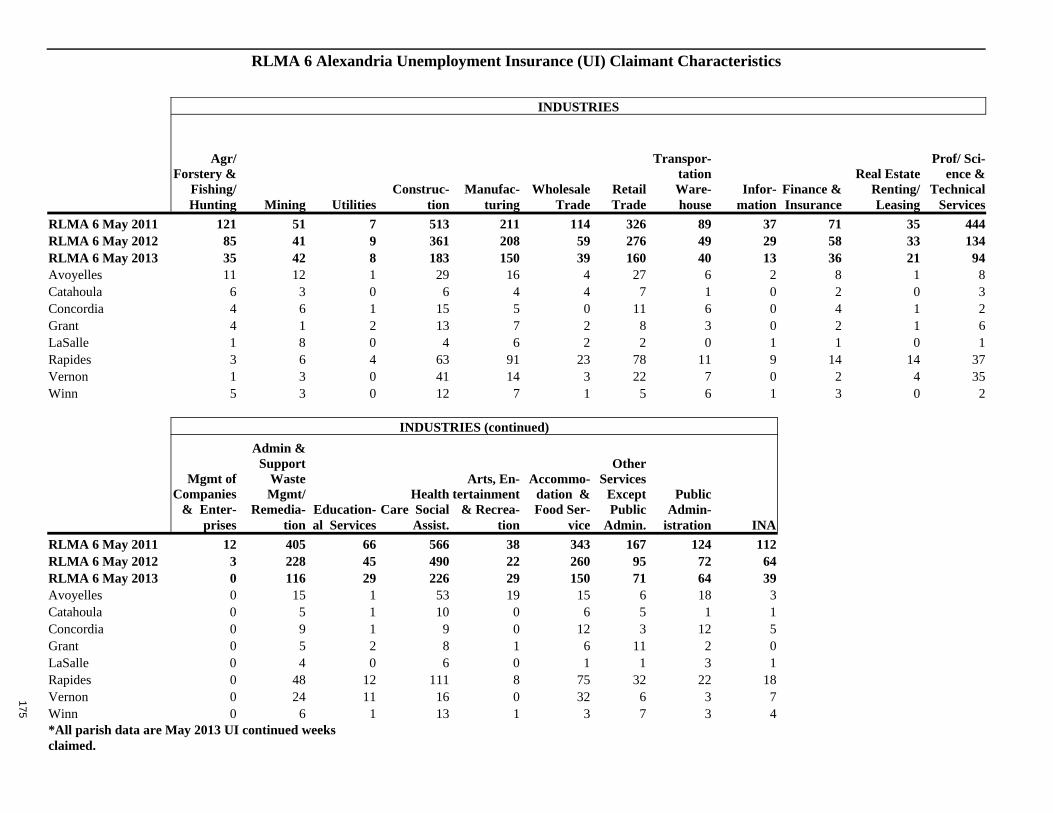
INDUSTRIES
Agr/Forstery &
Fishing/ Hunting Mining Utilities
Construc-tion
Manufac-turing
Wholesale Trade
Retail Trade
Transpor-tation Ware-house
Infor-mation
Finance & Insurance
Real Estate Renting/ Leasing
Prof/ Sci-ence &
Technical Services
RLMA 6 May 2011 121 51 7 513 211 114 326 89 37 71 35 444 RLMA 6 May 2012 85 41 9 361 208 59 276 49 29 58 33 134 RLMA 6 May 2013 35 42 8 183 150 39 160 40 13 36 21 94 Avoyelles 11 12 1 29 16 4 27 6 2 8 1 8 Catahoula 6 3 0 6 4 4 7 1 0 2 0 3 Concordia 4 6 1 15 5 0 11 6 0 4 1 2 Grant 4 1 2 13 7 2 8 3 0 2 1 6 LaSalle 1 8 0 4 6 2 2 0 1 1 0 1 Rapides 3 6 4 63 91 23 78 11 9 14 14 37 Vernon 1 3 0 41 14 3 22 7 0 2 4 35 Winn 5 3 0 12 7 1 5 6 1 3 0 2
INDUSTRIES (continued)
Mgmt of Companies
& Enter-prises
Admin & Support
Waste Mgmt/
Remedia-tion
Education-al Services
Health Care Social
Assist.
Arts, En-tertainment
& Recrea-tion
Accommo-dation & Food Ser-
vice
Other Services
Except Public
Admin.
Public Admin-
istration INA RLMA 6 May 2011 12 405 66 566 38 343 167 124 112 RLMA 6 May 2012 3 228 45 490 22 260 95 72 64 RLMA 6 May 2013 0 116 29 226 29 150 71 64 39 Avoyelles 0 15 1 53 19 15 6 18 3 Catahoula 0 5 1 10 0 6 5 1 1 Concordia 0 9 1 9 0 12 3 12 5 Grant 0 5 2 8 1 6 11 2 0 LaSalle 0 4 0 6 0 1 1 3 1 Rapides 0 48 12 111 8 75 32 22 18 Vernon 0 24 11 16 0 32 6 3 7 Winn 0 6 1 13 1 3 7 3 4 *All parish data are May 2013 UI continued weeks claimed.
RLMA 6 Alexandria Unemployment Insurance (UI) Claimant Characteristics
175
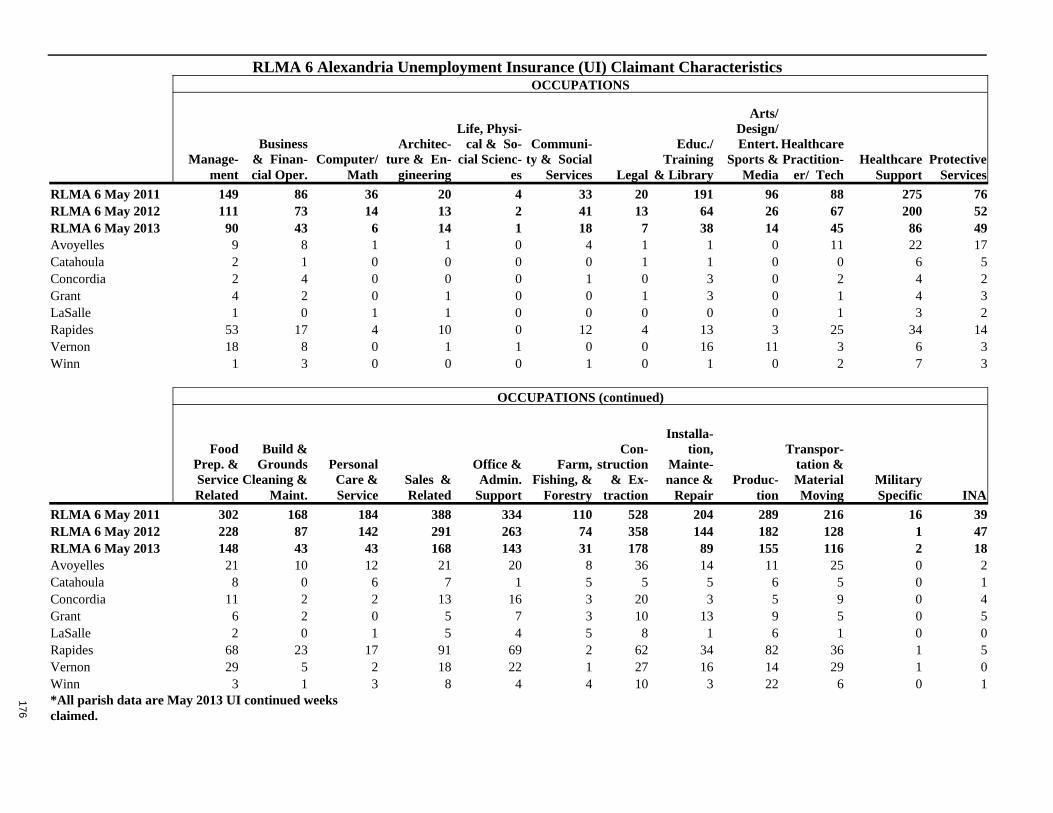
OCCUPATIONS
Manage-
ment
Business & Finan-cial Oper.
Computer/ Math
Architec-ture & En-
gineering
Life, Physi-cal & So-
cial Scienc-es
Communi-ty & Social
Services Legal
Educ./ Training
& Library
Arts/ Design/ Entert.
Sports & Media
Healthcare Practition-
er/ Tech Healthcare
Support Protective
Services
RLMA 6 May 2011 149 86 36 20 4 33 20 191 96 88 275 76 RLMA 6 May 2012 111 73 14 13 2 41 13 64 26 67 200 52 RLMA 6 May 2013 90 43 6 14 1 18 7 38 14 45 86 49 Avoyelles 9 8 1 1 0 4 1 1 0 11 22 17 Catahoula 2 1 0 0 0 0 1 1 0 0 6 5 Concordia 2 4 0 0 0 1 0 3 0 2 4 2 Grant 4 2 0 1 0 0 1 3 0 1 4 3 LaSalle 1 0 1 1 0 0 0 0 0 1 3 2 Rapides 53 17 4 10 0 12 4 13 3 25 34 14 Vernon 18 8 0 1 1 0 0 16 11 3 6 3 Winn 1 3 0 0 0 1 0 1 0 2 7 3
OCCUPATIONS (continued)
Food Prep. & Service Related
Build & Grounds
Cleaning & Maint.
Personal Care & Service
Sales & Related
Office & Admin.
Support
Farm, Fishing, &
Forestry
Con-struction
& Ex-traction
Installa-tion,
Mainte-nance &
Repair Produc-
tion
Transpor-tation & Material Moving
Military Specific INA
RLMA 6 May 2011 302 168 184 388 334 110 528 204 289 216 16 39 RLMA 6 May 2012 228 87 142 291 263 74 358 144 182 128 1 47 RLMA 6 May 2013 148 43 43 168 143 31 178 89 155 116 2 18 Avoyelles 21 10 12 21 20 8 36 14 11 25 0 2 Catahoula 8 0 6 7 1 5 5 5 6 5 0 1 Concordia 11 2 2 13 16 3 20 3 5 9 0 4 Grant 6 2 0 5 7 3 10 13 9 5 0 5 LaSalle 2 0 1 5 4 5 8 1 6 1 0 0 Rapides 68 23 17 91 69 2 62 34 82 36 1 5 Vernon 29 5 2 18 22 1 27 16 14 29 1 0 Winn 3 1 3 8 4 4 10 3 22 6 0 1 *All parish data are May 2013 UI continued weeks claimed.
RLMA 6 Alexandria Unemployment Insurance (UI) Claimant Characteristics
176
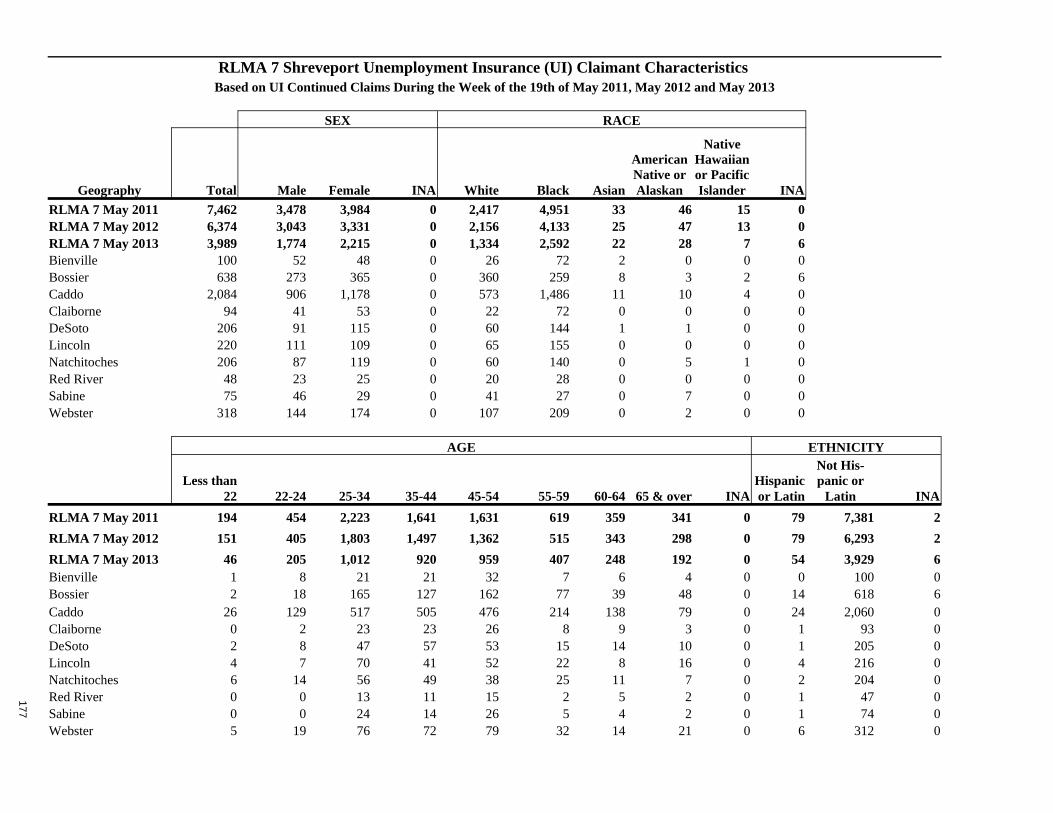
Based on UI Continued Claims During the Week of the 19th of May 2011, May 2012 and May 2013
SEX RACE
Geography Total Male Female INA White Black Asian
American Native or Alaskan
Native Hawaiian or Pacific Islander INA
RLMA 7 May 2011 7,462 3,478 3,984 0 2,417 4,951 33 46 15 0 RLMA 7 May 2012 6,374 3,043 3,331 0 2,156 4,133 25 47 13 0 RLMA 7 May 2013 3,989 1,774 2,215 0 1,334 2,592 22 28 7 6 Bienville 100 52 48 0 26 72 2 0 0 0 Bossier 638 273 365 0 360 259 8 3 2 6 Caddo 2,084 906 1,178 0 573 1,486 11 10 4 0 Claiborne 94 41 53 0 22 72 0 0 0 0 DeSoto 206 91 115 0 60 144 1 1 0 0 Lincoln 220 111 109 0 65 155 0 0 0 0 Natchitoches 206 87 119 0 60 140 0 5 1 0 Red River 48 23 25 0 20 28 0 0 0 0 Sabine 75 46 29 0 41 27 0 7 0 0 Webster 318 144 174 0 107 209 0 2 0 0
AGE ETHNICITY
Less than
22 22-24 25-34 35-44 45-54 55-59 60-64 65 & over INA Hispanic or Latin
Not His-panic or
Latin INA
RLMA 7 May 2011 194 454 2,223 1,641 1,631 619 359 341 0 79 7,381 2
RLMA 7 May 2012 151 405 1,803 1,497 1,362 515 343 298 0 79 6,293 2
RLMA 7 May 2013 46 205 1,012 920 959 407 248 192 0 54 3,929 6 Bienville 1 8 21 21 32 7 6 4 0 0 100 0 Bossier 2 18 165 127 162 77 39 48 0 14 618 6 Caddo 26 129 517 505 476 214 138 79 0 24 2,060 0 Claiborne 0 2 23 23 26 8 9 3 0 1 93 0 DeSoto 2 8 47 57 53 15 14 10 0 1 205 0 Lincoln 4 7 70 41 52 22 8 16 0 4 216 0 Natchitoches 6 14 56 49 38 25 11 7 0 2 204 0 Red River 0 0 13 11 15 2 5 2 0 1 47 0 Sabine 0 0 24 14 26 5 4 2 0 1 74 0 Webster 5 19 76 72 79 32 14 21 0 6 312 0
RLMA 7 Shreveport Unemployment Insurance (UI) Claimant Characteristics
177
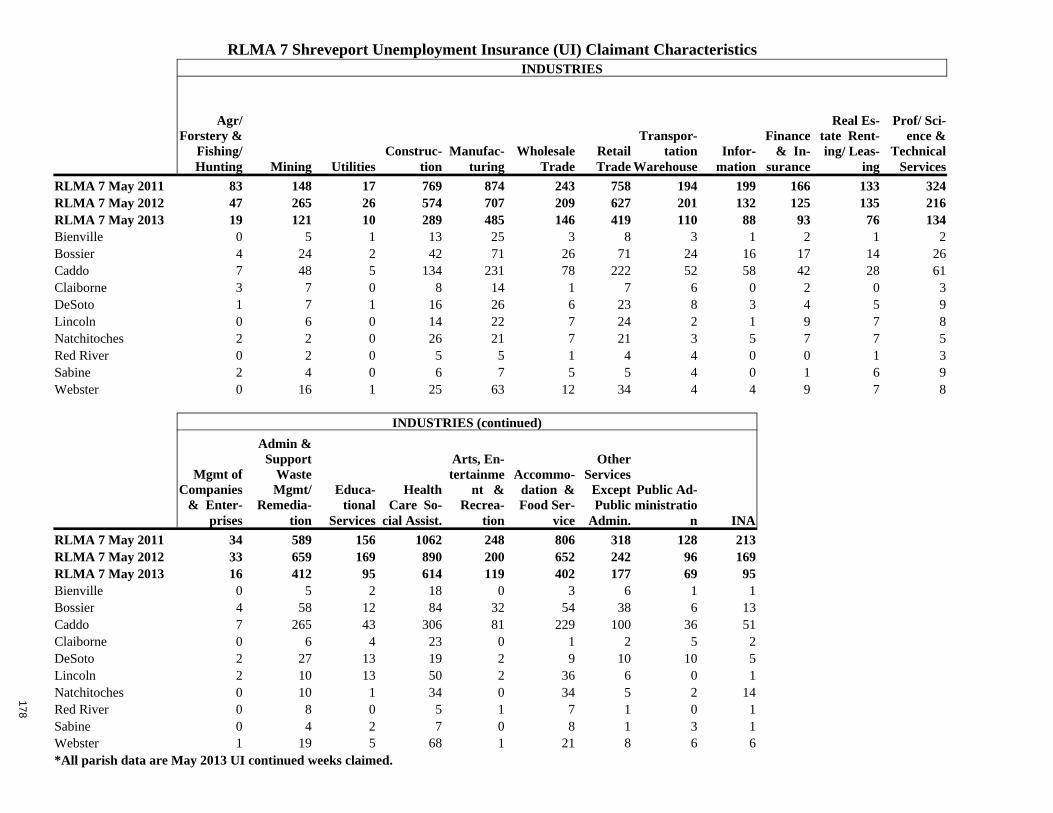
INDUSTRIES
Agr/Forstery &
Fishing/ Hunting Mining Utilities
Construc-tion
Manufac-turing
Wholesale Trade
Retail Trade
Transpor-tation
Warehouse Infor-mation
Finance & In-
surance
Real Es-tate Rent-ing/ Leas-
ing
Prof/ Sci-ence &
Technical Services
RLMA 7 May 2011 83 148 17 769 874 243 758 194 199 166 133 324 RLMA 7 May 2012 47 265 26 574 707 209 627 201 132 125 135 216 RLMA 7 May 2013 19 121 10 289 485 146 419 110 88 93 76 134 Bienville 0 5 1 13 25 3 8 3 1 2 1 2 Bossier 4 24 2 42 71 26 71 24 16 17 14 26 Caddo 7 48 5 134 231 78 222 52 58 42 28 61 Claiborne 3 7 0 8 14 1 7 6 0 2 0 3 DeSoto 1 7 1 16 26 6 23 8 3 4 5 9 Lincoln 0 6 0 14 22 7 24 2 1 9 7 8 Natchitoches 2 2 0 26 21 7 21 3 5 7 7 5 Red River 0 2 0 5 5 1 4 4 0 0 1 3 Sabine 2 4 0 6 7 5 5 4 0 1 6 9 Webster 0 16 1 25 63 12 34 4 4 9 7 8
INDUSTRIES (continued)
Mgmt of Companies
& Enter-prises
Admin & Support
Waste Mgmt/
Remedia-tion
Educa-tional
Services
Health Care So-
cial Assist.
Arts, En-tertainme
nt & Recrea-
tion
Accommo-dation & Food Ser-
vice
Other Services
Except Public
Admin.
Public Ad-ministratio
n INA RLMA 7 May 2011 34 589 156 1062 248 806 318 128 213 RLMA 7 May 2012 33 659 169 890 200 652 242 96 169 RLMA 7 May 2013 16 412 95 614 119 402 177 69 95 Bienville 0 5 2 18 0 3 6 1 1 Bossier 4 58 12 84 32 54 38 6 13 Caddo 7 265 43 306 81 229 100 36 51 Claiborne 0 6 4 23 0 1 2 5 2 DeSoto 2 27 13 19 2 9 10 10 5 Lincoln 2 10 13 50 2 36 6 0 1 Natchitoches 0 10 1 34 0 34 5 2 14 Red River 0 8 0 5 1 7 1 0 1 Sabine 0 4 2 7 0 8 1 3 1 Webster 1 19 5 68 1 21 8 6 6 *All parish data are May 2013 UI continued weeks claimed.
RLMA 7 Shreveport Unemployment Insurance (UI) Claimant Characteristics
178
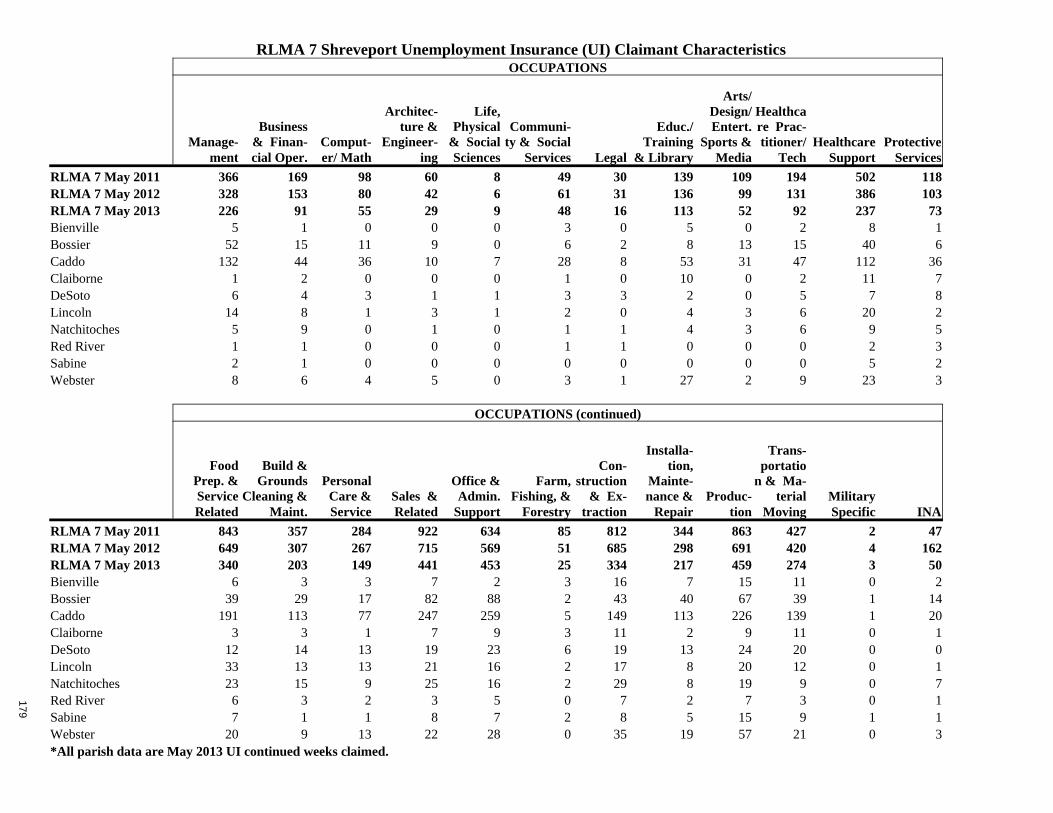
OCCUPATIONS
Manage-
ment
Business & Finan-cial Oper.
Comput-er/ Math
Architec-ture &
Engineer-ing
Life, Physical
& Social Sciences
Communi-ty & Social
Services Legal
Educ./ Training
& Library
Arts/ Design/ Entert.
Sports & Media
Healthcare Prac-titioner/
Tech Healthcare
Support Protective
Services
RLMA 7 May 2011 366 169 98 60 8 49 30 139 109 194 502 118 RLMA 7 May 2012 328 153 80 42 6 61 31 136 99 131 386 103 RLMA 7 May 2013 226 91 55 29 9 48 16 113 52 92 237 73 Bienville 5 1 0 0 0 3 0 5 0 2 8 1 Bossier 52 15 11 9 0 6 2 8 13 15 40 6 Caddo 132 44 36 10 7 28 8 53 31 47 112 36 Claiborne 1 2 0 0 0 1 0 10 0 2 11 7 DeSoto 6 4 3 1 1 3 3 2 0 5 7 8 Lincoln 14 8 1 3 1 2 0 4 3 6 20 2 Natchitoches 5 9 0 1 0 1 1 4 3 6 9 5 Red River 1 1 0 0 0 1 1 0 0 0 2 3 Sabine 2 1 0 0 0 0 0 0 0 0 5 2 Webster 8 6 4 5 0 3 1 27 2 9 23 3
OCCUPATIONS (continued)
Food Prep. & Service Related
Build & Grounds
Cleaning & Maint.
Personal Care & Service
Sales & Related
Office & Admin.
Support
Farm, Fishing, &
Forestry
Con-struction
& Ex-traction
Installa-tion,
Mainte-nance &
Repair Produc-
tion
Trans-portatio
n & Ma-terial
Moving Military Specific INA
RLMA 7 May 2011 843 357 284 922 634 85 812 344 863 427 2 47 RLMA 7 May 2012 649 307 267 715 569 51 685 298 691 420 4 162 RLMA 7 May 2013 340 203 149 441 453 25 334 217 459 274 3 50 Bienville 6 3 3 7 2 3 16 7 15 11 0 2 Bossier 39 29 17 82 88 2 43 40 67 39 1 14 Caddo 191 113 77 247 259 5 149 113 226 139 1 20 Claiborne 3 3 1 7 9 3 11 2 9 11 0 1 DeSoto 12 14 13 19 23 6 19 13 24 20 0 0 Lincoln 33 13 13 21 16 2 17 8 20 12 0 1 Natchitoches 23 15 9 25 16 2 29 8 19 9 0 7 Red River 6 3 2 3 5 0 7 2 7 3 0 1 Sabine 7 1 1 8 7 2 8 5 15 9 1 1 Webster 20 9 13 22 28 0 35 19 57 21 0 3 *All parish data are May 2013 UI continued weeks claimed.
RLMA 7 Shreveport Unemployment Insurance (UI) Claimant Characteristics
179
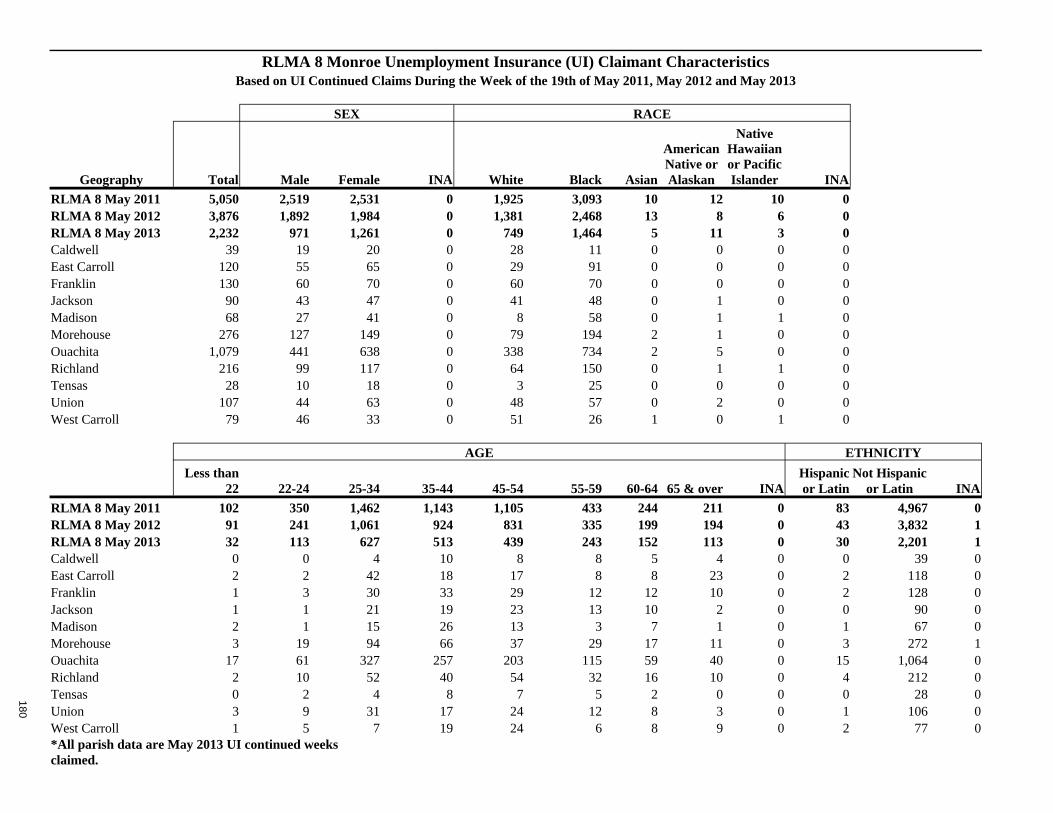
Based on UI Continued Claims During the Week of the 19th of May 2011, May 2012 and May 2013
SEX RACE
Geography Total Male Female INA White Black Asian
American Native or Alaskan
Native Hawaiian or Pacific Islander INA
RLMA 8 May 2011 5,050 2,519 2,531 0 1,925 3,093 10 12 10 0 RLMA 8 May 2012 3,876 1,892 1,984 0 1,381 2,468 13 8 6 0 RLMA 8 May 2013 2,232 971 1,261 0 749 1,464 5 11 3 0 Caldwell 39 19 20 0 28 11 0 0 0 0 East Carroll 120 55 65 0 29 91 0 0 0 0 Franklin 130 60 70 0 60 70 0 0 0 0 Jackson 90 43 47 0 41 48 0 1 0 0 Madison 68 27 41 0 8 58 0 1 1 0 Morehouse 276 127 149 0 79 194 2 1 0 0 Ouachita 1,079 441 638 0 338 734 2 5 0 0 Richland 216 99 117 0 64 150 0 1 1 0 Tensas 28 10 18 0 3 25 0 0 0 0 Union 107 44 63 0 48 57 0 2 0 0 West Carroll 79 46 33 0 51 26 1 0 1 0
AGE ETHNICITY
Less than
22 22-24 25-34 35-44 45-54 55-59 60-64 65 & over INA Hispanic or Latin
Not Hispanic or Latin INA
RLMA 8 May 2011 102 350 1,462 1,143 1,105 433 244 211 0 83 4,967 0 RLMA 8 May 2012 91 241 1,061 924 831 335 199 194 0 43 3,832 1 RLMA 8 May 2013 32 113 627 513 439 243 152 113 0 30 2,201 1 Caldwell 0 0 4 10 8 8 5 4 0 0 39 0 East Carroll 2 2 42 18 17 8 8 23 0 2 118 0 Franklin 1 3 30 33 29 12 12 10 0 2 128 0 Jackson 1 1 21 19 23 13 10 2 0 0 90 0 Madison 2 1 15 26 13 3 7 1 0 1 67 0 Morehouse 3 19 94 66 37 29 17 11 0 3 272 1 Ouachita 17 61 327 257 203 115 59 40 0 15 1,064 0 Richland 2 10 52 40 54 32 16 10 0 4 212 0 Tensas 0 2 4 8 7 5 2 0 0 0 28 0 Union 3 9 31 17 24 12 8 3 0 1 106 0 West Carroll 1 5 7 19 24 6 8 9 0 2 77 0 *All parish data are May 2013 UI continued weeks claimed.
RLMA 8 Monroe Unemployment Insurance (UI) Claimant Characteristics
180
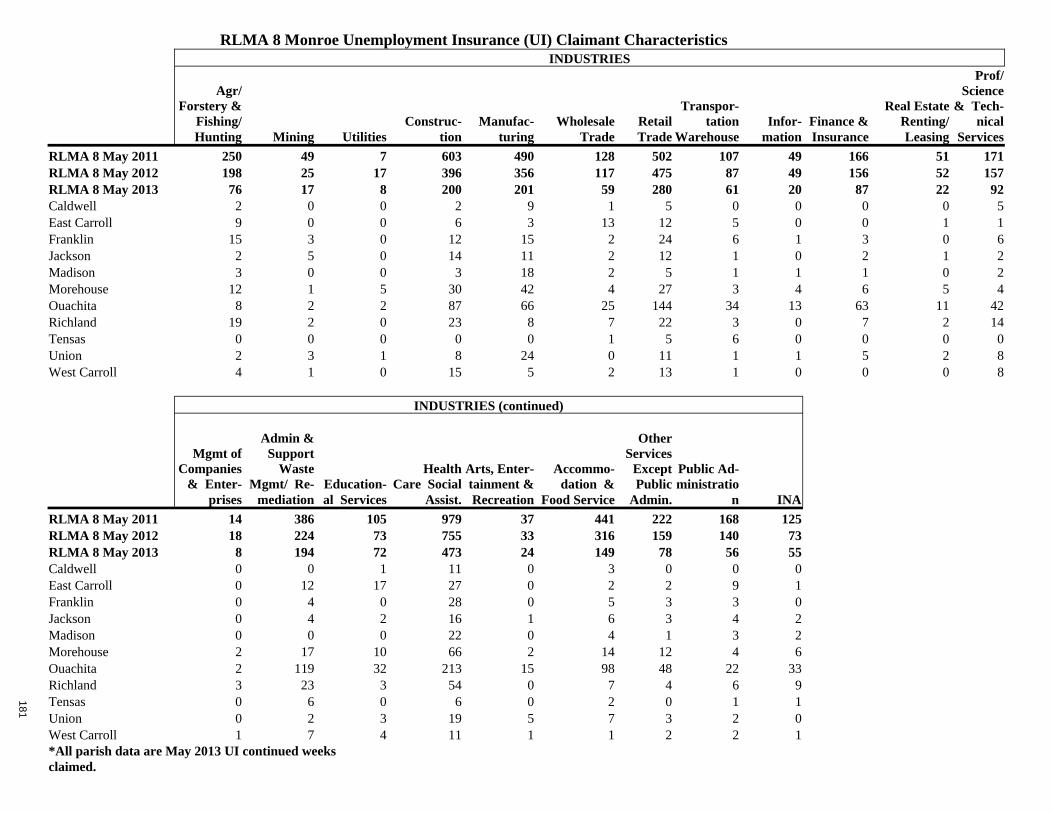
INDUSTRIES
Agr/Forstery &
Fishing/ Hunting Mining Utilities
Construc-tion
Manufac-turing
Wholesale Trade
Retail Trade
Transpor-tation
Warehouse Infor-mation
Finance & Insurance
Real Estate Renting/ Leasing
Prof/ Science
& Tech-nical
Services
RLMA 8 May 2011 250 49 7 603 490 128 502 107 49 166 51 171 RLMA 8 May 2012 198 25 17 396 356 117 475 87 49 156 52 157 RLMA 8 May 2013 76 17 8 200 201 59 280 61 20 87 22 92 Caldwell 2 0 0 2 9 1 5 0 0 0 0 5 East Carroll 9 0 0 6 3 13 12 5 0 0 1 1 Franklin 15 3 0 12 15 2 24 6 1 3 0 6 Jackson 2 5 0 14 11 2 12 1 0 2 1 2 Madison 3 0 0 3 18 2 5 1 1 1 0 2 Morehouse 12 1 5 30 42 4 27 3 4 6 5 4 Ouachita 8 2 2 87 66 25 144 34 13 63 11 42 Richland 19 2 0 23 8 7 22 3 0 7 2 14 Tensas 0 0 0 0 0 1 5 6 0 0 0 0 Union 2 3 1 8 24 0 11 1 1 5 2 8 West Carroll 4 1 0 15 5 2 13 1 0 0 0 8
INDUSTRIES (continued)
Mgmt of Companies
& Enter-prises
Admin & Support
Waste Mgmt/ Re-
mediation Education-al Services
Health Care Social
Assist.
Arts, Enter-tainment & Recreation
Accommo-dation &
Food Service
Other Services
Except Public
Admin.
Public Ad-ministratio
n INA RLMA 8 May 2011 14 386 105 979 37 441 222 168 125 RLMA 8 May 2012 18 224 73 755 33 316 159 140 73 RLMA 8 May 2013 8 194 72 473 24 149 78 56 55 Caldwell 0 0 1 11 0 3 0 0 0 East Carroll 0 12 17 27 0 2 2 9 1 Franklin 0 4 0 28 0 5 3 3 0 Jackson 0 4 2 16 1 6 3 4 2 Madison 0 0 0 22 0 4 1 3 2 Morehouse 2 17 10 66 2 14 12 4 6 Ouachita 2 119 32 213 15 98 48 22 33 Richland 3 23 3 54 0 7 4 6 9 Tensas 0 6 0 6 0 2 0 1 1 Union 0 2 3 19 5 7 3 2 0 West Carroll 1 7 4 11 1 1 2 2 1 *All parish data are May 2013 UI continued weeks claimed.
RLMA 8 Monroe Unemployment Insurance (UI) Claimant Characteristics
181
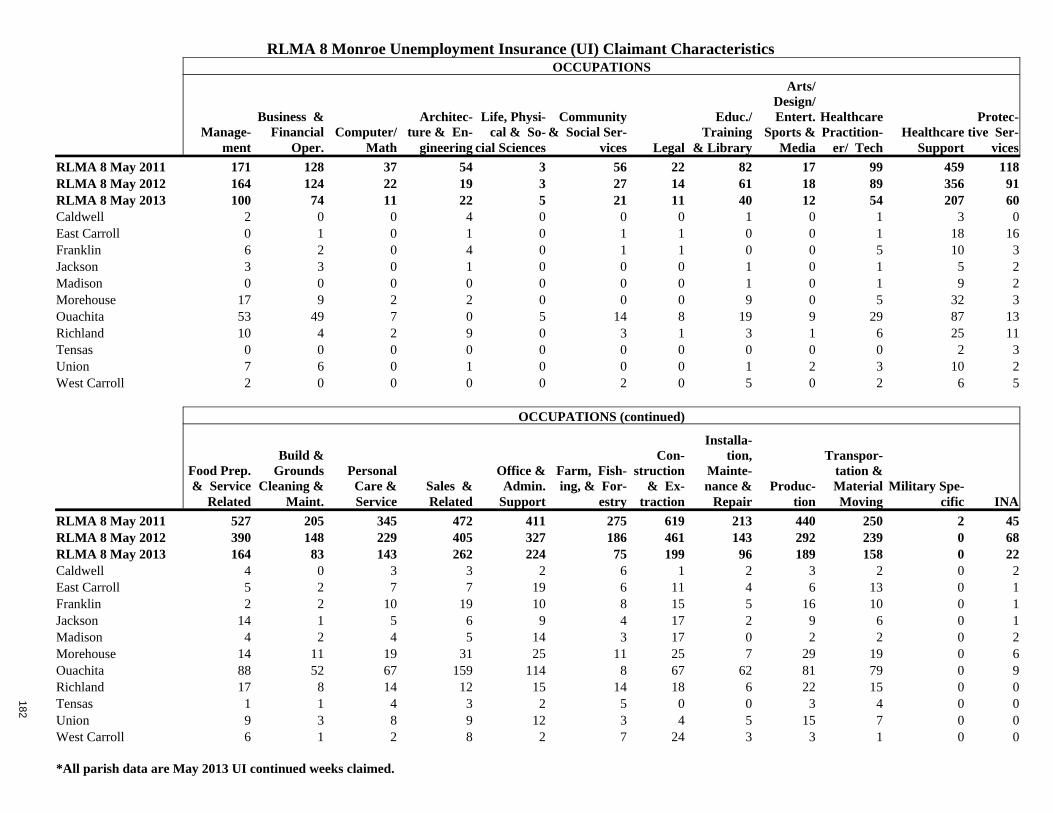
OCCUPATIONS
Manage-
ment
Business & Financial
Oper. Computer/
Math
Architec-ture & En-
gineering
Life, Physi-cal & So-
cial Sciences
Community & Social Ser-
vices Legal
Educ./ Training
& Library
Arts/ Design/ Entert.
Sports & Media
Healthcare Practition-
er/ Tech Healthcare
Support
Protec-tive Ser-
vices
RLMA 8 May 2011 171 128 37 54 3 56 22 82 17 99 459 118 RLMA 8 May 2012 164 124 22 19 3 27 14 61 18 89 356 91 RLMA 8 May 2013 100 74 11 22 5 21 11 40 12 54 207 60 Caldwell 2 0 0 4 0 0 0 1 0 1 3 0 East Carroll 0 1 0 1 0 1 1 0 0 1 18 16 Franklin 6 2 0 4 0 1 1 0 0 5 10 3 Jackson 3 3 0 1 0 0 0 1 0 1 5 2 Madison 0 0 0 0 0 0 0 1 0 1 9 2 Morehouse 17 9 2 2 0 0 0 9 0 5 32 3 Ouachita 53 49 7 0 5 14 8 19 9 29 87 13 Richland 10 4 2 9 0 3 1 3 1 6 25 11 Tensas 0 0 0 0 0 0 0 0 0 0 2 3 Union 7 6 0 1 0 0 0 1 2 3 10 2 West Carroll 2 0 0 0 0 2 0 5 0 2 6 5
OCCUPATIONS (continued)
Food Prep. & Service
Related
Build & Grounds
Cleaning & Maint.
Personal Care & Service
Sales & Related
Office & Admin.
Support
Farm, Fish-ing, & For-
estry
Con-struction
& Ex-traction
Installa-tion,
Mainte-nance &
Repair Produc-
tion
Transpor-tation & Material Moving
Military Spe-cific INA
RLMA 8 May 2011 527 205 345 472 411 275 619 213 440 250 2 45 RLMA 8 May 2012 390 148 229 405 327 186 461 143 292 239 0 68 RLMA 8 May 2013 164 83 143 262 224 75 199 96 189 158 0 22 Caldwell 4 0 3 3 2 6 1 2 3 2 0 2 East Carroll 5 2 7 7 19 6 11 4 6 13 0 1 Franklin 2 2 10 19 10 8 15 5 16 10 0 1 Jackson 14 1 5 6 9 4 17 2 9 6 0 1 Madison 4 2 4 5 14 3 17 0 2 2 0 2 Morehouse 14 11 19 31 25 11 25 7 29 19 0 6 Ouachita 88 52 67 159 114 8 67 62 81 79 0 9 Richland 17 8 14 12 15 14 18 6 22 15 0 0 Tensas 1 1 4 3 2 5 0 0 3 4 0 0 Union 9 3 8 9 12 3 4 5 15 7 0 0 West Carroll 6 1 2 8 2 7 24 3 3 1 0 0
*All parish data are May 2013 UI continued weeks claimed.
RLMA 8 Monroe Unemployment Insurance (UI) Claimant Characteristics
182

Louisiana Workforce Information Review 2014 129
Sachin ChintawarLabor Market Specialist Manager Mark JonesCES and QCEW Programs Supervisor Sean PainterLabor Market Specialist Paul VeazeyLabor Market Specialist Ryan ReynoldsLabor Market Specialist Jonathan HelisLabor Market Economic Research Analyst Karen ClarkLabor Market Specialist Knox HutchinsonLabor Market Specialist
Contributors