Embed Size (px)
Citation preview

1
Toktrapport/Havforskningsinstituttet/ISSN 1503 6294/Nr. 10 – 2016
Working Document to
ICES Working Group on Widely Distributed Stocks (WGWIDE), AZTI-
Tecnalia, Pasaia, Spain, 25 – 31 August 2015
Cruise report from the International Ecosystem Summer Survey in the Nordic Seas (IESSNS) with M/V ”Brennholm”,
M/V “Eros”, M/V “Christian í Grótinum” and R/V “Árni Friðriksson”, 1 July - 10 August 2015
Leif Nøttestad, Valantine Anthonypillai, Øyvind Tangen, Kjell Rong Utne
Institute of Marine Research, Bergen, Norway
Guðmundur J. Óskarsson, Sigurður Þór Jónsson
Marine Research Institute, Reykjavik, Iceland
Eydna í Homrum, Leon Smith, Jan Arge Jacobsen
Faroe Marine Research Institute, Tórshavn, Faroe Islands
Teunis Jansen
Greenland Institute of Natural Resources, Nuuk, Greenland

2
Toktrapport/Havforskningsinstituttet/ISSN 1503 6294/Nr. 10 – 2016
Executive summary........................................................................................................ 3
Introduction .................................................................................................................... 4
Material and methods.................................................................................................... 5
Hydrography and Zooplankton ....................................................................... 6
Trawl sampling ................................................................................................... 6
Underwater camera observations during trawling........................................ 8
Acoustics .............................................................................................................. 9
Swept area index and biomass estimation .................................................... 12
Results............................................................................................................................ 14
Hydrography..................................................................................................... 14
Zooplankton ...................................................................................................... 19
Pelagic fish species............................................................................................ 20
Mackerel ............................................................................................................................................. 20
Multibeam sonar recordings ........................................................................................................... 29
Norwegian spring-spawning herring ........................................................................................... . 30
Discussion ..................................................................................................................... 35
Recommendations ........................................................................................................ 38
General recommendations............................................................................................................... 38
Survey participants ...................................................................................................... 38
Acknowledgements ..................................................................................................... 39
References...................................................................................................................... 40
Annex 1 .................................................................................................................................................. 41
Swept area biomass estimates in exclusive economical zones (EEZs)....... 41
Annex 2 .......................................................................................................................... 42
Comparing "banana" and "straight forward" towing for mackerel Error! Bookmark not
defined.
Annex 3 .......................................................................................................................... 46
Swept area biomass estimates of mackerel using StoX................................ 46

3
Toktrapport/Havforskningsinstituttet/ISSN 1503 6294/Nr. 10 – 2016
E x e c u t i v e s u m m a r y
The international ecosystem summer survey in the Nordic Seas (IESSNS) was performed during 1 July to 10
August 2015 on four vessels from Norway (2), Iceland (1) and Faroes (1). Greenland chartered the Icelandic
vessel for 12 days to cover the East Greenland area. A standardised pelagic trawl swept area method was
used to obtain abundance indices and study the spatial distribution NEA mackerel in relation to other
pelagic fish stocks, ecological and environmental factors in the Nordic Seas as in recent years. One of the
main objectives is to provide age-disaggregated abundance indices on an annual basis with uncertainty
estimates for NEA mackerel applicable as a tuning series in the stock assessment.
The total swept area biomass index of NEA mackerel in summer 2015 was 7.7 million tonnes distributed
over an area of 2.7 million square kilometres in the Nordic Seas. The estimate in 2015 is 1.3 million tonnes
lower than in 2014 (9.0 million tonnes), when it was distributed over an area of 2.4 million square
kilometres. The 2011-year class contributed with 28% of numbers followed by the 2010-year class with 22%.
The 2012 year class had 12% in number. Altogether 71% of the estimated number of mackerel was less than
6 years old. The internal consistency plot for age-disaggregated year classes has improved since the
benchmark in 2014 by the inclusion of two more survey years. This is especially apparent for younger ages.
There is now good internal consistency for 1-10 years old mackerel, except between age 5 and 6.
Mackerel was observed in most of the surveyed area, and the zero boundaries were found in the large
majority of areas. The mackerel had a more patchy distribution in July-August 2015 based on the trawl
catches compared to previous years. The mackerel were also present in smaller quantities in the
northernmost and westernmost regions of the surveyed area compared to the last few years.
Norwegian spring-spawning (NSS) herring was measured acoustically during the survey and the
abundance index of age 4+ came to 22.7 billions, which is comparable to the May survey index in 2015 of
20.3 billions. The 2004, 2005 and 2009 year classes were most abundant in the survey. The NSS herring was
mainly found north of the Faroe Islands and to the east and north off Iceland. Small concentrations were
found in the northern and eastern areas, while herring had low concentrations in the central part of the
Norwegian Sea.
The spatio-temporal overlap between NEA mackerel and NSS herring in July-August 2015 was highest in
the south-eastern, southern and south-western part of the Norwegian Sea. Herring was most densely
aggregated in areas where zooplankton concentrations where high compared to other regions. Mackerel, on
the other hand, was distributed in most of the surveyed area, and in areas with more varying zooplankton
concentrations.
Blue whiting was not prioritized during this IESSNS survey, hence no trawling was conducted on acoustic
registrations of blue whiting. Additionally, acoustic registrations were limited to the upper 200 m in part of
the survey area. Thus the results of the survey can neither be used to quantify nor map the distribution of
blue whiting in the Nordic Seas in the summer 2015.
Lumpfish of all sizes were caught in the upper 30 m of the water column practically distributed everywhere
within the total surveyed area. North Atlantic salmon, represented as postsmolt, grilse and adults, were
mainly caught in central part of the Norwegian Sea during the IESSNS survey.
The SST in July-August 2015 was 1-2°C colder compared to 2014 throughout the surveyed area. The SST
was close to the long term average for the last 20 years. This is in contrast to the generally increasing SST
observed during last decade for most of the area, particularly in the Irminger Sea area.
The average concentration of zooplankton in the Norwegian Sea in July-August 2015 was slightly lower
than in 2014, or 7.2 g/m2 compared to 8.1 g/m2 in 2014. West and south of Iceland and in east Greenlandic
waters the average concentrations were higher than in 2014.
4
Toktrapport/Havforskningsinstituttet/ISSN 1503 6294/Nr. 10 – 2016
Dedicated whale observations (North Atlantic Sighting Survey (NASS)) were performed on the Icelandic
vessel for the entire survey. These data are not available yet. Opportunistic whale observations were done
by the two Norwegian vessels during the survey. Higher densities of especially fin whales, humpback
whales and white beaked dolphins were observed off the coast of Finnmark and into the southern part of
the Barents Sea.
I n t r o d u c t i o n
In July-August 2015, four vessels; the chartered trawler/purse seiners M/V “Brennholm” and M/V “Eros”
from Norway, and M/V “Christian í Grótinum” from Faroe Islands, and the research vessel R/V “Árni
Friðriksson” from Iceland, participated in the joint ecosystem survey (IESSNS) in the Norwegian Sea and
surrounding waters. The vessel M/V “Birtingur” from Iceland had been chartered to participate on the
IESSNS survey on behalf of Greenland, and cover part of Greenland waters in the western regions, but due
to engine breakdown at the start of the survey it was not possible for “Birtingur” to participate. “Árni
Friðriksson” then had to take over and conduct six of the planned stations in Greenland waters appointed
initially to M/V “Birtingur”. The five week coordinated survey from 1st of July to 10th of August 2015 is part
of a long-term project to annually collect data on abundance, distribution, aggregation, migration and
ecology of northeast Atlantic mackerel (Scomber scombrus) and other major pelagic species. Major aims of
the survey were to quantify abundance, spatio-temporal distribution, aggregation and feeding ecology of
Northeast Atlantic mackerel in relation to distribution of other pelagic fish species such as Norwegian
spring-spawning herring (Clupea harengus), oceanographic conditions and prey communities. Dedicated
whale observations were conducted on the Icelandic research vessel as part of the 2015 North Atlantic
Sighting Survey. Opportunistic whale observations were conducted on the Norwegian vessels in order to
collect data on distribution and aggregation of marine mammals in relation to potential prey species and
the physical environment. The pelagic trawl survey was initiated by Norway in the Norwegian Sea in the
beginning of the 1990s. Faroe Islands and Iceland participated in the joint mackerel -ecosystem survey since
2009.
The main objective of the IESSNS survey in relation to quantitative assessment is to provide reliable a nd
consistent age-disaggregated abundance indices of NEA mackerel. WKPELA meeting was held in ICES HQ
in Copenhagen from the 21-27 February 2014, to benchmark the assessment of mackerel in the Northeast
Atlantic. In the case of NEA mackerel the previous assessment was not considered to give a reliable
estimate of the development of the stock, and this assessment was limited by lack of independent age-
structured indices. There was an agreement during the benchmark meeting to include age-structured
indices on adults from the IESSNS swept-area trawl survey. It was decided back then that an age-
disaggregated time-series for analytical assessment should be restricted to adult mackerel at age 6 years and
older. New data and results from the IESSNS mackerel-ecosystem surveys in July-August 2014 and 2015
providing a longer time series (2007, 2010-2015) used for swept area abundance estimation on NEA
mackerel. In addition, methodological and statistical changes and improvements in the survey design, age -
disaggregated abundance estimations on the total biomass and on different age-groups including
uncertainty estimates have improved the quality and consistency of the NEA mackerel abundance
estimation. A manuscript entitled “Quantifying changes in abundance, biomass and spatial distribution of
Northeast Atlantic (NEA) mackerel (Scomber scombrus) in the Nordic Seas from 2007 to 2014”, based on
swept area data and results from IESSNS surveys has been accepted for publication in ICES Journal of
Marine Science. A preliminary run estimating the abundance of NEA mackerel by swept area analyses
using the newly developed software program StoX was conducted by scientists at the Institute of Marine
Research in Norway. A direct comparison between socalled “banana shape” (curved) pel agic trawl towing
at the surface and “straight forward” trawl towing where performed in Norwegian, Icelandic and
Greenland waters during the IESSNS survey in July-August 2015.
The Norwegian Spring Spawning (NSS) herring, in addition to other herring populations within the survey
area, were mapped using acoustic methodology including standardized line transects. NSS herring was

5
Toktrapport/Havforskningsinstituttet/ISSN 1503 6294/Nr. 10 – 2016
scrutinized using the primary echosounder frequency of 38 kHz. The abundance estimation on NSS herring
was conducted using the program Beam in similar way as conducted during the International Ecosystem
Spring Survey in the Nordic Sea (IESNS) in May-June 2015. It must be noted that even if the IESSNS covers
the spatial distribution of blue whiting adequately very few deep trawl hauls were taken on likely acoustic
registrations of blue whiting and acoustic registrations deeper than 200 m were not scrutinized in part of
the survey area. Thus, the results of the survey can neither be used to quantify, nor map the distribution of
blue whiting in the Nordic Seas in the summer 2015. This situation is similar as for the IESSNS in the
summer 2014.
M a t e r i a l a n d m e t h o d s
Coordination of the survey was done during an international meeting in Reykjavik, Iceland in April 2015
and by correspondence in spring and summer 2015. The participating vessels together with their effective
survey periods are listed in Table 1. One additional ship, M/S Birtingur was chartered, staffed and equipped
by the Greenlandic Institute of Natural Resources. However, the engine of M/S Birtingur failed and the ship
had to abort the survey. This led to less survey effort in SW Greenland and western international waters
than planned.
In general, the weather conditions were calm with good survey conditions on the Norwegian vessels
“Brennholm” and “Eros” for oceanographic monitoring, plankton sampling, acoustic registrations and
pelagic trawling. Nevertheless some days onboard Brennholm and Eros had somewhat unfavourable
conditions, although not hampering any scientific activities. The same was the case on the Faroese vessel
“Christian í Grótinum” which experienced good weather conditions except for two days. “Árni
Friðriksson” also experienced some windy days, in the southern part of Iceland in the beginning of the
survey, but the adverse conditions did not affect the quality of the various scientific data collected during
the survey to any extent.
During the survey the special designed pelagic trawl, Multpelt 832, was used by all four participating
vessels for the fourth consecutive year. This trawl is a product of cooperation between participating
institutes in designing and constructing a standardized sampling trawl for the IESSNS. The work was lead
by trawl gear scientist John Willy Valdemarsen, Institute of Marine Research (IMR), Bergen, Norway, and
has been in good progress and improved steadily for five years now. The design of the trawl was finalized
during meetings of fishing gear experts and skippers at meetings in January and May 2011. Further
discussions on modifications in standardization between the rigging and operation of Multpelt 832 was
done during a trawl expert meeting in Copenhagen 17-18 August 2012, in parallel with the post-cruise
meeting for the joint ecosystem survey, and then at the WKNAMMM workshop and tank experiments on a
prototype (1:32) of the Multpelt 832 pelagic trawl, conducted as a sequence of trials in Hirtshals, Denmark
from 26 to 28 February 2013 (ICES 2013a). The swept area methodology was also presented and discussed
during the WGISDAA workshop in Dublin, Ireland in May 2013 (ICES 2013b). The standardization and
quantification of catchability from the Multpelt 832 pelagic trawl was further discussed during the mackerel
benchmark in Copenhagen in February 2014. Recommendations and requests coming out of the mackerel
benchmark have further been implemented and improved on all the four vessels involved during the
IESSNS survey in July-August 2014 and in July-August 2015. Working documents and scientific
manuscripts have been written on swept area abundance estimation of NEA mackerel, survey design as
well as standardization and improvements on the survey methodology based on the pelagic trawling with
the Multpelt 832 sampling trawl (Nøttestad et al. accepted for publication in ICES Journal of Marine
Science).

6
Toktrapport/Havforskningsinstituttet/ISSN 1503 6294/Nr. 10 – 2016
Table 1. Survey effort by each of the four vessels in the IESSNS survey in 2015.
Vessel Effective survey Length of cruise Trawl stations CTD stations Plankton stations
period track (nmi)
Árni Friðriksson 6/7-10/8 7166 92 92 92
Christian í Grótinum 3/7- 19/7 2969 43 40 40
Brennholm 3/7-28/7 4395 52 52 52
Eros 1/7-28/7 4511 48 47 47
Total 2/7-12/8 16072 282 281 272
Hydrography and Zooplankton
The hydrographical and plankton stations by all vessels combined are shown in Figure 2. Árni Friðriks son
was equipped with a SEABIRD CTD sensor with a water rosette that was applied during the entire cruise.
Christian í Grótinum was equipped with a mini SEABIRD SBE 25+ CTD sensor, and Brennholm and Eros
were equipped with SEABIRD CTD sensors. The CTD-sensors were used for recording temperature,
salinity and pressure (depth) from the surface down to 500 m, or to the bottom when at shallower depths.
All vessels collected and recorded also oceanographic data from the surface either applying a
thermosalinograph (temperature and salinity) placed at approximately 6 m depth underneath the surface or
a thermograph logging temperatures continuously near the surface throughout the survey.
Zooplankton was sampled with a WP2-net on all vessels. Mesh sizes were 180 µm (Brennholm and Eros)
and 200 µm (Árni Friðriksson and Christian í Grótinum). The net was hauled vertically from a depth of 200
m (or bottom depth at shallower stations) to the surface at a speed of 0.5 m/s. All samples were split in two,
one half preserved for species identification and enumeration, and the other half dried and weighed.
Detailed description of the zooplankton and CTD sampling is provided in the survey manual (ICES 2014b).
This year, it was possible to take all planned CTD and plankton stations. The number of stations taken by
the different vessels is provided in Table 1.
Light measurements were done during all trawl hauls. These data have not yet been analysed and therefore
the results are not presented in this report, but will be reported later.
Trawl sampling
Trawl catches were sorted and weighed; fish were identified to species level, when possible, and other taxa
to higher taxonomic levels. The full biological sampling at each trawl station varied between nations and is
presented in Table 2. On Christian í Grótinum, trawl catches were sub-sampled - 100 kg (if it was clean
catch of either herring or mackerel) to 200 kg (if it was a mixture of herring and mackerel); otherwise the
same sample processing protocol was followed as on the other three vessels.
All vessels used the Multpelt 832 pelagic trawl and continued and improved standardization of fishing gear
and deployment was emphasised in the survey (see ICES 2013a; ICES 2014c; Valdemarsen et al. (submitted
manuscript); Rosen et al. (submitted manuscript)). Standardization and documentation/quantification of
effective trawl width trawl depth and catch efficiency was improved according to requests during the
mackerel benchmark (ICES 2014c). The most important properties of the Multpelt 832 trawls and their
rigging during operation on the survey for participating vessels are given in Table 3.

7
Toktrapport/Havforskningsinstituttet/ISSN 1503 6294/Nr. 10 – 2016
Table 2. Summary of biological sampling in the survey from 1July – 10 August 2015 by the four
participating countries. Numbers denote the maximum number of individuals sampled for each species for
the different determinations.
Species Faroes Iceland Norway
Length measurements Mackerel 200/100* 150 100
Herring 200/100* 200 100
Blue whiting 200/100* 50 100
Other fish sp. 0 50 25
Weighed, sexed and maturity determination Mackerel 20 50 25
Herring 20 50 25
Blue whiting 50 50 25
Other fish sp. 0 10 0
Otoliths/scales collected Mackerel 20 25 25
Herring 20 50 25
Blue whiting 50 50 25
Other fish sp. 0 0 0
Stomach sampling Mackerel 10 10 10
Herring 10 10 10
Blue whiting 10 10 10
Other fish sp. 0 0 10
Tissue for genotyping Mackerel 0 350 900
Herring 50 50
*200 length measurements. 100 are also weighed
Table 3. Trawl settings and operation details during the international mackerel survey in the Nordic Seas in
July-August 2015. The column for influence indicates observed differences between vessels likely to
influence performance. Influence is categorized as 0 (no influence) and + (some influence).
Properties Brennholm Árni Friðriksson Eros Christian í Grótinum Influence
Trawl producer Egersund Trawl AS Tornet/Hampiðjan
(50:50)
Egersund Trawl AS Vónin 0
Warp in front of doors Dyneema – 32 mm Dynex-34 mm Dyneema -32 mm Dynema – 34mm +
Warp length during
towing
350 m 350 m 350 m 350 m 0
Difference in warp
length port/starboard
0-4 m 3-12 m 0-4 m 5-12 m 0
Weight at the lower
wing ends
400 kg 170 kg 300 kg 400kgSB 500kgPS 0
Setback in metres 6 m 6 m 6 m 6 m +
Type of trawl door Seaflex adjustable
hatches
Jupiter Seaflex adjustable
hatches
Injector F-15 0
Weight of traw door 2000 kg 2200 kg 1700 kg 2000 kg +
Area trawl door 9 m2 75% hatches
(effective 6.5m2)
7 m2 7.5 m2 25% hatches
(effective 6.5m2)
6 m2 +
Towing speed (GPS) in
knots
4.8 (4.5-5.2) 4.9 (3.4-5.4) 4.8 (4.5-5.2) 4.5 (3.3-5.3) +
Trawl height 28-35 27-30 29-35 36-52 +
Door distance 110-117 m 110-114 m 110-117 m 104-113 +
Trawl width* - - - - +
Turn radius 5-10 degrees turn 5-10 degrees turn 5-10 degrees turn 5-10 degrees turn +
A fish lock in front end
of cod-end
Yes Yes Yes Yes +
Trawl door depth (port
and starboard)
10-18, 10-17 m 8-13, 10-15 m 5-12, 7-14 m 5-15 m +
Headline depth 0-1 m 0-1 m 0-1 m 0-1 m +
Float arrangements on
the headline
Kite +2 buoys on
each wing
Kite + 2 buoys on
wings
Kite + 2 buoys on
each wingtip
Kite + 2 buoys on
wingtips
+
Weighing of catch All weighted All weighted All weighted All weighted +

8
Toktrapport/Havforskningsinstituttet/ISSN 1503 6294/Nr. 10 – 2016
Marine mammal observations
Dedicated whales observations were conducted onboard R/V “Árni Friðriksson” during the entire surveys
from 6th of July until 10th of August 2015. Opportunistic observations of marine mammals were conducted
by trained scientific personnel and crew members from the bridge between 1st and 28th of July 2015
onboard the Norwegian chartered vessels M/V “Brennholm” and M/V “Eros”, respectively. The priority
periods of observing were during the transport stretches from one trawl station to another. Observations
were done 24 h per day if the visibility was sufficient for marine mammal sightings. Digital filming and
photos were taken whenever possible on each registration from scientists onboard.
Underwater camera observations during trawling
All vessels employed an underwater video camera (GoPro HD Hero 3 Black Edition, www.gopro.com) or
high definition Sony camera in the trawl to observe mackerel behaviour during trawling. The camera was
put in a waterproof box which tolerated pressure down to approximately 100 m depth,
The goal of the video recordings was to observe and assess: individual and schooling behaviour,
escapement from the cod end and through meshes, patchiness and swimming performance of mackerel. No
light source was employed with cameras, hence, recordings were limited to day light hours. Video
recordings were collected at about 20 % of trawl stations onboard Brennholm and Eros. Onboard Christian í
Grótinum video recordings were collected at 15% of trawl stations and on a total of 15 trawl stations taken
by RV Árni Friðriksson. Analyses of the recording material are underway and will be presented by other
means when available.
Photo 1. GoPro camera inside a waterproof box, mounted on steel frame and ready for employment in trawl
on Finnur Fríði IESSNS 2014.

9
Toktrapport/Havforskningsinstituttet/ISSN 1503 6294/Nr. 10 – 2016
Photo 2. GoPro camera attached to inside of trawl by fish lock on Finnur Fríði IESSNS 2014. The steel frame
was tied to trawl, at each corner using rope.
Acoustics
Multifrequency echosounder
The acoustic equipment onboard Brennholm and Eros were calibrated 29th of June 2015 for 18, 38 and 200
kHz. Árni Friðriksson was also calibrated on 10th of April 2015 for the frequencies 18, 38, 120 and 200 kHz
and Christian í Grótinum was calibrated on 29-30th June 2015 for 38, 120 and 200 kHz prior to the cruise. All
vessels used standard hydro-acoustic calibration procedure for each operating frequency (Foote, 1987). CTD
measurements were taken in order to get the correct sound velocity as input to the echosounder calibration
settings.
Generally, acoustic recordings were scrutinized on daily basis using the softwares LSSS onboard Eros,
Brennholm and Árni Friðriksson, and Echoview onboard Christian í Grótinum. Species were identified and
partitioned using catch information, characteristic of the recordings, and frequency between integration on
38 kHz and on other frequencies by a scientist experienced in viewing echograms.
For acoustic abundance estimation of the NSS herring stock 38 kHz was used as the main frequency while it
was 200 kHz for the NEA mackerel. However, it has to be noted that acoustic data collected on macke rel
have substantial limitations as it is conducted now, due to different reasons, including the low target
strength of mackerel and the distribution of the majority of the mackerel in the acoustic dead zone
shallower than the face of the acoustic transducers with or without a drop keel installed in the hull. A
summary of acoustic settings is given in Table 4.
Acoustic estimates of herring were obtained during the surveys in a same way as e.g. done in the
International ecosystem survey in the Nordic Seas in May (ICES 2014a) and detailed in the manual for the
surveys (ICES 2014b).

10
Toktrapport/Havforskningsinstituttet/ISSN 1503 6294/Nr. 10 – 2016
Table 4. Acoustic instruments and settings for the primary frequency in the July/August survey in 2015.
M/V Brennholm R/V Árni Friðriksson M/V Eros M/V Chr. í Grótinum
Echo sounder Simrad EK60 Simrad EK 60 Simrad EK 60 Simrad EK 60
Frequency (kHz) 18, 38, 70, 120, 200 18, 38, 120, 200 18, 38, 70, 120, 38,120, 200
200 Primary transducer ES38B ES38B ES38B ES38B
Transducer installation Drop keel Drop keel Drop keel Hull
Transducer depth (m) 9 8 9 5
Upper integration limit (m) 15 15 15 12
Absorption coeff. (dB/km) 9.9 10 9.9 9.9
Pulse length (ms) 1.024 1.024 1.024 1.024
Band width (kHz) 2.43 2.425 2.425 2.43
Transmitter power (W) 2000 2000 2000 2000
Angle sensitivity (dB) 21.9 21.9 21.9 21.9
2-way beam angle (dB) -21.1 -20.9 -20.6 -20.7
TS Transducer gain (dB) 24.87 24.64 23.27 26.44
sA correction (dB) -0.60 -0.84 -0.65 -0.66
alongship: 6.89 7.31 7.01 7.07
athw. ship: 6.87 6.95 7.11 7.06
Maximum range (m) 500 500 (750 in Greenlandic
waters)
500 500
Post processing software LSSS LSSS LSSS Sonardata Echoview
6.x
Multibeam sonar
M/V “Brennholm” and M/V “Eros” were equipped with the Simrad fisheries sonars SX90 (frequency range:
111.5-115.5 kHz), with a scientific output incorporated which allow the storing of the beam data for post-
processing. One of the objectives in this survey was to continue the test of the software module “Processing
system for fisheries omni-directional sonar, PROFOS” in LSSS at the Institute of Marine Research in
Norway. The first test was done during the 2010 survey, and the basic processing was described in the
cruise report (Nøttestad et al., 2010). The PROFOS module is in a late development phase and for this
survey, functionalities for school enhancement by image processing techniques and for automatic school
detection have been incorporated (Nøttestad et al., 2012; 2013).
Acoustic doppler current profiler (ADCP)
M/V “Brennholm” are equipped with a scientific ADCP, RDI Ocean surveyor, operating at 75 kHz and/or
150 kHz. The data collected within large areas of the Norwegian coast, Norwegian Sea and southern part of
the Barents Sea during the survey will be quality checked and used for later analysis.
Cruise tracks
M/V “Brennholm”, M/V “Eros”, M/V “Chr. í Grótinum” and R/V “Árni Friðriksson” followed
predetermined survey lines with pre-selected surface trawl stations (Figure 1). An adaptive survey design
was also adopted although to a small extent, due to uncertain geographical distribution of our main pelagic
planktivorous schooling fish species. The main adaptation was in the Icelandic-south stratum where it was

11
Toktrapport/Havforskningsinstituttet/ISSN 1503 6294/Nr. 10 – 2016
extended southwards to determine the zero line of mackerel distribution. The cruising speed was between
10-12.0 knots if the weather permitted otherwise the cruising speed was adapted to the weather situation.
Figure 1. Cruise tracks showing the temporal progression from blue (2/7) to red (12/10) within the covered
areas of the Norwegian Sea and surrounding waters from 1st of July to 10th of August 2015.
12
Toktrapport/Havforskningsinstituttet/ISSN 1503 6294/Nr. 10 – 2016
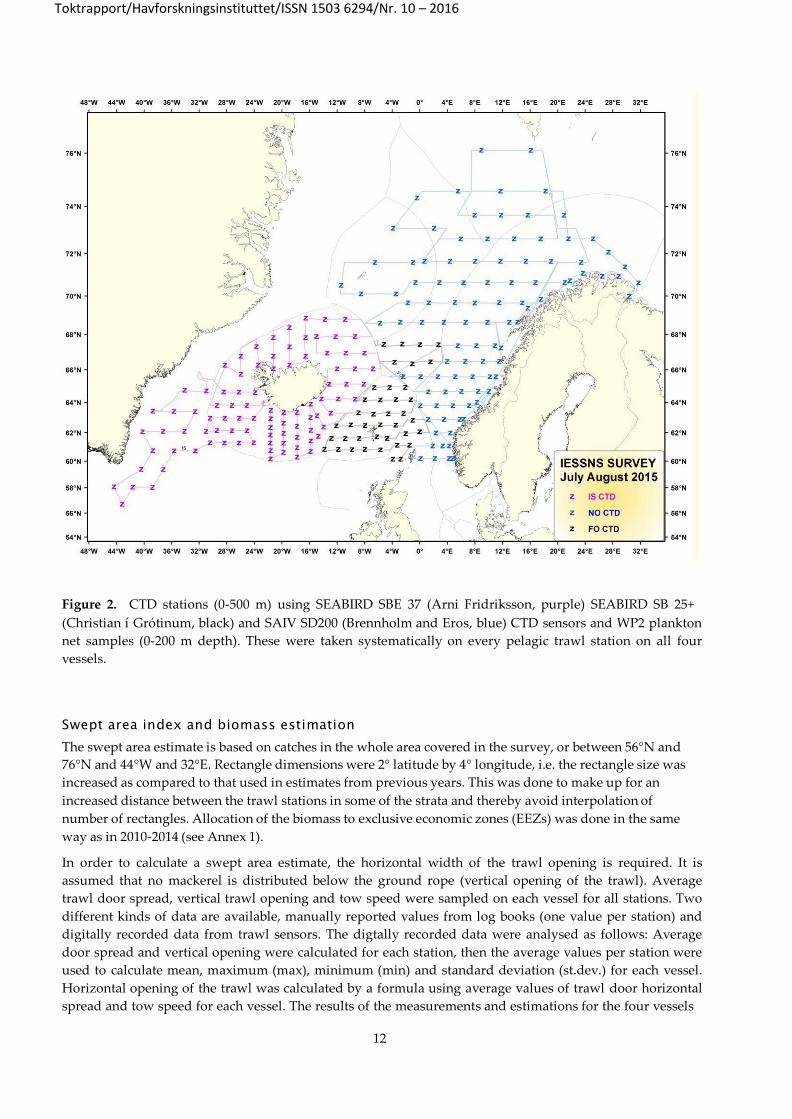
Figure 2. CTD stations (0-500 m) using SEABIRD SBE 37 (Arni Fridriksson, purple) SEABIRD SB 25+
(Christian í Grótinum, black) and SAIV SD200 (Brennholm and Eros, blue) CTD sensors and WP2 plankton
net samples (0-200 m depth). These were taken systematically on every pelagic trawl station on all four
vessels.
Swept area index and biomass estimation
The swept area estimate is based on catches in the whole area covered in the survey, or between 56°N and
76°N and 44°W and 32°E. Rectangle dimensions were 2° latitude by 4° longitude, i.e. the rectangle size was
increased as compared to that used in estimates from previous years. This was done to make up for an
increased distance between the trawl stations in some of the strata and thereby avoid interpolation of
number of rectangles. Allocation of the biomass to exclusive economic zones (EEZs) was done in the same
way as in 2010-2014 (see Annex 1).
In order to calculate a swept area estimate, the horizontal width of the trawl opening is required. It is
assumed that no mackerel is distributed below the ground rope (vertical opening of the trawl). Average
trawl door spread, vertical trawl opening and tow speed were sampled on each vessel for all stations. Two
different kinds of data are available, manually reported values from log books (one value per station) and
digitally recorded data from trawl sensors. The digtally recorded data were analysed as follows: Average
door spread and vertical opening were calculated for each station, then the average values per station were
used to calculate mean, maximum (max), minimum (min) and standard deviation (st.dev.) for each vessel.
Horizontal opening of the trawl was calculated by a formula using average values of trawl door horizontal
spread and tow speed for each vessel. The results of the measurements and estimations for the four vessels

13
Toktrapport/Havforskningsinstituttet/ISSN 1503 6294/Nr. 10 – 2016
are given in Table 5. Based on these results average horizontal trawl opening used in the swept area
calculations was set at the following vessel specific values given as 'Horizontal trawl opening (m)' in Table
5.
Table 5. Descriptive statistics for trawl door spread, vertical trawl opening and tow speed for each vessel. Two different kinds of data were analyzed, manually reported values from log books (one value per station) and digitally recorded data from trawl sensors (*). Digitally recorded data were filtered prior to calculations; for trawl door spread all values < 80 m and > 140 m were deleted, and for opening vertical spread all values < 20 m and > 50 were deleted. Next, average door spread and vertical opening was calculated for each station, then the average values per station were used to calculate overall mean, maximum (max), minimum (min) and standard deviation (st.dev.) for each vessel. Number of trawl stations used in calculations is also reported. For Árni Friðriksson, trawl door spread is reported both for log book data and digital trawl sensor data (*). Horizontal trawl opening (**) was calculated using average vessel values for trawl door spread and tow speed (details in Table 6).
Chr. í Grótinum RV Ár ni Friðriksson Brennholm Eros
Trawl doors horizontal spread (m) Number of stations
43*
53*
90
52
48
mean 108* 111* 109 118.2 120
max 113* 116* 121 122 125
min 104* 104* 80 115 116
st. dev. 2.6* 2.5* 5 4.4 4
Vertical trawl opening (m)
Number of stations 43* 48* 86 52 48
mean 39.7* 35* 36 31 33
max 52* 43* 55 36 38
min 36* 31* 30 28 29
st. dev. 2.9* 2.4* 3.5 4 4
Horizontal trawl opening (m) **
mean 60.7 63 66 67
Speed (over ground, nmi)
Number of stations 43 53* 92 52 48
mean 4.5 4.9* 4.9 5.0 4.8
max 5.3 5.4* 5.4 5.7 6.0
min 3.3 4.2* 3.4 4.1 4.2
st. dev. 0.4 0.2* 0.2 0.3 0.2
Horizontal trawl opening was calculated using average vessel values for trawl door spread and tow speed
(Table 6). The estimates in the formulae were based on a flume tank simulations in 2013 (Hirtshals,
Denmark) where formulas were developed from the for the horizontal trawl opening as a function of door
spread, for two towing speeds, 4.5 and 5 knots:
Towing speed 4.5 knots: Horizontal opening (m) = 0.441 * Doorspread (m) + 13.094
Towing speed 5.0 knots: Horizontal opening (m) = 0.3959 * Doorspread (m) + 20.094

14
Toktrapport/Havforskningsinstituttet/ISSN 1503 6294/Nr. 10 – 2016
Table 6. Horizontal trawl opening as a function of trawl door spread and towing speed. Relationship based on simulations of horizontal opening of the Multpelt 832 trawl towed at 4.5 and 5 knots, representing the speed range in the 2014 survey, for various door spread. See text for details.
Door Towing speed (knots)
spread (m) 4.5 4.6 4.7 4.8 4.9 5
100 57.2 57.7 58.2 58.7 59.2 59.7
101 57.6 58.1 58.6 59.1 59.6 60.1
102 58.1 58.6 59.0 59.5 60.0 60.5
103 58.5 59.0 59.5 59.9 60.4 60.9
104 59.0 59.4 59.9 60.3 60.8 61.3
105 59.4 59.9 60.3 60.8 61.2 61.7
106 59.8 60.3 60.7 61.2 61.6 62.1
107 60.3 60.7 61.2 61.6 62.0 62.5
108 60.7 61.1 61.6 62.0 62.4 62.9
109 61.2 61.6 62.0 62.4 62.8 63.2
110 61.6 62.0 62.4 62.8 63.2 63.6
111 62.0 62.4 62.8 63.2 63.6 64.0
112 62.5 62.9 63.3 63.7 64.0 64.4
113 62.9 63.3 63.7 64.1 64.4 64.8
114 63.4 63.7 64.1 64.5 64.9 65.2
115 63.8 64.2 64.5 64.9 65.3 65.6
116 64.3 64.6 65.0 65.3 65.7 66.0
117 64.7 65.0 65.4 65.7 66.1 66.4
118 65.1 65.5 65.8 66.1 66.5 66.8
119 65.6 65.9 66.2 66.6 66.9 67.2
120 66.0 66.3 66.6 67.0 67.3 67.6
R e s u l t s
Hydrography
The temperature in the surface layer from Iceland over Jan Mayen and to Svalbard was 1-2°C warmer in
July 2015 than the average for the last 20 years (Figure 3). In the central and eastern part of the Norwegian
Sea the SST was close to the 20 year average. South of the Greenland-Scotland ridge the SST was about 1 °C
lower than the 20 year average. In 2014 much warmer SSTs were observed north of Iceland (Figure 4) and
generally warmer in the whole Northeast Atlantic.
It must be mentioned that the NOAA sea surface temperature measurements (SST) are sensitive to the
weather condition (i.e. wind and cloudiness) prior to and during the observations and do therefore not
necessarily reflect the oceanographic condition of the water masses in the areas, as seen when comparing
detailed features of SSTs between years (Figures 3 and 4). However, since the anomaly is now based on
averages values over whole July, it should give representative results of the surface temperature.
The upper layer (< 20 m depth) was 1-2°C colder in 2015 compared to 2014 more or less throughout the
surveyed area (Figures 5 and 6). However, the temperature in the upper layer was more than 6°C, except
along the north-western margin of the surveyed area where it was lower. In the deeper layers (50 m and
deeper), the hydrographic features in the area were similar to 2013 and 2014. At all depths there was a clear
signal from the cold East Icelandic Current, which originates from the East Greenland Current.

15
Toktrapport/Havforskningsinstituttet/ISSN 1503 6294/Nr. 10 – 2016
Figure 3. Sea surface temperature anomaly in July (°C; centered for mid July 2015) showing warm and cold
conditions in comparison to a 20 year average.
Figure 4. Sea surface temperature anomaly in July (°C; centered for mid July 2014) showing warm and cold
conditions in comparison to a 20 year average.

16
Toktrapport/Havforskningsinstituttet/ISSN 1503 6294/Nr. 10 – 2016
Figure 5. Temperature (°C) at 0 m depth in the Norwegian Sea and surrounding waters in July/August
2015.
Figure 6. Temperature (°C) at 20 m depth in the Norwegian Sea and surrounding waters in July/August
2015.
17
Toktrapport/Havforskningsinstituttet/ISSN 1503 6294/Nr. 10 – 2016
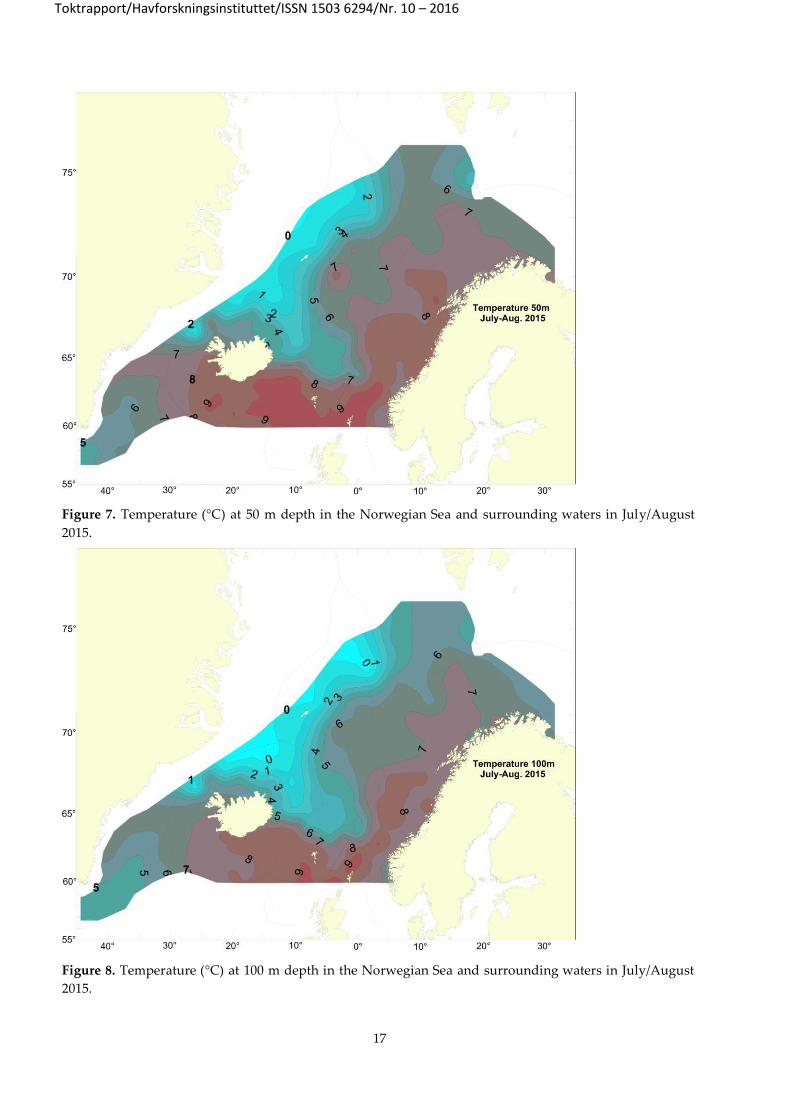
Figure 7. Temperature (°C) at 50 m depth in the Norwegian Sea and surrounding waters in Jul y/August
2015.
Figure 8. Temperature (°C) at 100 m depth in the Norwegian Sea and surrounding waters in July/August
2015.

18
Toktrapport/Havforskningsinstituttet/ISSN 1503 6294/Nr. 10 – 2016
Figure 9. Temperature (°C) at 200 m depth in the Norwegian Sea and surrounding waters in July/August
2015.
Figure 10. Temperature (°C) at 400 m depth in the Norwegian Sea and surrounding waters in July/August
2015.

19
Toktrapport/Havforskningsinstituttet/ISSN 1503 6294/Nr. 10 – 2016
Zooplankton
The average plankton biomass in the Norwegian Sea (north of 61°N and between 14°W and 17°E) in July-
August was 7.4 g/m2, slightly lower than in 2014 and 2013 (8.1 g/m2 and 8.4 g/m2 respectively) (Table 7).
However, the plankton concentrations were high in the northeastern part of the Icelandic area and the
northern part of the Faroese area (Figure 11), as they also were in 2014 and 2013. The plankton density
south and west of Iceland, as well as in the Greenlandic waters, was in the higher and highest range in the
relatively short time series (Table 7). The concentrations in the central part of the Norwegian Sea were
lower than in 2014, as were the concentrations in the north-eastern part (Svalbard area).
The zooplankton samples for species identification have not been examined in detail.
The decreased biomass of zooplankton in the Norwegian Sea as compared to 2014 is in agreement with
what has been observed in the IESNS survey in May (ICES, 2015), where the zooplankton estimate in 2015
also decreased, compared to 2014. These data, however, need to be treated with some care, due to various
amounts of phytoplankton between years and areas in the samples influencing the total amount of
zooplankton (g dry weight/m2) which is relevant as available food for pelagic planktivorous fish.
Figure 11. Zooplankton biomass (g dw/m2, 0-200 m) in the Norwegian Sea and surrounding waters, 1st of
July - 10th of August 2015.

20
Toktrapport/Havforskningsinstituttet/ISSN 1503 6294/Nr. 10 – 2016
Table 7. The time-series of zooplankton dry weight in IESSNS during 2010 to 2015 for Norwegian Sea
(between 17°E and 14°W and north of 61°N), Icelandic waters (between 14°W and 30°W) and Greenlandic
waters (west of 30°W). The number of samples is given in parentheses.
Dry weight of zooplankton (mg/m2)
Year Norwegian
Sea
Icelandic
waters
Greenlandic
waters
Total survey area
2010 6250 (168) 9276 (8)* 6387 (176)
2011 4622 (110) 7058 (61) 5491 (171)
2012 6014 (139) 5926 (55) 10086 (2) 6031 (196)
2013 8581 (188) 9990 (49) 13787 (14) 9147 (251)
2014 8155 (175) 4834 (47) 5308 (33) 7174 (255)
2015 7339 (138) 9064 (49) 15865 (20) 8705 (207)
Dry weight of zooplankton (mg/m2)
Year Norwegian
Sea
Icelandic
waters
Greenlandic
waters
2010 6232 (172) 9276 (8)*
2011 4622 (110) 7058 (61)
2012 5998 (140) 5926 (55) 10086 (2)
2013 8421 (195) 9990 (49) 13787 (14)
2014 8138 (182) 4834 (47) 5308 (33)
2015 7353 (152) 9064 (49) 15865 (20)
*No plankton samples on the Icelandic vessel, only by Norwegian vessel north off Iceland.
Pelagic fish species
Mackerel
The total mackerel catches (kg) taken during the joint mackerel-ecosystem survey with the Multpelt 832
quantitative sampling trawl is presented in 2*4° rectangles in Figure 12. The map is showing differen t
concentrations of mackerel from zero catch to more than 5000 kg.

21
Toktrapport/Havforskningsinstituttet/ISSN 1503 6294/Nr. 10 – 2016
Figure 12. Catches of mackerel in kg represented in standardized rectangles (2° lat. x 4° lon.). Light blue
represents small catches (0.3-100 kg), while dark red represents catches of more than 5000 kg mackerel after
30 min standardized towing with the Multpelt 832 pelagic trawl. Vessel tracks are shown as continuous
lines. Trawl stations are marked as small crosses for each vessel. Empty rectangles surrounded by three or
more were interpolated in the calculations on biomass/abundance and density indices.
The length distribution of NEA mackerel during the joint ecosystem survey showed a pronounced length-
dependent distribution pattern both with regard to latitude and longitude. The largest mackerel were found
in the northernmost (including northeast in the Barents Sea) and westernmost part of the covered area in
July-August 2015 (Figure 13).

22
Toktrapport/Havforskningsinstituttet/ISSN 1503 6294/Nr. 10 – 2016
Figure 13. Average length distribution of NEA mackerel from the joint ecosystem survey with M/V
“Brennholm”, M/V “Eros”, M/V “Christian í Grótinum” and R/V “Árni Friðriksson” in the Nordic Seas
between 1st of July and 10th of August 2015.
Mackerel caught in the pelagic trawl hauls on the four vessels varied from 24 cm to 46 cm in length with the
individuals between 30-33 cm and 35-38 cm dominating in the abundance. The mackerel weight (g) varied
between 180 to 820 g (Figure 14). Some juvenile mackerel were caught in July-August 2015. The spatial
distribution and overlap between the major pelagic fish species (mackerel, herring, blue whiting, salmon,
lumpsucker) from the joint ecosystem survey in the Nordic Seas according to the catches are shown in
Figure 15.

23
Toktrapport/Havforskningsinstituttet/ISSN 1503 6294/Nr. 10 – 2016
Figure 14. Length (cm) and weight (g) distribution in percent (%) for mackerel sampled in the trawl catches.
Note that these values are not weighed with catch or area size and can therefore divide from the estimation
of length distribution in the stock (not provided).

24
Toktrapport/Havforskningsinstituttet/ISSN 1503 6294/Nr. 10 – 2016
Figure 15. Distribution and spatial overlap between mackerel (red), herring (blue), blue whiting (yellow)
and salmon (turquoise) from joint ecosystem surveys conducted onboard M/V “Brennholm” and M/V
“Eros” (Norway), M/V “Christian í Grótinum” (Faroe Islands) and R/V “Árni Friðriksson” (Iceland) in the
Norwegian Sea and surrounding waters between 1st of July to 10th of August 2015. Vessel tracks are shown
as continuous lines.
Swept area analyses from standardized pelagic trawling with Multpelt 832
The swept area estimates of mackerel biomass in July-August 2015 were based on average catches of
mackerel within rectangles of 2° latitude and 4° longitude and scaled by the width of horizontal opening of
the trawls (Table 5), which gave catch indices (kg/km2; Figure 16). With the increase in rectangle size (from
1° by 2° rectangles used previously) there was no need for interpolating values to rectangles not covered
but assumed to hold mackerel. The swept area estimates for the different rectangles are shown in Figure 17
and in a different graphical way in Figure 18. The total biomass estimate came to 7.7 million tonnes, which
was allocated to the different EEZs as in previous years (Annex 1). This estimate was based on the standard
method using the average horizontal trawl opening by each participating vessel (around 65 m, see Table 5).
A further assumption was that all mackerel inside the trawl opening are caught.

25
Toktrapport/Havforskningsinstituttet/ISSN 1503 6294/Nr. 10 – 2016
Figure 16. Stations and catches of mackerel in July/August 2015 where the circles size is proportional to
square root of catch (kg/km2) and stations with zero catches are denoted with +. Rectangle grid (2° by 4°)
used for averaging overlayed.

26
Toktrapport/Havforskningsinstituttet/ISSN 1503 6294/Nr. 10 – 2016
Figure 17. Standardized mackerel catch rates (kg/km2) in 2° lat. by 4° lon. rectangles from swept area
estimates in July/August 2015. Rectangles with no catch are not indicated on the map – refer to Figure 18.
Figure 18. Standardized mackerel catch rates (kg/km2) for mackerel in the July/August 2015 survey
represented graphically.

27
Toktrapport/Havforskningsinstituttet/ISSN 1503 6294/Nr. 10 – 2016
Nu
mb
er
(%)
Age-disaggregated indices from IESSNS obtained using the swept-area methodology were first estimated
and introduced in the Benchmark assessment of the mackerel stock in 2014 (Nøttestad et al. 2014). The same
methodology was used now and the series were updated with the 2014 and 2015 data to be used as input
data into the analytical assessment of the stock (Table 8). The 2015 results show that 2011-year class
contributed with 28% in number followed by the 2010-year class with 22% (Fig. 19). The 2012 year class
contribute to with 12% in numbers followed by the 6 and 7 years old represented with less than 10% each in
numbers. Altogether 71% of the estimated number of mackerel was less than 6 years old in the IESSNS
2015. The internal consistency plot for age-disaggregated year classes has improved since the benchmark in
2014 by the inclusion of two more survey years (2014 and 2015). This is especially apparent for younger
ages (1-5 years). There is now good internal consistency for 1-10 years old mackerel, except between ages 5
and 6.
30
25
20
15
10
5
0
1 2 3 4 5 6 7 8 9 10 11 12 13 14+
Age (years)
Figure 19. Age distribution in percent (%) of Atlantic mackerel, in the Nordic Seas from1st of July to 10th of
August 2015.
In 2015, and swept area estimation of mackerel abundance was also done in a stratified manner with the
software StoX (Annex 3). This was done for three main reasons, (1) for a comparison to the tradi tionally
applied method where calculations are done on rectangles basis (in contrast to strata), (2) to get an
uncertainty estimation of the indices, and (3) this is the method is a likely candidate to be used in the future
for estimation of swept are abundance indices of NEA mackerel from the IESSNS survey. StoX is an open
source software developed at the Institute of Marine Research (IMR) in Norway to calculate survey
estimates from acoustic and swept area surveys.

28
Toktrapport/Havforskningsinstituttet/ISSN 1503 6294/Nr. 10 – 2016
Table 8. Time series of the IESSNS showing (a) age-disaggregated abundance indices of mackerel, (b)
survey area covered where each age class is observed, and (c) swept-area density index (km-2), which is
applied in the analytical assessment of mackerel (limited to age 6+).
(a) Number of individuals (billions)
Habitat range (mill,
Year\Age 1 2 3 4 5 6 7 8 9 10 11 12 13 14(+) km2)
2007 1.331 1.861 0.896 0.238 1 0.16 0.055 0.039 0.029 0.011 0.009 0.003 0.011 0.002 0.99
2010 0.019 2.768 1.485 3.954 3.123 1.277 0.555 0.385 0.236 0.063 0.041 0.031 0.016 0.005 1.75
2011 0.209 0.251 0.861 1.103 1.616 1.211 0.564 0.276 0.121 0.062 0.057 0.017 0.011 0.001 1.2
2012 0.497 4.991 1.223 2.111 1.822 2.415 1.642 0.652 0.342 0.119 0.067 0.019 0.006 0.006 1.5
2013 0.064 7.776 8.987 2.137 2.906 2.874 2.679 1.266 0.451 0.192 0.161 0.042 0.008 0.022 2.41
2014 0.008 0.579 7.795 5.138 2.605 2.624 2.673 1.686 0.739 0.36 0.086 0.054 0.02 0.004 2.45
2015 1.199 0.830 2.411 5.765 4.558 1.944 1.833 1.039 0.617 0.320 0.075 0.071 0.037 0.022 2.69
(b) Area covered where an age class is observed (km2)
2007 0.832 0.832 0.832 0.832 0.832 0.830 0.831 0.829 0.820 0.847 0.865 0.720 0.834 0.788
2010 6.128 2.059 2.052 2.034 2.032 2.028 2.030 2.027 2.032 2.034 2.023 2.002 2.050 2.039
2011 1.217 1.216 1.218 1.217 1.217 1.217 1.216 1.219 1.212 1.208 1.223 1.220 1.182 0.992
2012 2.330 1.892 1.846 1.845 1.842 1.842 1.844 1.842 1.842 1.838 2.041 1.861 2.463 1.974
2013 0.291 2.596 2.255 2.224 2.175 2.209 2.228 2.210 2.313 2.438 2.344 2.730 2.048 2.302
2014 0.150 0.500 3.800 2.350 1.160 1.140 1.160 0.790 0.430 0.280 0.110 0.110 0.060 0.011
2015 2.769 0.525 1.116 2.372 1.809 0.762 0.692 0.433 0.269 0.166 0.062 0.063 0.048 0.057
(c) Density index (thousands per km2)
2007 1.599 2.236 1.077 0.286 1.202 0.193 0.066 0.047 0.035 0.013 0.010 0.004 0.013 0.003
2010 0.003 1.345 0.724 1.944 1.537 0.630 0.273 0.190 0.116 0.031 0.020 0.015 0.008 0.002
2011 0.172 0.206 0.707 0.907 1.328 0.995 0.464 0.226 0.100 0.051 0.047 0.014 0.009 0.001
2012 0.213 2.637 0.663 1.144 0.989 1.311 0.890 0.354 0.186 0.065 0.033 0.010 0.002 0.003
2013 0.006 2.995 3.985 0.961 1.336 1.301 1.202 0.573 0.195 0.079 0.069 0.015 0.004 0.010
2014 0.150 0.500 3.800 2.350 1.160 1.140 1.160 0.790 0.430 0.280 0.110 0.110 0.060 0.011
2015 2.769 0.525 1.116 2.372 1.809 0.762 0.692 0.433 0.269 0.166 0.062 0.063 0.048 0.057

29
Toktrapport/Havforskningsinstituttet/ISSN 1503 6294/Nr. 10 – 2016
Figure 20. Internal consistency of mackerel density index. Ages indicated by white numbers in grey
diagonal cells. Statistically significant positive correlations (p<0.05) are indicated by regression lines and red
cells in upper left half. Correlation coefficients (r) are given in the lower right half.
Multibeam sonar recordings
Multibeam sonar recordings were conducted and recorded onboard the two Norwegian vessels Brennholm
and Eros. The mackerel schools detected were of small size predominantly with low density and appearing
more as individual fish or loose aggregations. They were detected swimming in the upper 5 -30 m of the
water column throughout the day. However, within large proportions of the mackerel distribution areas
based on the Multpelt trawling we could only detect any mackerel on the multibeam sonars (Simrad SH80
and Simrad SX90) when the mackerel were swimming in more concentrated shoals and aggregations. Even
if we maximized the ping rate on both the multibeam sonars and multi-frequency echosounders including
an array of frequencies from 18 to 333 kHz, the mackerel were practically invisible for the multibeam sonars

30
Toktrapport/Havforskningsinstituttet/ISSN 1503 6294/Nr. 10 – 2016
as well as for the multifrequency echosounders. The main reason is probably due to very loose
aggregations/shoals close to the surface thereby providing extremely low detection probability on any
acoustic instrumentation including multi-frequency echosounder and high and low frequency multibeam
sonars. We could sometimes detect nothing or very little on the sonars but still got medium to high catches
of mackerel during surface trawling with the Multpelt 832 pelagic sampling trawl, also suggesting very
dispersed mackerel concentrations.
Norwegian spring-spawning herring
Norwegian spring-spawning herring (NSS) was recorded in the eastern part of the area surveyed (Figure
21). The western boundary of its distribution was at 14°W south of Iceland and further west than probably
observed for decades north of Iceland or at 23°35W and few individuals in catches at the northern most
transect in Greenlandic waters at 34°08W. The herring observed west of these boundaries belonged to the
Icelandic summer-spawning herring according to trawl samples (not shown on Figures 21a, b). The acoustic
values indicated that NSS herring had the highest density in the western periphery of its distribution, or
north of the Faroes and east and north of Iceland (Figure 21a, b). The abundance was low in the northern
and eastern areas, and herring was relatively absent from the mid Norwegian Sea. The periphery of the
distribution of adult part of NSS herring was considered to be reached in all directions, which means a
better spatial coverage than in recent years. It was only towards north between 14-20°W where some
herring might be missing (Figure 21b and 15).
The biomass estimate of NSS herring age 4+ came to 7.7 million tons and the total number was 22.7 billions
based on the acoustic recordings in July-August 2015 using the primary frequency of 38 kHz and the
biological measurements of herring caught in the trawl tows. The length of the NSS herring ranged from 19 -
40 cm with a peak at 35 cm and a smaller peak at 30 cm (Figure 22). The weighed mean length was 34.3 cm
from the whole estimations and the weighed mean weight was 335.9 g compared to 33.4 cm and 329.6 g,
respectively, in the 2014 IESSNS.

31
Toktrapport/Havforskningsinstituttet/ISSN 1503 6294/Nr. 10 – 2016
(b)
Figure 21. The sA/Nautical Area Scattering Coefficient (NASC) values of Norwegian spring-spawning
herring along the cruise track, 1st of July to 10th of August 2015 (a) within rectangles and (b) shown on a
contour plot.

32
Toktrapport/Havforskningsinstituttet/ISSN 1503 6294/Nr. 10 – 2016
The age distribution in NSS herring shows dominance of the 2004 year class with about 19% in numbers of
the acoustic estimate, followed by the 2005 and 2009 year classes (14% each) (Figure 22).
30 30
20 20
% %
10 10
0 0
10 15 20 25 30 35 40 2 4 6 8 10 12 15
Length in cm age in years
Figure 22. Age and length distribution of Norwegian spring-spawning herring from 1st of July to 10th of
August 2015.
The length distribution measured on herring showed overall a pronounced length dependent migration
pattern, with the largest individuals (>34 cm) furthest west and northwest (Figure 23).
Figure 23. Length distribution of Norwegian spring-spawning herring during the coordinated ecosystem
survey 1st of July to 10th of August 2015.

33
Toktrapport/Havforskningsinstituttet/ISSN 1503 6294/Nr. 10 – 2016
Blue whiting
No results are presented for blue whiting in 2015 because only two deep trawl hauls were taken on acoustic
registrations of blue whiting. See an explanation in the Introduction chapter.
Lumpfish (Cyclopterus lumpus)
Lumpfish was caught in 78% of trawl stations (Fig. 24). Of stations with mackerel present, the mean weight
of the lumpfish catches was 48 kg (114 stations) while 71 kg (23 stations) where mackerel was absent. There
was a north-south pattern in lumpfish occurrence. Lumpfish was present at majority of stations north of
65°N, whereas lumpfish was scarce south of 65°N, excluding Greenland waters. Of note, total trawl catch at
each trawl station were processed on board Árni Friðriksson, Brennholm and Eros whereas a subsample of
100 kg to 200 kg was processed on Finnur Fríði. Therefore, small catches (< 10 kg) of lumpfish might be
missing from the survey track of Finnur Fríði (black crosses). However, it is unlikely that larger catches of
lumpfish would have gone unnoticed by crew during sub-sampling of catch on Finnur Fríði. Generally, the
mean length and mean weight of the lumpfish was highest in the coastal waters and lowest in the open sea.
Figure 24. Lumpfish catches at surface trawl stations during the IESSNS survey in July and August 2015.
Salmon (Salmo salar)
North Atlantic salmon (Salmo salar) were caught both in coastal and offshore areas in the upper 30 m of the
water column with the Multpelt 832 pelagic sampling trawl, during the IESSNS survey in July-August 2015.

34
Toktrapport/Havforskningsinstituttet/ISSN 1503 6294/Nr. 10 – 2016
The salmon weight ranged from 300 gram to 7.2 kg in size, dominated by salmon weighing between 1-3 kg.
The length of the salmon ranged from 21 cm to 85 cm, with a large majority of the salmon >40 cm in length.
Figure 25. Salmon catches at surface trawl stations during the IESSNS survey in July and August 2015.
Marine Mammal Observations
Totally 340 marine mammals and 6 different species were observed onboard M/V “Brennholm” and M/V
“Eros” from 1st to 28th of July 2015 (Figure 26). Altogether 6 groups of killer whales were found mostly in
the central part of the Norwegian Sea in close association with mackerel. High densities of especially fin
whales, humpback whales and white beaked dolphins were observed in the northern part of the Norwegian
Sea, off the coast of Finnmark and into the southern part of the Barents Sea. Very few marine mammals
were sighted in the southern part of the covered area including the northern part of the North Sea, and
central Norwegian Sea south of 67°N (Figure 26).

35
Toktrapport/Havforskningsinstituttet/ISSN 1503 6294/Nr. 10 – 2016
Figure 26. Overview of all marine mammals sighted onboard M/V “Brennholm” and M/V “Eros” in the
Norwegian Sea and surrounding waters from 1st to 28th of July 2015.
D i s c u s s i o n
The international coordinated ecosystem survey in the Norwegian Sea and adjacent areas (IESSNS) was
performed during 1 July to 10 August 2015 by four vessels from Norway (2), Iceland (1) and Faroese (1),
beside that the Icelandic vessel was rented by Greenland to cover Greenlandic waters. The survey coverage
was comparable to previous years and the same protocol was followed (ICES 2014b). A major part of the
survey is a standardised surface trawling at predefined locations, which has been used for a swept area
abundance estimation of NEA mackerel since 2007, although not in all years. The method is analogous to
the various bottom trawl surveys run for many demersal stocks.
The total swept area biomass index of NEA mackerel in summer 2015 was 7.7 million tonnes distributed
over an area of 2.7 million square kilometres in the Nordic Seas. This is 1.3 million tonnes l ower abundance
index than in 2014 when it was record high. The average density decreased also from previous two years
from around 3.65 tonnes/km2 to 2.86 tonnes/km2. The reason for the decrease in the total biomass index of
mackerel and density is not fully known, but could be a consequence of both adult and juvenile mackerel
being outside of the survey area (e.g. in the North Sea and north and west of the British Isles), less fishable
during surface trawling, due to different behaviour including possible higher patchiness compared to
previous years, and/or that the abundance index from the IESSNS swept area survey in 2015 is simply
reflecting the development of the stock size. None of these possible reasons can be excluded. However, the
distribution of the mackerel and consequently also the feeding migration differed from previous years, with
relatively less abundance in the northernmost and westernmost regions while much more in the area south

36
Toktrapport/Havforskningsinstituttet/ISSN 1503 6294/Nr. 10 – 2016
of Iceland. Moreover, mackerel had relatively high density in the southeastern area covered (Figure 16),
which all together could imply that higher proportion of the stock might have been missed in this year’s
survey because of a more pronounced southerly distribution. This emphasizes the necessity of covering the
potential distribution areas further south (in the North Sea and west of the British Isles) as a part of IESSNS
and recommended below.
The reasons the changes in the mackerel distribution from previous years are uncertain but are considered
to be related to environmental factors. Relatively cold surface waters southeast of Iceland, around the
Faroese and in the southern part of the Norwegian Sea in the spring 2015, as presented by the May survey
results (ICES 2015), might for example had contributed to these changes. This needs however, further
examination later including a broader scientific approach.
The 2011-year class of mackerel contributed with 28% of numbers followed by the 2010-year class with 22%.
The 2012 year class had 12% in number. Altogether 71% of the estimated number of mackerel was less than
6 years old. The internal consistency plot for age-disaggregated year classes has improved since the
benchmark in 2014 by the inclusion of two more survey years. This is especially apparent for younger age s.
There is now good internal consistency for 1-10 years old mackerel, except between age 5 and 6. The reason
for the low consistency around age 5 is unknown, but could partly be due to similar abundance estimates of
these two consecutive cohorts aged 5 and 6. The improved consistency for young NEA mackerel in the
IESSNS survey should be taken into consideration by ICES WGWIDE, specifically by including estimates of
younger mackerel 1-5 years of age, and not only age 6+ mackerel, from the IESSNS survey into the
assessment of NEA mackerel abundance. This is also important since altogether 71% of the estimated
number of mackerel was less than 6 years old and are therefore not used in current assessment.
The overlap between mackerel and NSS herring was highest in the south-western part of the Norwegian
Sea (Faroe and east Icelandic area) according to the catch compositions in the survey (Figure 15), which is
similar to 2014. In the areas where herring and mackerel overlap an inter-specific competition for food
between the species can be expected. According to Langøy et al. (2012), Debes et al. (2012), and Oskarsson et
al. (2015) the herring may suffer in this competition, the mackerel had higher stomach fullness index than
herring and the herring stomach composition is different from previous periods. Langøy et al (2012) and
Debes et al. (2012) also found that mackerel target more prey species compared to herring and mackerel
may thus be a stronger competitor and more robust in periods with low zooplankton abundances.
The groups recommends on the timing of the survey in the future that the survey period should be four
weeks and the mid-point should be around 20 July. The main argument for this timeframe, is to make the
survey as synoptic as possible in space and time, and at the same time be able to finalize data and report for
inclusion in the assessment for the same year. The mid-point of the survey is therefore earlier than the
assumed maximum distribution of the mackerel stock.
The acoustic abundance index of Norwegian spring-spawning herring at age 4+ came to 22.7 billions, which
is comparable to the May survey index in 2015 of 20.3 billions (~10% difference; ICES 2015). The age
composition in these two surveys was also similar with a tendency for a higher contribution of older age
groups in the July/August survey compare to the May survey, where 65% vs. 53% were at age 7+ and 35%
vs. 47 at age 4-6, respectively. These differences in age composition for NSS herring between the IESNS and
IESSNS surveys could be due to the fact the IESSNS in July-August is only catching herring in the upper 30
m, whereas herring is also caught in deeper waters during the IESNS in May-June.
Systematic biological data on lumpfish has been collected during the entire survey and there e xist a lot of
interesting results on distribution, length and weight composition etc. These lumpfish data need to be
further analysed in the future.
Systematic biological data on North Atlantic salmon caught during the IESSNS has also been collected. All
the salmon samples have been frozen for later analyses and can be applied for a range of different scientific
investigations in the future.
37
Toktrapport/Havforskningsinstituttet/ISSN 1503 6294/Nr. 10 – 2016
The temperature in the surface (SST) layer from Iceland over Jan Mayen and to Svalbard was 1 -2°C warmer
in July 2015 than the average for the last 20 years. In the central and eastern part of the Norwegian Sea the
SST was close to the 20 year average, while around 1°C below the average south of Iceland and in
Greenland Sea. The SST in July 2015 was generally colder than in July 2014 across the whole Northeast
Atlantic. Despite the cooler surface waters south of Iceland, the mackerel density has never been measured
as high. It should be considered in this context that the temperature there was in the range of 9 -11°C, which
is well above the temperature often restraining the mackerel distribution of ~6°C.
The concentrations of zooplankton in the Norwegian Sea were lower in 2015 than in 2014 (7.4 g dry
weight/m2 and 8.6 g/m2 respectively). In the IESNS survey in May 2015 a decrease was also observed
compared to 2014. There seem to be higher concentrations of zooplankton in southern areas off Iceland and
Greenland than observed in previous years.
Whale observations were done by the two Norwegian vessels during the survey. The number of marine
mammal sightings was generally very low in the central and eastern part of the Norwegian Sea but with
considerable higher numbers of especially fin whales in the northern Norwegian Sea and into the Barents
Sea. Groups of killer whales were mostly observed in central Norwegian Sea, whereas fin and humpback
whales where mainly observed near Jan Mayen, Bear Island and the southwestern part of the Barents Sea
and off the coast of Finnmark. High numbers of white beaked dolphins appeared in the northern part of the
Norwegian Sea, in southern part of the Barents Sea and along the coast of Finnmark.
The swept-area estimate was as in previous years based on the standard method using the average
horizontal trawl opening by each participating vessel (ranging from 61 to 67 m; Table 5), assuming that all
mackerel inside the trawl opening are caught, i.e. no escape through the meshes. Further, that no mackerel
is distributed below the trawl. Uncertainties in such a method include e.g. possible escape of fish through
the meshes leading to an underestimation of the estimate. If, on the other hand, mackerel is herded into the
trawl paths by the trawl doors and bridles, the method overestimates the abundance. The main effort in this
year’s survey to systematically quantify the catchability of the trawl and improve the standardization, was
to undertake a comparison between trawling in banana and straight forward. This will require further
parwise trawl hauls in the future, but the results of the tows undertaken in 2015 seems to point towards less
catches in the banana tows even if not statistically significant (Annex 2).
Results on total abundance index without uncertainty estimates using the swept area method on the NEA
mackerel using the new program StoX, are presented in Annex 3. These analyses are preliminary and need
more careful consideration especially related to the uncertainty estimates of the total abundance index and
the different age groups 1-10 years old, before these results can be used into the assessment of NEA
mackerel.

38
Toktrapport/Havforskningsinstituttet/ISSN 1503 6294/Nr. 10 – 2016
R e c o m m e n d a t i o n s
General recommendations
Recommendation
To whom
The survey period should be restricted to maximum 4 weeks. The mid-point of the
survey should be around 20 July each year.
Norway, Faroe
Islands, Iceland,
Greenland
Increase the survey effort in Greenlandic and international waters in the western part
of the survey area to cover the NEA mackerel stock completely during the summer
feeding.
Greenland
Encourage EU to join the IESSNS survey in order to obtain an even better synoptic and
to include the southern part of the mackerel distribution during summer. Develop a
method that can sample the mackerel representatively in the North West European
shelf Seas south of 58.5N.
Investigate the horizontal distribution and abundance of mackerel if standardized
trawling in the surface (0-30 m) can be used to measure the abundance of mackerel in
in the North West European shelf Seas south of 58.5N.
EU
The age disaggregated indices from IESSNS are considered to give a valid signal about
year class sizes from age 1-10 as indicated by the consistency plots. It is therefore
recommended that WGWIDE consider using the entire time and age series of
estimates from the IESSNS survey in the analytical assessment of the mackerel stock.
WGWIDE
We recommend that observers collect sighting information of marine mammals and
birds on all vessels.
Norway, Faroe
Islands, Iceland,
Greenland
S u r v e y p a r t i c i p a n t s
R/V “Árni Friðriksson”:
Sigurður Jónsson, Marine Research Institute, Reykjavík, Iceland Björn
Sigurðarson, Marine Research Institute, Reykjavík, Iceland Guðmundur
J. Óskarsson, Marine Research Institute, Reykjavík, Iceland Einar
Hreinsson , Marine Research Institute, Reykjavík, Iceland
Björn Gunnarsson, Marine Research Institute, Reykjavík, Iceland
Sigurlína Gunnarsdóttir, Marine Research Institute, Reykjavík, Iceland
Stefán Brynjólfsson, Marine Research Institute, Reykjavík, Iceland
Páll Valgeirsson, Marine Research Institute, Reykjavík, Iceland
Sólrún Sigurgeirsdóttir, Marine Research Institute, Reykjavík, Iceland
Ragnhildur Ólafsdóttir, Marine Research Institute, Reykjavík, Iceland
Anika Guðlaugsdóttir, Marine Research Institute, Reykjavík, Iceland
Agnar M. Sigurðsson, Marine Research Institute, Reykjavík, Iceland
Guðrún Finnbogadóttir, Marine Research Institute, Reykjavík, Iceland

39
Toktrapport/Havforskningsinstituttet/ISSN 1503 6294/Nr. 10 – 2016
Søren L. Post, Greenland Institute of Natural Resources, Nuuk, Greenland
Kristine Arendt, Greenland Institute of Natural Resources, Nuuk, Greenland
Davíð Gíslason, Marine Research Institute, Reykjavík, Iceland
Birna Daníelsdóttir, Marine Research Institute, Reykjavík, Iceland
Nadya C. Ramírez Martínez, Marine Research Institute, Reykjavík, Iceland
Sölvi Rúnar Vignisson, Marine Research Institute, Reykjavík, Iceland
Magnús Ástvaldsson , Marine Research Institute, Reykjavík, Iceland
Hallur Helgason, Marine Research Institute, Reykjavík, Iceland
Þorsteinn Þorsteinsson, Marine Research Institute, Reykjavík, Iceland
Ingólfur Guðnason, Marine Research Institute, Reykjavík, Iceland
M/V “Christian í Grótinum”:
Eydna í Homrum, Faroe Marine Research Institute, Torshavn, Faroe
Ebba Mortensen, Faroe Marine Research Institute, Torshavn, Faroe
Poul Vestergaard, Faroe Marine Research Institute, Torshavn, Faroe
Helga Bára Mohr Vang, Faroe Marine Research Institute, Torshavn, Faroe
Sunnvør Klettskarð í Kongsstovu, iNova, Torshavn, Faroe
M/V “Brennholm”:
Leif Nøttestad, Institute of Marine Research, Bergen, Norway Endre
Grimsbø, Institute of Marine Research, Bergen, Norway Valantine
Anthonypillai, Institute of Marine Research, Bergen, Norway Jarle
Kristiansen, Institute of Marine Research, Bergen, Norway
Eilert Hermansen, Institute of Marine Research, Bergen, Norway,
Matteo Bernasconi, Institute of Marine Research, Bergen, Norway
Kristi Børve Eriksen, Institute of Marine Research, Bergen, Norway
Jostein Røttingen, Institute of Marine Research, Bergen, Norway
Eneko Bachiller, Institute of Marine Research, Bergen, Norway
Merete Fonn, Institute of Marine Research, Bergen, Norway
Grethe Torsheim, Institute of Marine Research, Bergen, Norway
Bart Schoon, Bachelor student, The Netherlands
M/V “Eros”:
Kjell Rong Utne, Institute of Marine Research, Bergen, Norway
Are Salthaug, Institute of Marine Research, Bergen, Norway
Gunnar Lien, Institute of Marine Research, Bergen, Norway
Merete Kvalsund, Institute of Marine Research, Bergen, Norway
Ørjan Sørensen, Institute of Marine Research, Bergen, Norway
Endre Grimsbø, Institute of Marine Research, Bergen, Norway
Karen Gjertsen, Institute of Marine Research, Bergen, Norway
Julio Erices, Institute of Marine Research, Bergen, Norway
Eneko Bachiller, Institute of Marine Research, Bergen, Norway
A c k n o w l e d g e m e n t s
We greatly appreciate and thank skippers and crew members onboard M/V “Brennholm”, M/V “Eros”,
M/V “Christian í Grótinum” and R/V “Árni Friðriksson” for outstanding collaboration and practical
assistance on the joint mackerel-ecosystem cruise in the Nordic Seas from 1st of July to 10th of August 2015.

40
Toktrapport/Havforskningsinstituttet/ISSN 1503 6294/Nr. 10 – 2016
R e f e r e n c e s
Anon. 2015. Notes from acoustic scrutinizing workshop in relation to the International Ecosystem Survey in
Nordic Seas (IESNS). 3 – 5 March 2015, Marine Research Institute, Reykjavik. WD to WGIPS 2015. 7 pp.
Debes, H., Homrum, E., Jacobsen, J.A., Hátún, H., Danielsen, J. 2012. The feeding ecology of pelagic fish in
the southwestern Norwegian Sea –Inter species food competition between Herring (Clupea harengus)
and mackerel (Scomber scombrus). ICES CM 2012/M:07. 19 pp.
Foote, K. G., 1987. Fish target strengths for use in echo integrator surveys. J. Acoust. Soc. Am. 82: 981 -987.
ICES 2013a. Report of the Workshop on Northeast Atlantic Mackerel monitoring and methodologies
including science and industry involvement (WKNAMMM), 25–28 February 2013, ICES Headquarters,
Copenhagen and Hirtshals, Denmark. ICES CM 2013/SSGESST:18. 33 pp.
ICES 2013b. Working group on Improving use of Survey Data for Assessment and Advice (WGISDAA).
Dublin, Ireland, May 2013.
ICES 2014a. International ecosystem survey in the Nordic Sea (IESNS) in April -June 2014. Working
document to Working Group on International Pelagic Surveys. Copenhagen, Denmark, June 2014. 28
p.
ICES 2014b. Manual for international pelagic surveys (IPS). Working document of Working Group of
International Surveys (WGIPS), Version 1.02 [available at ICES WGIPS sharepoint] 98 pp.
ICES 2014c. Report of the Benchmark Workshop on Pelagic Stocks (WKPELA), 17–21 February 2014,
Copenhagen, Denmark. ICES CM 2014/ACOM: 43. 341 pp
ICES 2015. International ecosystem survey in the Nordic Sea (IESNS) in April-June 2015. Working
document to Working Group on International Pelagic Surveys (WGIPS). Copenhagen, Denmark, 16 –
18 of June 2015. 35 pp.
Langøy, H., Nøttestad, L., Skaret, G., Broms, C., & Fernö, A. (2012). Overlap in distribution and diets of
Atlantic mackerel (Scomber scombrus), Norwegian spring- spawning herring (Clupea harengus) and
blue whiting (Micromesistius poutassou) in the Norwegian Sea during late summer. Marine biology
research, 8(5-6), 442-460.Nøttestad L. and J.A. Jacobsen 2009. Coordinated Norwegian-Faroese
ecosystem survey with M/V ”Libas”, M/V ”Eros”, and M/V ”Finnur Fríði” in the Norwegian Sea, 15
July – 6 August 2009. Working Document to WGWIDE, ICES 2-8 Sept. 2009. 32 p.
Nøttestad L., J.A. Jacobsen, S. Sveinbjørnsson et al. 2010. Cruise report form the coordinated Norwegian -
Faroese ecosystem survey with M/V ”Libas”, M/V ”Eros”, and M/V ”Finnur Fríði” in the Norwegian
Sea and surrounding waters,, 9 July – 20 August 2010. Working Document to WGWIDE, ICES 2-8 Sept.
2009. 49 p.
Nøttestad, L, Utne, K.R., Óskarsson, G.J., Debes H. 2012 Cruise report from the coordinated ecosystem
survey (IESSNS) with R/V ”G. O. Sars”, M/V “Brennholm”; M/V “Christian í Grótinum” and R/V “ Árni
Friðriksson” in the Norwegian Sea and surrounding waters, 1 July-10 August 2012. Working document
to ICES WGWIDE, Lowestoft, UK, 21-27 August 2012. 45p.
Nøttestad, L., Utne, K.R., Óskarsson, G.J., Jónsson S.Þ., Jacobsen, J.A., Tangen, Ø., Anthonypillai, V. , Pena,
H., Bernasconi, M., Debes, H., Smith, K., Sveinbjörnsson, S., Holst, J.C., and Slotte, A. 2014. Abundan ce
and spatial expansion of Northeast Atlantic mackerel (Scomber scombrus) according to trawl surveys
in the Nordic Seas 2007 to 2013. Working document to ICES WKPELA 17–21 February 2014,
Copenhagen, Denmark.
Óskarsson, G.J., Guðmundsdóttir, A., Sveinbjörnsson, S.. and Sigurðsson, Th. 2015. Feeding ecology of
mackerel and dietary overlap with herring in Icelandic waters Ecological impacts of recent extension of
feeding migration of NE-Atlantic mackerel into the ecosystem around Iceland. Marine Biology
research, In print.

41
Toktrapport/Havforskningsinstituttet/ISSN 1503 6294/Nr. 10 – 2016
A n n e x 1
Swept area biomass estimates in the different exclusive economical zones (EEZs)
Allocation of the total swept area estimate of mackerel biomass to exclusive economic zones (EEZs) given in
Table A1 was done in R with a selection of spatial packages (see 'Task View: Spatial' on http://cran.r-
project.org). These included notably 'rgeos' for polygon clipping, and package 'geo' (http://r -forge.r-
project.org), i.e. for rectangle manipulation and graphical presentation (R Development Core Team 2014,
Bivand and Rundel 2014, Björnsson et al. 2014 ). EEZs in the Northeast Atlantic were taken from shape files
available on http://marineregions.org (low resolution version, downloaded in late 2012 as:
World_EEZ_v7_20121120_LR.zip).
References
R Core Team (2014). R: A language and environment for statistical computing. R Foundation for Statistical
Computing, Vienna, Austria. URL http://www.R-project.org/.
Roger Bivand and Colin Rundel (2014). rgeos: Interface to Geometry Engine - Open Source (GEOS). R
package version 0.3-4. http://CRAN.R-project.org/package=rgeos.
Höskuldur Björnsson, Sigurður Þór Jonsson, Árni Magnússon and Bjarki Þór Elvarsson (2014). geo: Draw
and Annotate Maps, Especially Charts of the North Atlantic. R package version 1.4-0.
Table A1. Swept area estimates of NEA mackerel biomass in the different Exclusive Economic Zones (EEZs)
according to the international coordinated ecosystem (IESSNS) survey in July-August 2014. Area calculated
from rectangles where mackerel was present. Note that area calculations in the 2013 were incorrect (included
covered rectangles without mackerel).
Exclusive economic zone /
international area
Area
(in thous. km2)
Biomass
(in thous. tonnes)
Biomass
(%)
EU 101 444 5.8
Norwegian 721 2114 27.5
Icelandic 587 2866 37.3
Faroese 268 795 10.3
Jan Mayen 172 241 3.1
International north 260 579 7.5
International west 147 225 2.9
Greenland 358 321 4.2
Spitzbergen 81 103 1.3
Total 2695 7688 99.9

42
Toktrapport/Havforskningsinstituttet/ISSN 1503 6294/Nr. 10 – 2016
A n n e x 2
WGIPS working document 01
Comparing "banana" and "straight forward" towing for mackerel
Teunis Jansena,b, Leif Nøttestadc, Guðmundur J. Óskarssond , Kjell Rong Utnec
a ) GNI – Greenland Institute of Natural Resources, Nuuk, Greenland
b ) DTU AQUA – National Institute of Aquatic Resources, Charlottenlund, Denmark
c ) IMR – Institute of Marine Research, Nordnesgt 33, 5005 Bergen, Norway
d ) MRI - Marine Research Institute, PO Box 1390, Skulagata 4, 121 Reykjavik, Iceland
Corresponding author: Teunis Jansen; GNI – Greenland Institute of Natural Resources, Nuuk, Greenland;
Tel.: +4530667840; Fax: +4533963333; E-mail address: [email protected].

43
Toktrapport/Havforskningsinstituttet/ISSN 1503 6294/Nr. 10 – 2016
Abstract
Mackerel is a fast swimmer that is assumed to avoid disturbances such as the wake of a ship. This is potentially
biasing density estimates of mackerel based on swept-area estimates from surface trawling. Trawling in a straight
line with the trawl in the ship’s wake has therefore been assumed to lead to an underestimate of the mackerel
density in the sea. An alternative trawling strategy has been implemented by the International Ecosystem Summer
Survey in the Nordic Seas (IESSNS), namely trawling in a curve to keep the trawl outside the wake. However, if
mackerel avoids the wake of the ship in a horizontal direction, then the IESSNS solution will lead to an over -
estimation of the true density. Swept area based stock estimates from surface trawling is of great value to stock
assessment of epipelagic fish species, such as the economically and ecologically important North-East Atlantic
mackerel. It is therefore imperative to quantify this bias.
In this study, the effect of horizontal avoidance on catch rates of mackerel was estimated from a series of trawl
experiments. The catch rates were not found to differ significantly between straight trawling in the wake and curved
trawling on the side of the wake. It is therefore concluded that there is no substantia l horizontal avoidance of the
ship and the ships wake. Vertical avoidance was not investigated in the present study.
Straight trawling in the general direction of the survey is easier and less time consuming than curved trawling. It is
therefore recommended that standardized surface trawling for mackerel is done in a straight direction, if the results
presented herein can be supported by additional experiments (more data). It is furthermore needed to verify if the
trawl was directly in the wake in all the straight tows. Side-ways drifting due to wind could place the trawl of the side
of the wake so it would in reality resemble a curved haul.
Materials and methods
Experimental surface trawling was done at 21 locations by R/V Árni Friðriksson, M/V Eros and M/V Brennholm
during the International Ecosystem Summer Survey in the Nordic Seas (IESSNS) in mid-summer 2015 (Figure 1). On
each location trawling was done in straight and curved lines, respectively. The survey protocol is available in
Valdemarsen et al. (2014) and (Nøttestad et al., in review). The density of mackerel d (kg nmi-2) was estimated for
each trawl haul by dividing the total catch of mackerel (kg) with an estimate of swept area (= the trawl haul distance
× the horizontal opening of the trawl) (Nøttestad et al., in review; Valdemarsen et al., 2014). The data are plotted in
Figure 2.
The effect on the catch rates of curved trawling relative to straight trawling was estimated as a catchability factor
(CF) for all permutations on each location:
CF = dCurved / dStraight
The box-and-whiskers-plot of CF estimates were made using the “boxplot()”-function in the R package “stats” v.3.0.1
(R Core Team, 2013). Boxes indicate the following quartiles: 25 %, 75 % and 50 % (median). Dots indicate outliers
defined as observations that exceed 0.67 times the quartiles. The whiskers indicate the most extreme observations,
excluding the outliers.
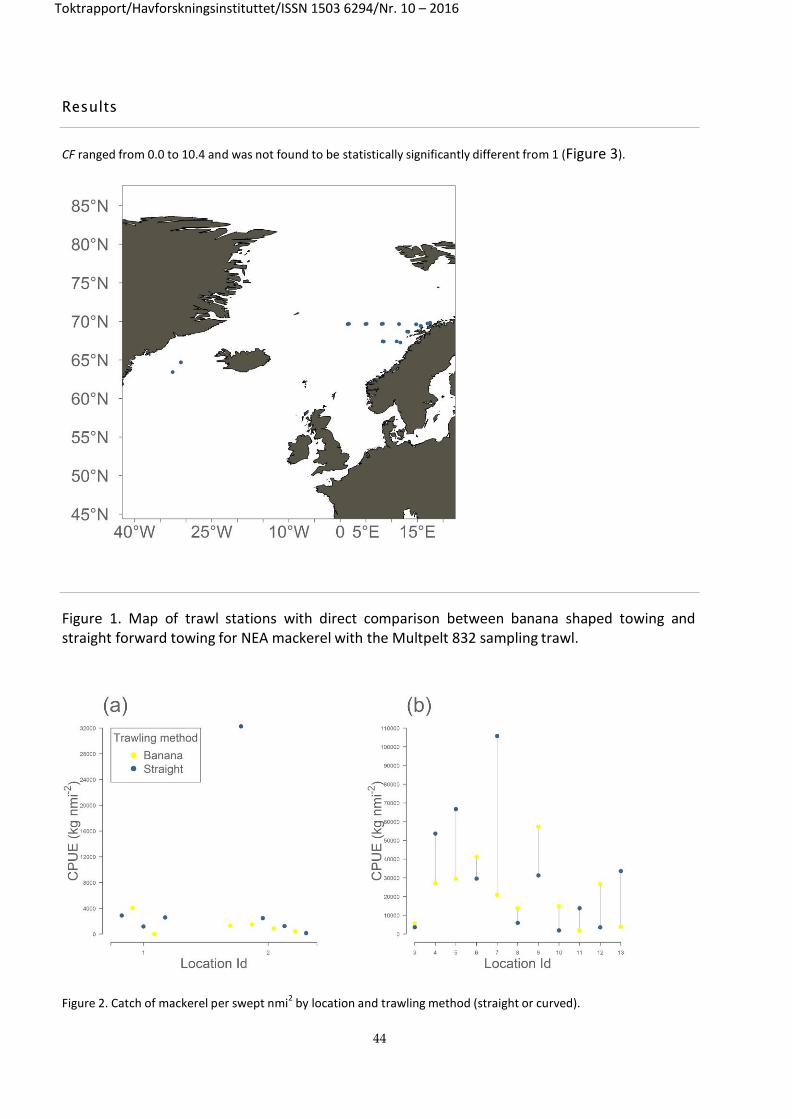
44
Toktrapport/Havforskningsinstituttet/ISSN 1503 6294/Nr. 10 – 2016
Results
CF ranged from 0.0 to 10.4 and was not found to be statistically significantly different from 1 (Figure 3).
Figure 1. Map of trawl stations with direct comparison between banana shaped towing and straight forward towing for NEA mackerel with the Multpelt 832 sampling trawl.
Figure 2. Catch of mackerel per swept nmi2
by location and trawling method (straight or curved).

45
Toktrapport/Havforskningsinstituttet/ISSN 1503 6294/Nr. 10 – 2016
Figure 3. The effect of trawling method on the catch rate indicated by the Catchability Factor (CF). Boxes indicate the following quartiles: 25 %, 75 % and 50 % (median). Dots indicate outliers defined as observations that exceed 0.67 times the quartiles. The whiskers indicate the most extreme observations, excluding the outliers.
References
Nøttestad, L., Utne, K. R., Óskarsson, G. J., Jonsson, S., Jacobsen, J. A., Tangen, Ø, Anthonypillai,
V., Bernasconi, B., Debes, H., Smith, L., Sveinbjörnsson, S., Holst, J. C., Jansen, T., &
Slotte, A. (in review). Quantifying changes in abundance, biomass and spatial distribution
of Northeast Atlantic (NEA) mackerel (Scomber scombrus) in the Nordic Seas from 2007
to 2014. ICES Journal of Marine Science, (accepted with minor revisions).
Valdemarsen, J. W., Jacobsen, J. A., Oskarsson, G. J., Utne, K. R., Einarsson, H. A.,
Sveinbjörnsson, S., Smith, L., Zachariassen, K., & Nøttestad, L. (2014). Swept area
estimation of the North East Atlantic mackerel stock using a standardized surface trawling
technique. Working Document to ICES Benchmark Workshop on Pelagic Stocks
(WKPELA), 17–21 February 2014, Copenhagen, Denmark. 14 pp.
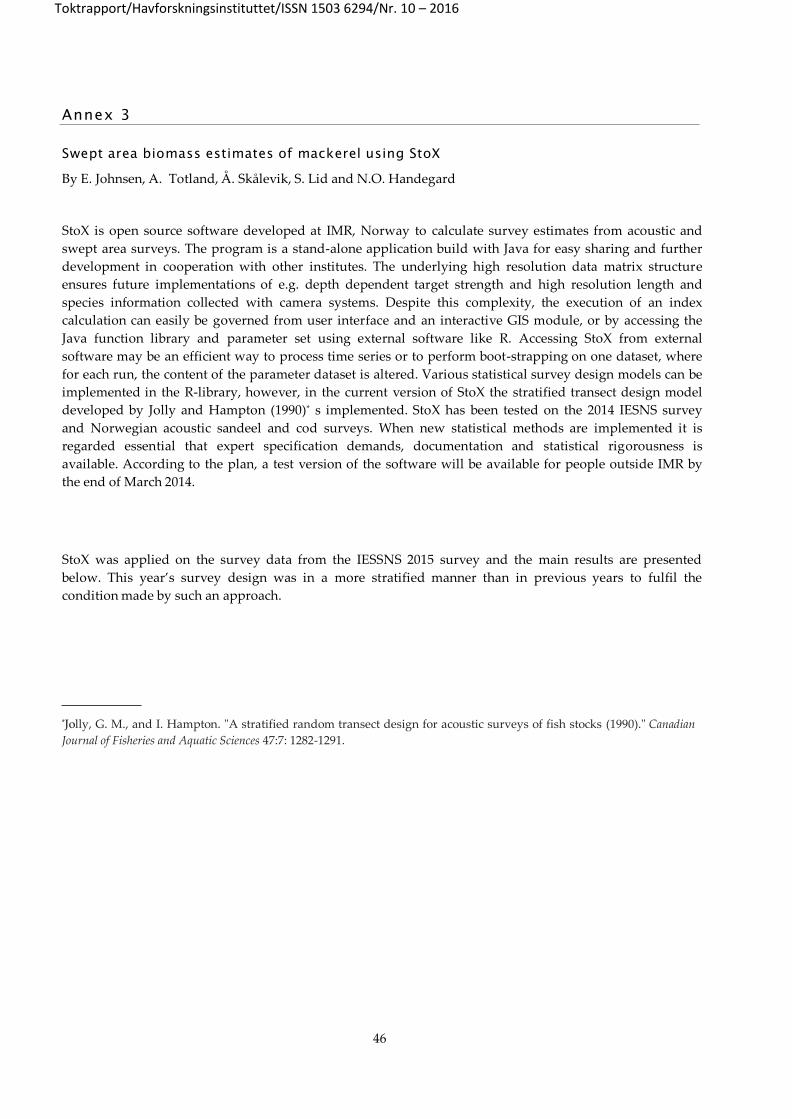
46
Toktrapport/Havforskningsinstituttet/ISSN 1503 6294/Nr. 10 – 2016
A n n e x 3
Swept area biomass estimates of mackerel using StoX
By E. Johnsen, A. Totland, Å. Skålevik, S. Lid and N.O. Handegard
StoX is open source software developed at IMR, Norway to calculate survey estimates from acoustic and
swept area surveys. The program is a stand-alone application build with Java for easy sharing and further
development in cooperation with other institutes. The underlying high resolution data matrix structure
ensures future implementations of e.g. depth dependent target strength and high resolution length and
species information collected with camera systems. Despite this complexity, the execution of an index
calculation can easily be governed from user interface and an interactive GIS module, or by accessing the
Java function library and parameter set using external software like R. Accessing StoX from external
software may be an efficient way to process time series or to perform boot-strapping on one dataset, where
for each run, the content of the parameter dataset is altered. Various statistical survey design models can be
implemented in the R-library, however, in the current version of StoX the stratified transect design model
developed by Jolly and Hampton (1990)* s implemented. StoX has been tested on the 2014 IESNS survey
and Norwegian acoustic sandeel and cod surveys. When new statistical methods are implemented it is
regarded essential that expert specification demands, documentation and statistical rigorousness is
available. According to the plan, a test version of the software will be available for people outside IMR by
the end of March 2014.
StoX was applied on the survey data from the IESSNS 2015 survey and the main results are presented
below. This year’s survey design was in a more stratified manner than in previous years to fulfil the
condition made by such an approach.
*Jolly, G. M., and I. Hampton. "A stratified random transect design for acoustic surveys of fish stocks (1990)." Canadian
Journal of Fisheries and Aquatic Sciences 47:7: 1282-1291.

Toktrapport/Havforskningsinstituttet/ISSN 1503 6294/Nr. 10 – 2016
|47
Table A3. Swept-area biomass estimation of mackerel in July/August 2015 for the whole IESSNS survey area as based on calculation in StoX.
Length cm 1 2 3 4 5 6 7 8 9 10 11 12 13 14 15 Number Biomass Mean Weight (g)
21-22 2407 31209 2407 77.1 22-23 14149 159439 14149 88.7
23-24 25264 251577 25264 100.4
24-25 19922 176217 19922 113.1 25-26 16571 125063 16571 132.5
26-27 11480 877 82059 12357 150.6
27-28 2243 452 16287 2696 165.5
28-29 3255 2728 28960 5983 206.6
29-30 11159 2388 60899 13547 222.5
30-31 49508 14626 3637 262305 67771 258.4
31-32 81179 81789 119326 4441 1001928 286735 286.2
32-33 91746 130611 453376 101837 1386 2525911 778956 308.4
33-34 28672 295352 579940 275095 19750 1415 1142 1266 3650372 1202631 329.5
34-35 6490 160486 492027 350970 41708 27178 7160 293 - 3054724 1089680 356.7 35-36 16292 67670 196225 290306 123461 72019 22435 1464 3532 2037820 793404 389.3
36-37 41272 130274 228463 208552 108507 56141 28670 6354 1901538 810971 426.5
37-38 4434 68604 209499 195014 231726 128000 82889 31754 4750 939 852 2077017 958461 461.5
38-39 13676 30979 158364 131082 140878 103147 65173 20269 10511 2004 1169 1363656 677252 496.6 39-40 2823 23325 57980 85046 74017 58893 48562 22412 18431 10082 624 1407 758636 406200 535.4
40-41 512 11623 26193 38154 30791 24708 12790 3329 4812 987 271932 153898 565.9
41-42 2093 1437 7252 18931 8624 8714 9690 10309 2914 1461 120859 71423 591.0
42-43 1237 1641 14168 10601 615 1122 1502 1770 868 53323 33524 628.7
43-44 339 3582 1624 369 673 679 300 350 11468 7916 690.2
44-45 1652 - 961 1180 4324 11376 8117 713.5 45-46 1549 1836 1549 843.6
46-47 37 47 37 770.0
TSN (1000)
629866
632132
2091490
5372034
4547603
2323577
1992431
1169733
715249
305664
134957
73707
1837
9
4554
679
20012055
TSB (tons) 95292 289102 815127 2100316 1693140 841085 727030 427443 265811 111772 50380 27519 6640 1707 350 7452713 Mean
length (cm)
23.3
31.2
32.7
33.1
34.6
36.0
36.6
36.9
37.3
37.7
38.6
39.6
39.5
39.3
42.6
Mean
weight (g)
103.0
278.3
320.6
333.0
380.4
428.3
446.5
458.2
473.4
470.7
505.0
511.8
500
534
733
372.4
N (%) 3.1 3.2 10.5 26.8 22.7 11.6 10.0 5.8 3.6 1.5 0.7 0.4 0.1 0.0 0.0 100 Biomass
(%)
1.3
3.9
10.9
28.2
22.7
11.3
9.8
5.7
3.6
1.5
0.7
0.4
0.1
0.0
0.0
100
47

Toktrapport/Havforskningsinstituttet/ISSN 1503 6294/Nr. 10 – 2016
Figure A3.1. Map showing the ten stratum used in StoX for estimation of mackerel biomass indices in July-
August 2015 during the IESSNS.
48