Embed Size (px)
Citation preview

Working for the enemy: An examination of investment banker job changes
Daniel Bradley Clemson University
HyungSuk Choi
Georgia Institute of Technology
Jonathan Clarke Georgia Institute of Technology
August 2, 2007
Comments Welcome We thank Jack Cooney and Jay Ritter for helpful discussions.

Working for the enemy: An examination of investment banker job changes This paper examines the impact on investment bank deal flow of investment bankers that switch to rival firms between 1998 to 2004. We generally find a symmetric decline (increase) in market share for the firm losing (gaining) the investment banker for both equity and merger and acquisition-related transactions. After controlling for deal and bank-level characteristics, hiring a banker from an investment bank with a more prominent industry presence has a substantial positive (negative) impact on the hiring (losing) bank. After the banker switches firms, we find a significant amount of business follows the banker from the old bank to the new bank. The stock price reaction to the bank gaining the banker is significantly positive, but we find no similar negative reaction to the bank losing the banker. Overall, our results suggest human capital is a critical element of investment banking deal flow.

1
Working for the enemy: An examination of investment banker job changes
1. Introduction
What influences the decision makers at firms to choose a particular investment bank?
Since investment banking is a commodity business and competition to win mandates is
fierce, reputation and relationships are critical. Reputation can stem from the entity itself
(name brand recognition) or from the human capital that it employs.
Much of the academic literature has focused on the reputational capital of
investment banks and the certification role that it plays in the pricing of securities. 1
Significantly less attention has been given to the role of human capital in the investment
banking business. A few exceptions exist. Dunbar (2000) finds that for established banks, an
increase in the quality of the bank’s analysts has a positive impact on market share. Clarke,
Khorana, Patel, and Rau (2006) investigate the impact of Institutional Investor all-star analyst
job switches on market share and investment banking deal flow to the banks affected by the
switch. They find that the bank gaining the all-star analyst increases its market share for
equity transactions, but find no such evidence for other corporate transactions.
While analysts may be a sweetener to a deal and perhaps the reason why a bank is
chosen, we conjecture that the investment bankers are ultimately responsible for investment
banking business.2 Thus, we attempt to quantify the impact of key investment bankers by
following a similar approach to Clarke et al. (2006).3 That is, we examine the effect of
investment banker job changes on a bank’s market share using a novel dataset of 354
1 See, for example, Carter and Manaster (1990), Megginson and Weiss (1991), Carter, Dark, and Singh (1998), and Loughran and Ritter (2004). 2 Judging by their pay, anecdotal evidence suggests that investment bankers have a big impact on generating business. For instance, the Wall Street Journal estimates that at top-tier banks in 2006, senior bankers at the Global Head or Managing Director level can expect bonuses between $10 and $12 million and $2.2 and $3.8 million, respectively. 3 It’s important to note that investment banker turnover and analyst turnover appear to be separate events. That is, investment bankers rarely switch firms in tandem with an analyst.

2
investment banker switches over the 1998 to 2004 period. We focus on three main
questions. First, we examine the market share changes to the investment banks affected by
the switch (the gaining and losing banks) and evaluate the cross-sectional variation in these
changes. Next, we examine the abnormal stock price reactions to the banks gaining and
losing the banker. Finally, we examine the deal flow of the investment banks after the switch
to determine if the banker has the ability to generate new clients for the firm and/or brings
her old clients to the new bank.
We document four main empirical findings. First, we find that the banks gaining the
banker increase their average aggregate and/or industry-level market share at the expense of
the bank losing the banker. Both equity and M&A market shares are impacted. On average,
the impact to the gaining and losing bank for stock transactions at the aggregate bank-level is
approximately 0.30 percent. Thus, with an average of $125 billion of equity transactions
completed per year during our sample period, this transcends into $375 million in deal value.
For M&A deals, we find a similar 0.30 percent aggregate effect for banks gaining and losing
a banker translating into $4.5 billion in M&A deal value gained and lost to the respective
banks. These numbers are statistically and economically important.
Second, we find that the market rewards banks that gain an investment banker, but
we find no similar negative reaction for banks losing the banker. The cumulative abnormal
return (CAR) for gaining banks is a statistically significant 1.8 percent in the (-5, +5)-day
window around the announcement. For losing banks, the corresponding CAR is
indistinguishable from zero.
Third, we find that the most important determinant of changes in industry level
market share is the ability to hire an investment banker from a rival firm that has a greater
industry presence than the hiring firm. We find doing so translates anywhere from a .7

3
percent to 2.9 percent increase in market share to the hiring bank depending on the model
specification and type of transaction (equity or M&A). Likewise, it corresponds to a 1.0
percent to 2.5 percent decline in market share for the bank losing the investment banker.
This effect is distinct from the overall reputation of the investment bank.
Finally, we find evidence that a significant amount of business follows the
investment banker from their old bank to their new bank. The gaining bank generates a
significantly greater percentage of business from the losing bank’s previous clients compared
to the losing bank’s percentage of the gaining bank’s clients. This result holds both at the
aggregate and industry levels and both for equity and M&A transactions.
The rest of this paper will proceed as follows. Section 2 presents the motivation of
this paper and a discussion of the related literature. Section 3 explains the data and empirical
methods, while Section 4 reports our empirical results. Finally, section 5 concludes.
2. Motivation
Our paper is most closely related to the literature examining the competition for
investment banking deal flow. We briefly discuss this literature below and discuss our
contribution.
Much of investment banking business is characterized by on-going relationships rather
than arms-length transactions. For example, Corwin and Schultz (2005) note that
approximately 70 percent of firms stay with their initial underwriters from their IPO to their
subsequent equity offers. Drucker and Puri (2005) examine lending by banks and its
influence on future business. They find that concurrent lending as well as prior lending by
the underwriter to the firm significantly affects firm–underwriter pairings and the pricing of
underwriting services. Rau (2000) focuses on M&A deal flow and finds that market share is
unrelated to the performance of deals completed in the past. However, there is a strong

4
positive relation between market share and the percentage of deals completed in the
past. He notes that the contingent fee structure common in M&A deals forces banks to
focus on completing deals.
The papers above indirectly examine investment banking deal flow. Dunbar (2000)
directly examines deal and issuer characteristics that influence market share for banks that
participate in IPOs during 1984 and 1993. He finds a positive association between long-run
performance and market share, but banks that underprice too much, limit their industry
presence, and are associated with withdrawn IPOs lose market share.
Krigman, Shaw, and Womack (2001) examine firms that switch underwriters from their
IPO to SEO. They find that an important determinant of switching is to graduate to more
prestigious underwriters with better research coverage. Their findings are corroborated with
survey results from CFOs of companies that ultimately switched underwriters. Interestingly,
they find that underpricing is not an important factor in the switch decision.
Cliff and Denis (2004) argue that issuing firms pay for research coverage through
underpricing. Since the lead underwriter controls the allocation of shares, they will choose to
allocate hot IPOs to favored clients and reap quid quo pro profits.4 Consistent with their
arguments, they find that lead underwriters with Institutional Investor All-Star analysts are
significantly more underpriced. Loughran and Ritter (2004) also attribute part of the large
rise in underpricing through time, particularly during the 1999-2000 internet frenzy, to
“analyst lust.” That is, firms were willing to leave large amounts of money on the table for
favorable research coverage from prominent all-star analysts.
4 The practice of “spinning,” allocating shares to firm-level decision makers as a bribe for future deal flow and “laddering,” allocating shares to institutions who pay abnormally high commission rates are now explicitly banned.
5
While these papers relate investment banking deal flow to bank or analyst reputation,
very few papers focus on the impact of individual talent. Clarke, Khorana, Patel, and Rau
(2006) try to measure the impact of all-star analysts. They investigate the effects of job
switches of all-star analysts on market share and investment banking deal flow. By focusing
on career changes, they can isolate the impact of key personnel. They find some evidence
that the bank gaining the all-star analyst increases its market share, but these findings only
show up for equity transactions.
Though some marginal evidence exist that analysts impact deal flow, it seems
reasonable to conjecture that investment bankers have a more direct influence. Despite the
intuitive appeal of this premise, no study that we are aware of investigates this notion.
Perhaps this is because data on investment bankers is difficult to obtain. Fortunately, we
overcome this obstacle and attempt to fill this missing void.
3. Data and methods
3.1 Sample Description
We hand collect our sample of cases where investment bankers switch firms from
Investment Dealer’s Digest (IDD). IDD is published on a weekly basis and has been used as a
data source in a number of academic studies including Carhart (1997). The sample is
compiled from the “Out Takes” section of the magazine, which discusses movement of key
personal within the investment community. From this section, we are able to compile a list
of investment bankers who moved from one investment bank to another over the period
1998 to 2004. In addition to the name of the banker and the investment banks switched to
and from, the magazine also identifies the banker’s title (i.e., Head, Managing Director, etc.),
primary industry specialization, and whether the banker’s entire team switched as well. Our
initial sample consists of 354 cases of turnover.

6
***Insert Table 1 about here***
Panel A of Table 1 shows the frequency of banker turnover by year. The highest
incidence of banker turnover occurs in 2000, when there were 98 cases, or about 25 percent
of the sample. Panel B reports the titles of the bankers that switched. The majority of the
reported cases occurred at the managing director level or higher. Only 77 of our 354
observations were at the director level or lower.5
While Clarke et al. (2006) classify analysts switching employers into the entire span of
59 GICS industries, it appears that investment bankers specialize in broader industries.
Therefore, we classify bankers into 9 GICS sectors.6 Panel C shows that over half of the
sample falls in the Information Technology, Financials, Consumer Discretionary, and Health
Care sectors. For 105 bankers, we cannot determine an industry specialization. These
observations are eliminated when we consider industry level market shares.
3.2 Market share calculations
The key variable of interest throughout much of this paper is market share. 7 We
calculate market share using gross proceeds as in Dunbar (2000) and Clarke et al. (2006).8
Specifically, we compile a comprehensive database of investment-banking deals (equity
issues and mergers and acquisitions) between 1996 and 2006 from Thompson Financial
Securities New Issues and Mergers and Acquisitions databases. Equity issues include 5,367
SEOs and 4,257 IPOs. Mergers and acquisitions include all U.S. merger and acquisitions
5 IDD likely reports only the career changes of key personnel, which explains the lack of observations at the director level or lower. 6 We use GICS codes in preference to other classification schemes used in the literature (such as Standardized Industry Classification System (SIC) codes, North American Industry Classification System (NAICS) codes or the Fama-French (1997) industry groupings (FF)) since Bhojraj, Lee and Oler (2003) show that GICS classifications are significantly better at explaining stock return co-movements, as well as cross-sectional variations in valuation-multiples, forecasted growth rates, and key financial ratios. 7 Eccles and Crane (1988) argue that market share is highly correlated with bank profit. 8 Calculating market share based on number of deals yields qualitatively similar conclusions.

7
where the deal value and advisor(s) were disclosed during our sample period. In all, we
consider 23,466 transactions counting acquirers and targets separately.
From the new issues database, we obtain the following information for every initial
public offering and seasoned equity offering: the issuer name and cusip; the filing and issue
date; the identity of the investment bank retained by the issuer; and the size of the deal.
From the mergers and acquisitions database, we obtain information on the identity of the
target and acquirer, the announcement and effective dates of the transaction, the size of the
deal, and the advisors to both sides of the transaction. In subsequent cross-sectional tests,
we also use a variety of deal-specific information as independent variables to control for
various joint effects.
We use the above databases to calculate both an aggregate market share and industry
market share for the bank the banker is switching from (original bank), and the bank the
banker is switching to (new bank). Industry market share is calculated as the gross proceeds
raised by an investment bank in a particular GICS sector divided by total gross proceeds of
all deals completed in that particular sector. Both before and after switching market shares
are calculated using two years of data. Industry classifications are based on the 9 GICS sector
codes from the COMPUSTAT database.
For those bankers that are active in multiple sectors, we add up their gross proceeds
across all industries to compute market share. In the case of multiple advisors, we credit
each advisor with a 1/N portion of the deal. Our sample is characterized by a number of
large mergers between investment banks. In appendix A, we discuss how we calculate
market share for the banks involved in the mergers.

8
3.3 Measuring Bank Reputation
In our empirical tests, we distinguish between the reputation of the investment bank
as a whole and the investment bank’s reputation in an industry, because some investment
banks tend to specialize in a particular industry in which they have expertise and while their
aggregate market share may be relatively small, they could have a substantial presence in their
niche market. For example, Thomas Weisel Partners had an aggregate M&A market share of
only 1.1 percent in the two years prior to losing a technology banker to First Union
Securities in October 2000. However, their market share in the technology sector was 8.8
percent over the same period.
In order to measure an investment bank’s overall reputation, we use the bank’s
Carter-Manaster ranking as updated by Loughran and Ritter (2004). The ranking ranges from
1 to 9, with 9 representing the highest possible prestige ranking. We measure a bank’s
reputation in a given GICS sector by examining their market share within that sector over
the two years prior to the banker’s job change.
4. Results
4.1 Market share changes surrounding banker turnover
In this section, we examine the impact of banker job changes on investment banker
market share. We investigate market share changes for equity underwriting deals (initial
public offerings and seasoned equity offerings) and merger and acquisition transactions at
the aggregate bank level and also for the banker’s primary industry of specialization.
Although our sample has 354 cases of banker job changes, several of these cases
involve teams of bankers switching. For purposes of examining market share changes, we
9
condense these cases of teams changing jobs into a single observation.9 For example, three
bankers (a managing director and two senior VPs) covering the Financial Sector departed
Goldman Sachs for Lehman Brothers on March 1st, 1999. Rather than treating this as three
independent observations, we compress it into a single observation. After making this
adjustment we are left with 278 observations. We can identify the banker’s industry in 203
cases.
***Insert Table 2 about here***
We report univariate market share results for both the bank gaining and losing the
banker at the aggregate-level and industry-level in Table 2. In this table we report two cases:
“Restricted” and “Unrestricted.” Only those cases in which the bank losing the banker had a
positive market share in the two years prior to the switch are included in the “Restricted”
results. Our intent with this filter is to focus on the subset of bankers that have a track
record of generating investment banking deal flow over the past two years. This restriction
eliminates very small banks that often don’t generate underwriting business on a consistent
basis. “Unrestricted” does not impose this requirement. We calculate market share for equity
offerings, M&A transactions, and equity and M&A transactions combined.
In Panel A, we present results at the aggregate level. For the case of equity with the
restrictions, banks gaining a banker increase their market share by a significant 0.31 percent,
on average (from 2.70 to 3.00 percent), whereas the bank losing the banker decreases its
market share by an almost identical -0.29 percent (from 7.01 to 6.72 percent), which is
significant at the 10% level. To put this in perspective, an increase of 31 basis points would
transcend into an increase of over $375 million in equity business based on the average
9 A legitimate concern to our analysis is that teams of not only bankers, but also analysts switched simultaneously. Thus, it could be that analysts are driving our results and not investment bankers. We examine analyst switching and have found only 4 instances of which an analyst simultaneously left with a banker.

10
annual equity transactions over our sample period. For M&A business, the gaining bank
increases its market share by 0.34 percent while the losing bank drops 0.32 percent of its
market share. In a typical year, this would translate into $5.2 billion of M&A gross deal value
for the gaining bank and $4.9 billion in lost business for the losing bank. The next column
simply combines stock and M&A business and produces similar results.
The next three columns in Panel A of Table 2 eliminate the restriction imposed
previously that banks must have had a positive market share in the 2 years prior to the
switch. In the case of equity offerings, the decline in market share for the bank losing the
banker is no longer significant. In all other cases, however, the magnitude of the change in
market share and the associated significance level are similar to the results reported.
Bankers are likely to have the most significant impact on the industry in which they
specialize. In Panel B of Table 2, therefore, we report sector-level results based on GICS
sector classifications in Table 1. The results are qualitatively similar to those in Panel A at the
aggregate level. That is, gaining a banker is associated with an increase in market share.
Likewise, banks display a decrease in market share if they lose a banker. However, while the
results all have the correct expected signs, the difference in market share is only statistically
significant for losing banks in M&A transactions.
For the case of equity with the restrictions, banks gaining a banker increase their
industry-level market share by a 0.22 percent, on average (from 2.51 to 2.73 percent),
whereas the bank losing the banker decreases its industry-level market share by a -0.25
percent (from 7.51 to 7.26 percent). To put this in perspective, an increase of 22 basis points
would transcend into an increase of over $24 million in equity business based on the average
annual equity transactions in each sector over our sample period. For M&A business, the
gaining bank increases its industry-level market share by 0.08 percent while the losing bank

11
drops significant 0.83 percent of its industry-level market share. In a typical year, this would
translate into $177 million of M&A gross deal value for the gaining bank and $1.8 billion in
lost business for the losing bank.
The results in this subsection suggest that investment bankers indeed have an
economic and significant effect on the market shares to the previous and current employers
once they switch firms. We next evaluate whether or not the market perceives such switches
as important.
4.4 Event study results
If market participants view investment banker switching as an important event, the
announcement return should be positive for banks hiring a banker and similarly negative to
the bank losing the banker. Our market analysis is limited to investment banks in our sample
that our publicly traded, reducing our sample size to 173 observations for the bank losing
the banker and 135 observations for the bank gaining the banker.
We calculate market model returns using the date the job change was reported in
Investment Dealer’s Digest as the event date.11 Since IDD is published on a weekly basis, the
announcement date could be off by several days. Therefore, we perform a Lexis-Nexis
search for each of the bankers in our sample in an effort to find the departure date. We are
able to match approximately 1/3 of our sample. Further, we focus our attention on windows
at least 5 trading days prior to the published IDD date, which should be large enough to
encompass the actual announcement date for those observations that we were unable to
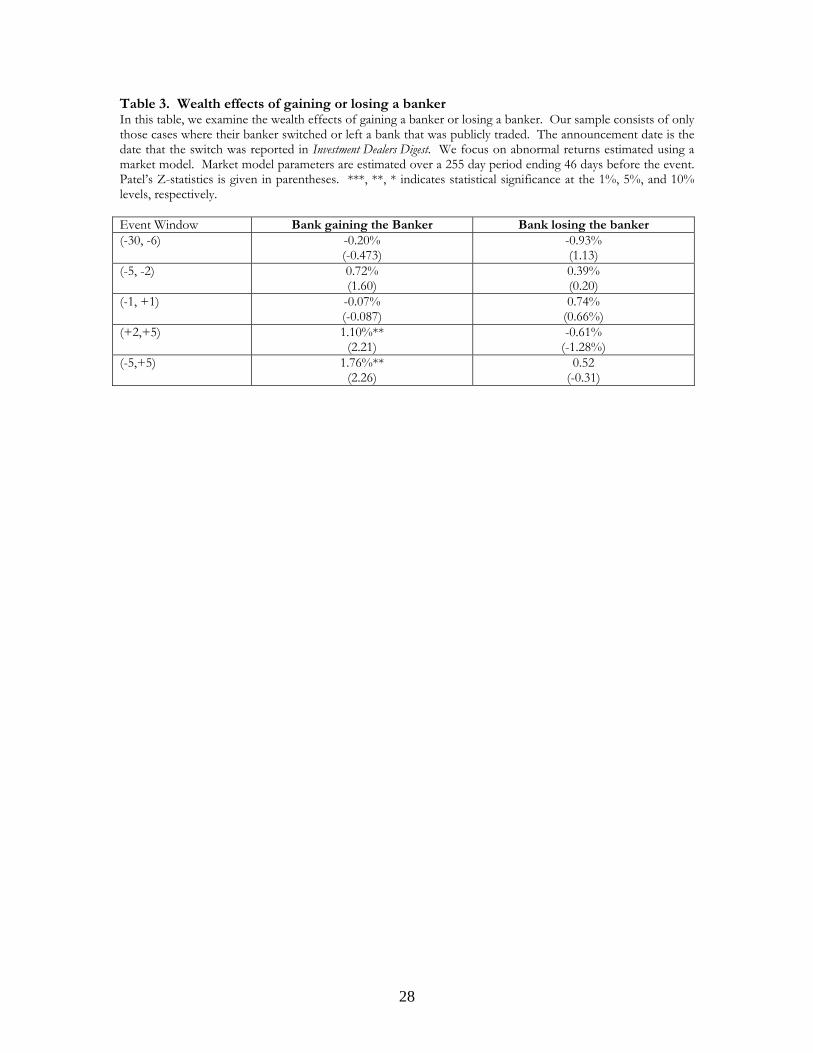
find. The method for calculating abnormal returns and results are presented in Table 3.
***Insert Table 3 about here***
11 We obtain qualitatively similar results using a market-adjusted return specification with either the value-weighted or equally-weighted index.

12
Before the switch for the gaining bank (windows -30,-6 and -5,-2), abnormal returns
are indistinguishable from zero. While the (-1,+1) window is not significantly different from
zero either, both the (+2,+5) and (-5,+5) are significant at the 5 percent level. Again, as we
emphasized earlier, the (-1,+1)-day window most likely does not capture the actual event
date for two-thirds of our sample and thus we focus on a larger window.
For the losing bank, while the (-2,+5)-day window is negative, it is not significantly
different from zero. Furthermore, the (-1,+1)-day window is positive, albeit not significant.
Thus, while the market views the hire of an investment banker positively, it does not seem to
react to the announcement of a departure.
4.3 Determinants of market share changes
We now attempt to model what banker and bank-related characteristics influence
changes in market share at the industry level. We define Managing Director to take the value of
one if the switching banker is a managing director or higher. The assumption is that more
senior bankers should have a larger impact on market share changes. We capture whether
the banker moves from a more reputable bank (Higher Bank Reputation) as a control variable,
but the effect is ambiguous. Less prestigious banks may have more difficulty in generating
deal flow. Thus, holding all else constant, a banker may simply be more successful at a more
reputable firm. On the other hand, hiring a banker from a more reputable firm might allow a
smaller firm to significantly increase its market share. Finally, we include a variable to
measure whether the banker comes from a bank with a more established industry market
share, Higher Industry Reputation. This variable takes the value of one if the bank losing the
banker has a higher industry market share and zero otherwise. As mentioned earlier, some

13
banks have niche investment banking departments in certain industries though the bank
entity may not be competitive relative to other banks.
In addition to banker characteristics, we also consider a number of deal
characteristics. Dunbar (2000) examines market share changes in the U.S. IPO market and
finds that abnormal underpricing, stock price performance, fees, and percentage of
withdrawn deals are related to market share changes for reputable banks. Therefore, we
include measures for both IPOs and SEOs in our regression models. Each of these variables
is estimated at the industry level following the approach in Dunbar (2000).12 Abnormal IPO
fees and Abnormal SEO fees gauge the relative pricing structure of banks. Banks that offer
lower fees may see an increase in their business. Abnormal IPO 1-year return and Abnormal
SEO 1-year return measure the 1-year performance of each type of security offering by the
underwriter. Investment banks that have positive abnormal performance might see an
increase in market share if their deals perform well post-issuance. Abnormal IPO First day
return and Abnormal SEO First day return is a relative measure of how much money is left on
the table. Leaving too much money on the table may cause banks to lose market share.
Finally, Fraction Withdrawn IPO and Fraction Withdrawn SEO are the percentage of deals that
get filed, but ultimately get withdrawn. Dunbar (2000) finds that banks that have a high
percentage of deals that get withdrawn cause them to lose market share.
Similar to equity transactions, a number of deal characteristics of mergers and
acquisitions are also considered. To measure the announcement effects of M&As, abnormal
announcement day returns are calculated. Abnormal Target Announcement Day Return is the
12 To estimate abnormal spreads for IPOs, for example, we pool all IPOs that occurred in the banker’s industry in the two years prior to the switch. Next, we regress the spread on gross proceeds and the logarithm of gross proceeds. For each IPO, the residual from this regression is taken to be a proxy for the abnormal spread. We average the abnormal spread for each IPO where the banker’s firm acted as the underwriter. We follow a similar approach to estimate the abnormal spread for SEOs.

14
actual minus predicted announcement day return. Predicted values are taken from the
regression model, Percentage Target Announcement-day return = Gross deal values + Logarithm of
gross deal values, using target deals advised by the bank from four years before the deal
through the year of the deal. Abnormal Acquirer Announcement Day Return is the actual minus
predicted announcement day return. Predicted values are taken from the regression model,
Percentage Acquirer Announcement-day return = Gross deal values + Logarithm of gross deal values,
using acquirer deals advised by the bank from four years before the deal through the year of
the deal. Fraction Withdrawn Target is the value of deals the advisor participated in on the
target side that were unsuccessful over the two year period before the banker switch,
measured at the expected target deal value divided by the value of withdrawn deals plus
successful deals. Fraction Withdrawn Acquirer is the value of deals the advisor participated on
the acquirer side that were unsuccessful over the two year period before the banker switch,
measured at the expected acquirer deal value divided by the value of withdrawn deals plus
successful deals.
***Insert Table 4 about here***
Panel A of Table 4 examines changes in market share for equity deals. In each pair of
regressions, we first only include key banker variables and then introduce the various
controls. Again, we run separate models for the restricted and unrestricted cases defined
previously. In the first model, hiring a banker from a more prestigious investment bank is
not related to market share gains; however, we find hiring a banker from a bank with a more
dominant industry presence increases market share by 1.1 percent. Likewise, hiring a banker
at the Managing Director level or higher increases market share by 1.3 percent. Both of these
variables are significant at the 10 percent level.

15
When we introduce the control variables in the next model, high industry reputation
becomes insignificant, but Managing Director remains significant at the 10 percent level.
Charging high IPO fees reduces market share (Abnormal IPO fees), but puzzling is that
charging high SEO fees marginally increases market share. The aftermarket performance of
equity deals completed by underwriters is not related to market share. Underpricing of IPOs
is marginally positively related to market share, but SEO underpricing is not. Finally,
withdrawn IPOs does not influence a bank’s market share, but a higher proportion of
withdrawn SEOs is positively related to market share. This result is also puzzling.
When we restrict the sample to banks that have had a positive market share in the
two years before the switch we find Higher Industry Reputation remains positive and significant
at any conventional level. In this more restrictive model, the coefficient suggests that hiring a
banker from an investment bank with a stronger industry niche leads to a 2.9 percent
increase in market share. Albeit positive, Managing Director is no longer significant.
Introducing the control variables does not impact this result. The coefficient on high
industry reputation reduces marginally from 2.9 to 2.7, but remains significant at any
conventional level. The control variables are essentially unchanged from the unrestricted
case. The one exception is that abnormal IPO underpricing in no longer significant. Thus,
for equity deals, the evidence suggests that hiring a senior banker marginally influences
market share, but hiring a banker from a firm with a greater industry presence than its own is
even more important.
For the losing bank in the last four columns, none of the banker-related variables are
significant. The adjusted R2 is essentially zero therefore suggesting the model is not a good
fit. In fact, only abnormal SEO underpricing is significant in the models with control
variables.

16
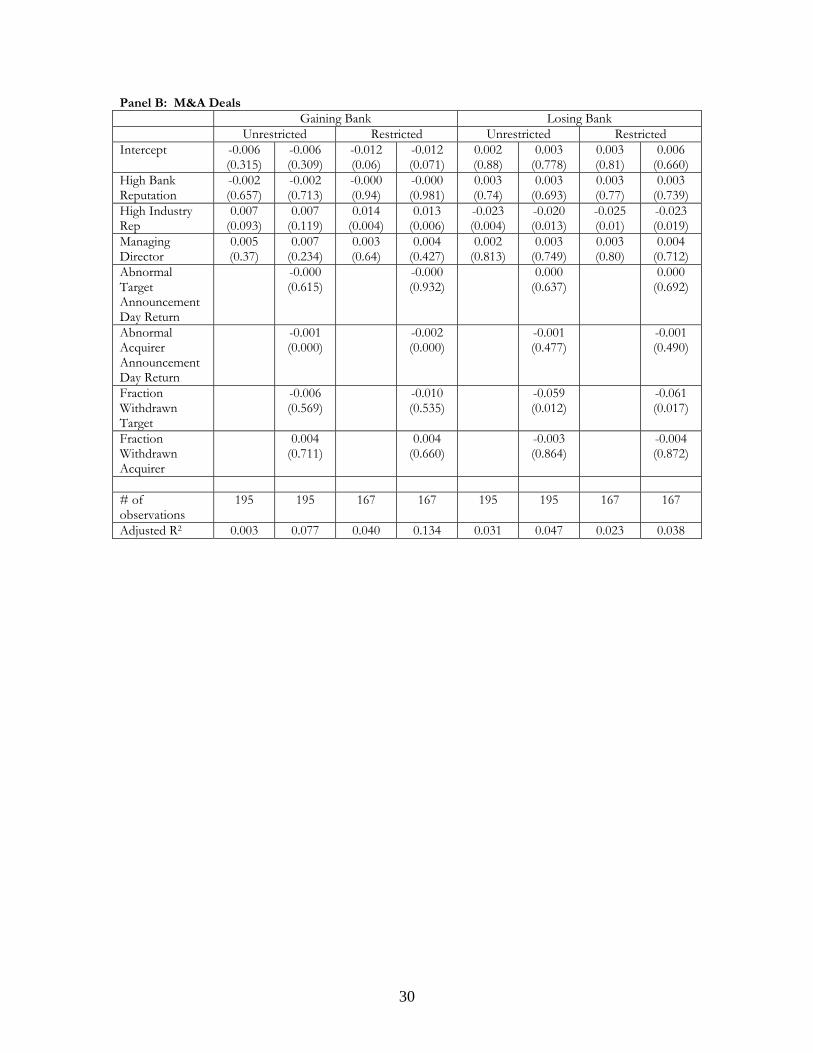
In Panel B, we examine M&A deals. Rather than including equity-related controls,
we introduce M&A-related controls. In the first model in Panel B, similar to the equity
results in Panel A, Higher Industry Reputation appears to be an important attribute in explaining
changes in market share for the gaining bank. In the unrestricted case, hiring a banker from a
more active industry department increases the bank’s market share by about 0.7 percent.
Also similar to the equity results, hiring a banker from a more prestigious investment bank
does not influence M&A market share.
When we add the control variables in the next model, industry reputation becomes
insignificant (p-value=.119). Surprisingly, Acquirer Abnormal Announcement day Return is
negatively significant. M&A deals that are terminated do not influence market share changes.
In the restricted case where banks had to participate in prior M&A deals, Higher
Industry Reputation is highly significant with a coefficient of 1.4 percent implying an increase in
market share of 1.4 percent to the bank that hires a banker from a rival investment bank
with a more prominent industry IB department. Adding the controls does not impact this
result, but like the unrestricted case, Acquirer Abnormal Announcement day Return is significantly
negative.
For the bank losing the banker, Higher Industry Reputation is negative and significant in
all four models. The coefficient ranges from 2 percent to 2.5 percent suggesting that losing a
banker to a weaker industry IB department ultimately negatively impacts the losing bank’s
market share by 2 percent to 2.5 percent based on our estimates. We also find that advisors
to the target firm whose deals fall apart lose market share.
Overall, the results from Table 4 suggest that the most important determinant of
market share gains is the ability to hire an investment banker from a more industry-
predominant IB rival. Likewise, losing this key banker can explain market share losses to the

17
losing bank. In the next subsection we try to determine if business follows the banker from
old firm to the new firm.
4.4 Tracing business
Thus far, we have demonstrated significant market share gains and losses accruing to
banks that win and lose a banker, respectively. However, we have not examined the source
of this market share gain. We assume that business is generated in one of three ways. First,
business can come from existing clients. Such repeat business is most likely due to
preexisting relationships the firm had before the banker made the switch. Second, business
can come from entirely new clients. Finally, and perhaps most importantly for this study,
business can be stolen from the firm the banker left.
For this analysis, we assume that a repeat customer did business with the bank within
the past two years. If a firm did not have a transaction two years before an investment
banker switched, but did participate in a deal two years afterwards, we assume that the bank
receiving the mandate is a new client of the bank. In order to test if some business follows
the investment banker from one firm to the other we need a benchmark. For example,
suppose a banker left Credit Suisse for Goldman Sachs. Cliff and Denis (2004) and others
suggest that about 35 percent of IPO issuers switch underwriters from their IPO to SEO.
Assuming that this percentage is in the correct ballpark for our sample, then a substantial
number of clients will leave Credit Suisse. If a switch occurs at random, Goldman Sachs will
likely receive some of Credit Suisse’s former clients due to chance. Thus, it would not be
appropriate to use 0 percent market share as a benchmark. Instead, in this example, we
compare the percentage of business Goldman Sachs receives from Credit Suisse’s former

18
clients and vice versa (the percentage of business Credit Suisse receives from Goldman
Sachs).
***Insert Table 5 about here***
In Panel A, we present where business comes from for the gaining bank. Likewise,
the same is reported in Panel B for the losing bank. Though we present all three categories
for the reader’s interest, the one that is of interest and we focus on is the middle row (“From
the losing bank’s clients) and (“From the gaining bank’s clients). At the aggregate level, a
significant 2.2, 3.3, and 3.6 percent of business generated for equity, M&A, and combined
investment banking, respectively, comes from the banker’s old firm. To put these numbers
in perspective, the average bank in our sample does $6.9 billion in equity business and $96
billion in M&A deals per year. Thus, assuming approximately $100 billion in investment
banking deal value combined, about $4 billion in business switches to the gaining bank from
the old bank. Likewise, the corresponding numbers at the industry level are 4.1, 3.6, and 4.3
percent.
In Panel B, the corresponding numbers are presented for the losing bank. At the
aggregate level, 0.6 percent of equity business comes from the gaining bank’s clients. As
indicated earlier, this compares to 2.2 percent that switched to the banker’s new firm. This
difference of 1.6 percent (2.2 – 0.6) is economically and statistically significant (test statistics
are reported in Panel C). For M&A transactions, 2.1 percent of business the losing bank
does comes from the firm the banker left to (which compares to 3.3 percent in Panel A), a
significant difference of 1.2 percent. If we combine equity and M&A deals, we reach the
same conclusion.
The last three columns present results based on industry market shares as opposed
to aggregate values. Here, the differences are compounded. The difference for equity is 3.4

19
percent (4.1-0.7); M&A is 2.2 percent (3.6-1.4); and combined is 2.8 percent (4.3-1.5). All of
these differences are statistically significant. 13
4.5 Cross-sectional differences
The results in Table 5 strongly indicate that a banker effectively brings deal flow
from her old firm. In addition, Table 4 suggests that the main determinant of market share
changes is the ability to hire a banker from a firm with a more predominant industry focus.
Thus, a natural question is to combine these two independent results to see if the stolen
industry market share is a function of the ability to hire a banker from a rival with a stronger
IB department.
***Insert Table 6 about here***
The dependent variable is the difference in percentage of business that switched to
the respective firms (i.e., the difference between gaining banks in Panel A of Table 5 and
losing banks in Panel B). The independent variables are defined similarly to before, except
now we consider differences between the competing banks. In the equity regressions, for
example, we consider the difference in abnormal IPO fees between the bank gaining the
banker and the bank losing the banker as an independent variable.
Our models are similar to those presented in Table 4 in that in the first model we
only include banker characteristics and then introduce the controls for deal characteristics.14
As shown in the first model for equity deals, Higher Industry Reputation is significant with a
13 A point worth mentioning is that many investment bankers are forced to sign non-compete and non-solicit agreements, which typically are in place up to 18 months once they leave their firm. In all of our analyses, the post-transaction period lasts for two years and thus the banker may not legally be allowed to solicit former clients during most of our post-switch period. This has the effect of biasing our results against us. 14 In unreported results, we also include a variable that controls for the change in market share from 4 years before the switch to two years prior to the switch. A concern with this analysis is that investment bankers may try to sway their former colleagues at their old bank to switch to their new firm. Thus, this variable is designed to capture the gradual trend in relative market share changes between banks prior to the banker’s switch. Our results are qualitatively similar with the inclusion of this control variable.

20
coefficient of 3.52 percent (p-value=.03). The coefficient does not change when controls are
introduced and the statistical significance is qualitatively similar. The only control variable
that is significant is Abnormal first day return suggesting that the bank with higher underpricing
steals business from the competing firm.
We report similar regressions for M&A industry level market share. Initially, we
consider only banker characteristics and then we incorporate deal characteristics. Similar to
the results for equity deals, we find that the coefficient for Higher Industry Reputation is
positive and highly significant, suggesting that banks who higher a banker away from a firm
with a high industry reputation tend to steal business away. We also find that adding a
banker from a high reputation bank has a negative and significant effect. We find some
evidence that the banks with lower relative target returns tend to lose investment-banking
business, while firms with higher acquirer first day returns tend to gain investment banking
business.
In sum, bankers departing from banks with high industry reputation are more likely
to steal clients away from their old firms. The result is significant for both equity and M&A
deals.
5. Conclusions
Our paper adds to the growing literature on the determinants of investment banking deal
flow by showing that human capital is an important factor. In particular, we examine cases
where an investment banker switched from one firm to another and examine the impact to
the respective firms. Thus, this experiment allows us to quantify the influence of human
capital.
We find that the bank gaining the banker is able to increase its market share while the
bank losing the banker experiences an almost symmetric decline in market share. This effect

21
is significant and economically important. We find the ability to hire an investment banker
from a firm that with higher industry dominance than its current position is the most
important determinant of market share changes. The market views a hire positively, but the
departing bank does not elicit a similar negative response. Finally, we find a significant
number of clients follow the banker to the new bank from the old bank. Collectively, our
evidence strongly indicates that human capital is a critical component of deal flow.

22
References
Bhojraj, Sanjeev, Charles M. C. Lee and Derek Oler, 2003, "What's My Line? A Comparison of Industry Classification Schemes for Capital Market Research," Journal of Accounting Research 41(5), 745-774.
Carhart, Mark M., 1997, “On persistence in mutual fund performance,” Journal of Finance 52,
57–82. Carter, Richard B., Frederik Dark, and Ajai Singh, 1998, “Underwriter Reputation, Initial
Returns and the Long-Run Performance of IPO Stocks,” Journal of Finance 52, 285-311.
Carter, Richard B., and Steven Manaster, 1990, “Initial Public Offerings and Underwriter
Reputation,” Journal of Finance 45(4), 1045-1067. Clarke, Jonathan E., Craig G. Dunbar, and Kathleen H. Kahle, 2005, “All-star Analyst
Turnover, Investment Bank Market Share, and the Performance of Initial Public Offerings,” Working paper, Georgia Tech University.
Clarke, Jonathan E., Ajay Khorana, Ajay Patel, and P. Raghavendra Rau, 2007, “The Impact
of All-Star Analyst Job Changes on their Coverage Choices and Investment Banking Deal Flow,” Journal of Financial Economics 84, 713-737,.
Cliff, Michael T., and David J. Denis, 2004, “Do Initial Public Offering Firms Purchase
Analyst Coverage with Underpricing?” Journal of Finance 59(6), 2871-2901. Corwin, Shane, and Paul Schultz, 2005, “The Role of IPO Underwriting Syndicates:
Pricing, Information Production, and Underwriter Competition,” Journal of Finance 60, 443-486.
Drucker, Steven, and Manju Puri, 2005, “On the Benefits of Concurrent Lending and
Underwriting,” Journal of Finance 60, 2763–99. Dunbar, Craig, 2000, “Factors affecting Investment Bank Initial Public Offering Market
Share,” Journal of Financial Economics 55, 3-41. Eccles, Robert and Dwight Crane, 1988. Doing deals: investment banks at work. Harvard
Business School Press, Boston, MA. Fama, Eugene and Kenneth French, 1997, “Industry costs of equity,” Journal of Financial Economics 43, 153-193. Krigman, Laurie, Wayne Shaw, and Kent Womack, 2001, “Why do firms switch
underwriters?” Journal of Financial Economics 60, 245-284. Loughran, Tim, and Jay R. Ritter, 2004, “Why Has IPO Underpricing Changed Over Time?”
Financial Management 33(3), 5-37.

23
Megginson, William and Kathleen Weiss, 1991, “Venture capitalist certification in initial
public offerings,” Journal of Finance 46, 879-903.
Rau, Raghu, 2000. “Investment Bank Market Share, Contingent Fee Payments, and the Performance of Acquiring Firms.” Journal of Financial Economics, 56, 2, 293-324.

24
Appendix A. Merger Adjusted Market Share
Mergers between banks could reflect incorrectly the effect of the banker switch. For
example, when a (original) bank got acquired by another bank after a banker left, we would
not observe the acquired bank’s market share in the dataset resulting in the decrease of
market share of the original bank after the banker switch. However, this decrease does not
truly reflect the effect of the banker switch. Therefore, we need to adjust for mergers
between banks when we compare the market share around the banker switch.
Market Share of the Original bank:
For the market share of the bank that the banker is switching from (original bank),
there are three cases of bank merger around the switch as described in the following figure.
(Case 1) (Case 2) (Case 3)
Case 1. The original bank (T) got merged by another bank (A) after the banker switch
In this case, we can calculate the correct the gross proceeds raised by the original
bank before the switch but we can get the gross proceeds only up to the bank merger date.
After the merger, we allocate the proportion of the gross proceeds raised by the acquirer
bank to the original bank based on the gross proceeds of the two banks over the period of 2
years before the banker switch. The post switch market share of the original bank is
calculated as the adjusted gross proceeds raised of the investment bank divided by total gross
proceeds of all deals completed.
Case 2. The original bank (A) merged another bank (T) after the banker switch
Similarly to Case 1, we can calculate the correct the gross proceeds raised by the
original bank before the switch but we can get the gross proceeds only up to the bank
Bank T
-2 0 Merger +2
Bank A
Bank A
Bank T
-2 0 Merger +2
Bank A
Bank A
Bank T
-2 Merger 0 +2
Bank A
Bank A

25
merger date. The proceeds after the merger would reflect the effect of the acquired bank.
Therefore, after the merger, we allocate the proportion of the gross proceeds raised by the
acquirer bank to the original bank based on the gross proceeds of the two banks over the
period of 2 years before the banker switch. The post switch market share of the original
bank is calculated as the adjusted gross proceeds raised of the investment bank divided by
total gross proceeds of all deals completed.
Case 3. The original bank (A) merged another bank (T) before the banker switch
In this case, we can calculate the correct the gross proceeds raised by the original
bank only after the bank merger date. Also, it is not clear if the banker was employed by
bank T or bank A. In order to calculate the comparable market share of the original bank
before and after the banker switch, we added the gross proceeds of bank T and bank A to
get the gross proceeds of the original bank over the period of 2 years before the banker
switch. The prior switch market share of the original bank is calculated as the adjusted gross
proceeds raised of the investment bank divided by total gross proceeds of all deals
completed.
Market Share of the NEW bank:
For the market share of the bank that the banker is switching to (new bank), there
would be three cases of bank merger around the switch similar to the described above. The
banker, however, would be eventually employed by the acquiring bank (A) in any case.
Therefore, we added the gross proceeds of bank T and bank A to get the gross proceeds of
the new bank before the merger date. The market share of the new bank is calculated as the
adjusted gross proceeds raised of the investment bank divided by total gross proceeds of all
deals completed.

26
Table 1. Sample Descriptive Statistics This table presents various descriptive statistics for a sample of 354 investment bankers who switched investment banks between 1998 and 2004. The sample is compiled from the weekly Out Takes section published in Investment Dealers Digest. Industry classifications are based on the GICS Sector Classifications. Panel A: Distribution of Sample by year
Year Number of Turnover Observations (%)
1998 8 (2.3)
1999 42 (11.9)
2000 98 (27.7)
2001 40 (11.3)
2002 47 (13.3)
2003 62 (17.5)
2004 57 (16.1)
Total 354 (100.0) Panel B: Distribution of sample by Title
Old Title Number of Observations (%)
VP 37 (10.5)
Director 40 (11.3)
Managing Director 201 (56.8)
Head or high 76 (21.5)
Total 354 (100.0) Panel C: Distribution by Industry
Industry Number of Observations (%)
Information Technology 56 (15.8)
Financials 49 (13.8)
Consumer Discretionary 43 (12.1)
Health Care 38 (10.7)
Industrials 27 (7.6)
Energy 18 (5.1)
Telecommunication Services 14 (4.0)
Materials 3 (0.8)
Utilities 1 (0.3)
Unidentified 105 (29.7)
Total 354 (100.0)

27
Table 2. Market share changes at the aggregate level surrounding the switch This table shows the change in the bank’s market share from the two years prior to the switch of the investment banker (Pre) to two years after the switch (Post). Market share is calculated using deal proceeds for IPO and SEO transactions and the deal value for M&A transactions. In the case of multiple advisors on a particular deal, we give each advisor a 1/n share of the deal, where n is the number of advisors. While Restricted includes only cases where the bank losing the banker had a positive market in the two years prior to the switch, Unrestricted does not impose this requirement. Panel A: Aggregate market share
Market Share Gaining Bank Losing Bank Gaining Bank Losing Bank Gaining Bank Losing Bank Gaining Bank Losing Bank Gaining Bank Losing Bank Gaining Bank Losing BankPre 2.70% 7.01% 2.58% 5.31% 2.56% 5.29% 2.71% 5.97% 2.57% 4.93% 2.58% 5.03%Post 3.00% 6.72% 2.92% 4.99% 2.89% 4.99% 2.96% 5.77% 2.90% 4.64% 2.90% 4.75%Pre - Post 0.31% -0.29% 0.34% -0.32% 0.33% -0.30% 0.25% -0.20% 0.33% -0.29% 0.32% -0.28%(p -value) (0.009) (0.099) (0.000) (0.057) (0.000) (0.047) (0.040) (0.204) (0.000) (0.064) (0.000) (0.054)N 224 237 245 258 250 264 263 278 263 278 263 278
UnrestrictedStock offering M&A Investment Banking
RestrictedStock offering M&A Investment Banking
Panel B: Industry-level market share
Market Share Gaining Bank Losing Bank Gaining Bank Losing Bank Gaining Bank Losing Bank Gaining Bank Losing Bank Gaining Bank Losing Bank Gaining Bank Losing BankPre 2.51% 7.51% 2.46% 6.12% 2.37% 5.89% 2.33% 5.88% 2.35% 5.37% 2.34% 5.39%Post 2.73% 7.26% 2.54% 5.30% 2.45% 5.16% 2.57% 5.75% 2.57% 4.65% 2.56% 4.74%Pre - Post 0.22% -0.25% 0.08% -0.83% 0.08% -0.72% 0.24% -0.13% 0.22% -0.72% 0.22% -0.65%(p -value) (0.525) (0.639) (0.718) (0.058) (0.682) (0.059) (0.410) (0.752) (0.270) (0.062) (0.236) (0.063)N 153 159 170 178 178 186 194 203 194 203 194 203
RestrictedStock offering M&A Investment Banking
UnrestrictedStock offering M&A Investment Banking
28
Table 3. Wealth effects of gaining or losing a banker In this table, we examine the wealth effects of gaining a banker or losing a banker. Our sample consists of only those cases where their banker switched or left a bank that was publicly traded. The announcement date is the date that the switch was reported in Investment Dealers Digest. We focus on abnormal returns estimated using a market model. Market model parameters are estimated over a 255 day period ending 46 days before the event. Patel’s Z-statistics is given in parentheses. ***, **, * indicates statistical significance at the 1%, 5%, and 10% levels, respectively. Event Window Bank gaining the Banker Bank losing the banker (-30, -6)
-0.20% (-0.473)
-0.93% (1.13)
(-5, -2)
0.72% (1.60)
0.39% (0.20)
(-1, +1)
-0.07% (-0.087)
0.74% (0.66%)
(+2,+5)
1.10%** (2.21)
-0.61% (-1.28%)
(-5,+5) 1.76%** (2.26)
0.52 (-0.31)

29
Table 4: Regression analysis of industry market share changes This table presents results from OLS regressions where the dependent variable is the change in industry market share from the two years prior to the switch to two years after the switch. We measure this change in market share at the industry level for both the bank gaining the banker and the bank losing the banker. Industry classifications are based using the 10 GICS sectors. Higher Bank Reputation takes the value of one if the bank losing the banker had a higher Carter-Manaster ranking than the bank gaining the banker. Higher Industry Reputation takes the value of one if the bank losing the banker had a higher industry market share prior to the switch than the bank gaining the banker and zero otherwise. Managing Director is an indicator variable that takes the value of one if the banker was a managing director or higher and zero otherwise. The measures of abnormal performance and abnormal fees are estimated as in Dunbar (2000). P-values are reported in parentheses. In Panel B, Abnormal Target Announcement Day Return is the actual minus predicted announcement day return. The actual return is collected from CRSP. Predicted values are taken from the regression model, Percentage Target Announcement-day return = Gross deal values + Logarithm of gross deal values, using target deals advised by the bank from four years before the deal through the year of the deal. Abnormal Acquirer Announcement Day Return is the actual minus predicted announcement day return. The actual return is collected from CRSP. Predicted values are taken from the regression model, Percentage Acquirer Announcement-day return = Gross deal values + Logarithm of gross deal values, using acquirer deals advised by the bank from four years before the deal through the year of the deal. Fraction Withdrawn Target is the value of deals by the advisor that are unsuccessful target deals over the two year period before the banker switch, measured at the expected target deal value divided by the value of withdrawn deals plus successful deals. Fraction Withdrawn Acquirer is the value of deals by the advisor that are unsuccessful acquirer deals over the two year period before the banker switch, measured at the expected acquirer deal value divided by the value of withdrawn deals plus successful deals. P-values are reported in parentheses. Panel A: Equity Deals Gaining Bank Losing Bank Unrestricted Restricted Unrestricted Restricted Intercept -0.016
(0.051) -0.017 (0.040)
-0.026 (0.012)
-0.025 (0.012)
0.011 (0.40)
0.023 (0.092)
0.009 (0.60)
0.022 (0.240)
Higher Bank Reputation
-0.002 (0.746)
0.001 (0.831)
-0.006 (0.439)
-0.002 (0.823)
-0.010 (0.27)
-0.013 (0.156)
-0.015 (0.23)
-0.019 (0.137)
Higher Industry Reputation
0.011 (0.062)
0.0072 (0.228)
0.029 (0.003)
0.027 (0.009)
-0.002 (0.87)
0.004 (0.703)
0.005 (0.76)
0.011 (0.501)
Managing Director
0.013 (0.099)
0.013 (0.088)
0.006 (0.505)
0.002 (0.863)
-0.009 (0.49)
-0.018 (0.158)
-0.011 (0.50)
-0.021 (0.219)
Abnormal IPO Fees
-0.018 (0.004)
-0.017 (0.016)
0.002 (0.811)
0.002 (0.820)
Abnormal SEO Fees
0.026 (0.049)
0.031 (0.056)
0.024 (0.116)
0.025 (0.159)
Abnormal IPO 1-yr Return
0.026 (0.407)
0.031 (0.363)
-0.072 (0.618)
-0.078 (0.647)
Abnormal SEO 1-yr Return
-0.064 (0.356)
0.091 (0.657)
-0.319 (0.124)
-0.331 (0.171)
Abnormal IPO First day return
0.001 (0.087)
0.001 (0.269)
0.001 (0.45)
0.001 (0.513)
Abnormal SEO First day return
0.000 (0.522)
0.000 (0.269)
0.001 (0.001)
0.001 (0.004)
Fraction Withdrawn IPO
-0.007 (0.512)
-0.015 (0.242)
-0.020 (0.250)
-0.024 (0.307)
Fraction Withdrawn SEO
0.046 (0.039)
0.111 (0.000)
-0.031 (0.390)
-0.044 (0.402)
# of observations
195 195 147 147 195
195 147 147
Adj R2 0.018 0.089 0.053 0.184 -0.005 0.036 -0.008 0.026
30
Panel B: M&A Deals Gaining Bank Losing Bank Unrestricted Restricted Unrestricted Restricted Intercept -0.006
(0.315) -0.006 (0.309)
-0.012 (0.06)
-0.012 (0.071)
0.002 (0.88)
0.003 (0.778)
0.003 (0.81)
0.006 (0.660)
High Bank Reputation
-0.002 (0.657)
-0.002 (0.713)
-0.000 (0.94)
-0.000 (0.981)
0.003 (0.74)
0.003 (0.693)
0.003 (0.77)
0.003 (0.739)
High Industry Rep
0.007 (0.093)
0.007 (0.119)
0.014 (0.004)
0.013 (0.006)
-0.023 (0.004)
-0.020 (0.013)
-0.025 (0.01)
-0.023 (0.019)
Managing Director
0.005 (0.37)
0.007 (0.234)
0.003 (0.64)
0.004 (0.427)
0.002 (0.813)
0.003 (0.749)
0.003 (0.80)
0.004 (0.712)
Abnormal Target Announcement Day Return
-0.000 (0.615)
-0.000 (0.932)
0.000 (0.637)
0.000 (0.692)
Abnormal Acquirer Announcement Day Return
-0.001 (0.000)
-0.002 (0.000)
-0.001 (0.477)
-0.001 (0.490)
Fraction Withdrawn Target
-0.006 (0.569)
-0.010 (0.535)
-0.059 (0.012)
-0.061 (0.017)
Fraction Withdrawn Acquirer
0.004 (0.711)
0.004 (0.660)
-0.003 (0.864)
-0.004 (0.872)
# of observations
195 195 167 167 195 195 167 167
Adjusted R2 0.003 0.077 0.040 0.134 0.031 0.047 0.023 0.038

31
Table 5. Where does the new business come from? This table examines the market share of the bank hiring the investment banker two years after the switch. We traced the investment deals of 19,323 and 11,711 issuers that hired the sample investment banks around the banker switch, respectively. Post switch gross proceeds of the NEW bank are decomposed into three classes – from existing clients of the bank, from the switched banker’s client of the original bank, and from the new clients. When the issuer hired both the NEW bank and original bank prior to the switch, we allocate the post switch gross proceeds of the NEW bank to the first two classes based on each bank’s gross proceeds for the issuer over the 2 years before the switch. Investment bank mergers are adjusted to calculate the gross proceeds. Mean and median proportions are reported. Panel A. Gaining Bank
EquityOffering M&A
InvestmentBanking
EquityOffering M&A
InvestmentBanking
From existing clients Mean 10.9% 11.5% 13.6% 12.8% 8.3% 10.9%(Median) (9.3%) (6.7%) (9.3%) (0.0%) (0.0%) (1.7%)
From the losing bank's clients Mean 2.2% 3.3% 3.6% 4.1% 3.6% 4.3%(Median) (0.0%) (0.9%) (1.5%) (0.0%) (0.0%) (0.0%)
From the new clients Mean 87.0% 85.3% 82.9% 84.6% 88.1% 84.9%Median (86.5%) (90.0%) (86.2%) (100.0%) (100.0%) (93.7%)
N 263 263 263 194 194 194
Aggregate Industry
Panel B. Losing Bank
EquityOffering M&A
InvestmentBanking
EquityOffering M&A
InvestmentBanking
From existing clients Mean 10.1% 13.7% 16.4% 11.8% 13.0% 16.4%Median (9.8%) (10.4%) (14.3%) (6.5%) (2.6%) (7.8%)
From the gaining bank's clients Mean 0.6% 2.1% 2.6% 0.7% 1.4% 1.5%Median (0.0%) (0.6%) (0.6%) (0.0%) (0.0%) (0.0%)
From the new clients Mean 89.6% 84.2% 81.2% 88.7% 85.8% 82.3%Median (89.8%) (87.6%) (83.3%) (93.1%) (97.0%) (91.3%)
N 278 278 278 203 203 203
Aggregate Industry
Panel C. T-test: Gaining Bank – Losing Bank
EquityOffering M&A
InvestmentBanking
EquityOffering M&A
InvestmentBanking
From existing clients t-stat 0.94 -1.85 -2.27 0.42 -2.28 -2.71(p-value) (0.35) (0.07) (0.02) (0.67) (0.02) (0.01)
From the other bank's clients t-stat 4.56 2.47 2.11 2.73 2.6 3.43(p-value) (0.00) (0.01) (0.04) (0.01) (0.01) (0.00)
From the new clients t-stat -2.68 0.81 1.29 -1.72 1.02 1.16(p-value) (0.01) (0.42) (0.20) (0.09) (0.31) (0.25)
Aggregate Industry

32
Table 6. Explaining the amount of business that switches with the banker The dependent variable is the difference in percentage of business that switched to the respective firms. Industry classifications are based using the 10 GICS sectors. Managing Director is an indicator variable that takes the value of one if the banker was a managing director or higher and zero otherwise. Team is an indicator variable that takes the value of one if the switch involved a team of bankers and zero otherwise. Higher Bank Reputation takes the value of one if the bank losing the banker had a higher Carter-Manaster ranking than the bank gaining the banker. Higher Industry Reputation takes the value of one if the bank losing the banker had a higher industry market share prior to the switch than the bank gaining the banker. The measures of abnormal performance, abnormal performance, and abnormal fees are estimated as in Dunbar (2000). P-values are reported in parentheses. Equity Deals M&A Deals Intercept -0.95
(0.68) -0.41 (0.86)
-0.58 (0.77)
-0.55 (0.78)
Higher Bank Reputation 0.03 (0.98)
0.08 (0.96)
-3.41 (0.01)
-3.02 (0.03)
Higher Industry Reputation 3.52 (0.03)
3.21 (0.06)
4.58 (0.00)
4.37 (0.00)
Managing Director 0.91 (0.67)
0.49 (0.82)
1.41 (0.45)
1.41 (0.45)
Equity Characteristics: Difference in Abnormal IPO Fees 0.81
(0.82)
Difference in Abnormal SEO Fees -1.30 (0.47)
Difference in Abnormal IPO 1-yr Return
-22.95 (0.27)
Difference in Abnormal SEO 1-yr Return
-35.75 (0.12)
Difference in Abnormal IPO First day return
0.10 (0.00)
Difference in Abnormal SEO First day return
0.09 (0.56)
Difference in Fraction Withdrawn IPO
-2.05 (0.49)
Difference in Fraction Withdrawn SEO
-2.23 (0.72)
M&A Characteristics: Difference in Abnormal Target Announcement Day Returns
-0.08 (0.08)
Difference in Abnormal Acquirer Announcement day returns
0.38 (0.02)
Difference in Fraction Withdrawn Target
-2.87 (0.48)
Difference in Fraction Withdrawn Acquirer
1.27 (0.67)
# of observations 195 195 195 195 Adj R2 0.01 0.05 0.087