Embed Size (px)
Citation preview
CHAPTER IV
PERFORMANCE ANALYSIS OF WOMEN'S INDUSTRIAL
CO-OPERATIVE SOCIETIES (WICS) IN KERALA
4.1 Introduction
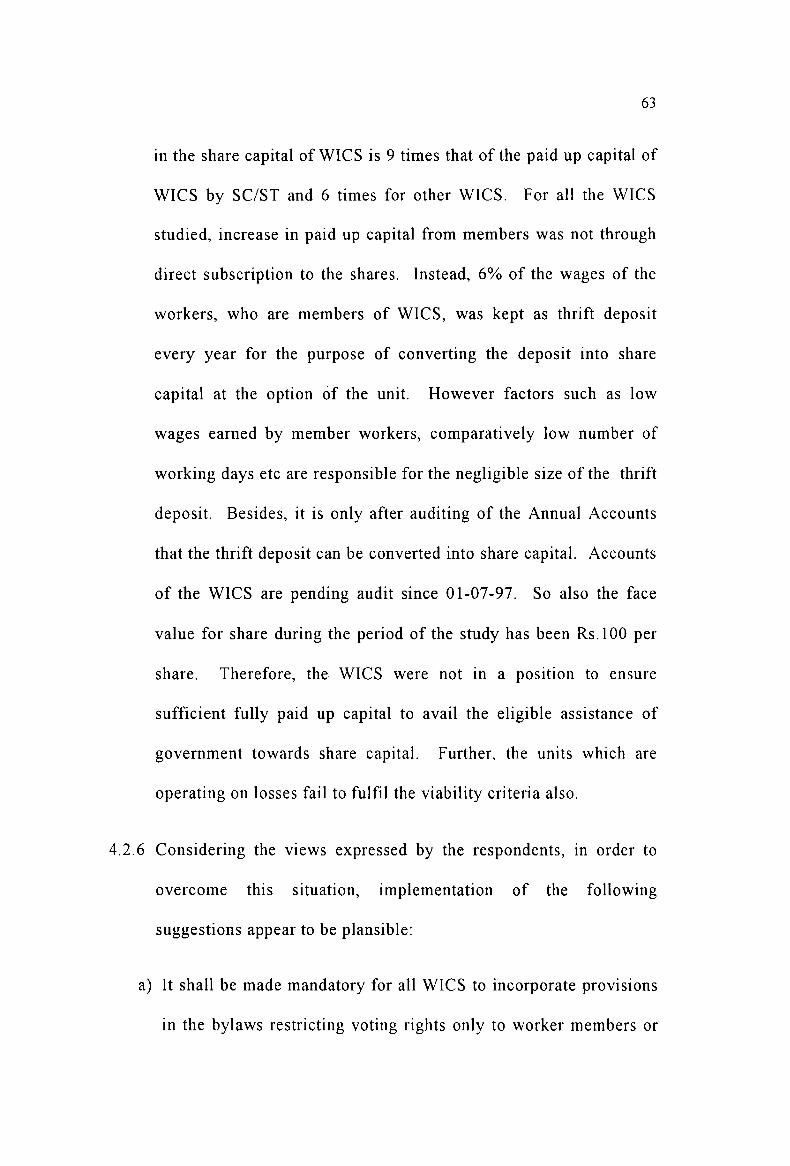
4.1.1 Financial health is the essence of meaningful survival of any
business unit. Industrial co-operatives are no exception to this.
The financial health of a business unit is obviously influenced and
reflected by the lucrativeness of the unit. But as has been stated in
chapter Ill, the WICS in Kerala are facing a severe threat to their
very existence. At the same time, a pilot study conducted by the
researcher had revealed that all the industrial units, owned and
operated by women, in the private sector are surviving successfully.
4.2 Governmental Assistance and WICS
4.2. I WICS are in a more advantageous position when compared to other
aforesaid private sector units as far as the financial resources are
concerned. This is because of various schemes of assistance and
incentives offered by the state government, as has been listed in
1.5.3. However, data collected from the Annual Accounts of the
WICS and in response to questions under Section 'B', Section 'c'
and appendix I there to in the interview schedule have revealed that

61
the WICS were not able to avail the eligible government
participation in share capital. Details are given in table 5 given
below.
Table 5
WICS and Government Participation in Share Capital as on 30-06-99
Eligible Received Percentage
Category of received (Rs.) (Rs.)
to eligible
Tailoring and garment 1581400 1411900 89 manufacturing
Assembling 941600 723300 77
Food items manufacturing 431400 328400 76
Miscellaneous products 2376300 1427300 60 manufacturing
Petroleum byproducts 251400 118600 47 man ufacturing
Total 5582100 4009500 72
Source: Compiled from primary data.
4.2.2 It can be seen from the table above that no WICS were able to avail
the full eligible government participation in the share capital.
WICS in the Petroleum byproducts manufacturing category have
availed only 47% and WICS in the Tailoring and garment
manufacturing category have availed to the extent of 89%. For all
the WICS studied, the average was observed to be 72%. In the

62
light of discussions with the respondents of the WICS and
authorities of the District Industries Centres, it is ascertained that
non-fulfilment of the conditions by the WICS is the major reason in
this regard. Insufficiency of funds allocated by the government in
the budget for participation in the share capital of WICS was also
observed to be another reason.
4.2.3 The norms specified for government participation III the share
capital of WICS, interalia, include the following:
a) 90% of the members must be workers of the WICS.
b) Shares must be fully paid up
c) Financial viability
4.2.4 Though all the WICS had 90% of members as employees at the
commencement of the society, the ratio could not be maintained
due to many reasons: workers leaving the society on account of
personal reasons (marriage etc.) and non-viability of the unit.
However it has been observed that even after leaving their jobs
almost all members continued to be members just for the sake of
exercising their voting rights.
4.2.5 Membership was taken by the co-operators paying the full amount
of the shares. As has been stated in 1.5.3, government participation
63
in the share capital of WICS is 9 times that of the paid up capital of
WICS by SC/ST and 6 times for other WICS. For all the WICS
studied, increase in paid up capital from members was not through
direct subscription to the shares. Instead, 6% of the wages of the
workers, who are members of WICS, was kept as thrift deposit
every year for the purpose of converting the deposit into share
capital at the option of the unit. However factors such as low
wages earned by member workers, comparatively low number of
working days etc are responsible for the negligible size of the thrift
deposit. Besides, it is only after auditing of the Annual Accounts
that the thrift deposit can be converted into share capital. Accounts
of the WICS are pending audit since 01-07-97. So also the face
value for share during the period of the study has been Rs. 100 per
share. Therefore, the WICS were not in a position to ensure
sufficient fully paid up capital to avail the eligible assistance of
government towards share capital. Further, the units which are
operating on losses fail to fulfil the viability criteria also.
4.2.6 Considering the VIews expressed by the respondents, in order to
overcome this situation, implementation of the following
suggestions appear to be plansible:
a) It shall be made mandatory for all WICS to incorporate provisions
in the bylaws restricting voting rights only to worker members or

64
members holding a fixed percentage of the paid up capital of the
WICS.
b) All things being equal, the face value per share may be reduced
from Rs. 100 to a lower figure so that the conversion of the thrift
deposit will be more advantageous to the society.
4.2.7 All the units studied had availed the building grant/rent, machinery
grant and sales tax benefits. Out of the 35 WICS, 25 WICS had
acquired their own buildings and availed the building grant. At the
commencement, all the units had only rented buildings and till the
date of acquiring their own buildings they had availed the
reimbursement facility of rent.
4.2.8 All the WICS studied had availed the managerial grant. But the
women's industrial unit outside the co-operative sector was not
eligible for this benefit as they have not satisfied one of the
conditions for sanction of managerial grant, namely that there
should be at least 8 employees excluding the manager.
4.2.9 One of the incentives provided by the state government to the
promoter co-operators through District Industries Centres is stipend
for undergoing training prior to the commencement of WICS. The
duration of the training was 6 months. This is to ensure that the
promoter co-operators are adequately equipped to run the society

65
successfully. However, it was observed that not even a single unit
has availed this facility prior to the commencement of the unit
concerned. But after the commencement of the unit, member
workers of 13 units had undergone training provided by the block
panchayats for a period of 1 week, 2 units for 2 weeks and one unit
for 3 weeks. On the other hand, all the promoters of the
comparison cases have undergone training for six months availing
stipend through the DIes.
4.2. lOIn the light of views expressed by the respondents, it was observed
that ensuring expertise and competency should have been the first
step to sanction the commencement of the unit and of the various
schemes of grants and subsidies. Further, it was observed that the
situation would have been different, provided the following
conditions were made mandatory to avail various schemes of grants
and subsidies from the government.
a) Sufficient and successful training prior to the commencement of
the business.
b) Submission of the project report by the promoter co-operators.
c) Proper evaluation of the project to ensure that the project is viable.

66
4.2.11 Facilities such as stipend for undergoing EDP (Entrepreneurial
Development Programme) training to women entrepreneurs,
managers/secretaries and presidents of societies, reimbursement of
advertisement expenses on advertisement through cinema slides,
trade fares, radio broadcasts etc. were in force till 13-4-93. As far
as EDP training was concerned, of all the 35 WICS studied, only 3
WICS have availed the facility. Respondents were unanimous that
this was mainly due to frequent changes of manager/secretary. It
may be noted that the manager/secretary of WICS was a paid staff
of WICS and not a member. Better opportunities outside was
observed to be the major reason for the frequent changes. The
frequent changes of secretary/manager of WICS has been reported
to be one of the reasons for the failure of WICS. In order to
overcome these problems, the terms and conditions of appointment
of chief executive of the WICS shall include, interalia, provision
for a minimum period of service of the secretary in the WICS. This
is possible by amending the bylaws of the WICS.
4.2. 12All the industrial units in the comparison cases had a proprietor in
charge of the unit. Proprietors of all these units have availed this
facility.
4.2.13None of the WICS studied had advertised their products and
therefore were not eligible for reimbursement of advertisement

67
expenses on advertisement through cinema slides, trade fares, radio
broadcasts etc. For the comparison cases studied, only one unit had
availed this facility. Lack of awareness, frequent changes of
secretary/manager etc. were the reasons cited by the respondents
from WICS category. On the other hand, respondents from the
comparison cases could sell their products using personal contacts
and hence advertisements were not found to be necessary by them.
As the scheme is not in force since 13-4-1993 more details in this
regard could not be collected.
4.2.14Both WICS and other women's industrial units were entitled to
pnce preference @ 15% over other units while submitting
quotations to government and governmental agencies in addition to
exemption from paying earnest money deposit. This incentive also
was available only till 13-4-1993. However, it was ascertained that
none of the WICS were aware of the implications of this incentive
and for industrial units in the non-co-operative sector, the scheme
was found to be unprofitable.
4.2. 15Though the period of study covers the consecutive rules of both
UDF and LDF ministries In Kerala for three years each, no
difference was observed in the policies of both these ministries
towards WICS.
68
4.3 Analysis of Financial Statements
4.3.1 For both WICS and companson cases, the operational efficiency
was analysed based on data from the Profit and Loss Accounts
concerned. Throughout the period of study all the comparison units
from the women's industrial units in the non co-operative sector
were running on profits. On the other hand, two units from the
Assembling category and three units from Miscellaneous category
of WICS alone were working on profits throughout the period of
study. Of the remaining 30 units, all the units in the Petroleum
byproducts category were running on losses during the entire
period of study and there was no steady trend for the remaining
units. Analysis of financial statements has been done separately for
each category of WICS and the corresponding comparison case.
4.4. Tailoring and Garment Manufacturing Units
4.4.1 Of the total 170 working WICS in Kerala, as on 30-06-99, 42.23
per cent of the units are engaged in tailoring and garment
manufacturing activities. As stated earlier a sample of 20 per cent
i.e., 15 units are covered by this study.
4.4.2 Of the 15 units in the tailoring and garment making category, only
three units showed a net profit for the year ended 30-06-99. The
ratios of net profit to sales for these units were 1.7, 9.4 and 2.3%.

69
The unit for which the ratio was 1.7, the ratio of operating expenses
to operating income was 102.2%. This implies that the profit as
disclosed by the profit and loss account of this unit cannot be
accepted as an indicator of efficiency because the operating income
of the unit was not enough to cover even the operating expenses.
For all the remaining 12 units, the ratio was observed to be
negative and the range was l.4% to 280.6%. Further, all these 12
units except one, showed a negative net profit ratio during the
entire period of study. The one which is cited as an exception had a
nominal positive ratio (.51%) only for the year ended 30th June
1998. Besides, of the three units which showed a positive ratio for
the year ended 30th June 1999, only one unit showed a varymg
trend in the previous years of the period of study.
4.4.3 Contrariwise, the comparison case showed net profit and the ratio
of net profit to sales was 39.7%. Further, this unit was running on
profits during the entire period of study. Therefore it can be
inferred that tailoring and garment manufacturing, in general, is a
profitable sector. It follows that units owned and operated by
women cannot be an exception to this.
4.4.4 In order to elucidate the difference in operation between the units
in the co-operative sector and comparison case, Operating Ratios
were calculated. The only operating income for all the units during

71
Tab
le 6
Det
ails
reg
ardi
ng t
otal
inc
ome,
tot
al o
pera
ting
inc
ome,
tot
al o
pera
ting
exp
ense
s, m
ajor
com
pone
nts
of o
pera
ting
exp
ense
s an
d re
leva
nt r
atio
s fo
r th
e ye
ar e
nded
30-
06-9
9
WIC
S
Rs.
in
'OO
Os
1 2
3 4
5 6
7 8
9 10
11
1
2
13
1
4
15
16
17
I I
cl.
. .,
.. 0;
C
l 0
; C
l i
.. .,
~~
",C
l ",C
l ·.s
oU)
~ S
en
E-
.,
(1)
.(1
)
'" '"
(1)
~o::
(1)
~s:::::cn
;:c
., c
'"
.,
c
0::
Co
.,
CIl
Co
.,
w-.
, lI
!u
c;;~
II)~
Q; ~7
Ill;:
:;
4J
CU
;CL
I .,
,;::
41
0)
;::;
G
I S
~.5 ~
.,c:
cnc:
GI
(1)
~-;
o E~ ~o!9E
Cijfn
_
Oll)~
t:i..5
~
_la
'"
-la
E
la la
'"
la l
a E
..,
CII:
;:::;E
'E
Cij
o""
~gS8
_C
II)
_C
UI
C.C
'i::
u;
CIl
UI
la _
C
la -
0 ~
-c
~
:u 0
ocn~c ~~!!3
o E
og~
OC
llO
::
-5 e.
~ 0
.2.,
0
-:
~o::
g>
.~
£ CD
a:::
E .
, .,
E
~u
., .,
~c:
....
cu
:l
I-0
o ci.
.s.=
I-Co~
...
oc.
...
c.
"'~
o Co~
'0 g-
~ ..
. c.
c.
...
c. U
O
CU
GlC
L
oc
»G
lc
U
1--
x I-w
0
-><
00
:::i
; s:
~ x
'00
,5
o 0
'"
00
.5
c.c
.", ~ e-
g--
w
., ~~OGl
E
0 o
.,
"eo
(J
) ~.sQl
~S
~.sQl
"eo
o
.,
"if"
o _
o _
1 3.
6 3.
6 10
0.0
13.7
10
.2
74.5
28
3.3
4.2
3.9
2.1
41.2
11
6.7
38.2
10
8.3
20.6
58
.3
2 8.
9 7.
3 82
.0
11.0
10
.9
99.1
14
9.3
4.5
6.1
0.3
41.3
61
.6
56.0
83
.6
2.8
4.1
. 3
14.1
14
.1
100.
0 15
.8
15.8
10
0.0
112.
1 10
.6
3.6
1.6
67.1
. 75
.2
22.8
25
.5
10.1
11
.3
4 78
3.8
754.
7 96
.3
771.
2 77
1.2
100.
0 10
2.2
562.
8 13
9.0
69.4
73
.0
74.6
18
.0
18.4
9.
0 9.
2
5 23
.2
23.1
99
.6
25.9
24
.8
95.8
10
7.4
15.8
8.
0 1.
0 63
.7
68.4
32
.3
34.6
4.
0 4.
3
6 57
.7
56.3
97
.6
52.4
51
.4
98.1
91
.3
35.0
14
.8
1.6
68.1
62
.2
28.8
26
.3
3.1
2.8
I
7 95
.7
91.2
95
.3
93.6
85
.5
91.3
93
.8
47.4
28
.3
9.8
55.4
52
.0
33.1
31
.0
11.5
10
.7
8 20
.0
16.2
81
.0
26.4
23
.7
89.8
14
6.3
12.5
7.
1 4.
1 52
.7
77.2
30
.0
43.8
17
.3
25.3
9 51
.4
47.6
92
.6
65.6
63
.8
97.3
13
4.0
39.5
22
.3
2.0
61.9
83
.0
35.0
46
.8
3.1
4.2
10
56.8
52
.3
92.1
60
.5
60.5
10
0.0
115.
7 40
.0
19.4
1.
1 66
.1
76.5
32
.1
37.1
1.
8 2.
1
11
36.2
36
.2
100.
0 46
.1
44.3
96
.1
122.
4 24
.0
18.1
2.
2 54
.2
66.3
40
.9
50.0
5.
0 6.
1
12
202.
3 19
6.4
97.1
20
9.2
205.
1 98
.0
104.
4 38
.6
150.
0 16
.5
18.8
19
.6
73.1
76
.4
8.0
8.4
13
42.7
42
.5
99.5
49
.5
48.2
97
.4
113.
4 25
.8
17.5
4.
9 53
.5
60.7
36
.3
41.2
10
.2
11.5
14
26.8
16
.1
60.1
45
.1
44.9
99
.6
278.
9 8.
4 26
.0
10.5
18
.7
52.2
57
.9
161.
5 23
.4
65.2
!
15
49.1
48
.8
99.4
49
.8
47.9
96
.2
98.2
22
.5
23.0
2.
4 47
.0
46.1
48
.0
47.2
5.
0 4.
9 ,
To
tal
1472
.3
1406
.4
95.5
15
35.8
15
08.2
98
.2
107.
2 89
1.6
487.
1 12
9.5
59.1
63
.4
32.3
34
.6
8.6
9.2
Co
mp
ari
son
15
9.7
148.
6 93
.0
100.
7 94
.8
94.1
63
.8
51.6
35
.13
8.1
54.4
34
.7
37.0
23
.6
8.5
5.5
Un
it
---
--
-----
Sou
rce:
Sur
vey
Dat
a.

72
interest on borrowings.' As far as the rate of interest on borrowings
is concerned, WICS were in a more advantageous position because
the main financiers for WICS were District Co-operative Banks and
the loans carried a lower rate of interest.
4.4.8 Ratios of operating expenses to operating income gives sufficient
indications for the operational inefficiency of WICS. Of the 15
WICS studied, the ratio was above 100 percent for 12 units. This
means that the operating income (sales revenue) of these units was
not sufficient to meet even the operating expenses. For 3 units,
though the ratio was less than 100 percent for the year ended
30-6-99, average ratio for the entire period of study was observed
to be above 100 percent. As against this, for the comparison unit,
Operating Ratio for the year ended 30-6-99 was only 63.8 percent.
4.4.9 In order to identify the reasons for the above situation, an anlaysis
is made on the pattern of expenses incurred both by the WICS and
the comparison case. For the purpose of analysis, operating
expenses are divided into material costs, employees' remuneration
(wages and salaries) and other expenses.
4.4.10 Material costs, either in terms of total operating expenses or III
terms of total operating income constitute the highest share of the
operating expenses. For the WICS, on an average, material costs

73
constitute 59.1 percent of the operating expenses or 63.4 percent of
operating income. For the 15 units studied, there was a sizeable
range varying from 18.7 percent to 73 percent (as a percentage of
operating expenses) and 19.6 percent to 116.7 percent when viewed
as a percentage of total operating income. The reason for the
difference was observed to be the nature of the activity. For
example, those WICS that undertake stitching works alone had low
material costs compared to other WICS engaged in manufacturing
and selling of readymade garments. This is evident from the fact
that for those WICS where the incidence of material costs was
more, wages and salaries had a predominant role. However, only
two units have restricted their activity to stitching work alone. On
the other hand, the comparison lJnit has been engaged in the
manufacturing and selling of readymade garments. Therefore, for
comparison purposes, it can be seen that, for the comparison case,
the ratios of material costs to total operating expenses and total
operating income were 54.4 percent and 34.7 percent respectively.
As against this, the average ratios for the 13 WICS engaged in the
same line of activity were 67.1 percent and 70.74 percent
respectively. Thus, it can be seen that materials management is one
area where WICS have to pay more managerial attention.
74
4.4.11 From the analysis of data collected in response to questions under
section 'E' of the interview schedule, it is observed that ineffective
purchasing practices are observed to be the main reason for the
disadvantageous position of WICS as far as material costs were
concerned. The WICS purchase the required materials in small
quantities. Out of 15 units, 9 units used to make weekly purchases
while 6 units purchased materials twice a month. Besides these,
absence of regular suppliers and the practice of local purchases in
uneconomIC quantities also escalated cost of materials.
Conversely, the comparison unit used to make bulk purchases from
regular suppliers in Coibatore, Bangalore, Bombay etc. Supply of
materials to the comparison case was on a monthly basis.
4.4. 12Thus, it can be observed that WICS have to follow at least the
practices adopted by the comparison case. It will be desirable, if
possible, for those WICS that are located in the same area and have
engaged in the same line of activity, to adopt the practice of
collective purchasing.
4.4.13 Wages and salaries formed the second important item under the
head "operating expenses". For the year ended 30-6-99, the
percentage of wages and salaries to total operating income was 34.6
percent for the WICS while it was 23.6 percent for the comparison
case. When this item is expressed as a percentage of operating

75
expenses, the ratios are 32.3 percent and 37 percent respectively.
While evaluating the productivity of labour, the former is more
significant and WICS, when compared to the comparison case, are
in a disadvantageous situation. As far as wages and salaries are
concerned, because of the differences in the system of wage
payment and the volume of activity, the relationship between
employee remuneration and total operating expenses seldom serves
any purpose.
4.4.14Analysis of the data collected in response to questions under
Section 'H' of the interview schedule, highlights the major reasons
for the high percentage of labour cost in the co-operative sector.
The average number of employees in the co-operative sector was 16
including the secretary. All the employees other than the secretary
of these units were members. The system of remuneration
prevailing was time-rate system on daily basis. Manufacturing and
selling practices have been observed to be of a 'routine nature' in
the co-operative sector. The number of employees remained the
same during both the slack and peak seasons. Considerable loss of
remunerated labour hours (idle time) was also observed to be a
regular feature of WICS. Inefficient handling of machines and the
resultant interruption in production have also been causmg
inconsiderable peCUnIary losses. These encompass the loss of

76
remunerated labour hours, loss due to inability to exploit the
market and maintaining customers etc. However, exact calculation
of these losses was not possible due to non-availability of data due
to the defective accounting system in WICS.
4.4.15 For the companson unit, the average number of employees was
four including the owner-cum-manager. Piece-rate system of wage
payment was in practice in this sector. Manufacturing and selling
activities have been performed by this unit with acumen and
circumspection. This helps the unit to reduce the idle time of
employees and thereby the labour cost. For example, during peak
seasons this unit gets the work done by employing additional hands
either in the business premises or giving the work to outsiders on
contract basis. Idle time of employees is also reduced by
eliminating the chances of repairs by careful handling of machines
and by better maintenance practices.
4.4. 16Thus it can be seen that though WICS are formed for generating
employment opportunities, they have failed in achieving this
objective. Instead, these societies have been suffering chronic
disguised unemployment. Without any idea about actual labour
requirements and manpower planning, members were appointed as
workers. Thus it can be inferred that, there is a lot of scope for
human resource management in WICS. Diversification of its

77
activities IS one of the measures to overcome the problem of
disguised unemployment.
4.4. 17With regard to the third component 'other expenses', WICS are III
an advantageous position because of the low rate of depreciation
(212% for buildings, 5% for plant and machinery and 10% for
furniture). 9 units in this sector have their own buildings. In spite
of this, the component of operating cost under the head 'other
expenses' was high for the WICS. This was observed to be due to
the fact that most of the machines and equipments owned by the
co-operatives are outdated causing heavy expenses on repairs.
Besides, WICS have to convene the meetings of directors once in a
month and shareholders once in a year. Conducting of the meetings
of the Board of Directors and Annual General Body Meeting of the
members have also contributed to the "other expenses".
4.4.18For the comparison unit, the rate of depreciation was 10% for plant
and machinery and 15% for furniture. The comparison unit has a
hired building and had to pay rent. Even then, the percentage of
'other expenses' to operating expenses or operating income was
observed to be low because of reduction in repairing charges as a
result of proper handling and maintenance of machines. Since the
unit was a sole trading concern, it was free from routine

78
administrative expenses like expenses on conducting the meetings
of the Board of Directors and Annual General Body Meeting.
4.4.19Profitability analyses of WICS in the Tailoring and garment
manufacturing sector thus, present a deplorable picture. As has
been indicated earlier, the operating ratio, an index of operating
efficiency, was very high and net profit ratio was negative because
of the comparatively high cost of production. On the other hand,
the comparison unit, owned and operated by women, could make
comparatively high operating profits and net profits. This
highlights that the reasons for inefficiency of WICS lie not with the
area of operation, namely, tailoring and garment manufacturing, but
with management of the units in general and planning and
controlling in particular.
4.4.20The financial structure has an impact on the profitability of a
business through the effect of financial leverage. For assessing this
influence, Debt Equity Ratio was calculated. Debt Equity Ratio
implies the ratio of outsiders fund to shareholders fund where
shareholders fund represent share capital plus reserves and surplus
minus fictitious assets. 4 units on 30th June 1994, and 7 units on
30th June 1999 showed negative Debt Equity Ratio due to erosion
of capital by way of accumulated losses.

79
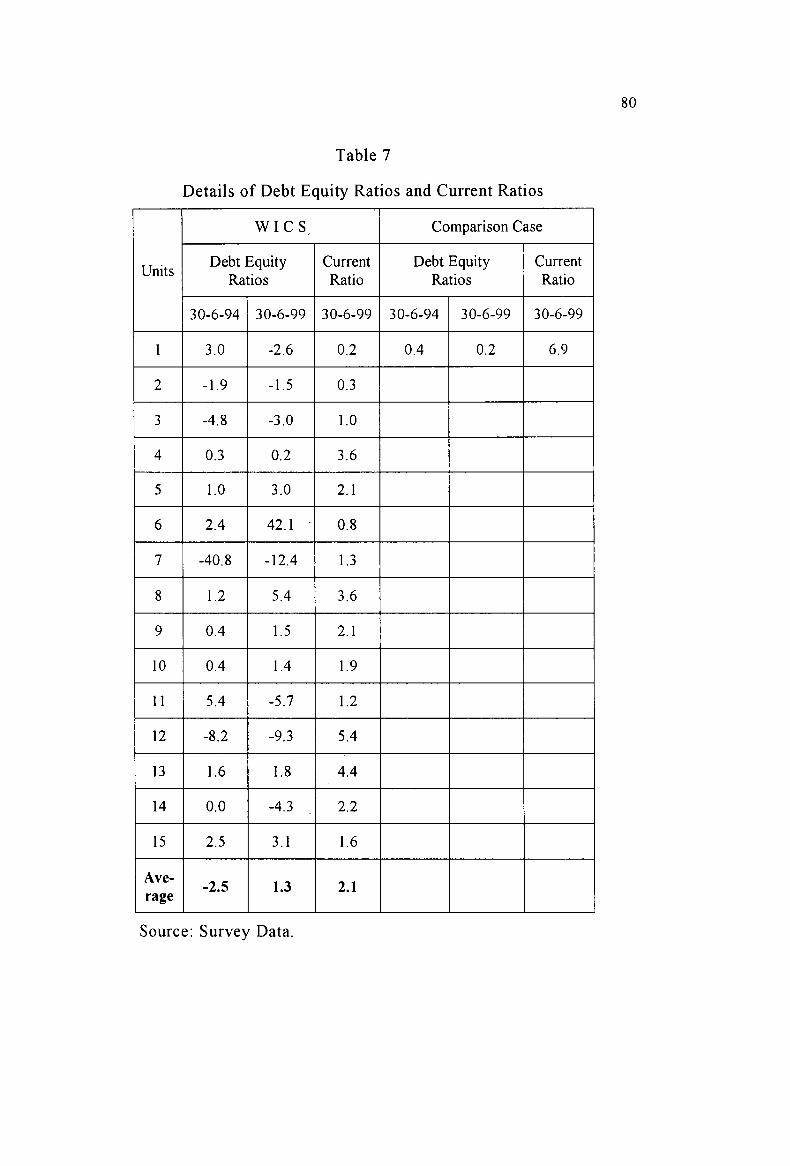
4.4.21 It can be seen from table 7 that as on 30-06-99, 8 units had a
positive Debt Equity' Ratio rangmg from .2 to 42.1. For a
manufacturing organisation which is sound and established, the
standard size of the ratio can range from 1: 1 to 2: 1. Even taking
the standard ratio at 2: 1, only one unit showed a satisfactory
long-term solvency position. The total paid up capital of all the 15
societies has increased from Rs.14,66,800 as on 30th June 1993 to
Rs.16,74,300 as on 30th June 1998. The government participation
in the paid up shar!! capital of WICS had increased from
Rs.1235900 to Rs.1411900 during the period of study. On 30th
June 1993, the shareholders fund for the units studied in this
category was Rs.l 0,12,800 which has come down to Rs.4,81 ,400 as
on 30th June 1999 showing an erosion of 52.5% in the shareholders
fund. This implies that government participation in the share
capital of these units has only led to the wastage of public funds.
80
Table 7
Details of Debt Equity Ratios and Current Ratios
WIC S Comparison Case
Units Debt Equity Current Debt Equity Current
Ratios Ratio Ratios Ratio
30-6-94 30-6-99 30-6-99 30-6-94 30-6-99 30-6-99
1 3.0 -2.6 0.2 0.4 0.2 6.9
2 -l.9 -l.5 0.3
3 -4.8 -3.0 l.0
4 0.3 0.2 3.6
5 l.0 3.0 2.1
6 2.4 42.1 0.8
7 -40.8 -12.4 l.3
8 l.2 5.4 3.6
9 0.4 l.5 2.1
10 0.4 1.4 l.9
11 5.4 -5.7 l.2
12 -8.2 -9.3 5.4
13 l.6 l.8 4.4
14 0.0 -4.3 2.2
15 2.5 3.1 l.6
Ave--2.5 1.3 2.1
rage
Source: Survey Data.

81
4.4.220n the contrary, the comparison case had a Debt Equity Ratio of
0.2 as on 30-06-1999. This was because the comparison unit was
running on profit and as a portion of the profit was retained in the
business, its equity base was observed to be sound.
4.4.23 Short-term solvency was assessed with the help of Current Ratios
(ratio of current assets to current liabilities). It can be seen from
the table that as on 30-06-99, the Current Ratio for the WICS
varied from 0.2 to 5.4 with an average of 2.1. For units engaged in
manufacturing and trading, the standard size of the current
ratio may be taken at 2: 1 with a maximum variation of ±one.
Nevertheless, it IS' observed that only 8 units l.e.,
53.3% of the units studied, have a Current Ratio showing a
satisfactory short term liquidity. In the case of four units the size
of the ratios (3.6, 3.6, 5.4 and 4.4) leaves ground for doubt about
the efficiency of working capital management. A reading of the
financial statement of these units in the light of views expressed by
the respondents indicates that the main reason for the high ratios is
the incidence of comparatively high closing stock (unsold goods).
For the remaining 3 units (20%) the ratios were observed to be less
than one showing that they are not in a position to payoff the short
term obligations. In other words, they suffer from short-term
insolvency.
82
4.4.24Current Ratio of the comparison unit, as on 30-06-99, was 6.9. This
revealed that though the comparison unit lacks an effective working
capital management, there was no threat on solvency aspect.
4.4.25Analysis of the financial statements of WICS in the Tailoring and
garment manufacturing category sheds light on some of the major
reasons for operational inefficiency and problems related to long
term and short term liquidity. As of now, the financial assistance
from the government has become a burden to the government
exchequer. Incidence of high material and labour costs is identified
as one of the major reasons for operational inefficiency. Adoption
of an effective purchasing policy can reduce the material costs.
Formulation and imple.mentation of a competent human resources
management policy is found necessary. As part of this, measures
such as rehabilitation of excess employees through diversification
of activities, optimizing the labour force, revision of the
remuneration system etc are worth trying. Debt Equity Ratios have
revealed that long-term solvency of WICS in this category has
deteriorated over the years and this is reflected by a steep decline in
the equity base. Current Ratios have revealed problems of
short-term liquidity. Equity base of WICS at any rate, has to be
strengthened through the generation of internal funds and it IS
possible only through the improvement of operational efficiency.

83
4.5. Petroleum Byproducts Manufacturing Units
4.5.1 Of the total operating WICS in Kerala, 16 units, i.e., 9.4 per cent
are engaged in the production of petroleum byproducts. Among
these, 20%, (i.e., three units) is taken for the study. Of these three
units, two are engaged in the manufacturing of plastic articles and
one unit in candle manufacturing. Here also, one unit is taken from
the non co-operative sector as comparison unit.
4.5.2 The units engaged III the production of plastic articles in the
co-operative sector manufacture polythene cover, plastic carry
bags, plastic mugs and water bags. The candle manufacturing unit
in this sector manufactures ordinary white candles. The comparison
unit manufactures plastic buckets (different sizes), lunch boxes,
plastic mugs etc.
4.5.3 All the 3 units III the co-operative sector showed negative Net
Profit Ratios during the entire period of study with an average of
-12.5%. For the year ended 30/6/99, the Net Profit Ratio for these
units were -1.1%, -9.6% and -38.1%. Units engaged in the
manufacturing of plastic articles incurred an average net loss of
-3% and -35.5 % and the candle making unit had -11.0% as its
average Net Profit Ratio during the six years' period of study.

84
4.5.4 On the other hand, the comparison unit showed net profit during the
entire period of study with an average of 19.45%. This indicates
that this sector like the garment manufacturing sector is also a
profitable one. However it proved to be ineffective in the
co-operative sector.
4.5.5 Operating Ratios were computed for ascertaining the differences in
profits between the units in the co-operative sector and the
comparison case. For both the sectors, sales constituted the only
source of operating income during the period of study. Hence, a
companson was made between Operating Ratios and Net Profit
Ratios.
4.5.6 Table 8 gives details of total income, total operating income, total
expenses, total operating expenses, different components of
operating expenses and the relevant ratios for the WICS and the
comparison case for the year ended 30-6-99.
4.5.7 For the three units studied in the co-operative sector, the ratios of
operating income to total income were 98.2%, 91.5% and 100%
with an average of 96.3%. The sources of non-operating income
for these units were grants and subsidies from the government.
One unit had availed the grants and subsidies prior to 1993 and for
this unit the total income was constituted of only the operating

Tab
le -
S
Deta
ils
reg
ard
ing
To
tal
Inco
me,
To
tal
Op
era
tin
g I
nco
me,
To
tal
Op
era
tin
g E
xp
en
ses,
Majo
r C
om
po
nen
ts o
f O
pera
tin
g E
xp
en
ses
an
d R
ele
van
t R
ati
os
for
the y
ear
en
ded
30
-06
-19
99
WIC
S
Rs.
in
'OO
Os
1 2
3 4
5 6
7 8
9 10
11
12
13
14
15
16
17
Cl) 0
I/) Cl)
Cl) Cl)
.. 0
1/)
0
E
CII
CII
I/) -
Cl) I/)
0 o
E
0 o
E
E
Cl) Cl)
en ..
Cl)
.. .;
: Cl)
.. =
:::0
'-
.E C
l I/)
E
0 E
E
I/)
'1/)
.
Cl) I/)
.. "0
'-
0 0
.0::
c.
.c::
c..E
I/)
ca c::
IV
Cl
I/) ca
u I/)
Cl
I/) I/)
U
CI)
" U
8-:-
U
o 0
c:: c..
-><
Cl) ><
0 C
ii_
IV
~-
:-.;:
c::
Cl) ".::
:: c:
Cl)
c:: Cl)
Cl) c::
Cl) I/)
c:: Cl)
.c:I
/)C
:: I/)
c::
_
U
U
CI)
_ 0
1/)
W
c..
00
-:-
CI):;:
:; I/)
CI)
-C
l:;:
:;
I/) C
l-;C
I):;
::;I
/)
.. C
I)-
:t::
c..
' W
u
0i::
en c::
I/) .1
/)
-=-=
>< I/)
_ Cl)
I/) ><
I/) ..
caC
:: 1U
g>
ca ca
c:: ca
Cl
o I/)
ca c::
o I/)
Cl
c:: -0
::
c..o
:: ca
I/) .>
< ci
.c::
.$0
::
a.!Io
:: w
O::
ca ...
Cl) :;
:'-C
I)
-;lii~
_c:
:c::
w~
c.. w
~.
= :::
l C
ii-
0-
ci.
-..
c::
0_
0
-:
ca -
1/)
--
EC
I)c.
. E:
;::;
Cl)c
.. o
c..c
..><
o Cl)
.-o~
o Cl)
... -g
><
_ c..
><
_ ..
c.. ..
.. Ci
i IV
I-
c..
_
ca
_c..
:!:
Cl)
Cl) _
ca
oo
w
o ca
;;e~ow ~><~
. 0
_0
..
0"0
0
0
Cl
.c:
o W
o
...
... o
Cl) Cl)
I-..
01
-0
>< ca
.. Cl)
~
~CI)
0 I-
W
;;el
-~
:;: 0
~
~c..
0 o
c..
c..
I-~
0 0
o 0
0 0
0
1 72
.5
71.2
98
.2
73.3
70
.3
95.9
98
.7
52.8
14
.1
3.4
75.1
74
.2
20.1
19
.8
4.83
4.
77
2 60
.2
55.1
91
.5
65.5
62
.6
95.6
11
3.6
25.7
28
.3
8.6
41.1
46
.6
45.2
51
.4
13.7
15
.8
3 41
.2
41.2
1
00
.0
56.9
56
.9
100.
0 13
8.1
19.0
36
.3
1.6
33.4
46
.1
63.8
88
.1
2.8
3.1
To
tal
173.
9 16
7.5
96.3
19
5.7
189.
8 97
.0
113.
1 97
.5
78.7
13
.6
51.4
58
.2
41.5
47
.0
7.2
8.1
Co
mp
ar
iso
n
11
92
.8
11
92
.8
10
0
83
8.4
6
97
.8
83
.2
58
.5
35
1.2
2
31
.2
11
5.4
5
0.3
2
9.4
33
.1
19
.4
16
.5
9.7
case
Sour
ce:
Surv
ey D
ata.

86
mcome. For the companson unit, operating mcome constituted
100% of its total income. However, all the WICS in the category
have been running on losses throughout the period of study.
4.5.8 The ratio of operating expenses to total expenses for WICS varied
between 95.6% and 100% with an average of 97%. Contrariwise,
this ratio was 83.2% for the comparison case. A major share of
non-operating expenses, for both the sectors, consisted of interest
on borrowings. The rate of interest on borrowings was high for the
comparison case in contrast to that of the WICS.
4.5.9 The Operating Ratio (ratio of operating expenses to operating
income) reveals the operational inefficiency of WICS. For WICS,
the Operating Ratio, on an average, was observed to be above
100% throughout the period of study. For the year ended 30-6-99,
the Operating Ratios for the three units were 98.7%,113.6% and
138.1 %. On the other hand, the comparison unit showed an
Operating Ratio of 58.5% for the year ended 30-6-99. Its average
Operating Ratio was 63.8% during the six year period of study.
4.5.10The pattern of expenses incurred by the units in the co-operative
sector and the comparison case was considered for ascertaining the
reasons for the differences in the Operating Ratios. For the purpose
87
of analysis, as indicated in 4.4.9, operating expenses are divided
into material costs, employees' remuneration and other expenses.
4.5.11 A scrutiny of different components of operating expenses reveals
that for both the sectors, material costs constituted a major share of
operating expenses when viewed either as a percentage of operating
expenses or operating income. For WICS, material costs, as a
percentage of operating expenses, varied between 33.4% and 75.1 %
with an average of 51.4% for the year ended 30-6-99. Taking the
percentage of operating income, material costs for the three units
appeared to be 74.2%, 46.6% and 46.1 %, the average being 58.2%.
Contrariwise, for the comparison case, the percentage of material
costs to total operating expenses or total operating income was
50.3% and 29.4% respectively.
4.5.12From the analysis of data collected in response to questions under
Section' E' of the interview schedule, it is observed that the high
incidence of material costs for the WICS engaged in the
manufacturing of plastic articles was caused by the purchase of
materials in small quantities from local suppliers at high prices.
Though the demand for plastic articles has decreased on account of
the pollution problems they create, these units continue to produce
the articles without estimating the actual demand. These units
purchase their required materials twice or more every month while

88
the comparison unit kept the number of purchases reasonable. The
candle manufacturing unit depends on the materials provided
according to government quota. These materials are adequate only
for 16 days of production a month. If they purchase it from other
agencies, they have to pay an unsustainably high cost.
4.5.13 For this category of WICS also ineffective material control was
responsible for high material costs. Material costs can be
controlled through purchasing materials in economic quantities,
adjusting production on the basis of demand and reducing waste.
4.5.140perating expenses under the head 'wages and salaries' reveals
that, for WICS, the percentage of wages and salaries to operating
expenses, on an average, was 41.5%. When it is expressed as a
percentage of operating income, the ratio was 47%. On the other
hand, for the comparison case, the ratios were 33.1 % and 19.4%
respectively.
4.5. 15Analysis of data collected in response to questions under Section
'H' of the interview schedule has revealed certain important
reasons for the high proportion of labour cost in WICS. The
average number of employees is 19, including the secretary, in the
co-operative sector. All the employees other than the secretary are
its members and the number of employees remains the same

89
throughout the year. In the candle making unit, though materials
are scarce and are adequate only for 16 days of work a month, the
number of employees was 17 throughout the year. Time rate system
on daily basis prevaileq as the system of remuneration. Most of the
machines in these units are obsolete and outdated and work was
suspended on account of repairs and maintenance of machines. This
has resulted in idle time and loss of remunerated labour hours. All
these factors account for high labour cost in the WICS.
4.5.16In contrast, the number of employees was 8, including the owner,
for the comparison case. Time-rate system on daily basis prevailed
in this unit. However, labour hours are carefully utilized. Idle time
is eliminated to the maximum possible extent by carefully handling
the machines and maintaining them in good working condition.
Unlike the WICS, the machine capacity is utilized at the optimum
leve1.
4.5.17Incompetent human resources management is responsible for high
labour cost for WICS. Human resources management policy can be
made effective through employing only the required number of
employees or eliminating the disguised unemployment by
diversification of activities.

90
4.5.18The proportion of the third component 'other expenses' is low for
WICS when collated with the comparison unit. Though the
repairing charges of WICS are high and they have to incur expenses
in connection with meetings of the Board of Directors and the
Annual General meetings of the shareholders, the proportion is low
because the rate of depreciation is low. Apart from this, all the
three units in the WICS have their own buildings and are not
required to pay rent.
4.5.19Thus the performance of WICS engaged in the production of
petroleum byproducts presents a gloomy picture. The Operating
Ratios are above 100 per cent and all the units are running on heavy
losses. No sincere eff~rts are taken for analysing the reasons for
such a situation and for the control of costs. But the comparison
unit, owned and managed by women, exhibits a bright picture.
This suggests that by proper planning and control of costs, these
units can also have a promising future.
4.5.20For assessing the solvency of the business, Debt Equity Ratios and
Current Ratios were computed. Table 9 given below provides the
Debt Equity Ratios and. Current Ratios as on 30/6/94 and 30/6/99.

Table 9
Details of Debt- Equity Ratios and Current Ratios
WICS Comparison Case
Unit Debt Equity Ratio Current
Debt Equity Ratio Current
Ratio Ratio
30-6-94 30-6-99 30-6-99 30-6-94 30-6-99 30-6-99
1 -7.7 -3.6 1.4 4.4 1.5 2.2
2 0.6 6.3 0.4
3 0.8 -9.0 0.8
Average -2.1 -2.1 .87
Source: Survey Data.
4.5.21 As on 30/6/99, two units in this category of WICS had negative
Debt Equity Ratios and one had a ratio of 6.3. Negative Debt
Equity Ratios resulted from erosion of funds by way of losses
resulting in negative shareholders fund. It can be observed that
none of the three units had a satisfactory Debt Equity Ratio. This
occurred in spite of the fact that the government participation in
the share capital of these Societies, during the period of the study,
had increased from 73.2 percent as an 30/6/94 to 73.9 percent on
30/6/99. Therefore, the existence of these societies has proved to
be yet another example of waste of public funds.

92
4.5.22 But the comparison unit revealed a Debt Equity Ratio of 1.5 on
30/6/99 as against 4.4 as 30/6/94. This clarifies that the unit could
improve its solvency position, over a period of six years, by
retaining a portion of internally generated funds.
4.5.23 Short term solvency of WICS, measured with the help of Current
Ratio, revealed that as on 30/6/99 the average ratio was .87 with
the range of 0.4 to l.~. Taking the standard ratio at 2: 1 with a
maximum variation of ± 1 it can be seen that the short-term
solvency position of only one unit is satisfactory. This shows that
WICS in this sector also are highly inadequate in the matter of
effective management of both long term and short-term funds.
4.5.24 Conversely, the companson unit manifested a satisfactory
short-term solvency position since its current ratio was 2.2 as on
30/6/99. This testifies to an effective working capital management
for the comparison unit.
4.5.25 Analysis of the financial statements of petroleum byproducts
manufacturing WICS disclosed the reasons for the high operational
inefficiency and the resultant insolvency. High material and
labour costs are the emphatic indicators of operational
inefficiency. Purchasing of materials in economic quantities and
adjusting production in anticipation of demand can reduce the

93
material costs. Diversification of activities can reduce the labour
cost. For this, human resources management requires a total
restructuring. Debt-Equity and Current Ratios revealed threats to
the solvency aspects of WICS. Negative Debt-Equity Ratio for
this category emphasised the need for the generation of internal
funds and subsequent strengthening of its equity base. Current
ratio revealed ineffective working capital management. Solvency,
both long term and short term, can be improved only through
enhancing the operatio'nal efficiency.
4.6 Assembling Units
4.6.1 15 units, out of 170 WICS in Kerala, are engaged in assembling
activities. As has been mentioned earlier, three units, i.e, 20%, are
covered by this study. Among these three units, two are engaged in
the assembling of electronic goods and one in umbrella
manufacturing. One unit, owned and managed by women, was
taken from the non co-operative sector as comparison unit. Two
units in the Assembling category of WICS and the comparison unit
are engaged in the assembling of TV Boosters. One unit in the
WICS manufactures the ordinary, two fold and three fold black
umbrellas.
94
4.6.2 All the three units were running on profits during the entire period
of study except one unit, i.e., umbrella assembling unit which had
incurred a net loss only during the year 98-99. The average Net
Profit Ratio for these units ranges between 3.5% and 29.5% during
the period of study.
4.6.3 The comparIson unit engaged in the assembling of electronic
goods, showed a Net Profit Ratio of 10.4% for the year ended on
30/6/99 and its average Ratio during the period of study was 9.4
percent.
4.6.4 Operating ratios were examined for ascertaining the difference in
net profits between the WICS and the comparison case. Sales
constituted the only source of operating income for both the
sectors. So a comparison between the Operating and Net Profit
Ratios is possible.
4.6.5 Table 10 gives the details of total income, total operating income,
total expenses, total operating expenses, major components of
operating expenses and the relevant ratios for the WICS and the
comparison case for the year ended 30-6-99.

Tab
le -
10
Deta
ils
reg
ard
ing
To
tal
Inco
me,
To
tal
Op
era
tin
g I
nco
me,
To
tal
Op
era
tin
g E
xp
en
ses,
Maj
or
Co
mp
on
en
ts o
f O
pera
tin
g E
xp
en
ses
an
d R
ele
van
t R
ati
os
for
the y
ear
en
ded
30
-06
-19
99
WIC
S
Rs.
in
'OO
Os
1 2
3 4
5 6
7 8
9 10
11
12
13
14
15
16
17
GI
0 1/1
GI
GI
GI
-
1/1
-o
1/1
0 GI
1/1
0
o E
o
E
E
GI
E
GI
GI
GI
IIi
-G
I
-GI
-
0
E E
'G
I ''::
: 1/1
~o -
-0
... .s
Cl 1
/1 ..
. 0
0 E
0
1/1
.0::
'1
/1
ns jij
Cl
1/1
1/1
Cl 1
/1 a.
I::
a.E
1/1
I:
: ns
u 1/1
U
GI
-U
0
U
o 0
I::
a._
x
GI
jij-
jij
'':::
I::
GI
'':::
I::
GI
I::
GI
GI
I::
GI
1/1
I::
GI
.1::
1111:
: II
I 1
::-
GI_
0
1/1
X
0
GI_
~5:~~
:!:
u-:-
U
U
a.'
W
a.
Wu
'':
en
C/)
-:-
a.
. GI
:;:::
; 1/1
G
I-Cl
:;:::;
1/1
Cl-
_G
l-I:
: 1/1
.1
/1
.:.:
x
1/1
_G
I 1/1
X
1/1
_
nsl
::
1V~
ns ns
I::
nsC
l o
1/1
Cl
I::
a. 0:
: 'X
ei
.1::
So
:: a.!
Io::
ns ...
GI
s:"
'GI
.... ~Q;~
....
1::1
::
-0::
w~
ns 1/1
a.
w
wo
::,
~.=
':::
J jij-
0-
ei.
--'I
::
0_
0
-:
ns -
1/1
--
EG
la.
E:;:::
; G
la.
o a.a
.x
'0
8.:;:::;
o!!
o
GI
... a.
x
.... a
. x
.... -
-jij
jij
~a.
....
ns ....
a.
::
GI
GI
'Co
w
....
ns o
ow
o
ns <f!.~ow
::.e
xf!
0 ...
. 0
-0
0 0
0
Cl
.I::
o
... ...
o GI
8.
~
-o~
0 x
ns -
GI
::.e
::.eGl
0 ~
w
<f!.~
::.e
s:
0 ::.e
::.
ea.
0 o
a.
~
::.e
0 0
o 0
0 0
0
1 2
39
.9
230.
1 95
.9
22
2.4
2
22
.3
99.9
96
.6
135.
6 82
.4
4.3
61
58
.9
37.1
35
.8
1.9
1.9
2 4
8.3
4
8.3
10
0.0
44
.8
43.6
97
.3
90.3
9.
2 29
.1
5.3
21.1
19
.0
66.7
60
.2
12.2
11
.0
3 6
03
.8
56
0.8
92
.9
60
6.2
56
9.3
93.9
10
1.5
26
5.7
2
45
.4
58.2
46
.7
47.4
43
.1
43.8
10
.2
10.4
Tot
al
892.
0 83
9.2
94.1
87
3.4
835.
2 95
.6
99.5
41
0.5
356.
9 67
.8
49.1
48
.9
42.7
42
.5
8.1
8.1
Com
p ar
ison
3
70
3.6
3
70
3.6
1
00
.0
33
16
.9
30
89
.8
93
.2
83
.4
18
37
.4
10
89
.2
16
3.2
5
9.5
49
.6
35.3
2
9.4
5.
3 4
.4
case
Sou
rce:
Sur
vey
Dat
a.
96
4.6.6 For the WICS in the Assembling category, the ratio of operating
income to total income varied between 92.9% and 100% with an
average of 94.1 %. For one unit, 100% of total income was derived
as operating income. Grants and subsidies from the government
and Income from investments constituted the sources of
non-operating income for these units. On the other hand, for the
comparison case, total income and operating income were the same.
4.6.7 For the three units in the Assembling category of WICS, the ratio
of total operating expenses to total expenses was 99.9%, 97.3% and
93.9% with an average of 95.6%. For the comparison unit, this
ratio was 93.2%. Non-operating expenses for both the sectors
represented interest on borrowings. This ratio favours the WICS as
its rate of interest on borrowings was low compared to the
companson case.
4.6.8 A reading of Operating Ratio reveals that two of the three units in
the WICS had this ratio below 100% for the year ended on 30-6-99.
The average Operating Ratio, for all the three units, was below
100% during the six year period covered by the study. The average
Operating Ratio for the Assembling category of WICS was 94%
during the entire period of study. On the other hand, for the
comparison case, the Operating Ratio was 83.4% for the year ended

97
on 30-6-99 with an average of 84.7% during the entire period of
study.
4.6.9 The pattern of expenses incurred by units in the co-operative sector
and the comparison case was examined for ascertaining the reasons
for the above situation. For analysing the reasons, the total
operating expenses are divided into material costs, employees'
remuneration and other expenses.
4.6.10A cursory reading of different components of operating expenses
reveals that for both the sectors, material cost constituted the major
component when viewed either as a percentage of total operating
expenses or operating income. Material cost, on an average,
constituted 49.1% of total operating expenses or 48.9% of total
operating income. This ratio varied between 21.1 % and 61 % (as a
percentage of operating expenses) and 19% and 58.9% when taken
as a percentage of total operating income. For the comparison unit,
these ratios as a percentage of total operating expenses or operating
income were 59.5% and 49.6% respectively.
4.6.11 An enquuy into the reasons for the differences in material costs
revealed the following factors: One of the WICS engaged in the
electronic goods assembling sector got materials from the supplier
who was the purchaser of the products also. Of the other two units
98
in the co-operative sector, one had practiced monthly purchases and
the other (umbrella assembling unit) made its purchases twice a
month. The comparison unit followed a monthly purchasing
pattern. These units, both in the co-operative sector and the
comparison case purchased their required materials in accordance
with the instructions and specifications provided by the firm for
whom the assembling was done. The umbrella assembling unit
purchased its required materials locally.
4.6.12A scrutiny of operating expenses under the head 'wages and
salaries' revealed that for the year ended 30-6-99, the percentage of
wages and salaries to total operating expenses was 42.7% for WICS
while it was 35.3% for the comparison case. When this item is
viewed as a percentage of operating income, the ratios were 42.5%
and 29.4% respectively.
4.6.13 Data collected in response to questions under Section 'H' of the
interview schedule revealed that the differences III labour cost
under the head 'wages and salaries' between the two sectors
coincides with that between the previous two categories, VIZ.,
Garment manufacturing unit and Petroleum byproducts. The
average number of employees III the co-operative sector was 21
including the secretary. Time-rate system based on daily wages was
in practice for two units and piece-rate system prevailed in one

.' 4::' ....
"2') - I~i -_.;._) 1.+ ' l::" I- i
:2. , \'''.' /1 \} 11. ' ) \\;'+, cl' I
~~....~ The number of employees remained~throughout the
rt .~ . 99
unit.
year in WICS, This created idle time for employees which is also
responsible for high labour cost in WICS. Delay in getting the
machines repaired has also resulted in loss of remunerated labour
hours in WICS.
4.6.140n the other hand, the average number of employees for the
comparison unit was 8 including the manager. The system of wage
payment prevailing in this unit is piece-rate system. Discussion
with the manager of the unit revealed that what they had produced
with 10 employees under the time-rate system is now produced
with 7 employees under the piece-rate system without affecting the
quality of the product. If there is any complaint against the quality
and rejection by the mother unit, those workers who are responsible
for such a rejection have to pay penalty. This makes the workers
more vigilant in their work. During the peak season, workers are
ready to work late hours and even on Sundays.
4.6.15Thus it can be seen that units m the co-operative sector can
Improve their financial performance through proper control of
labour cost. For the achievement of this objective, these units have
to frame a suitable and effective human resources management
policy.

100
4.6.16As far as the third component 'other expenses' is concerned, WICS
are in an advantageous position as their rate of depreciation is just
half the rate in the comparison unit. In spite of this, the third
component was high for WICS because of the expenses incurred in
connection with conducting the meetings of the Board of Directors
and Annual General Meetings of the shareholders. Further, one unit
in this sector is operating in a hired building for which it has to pay
rent. However, the comparison unit is operating in an outhouse
provided by the manager and is rent free. Moreover, this unit need
not incur any expenses in connection with convening the meetings
of the Board of Directors and members.
4.6.17Though the electronic goods assembling units of WICS are
operating on profits, their efficiency can be further improved
through proper control of labour cost which would improve their
operational efficiency. The umbrella assembling unit has to adopt
measures for controlling the material costs also in addition to
labour costs.
4.6.18 Solvency position of the units was evaluated with the help of Debt
Equity Ratios and Current Ratios, the details of which are given in
table 11.

101
Table 11
Debt Equity Ratios and Current Ratios
WICS Comparison Case
Unit Debt Equity Ratios Current
Debt Equity Ratios Current
Ratio Ratio
30-6-94 30-6-99 30-6-99 30-6-94 30-6-99 30-6-99
1 1.5 0.7 2.0 1.3 0.9 7.0
2 0.4 0.4 2.1
3 3.0 4.0 3.6
Aver 1.6 1.7 2.6
age
Source: Survey Data.
4.6.19 For the WICS, the Debt Equity Ratio ranges between 0.4 and 4 as
on 30/6/99. It can be seen that none of the WICS had achieved an
appreciable position in respect of long term solvency position. A
comparison made with the Debt Equity Ratio as on 30/6/94 and
30/6/99 revealed that debt mix in the capital structure remained
constant for one unit, decreased for another unit and increased
from 3 to 4 for the third one. The two units in this category which
had showed net profits and a Debt Equity Ratio below one can go
for further borrowings provided the rate of interest on borrowings
is lower than the rate of earnings of the business. This would
enable these units to enjoy the benefits of financial leverage.
102
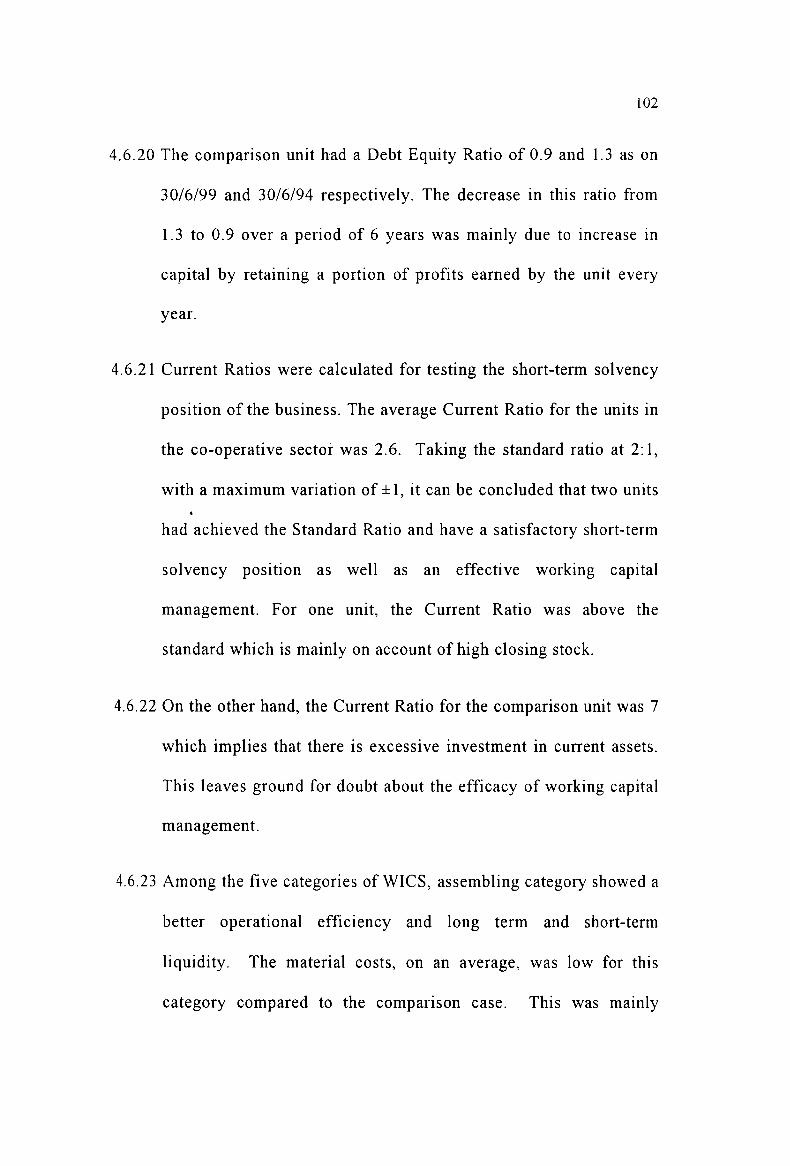
4.6.20 The comparison unit had a Debt Equity Ratio of 0.9 and 1.3 as on
30/6/99 and 30/6/94 respectively. The decrease in this ratio from
1.3 to 0.9 over a period of 6 years was mainly due to increase in
capital by retaining a portion of profits earned by the unit every
year.
4.6.21 Current Ratios were calculated for testing the short-term solvency
position of the business. The average Current Ratio for the units in
the co-operative sector was 2.6. Taking the standard ratio at 2: 1,
with a maximum variation of ± 1, it can be concluded that two units
had achieved the Standard Ratio and have a satisfactory short-term
solvency position as well as an effective working capital
management. For one unit, the Current Ratio was above the
standard which is mainly on account of high closing stock.
4.6.22 On the other hand, the Current Ratio for the comparison unit was 7
which implies that there is excessive investment in current assets.
This leaves ground for doubt about the efficacy of working capital
management.
4.6.23 Among the five categories of WICS, assembling category showed a
better operational efficiency and long term and short-term
liquidity. The material costs, on an average, was low for this
category compared to the comparison case. This was mainly
103
because of adjusting their production according to demand since
these units regulate their production in concurrence with orders of
the purchasers of their products. Operational efficiency of this
category can be improved further by reducing the labour cost
through their optimum utilisation by diversification of activities.
Debt-Equity Ratio showed the generation of internal fund which
reflected the increase in the shareholders fund. Current ratios for
this category revealed an effective management of short-term
funds. More control over the labour cost would further improve
their operational efficiency.
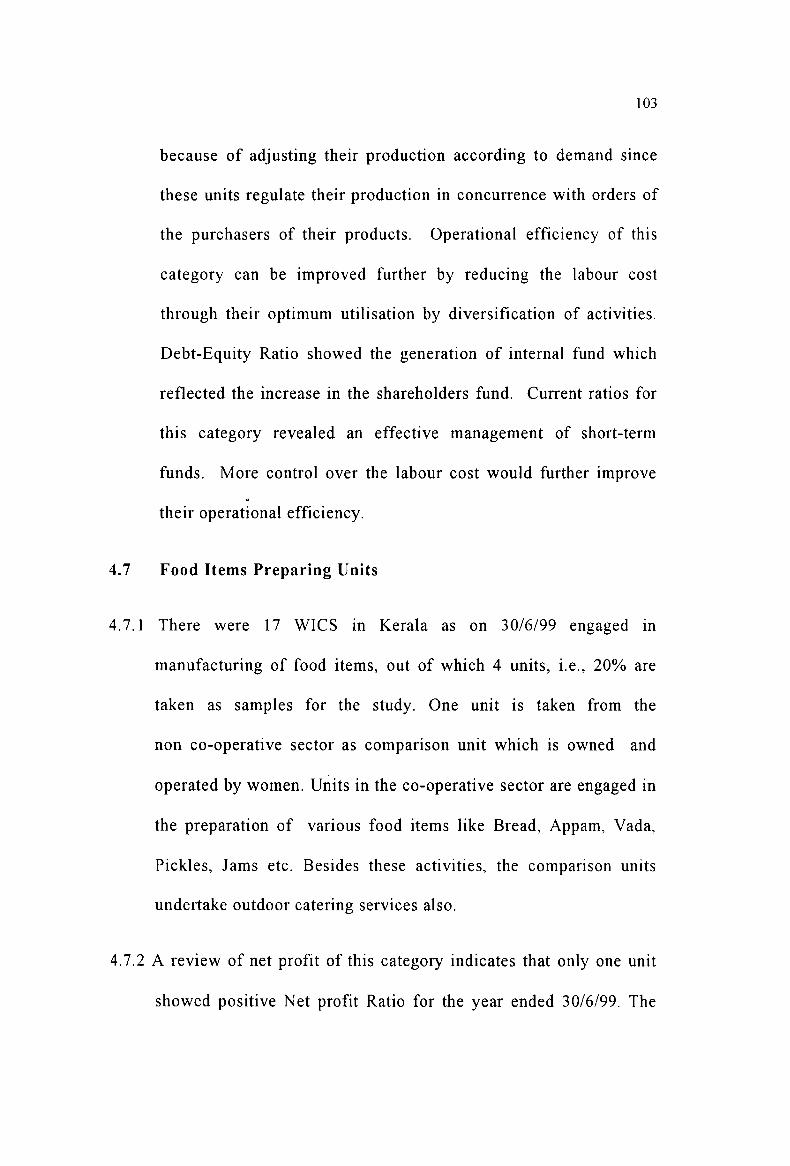
4.7 Food Items Preparing Units
4.7.1 There were 17 WICS in Kerala as on 30/6/99 engaged in
manufacturing of food items, out of which 4 units, i.e., 20% are
taken as samples for the study. One unit is taken from the
non co-operative sector as comparison unit which is owned and
operated by women. Units in the co-operative sector are engaged in
the preparation of various food items like Bread, Appam, Vada,
Pickles, Jams etc. Besides these activities, the comparison units
undertake outdoor catering services also.
4.7.2 A review of net profit of this category indicates that only one unit
showed positive Net profit Ratio for the year ended 30/6/99. The

104
Net Profit Ratio of the other three units ranges between -29.2% and
-36.5%. In the case of the unit for which the Net Profit Ratio was
21.8%., the Operating Ratio was 128.8% which highlights that the
profit as disclosed by the Profit and Loss Account of this unit
cannot be taken as an indicator of operational efficiency. Though
the average Net Profit Ratio for this category for the entire period
of study was 2.1%, its average Operating Ratio was above 100%.
The unit which showed positive Net Profit Ratio for the year ended
30/6/99, incurred net losses for one year i.e., 93-94. The other three
units showed- negative Net Profit Ratios throughout the period of
study.
4.7.3 Conversely, the comparison unit earned net profits during the entire
period of study ranging between 5.1 % and 15.1 % with an average
of 17.3%. This revealed that food items preparing units can also be
operated with profits.
4.7.4 In order to ascertain the differences in profits between the units in
the co-operative sector and the comparison case, Operating Ratios
were computed. For this category of WICS and the comparison
case, income from sales constituted the only source of operating
income. Hence, it is meaningful to make a comparison between
Operating and Net Profit Ratios.

105
4.7.5 Table 12 provides details regarding total income, total operating
income, total expenses, total operating expenses and relevant ratios
for the year ended 30-6-99.
4.7.6 It can be seen from the table above that operating income, on an
average, constituted 70.2% of total income for WICS. The sources
of non-operating income were grants and subsidies from the
government. The unit, for which the ratio was 65.8%, received
financial aid from the local self government under people's
planning in addition to grants and subsidies. On the other hand, for
the comparison unit, operating income constituted 100% of its total
mcome.
4.7.7 For WICS, the ratio of operating expenses to total expenses varied
between 93.7% and 99% with an average of 98.5%. For the
comparison unit, this ratio was 97.6%. The non-operating
expenses, for both the sectors arose from interest on borrowings.
This ratio was found lower for the comparison case because the rate
of interest charged on their borrowings is observed to be high
compared to the WICS ..
4.7.8 Operating Ratio, I.e., ratio of operating expenses to operating
mcome, reveals the operational inefficiency of WICS. Operating
ratios, for all the four units studied under this category of WICS

Tab
le -
12
Deta
ils
reg
ard
ing
To
tal
Inco
me,
To
tal
Op
era
tin
g I
nco
me,
To
tal
Op
era
tin
g E
xp
en
ses,
Maj
or
Co
mp
on
en
ts o
f O
pera
tin
g E
xp
en
ses
an
d R
ele
van
t R
ati
os
for
the y
ear
en
ded
30
-06
-19
99
WIC
S
Rs.
in
'OO
Os
1 2
3 4
5 6
7 8
9 10
11
12
13
14
15
16
17
0 1/1
CII
CII
CII
CII
-
o 1/1
0
1/1
1/1
CII
0 oS
E
o E
E
E
CII
CII
CII
en
-CII
-
.;::
CII
-0
CII
·CII
1/1
_
0 -
-0
... oS
Cl
1/1
...
0 0
0 E
E
1/1
.0
::
.1/1
I'l
l 1i
i C
l 1/1
E
c.
.1::
a.E
1/1
I:
: I'l
l U
1/1
C
l 1/1
1/1
U
C
II-
U
0 o
0 I:
: a.-
1ii
.;::
I:
: CII
CII
I:
: CII
CII
1/1
I:
: CII
8-=-
1::
_
CII
_
01
/1
X
CII
X
0 1
ii_
~-
=-0'::
:: C
CII
I:
: ;
CII:;
:; 1/1
.c
:1/I
1::
1/1
-:u
i U
U
a.
• W
a.
Wu
";:
en
CI)-=-
CII:;
:; 1/1
C
II-
Cl:;
:; 1/1
C
l-_
CII
-
-':
1::
X
1/1
_C
II
·x
ci
...:
D/I~
x
1/1
_1'1
11::
1
UC
l I'l
l I'l
l I:
: I'l
l C
l o
1/1
I'll
I::
o 1/1
C
l I:
: 1/1
c.
.o::
-w~
I'll
1/1
c.. w
.!
lo::
w
O::
I'l
l ..
. CII
E
:E
~"'CII
~.=
.... 5
j ~
~ ..
. 1:
:1::
I::
-0::
ci
..-
EC
lla.
CII
a.
0-
151:
: 0
_
o .
1'11
-1
/1-
-o
a.a
.x
o C
II·-
=>
1ii-
o!!
...
a.x
..
. a.
x ... -
a.-
1ii
1ii
.... ~
...
1'11
...
a.
:iE
CII
CII
'Co
w
...
1'11
oo
w
o I'l
l ,*"~ow ~><~
-..
. 0
-0
15
0
0
Cl
.c:
o ...
...
0 -
0 ...
. 0
X
I'll
-CII
~
~CII
o CII
CII
....
0 ....
w
'*" ..
.. ~
~
0 ~
~a.
0 o
a.
a.
.... ~
0 0
o 0
0 0
0
1 4
5.9
45
.9
100.
0 59
.3
57.2
96
.5
124.
6 22
.3
32.9
2
.0
39.0
48
.6
57.5
71
.7
3.5
4.4
2 60
1.1
395.
7 65
.8
514.
8 50
9.7
99.0
12
8.8
297.
8 19
4.4
17.5
58
.4
75.2
38
.1
49.1
3.
4 4.
4
3 7
.9
7.9
100.
0 11
.1
10.4
93
.7
131.
6 4.
2 5.
2 1.
0 40
.4
53.2
50
.0
65.8
9.
6 12
.7
4 49
.2
44.9
91
.3
65
.6
63.8
97
.3
142.
1 26
.2
36.0
1.
6 41
.1
58.3
56
.4
80.2
2.
5 3.
6
Tot
al
704.
1 4
94
.4
70.2
65
0.8
641.
1 98
.5
129.
7 35
0.5
268.
5 22
.1
54.7
70
.9
41.9
54
.3
3.4
4.4
Co
mp
ari
son
4
14
.3
414.
3 10
0.0
363.
9 35
5.1
97.6
85
.7
188.
9 14
2.3
23.9
5
3.2
45
.6
40.1
34
.3
6.7
5.8
case
Sou
rce:
Sur
vey
Dat
a.

107
was above 100% for the year ended 30-6-99. Further, this ratio was
above 100% during the entire period of study except for one unit
for 4 years. But, for the comparison case, Operating Ratio was
85.7% for the year ended 30-6-99 and was below 100% throughout
the period of study with an average ratio of 88.1 %.
4.7.9 In order to identify the reason for the difference in Operating
Ratios between both the sectors, the pattern of operating expenses
is examined by dividing it into material costs, employees
remuneration and other expenses.
4.7.10For both the sectors, material costs constituted the major portion of
operating expenses when it is expressed as a percentage of
operating expenses or 'operating income. For the WICS, material
costs, on an average, constituted 54.7% of operating expenses or
70.9% of operating income. On the other hand, for the comparison
case, this cost constituted 53.2% (as a percentage of operating
expenses) or 45.6% when expressed as a percentage of operating
Income.
4.7.11 From the analysis of data collected in response to questions under
Section 'E' of the interview schedule, it is observed that defective
purchasing policies framed by the management proved to be an
important reason for the high material costs in WICS. These units

108
failed in purchasing and storing seasonally available food materials
and adopting techniques for long-term preservation. Consumption
of food items by workers themselves escalates the costs. Besides,
WICS purchased their required materials in uneconomic quantities.
Out of the 4 units studied, three units make purchases twice a week
and one unit once a week. Absence of regular customers and
production which does not anticipate demand create more waste
and result in high cost of materials. On the other hand, the
comparison unit is always vigilant in purchasing the required
materials when it is available at cheap rates. This unit makes
weekly purchases in respect of perishable goods and for other
materials, it makes purchases twice a month.
4.7.12To reduce the material costs, WICS have to practice economical
purchases and take steps for storing and preserving the seasonally
available materials for a long period. Preparation of different
varieties of food items can also reduce the material costs, to some
extent. Production in anticipation of demand can reduce the waste
of food items and thereby material costs.
4.7.13 Operating expenses under the head wages and salaries requires a
detailed study. This, cost was also found higher for WICS,
compared to the comparison case, when it is viewed either as a
percentage of operating expenses or operating income. The

109
percentage of wages and salaries to total operating expenses
constituted 41. 9% for WICS and 40.1 % for the comparison case.
When expressed as a percentage of operating income, these ratios
were 54.3% for WICS and 34.3% for the comparison case.
4.7. 14A comparison of labour cost between the units in the co-operative
sector and the comparison case reveals certain factors. The average
number of employees in the co-operative sector was 15 including
the secretary. Time-rate system prevailed as the system of
remuneration. Manufacturing activities and the number of
employees remained the same throughout the year. This has
resulted in the idle time of employees and production which is not
in accordance with the demand. Even with excess labour force,
these units purchased some readymade food items from the market
instead of making them in the unit itself. The labour force of these
units is reluctant to undertake outdoor catering for wedding parties,
domestic functions etc.
4.7.158ut, for the comparison unit, the average number of employees was
4 including the proprietor. The system of wage payment was
time-rate system. During the peak season, this unit employs
additional labourers or gives contract to outsiders whichever is
more profitable to it. This unit produces most of the items in the
unit itself. At the same time the items have a homemade taste.

110
More over, the labourers were utilized at the maximum level and
idle time was reduced to the minimum.
4.7.16 It can be seen from the above that excess labour force in the WICS
has resulted in high labour cost. To overcome this problem, the
WICS can diversify their activities.
4.7. 17The percentage of the third component 'other expenses' was found
low for WICS compared to the comparison case when it is
expressed as a percentage of operating expenses or as a percentage
of operating income. The ratio was observed to be 3.4% for WICS
and 6.7% for the comparison case when viewed as a percentage of
operating expenses and 4.4% and 5.8% respectively as a percentage
of operating income. In spite of high repairing charges and
expenses incurred in connection with meetings of board of directors
and shareholders, this ratio was low for WICS because of their low
rate of depreciation on assets. Apart from this, all the four units in
the WICS have their own building and so need not pay rent.
4.7.18Thus the financial performance analysis of food preparing units of
WICS presents a deplorable picture. The Operating Ratios and Net
Profit Ratios highlighted the poor financial performance for this
category of WICS. On the other hand, the comparison unit shows
signs of satisfactory financial performance. Thus it can be inferred

111
that through proper planning and containment of material and
labour costs, financial performance of these units can be improved
considerably.
4.7. 19Financial solvency of both the sectors was assessed with the help of
Debt Equity Ratios and Current Ratios, details of which are given
in Table 13.
Table 13
Debt Equity Ratios and Current Ratios
WICS Comparison case
Units Current Current Debt Equity Ratios
Ratio Debt Equity Ratios
Ratios
30/6/94 30/6/99 30/6/99 30/6/94 30/6/99 30/6/99
1 l.2 3.7 2.3 0.3 0.4 2.8
2 6.2 2.2 3.6
3 0.2 0.9 2.8
4 -27.4 -2.0 0.4
Average -4.95 1.2 2.3
Source: Survey Data.
4.7.20For WICS, as on 30/6/99, Debt Equity Ratios, a measure of
long-term solvency, varies between -2.00 and 3.2 with an average
of 1.2. One unit had negative Debt Equity Ratio. It can be observed
that only_ one unit had a favourable long-term financial solvency

112
position. As on 30/6/94 this ratio ranges between -27.4 and 6.2 and
none of the units had a satisfactory long-term solvency position. Of
the total share capital 'of Rs 4,10,300 as on 30/6/99, 84.9%, 1.e.,
Rs.3,28,400 was contributed by the government. But the
shareholders fund as on 30/6/99 was Rs 2,85,900. This difference is
mainly on account of huge accumulated losses which had eroded a
portion of equity capital. For one unit this Ratio is negative. This
is due to negative equity shareholders fund which resulted from
erosion of the whole equity capital by the accumulated losses.
4.7.210n the other hand, the comparison unit showed a Debt Equity Ratio
of 0.4 as on 30/6/99 as against 0.3 an 30/6/94. The debt content is
low for this unit because of the sufficiency of capital generated in
the business as a result of ploughing back of profits.
4.7.22Short-term solvency measured with the help of Current Ratio
reveals that as on 30/6/99 this Ratio ranges between 0.4 and 3.6
with an average of 2.3. Taking the standard ratio at 2: 1 with a
maximum variation of ± 1, it can be inferred that two units had
achieved the standard. They can be said to have a satisfactory
short-term solvency position and effective working capital
management. For one unit, the ratio was above the standard and
effectiveness of working capital management of this unit is
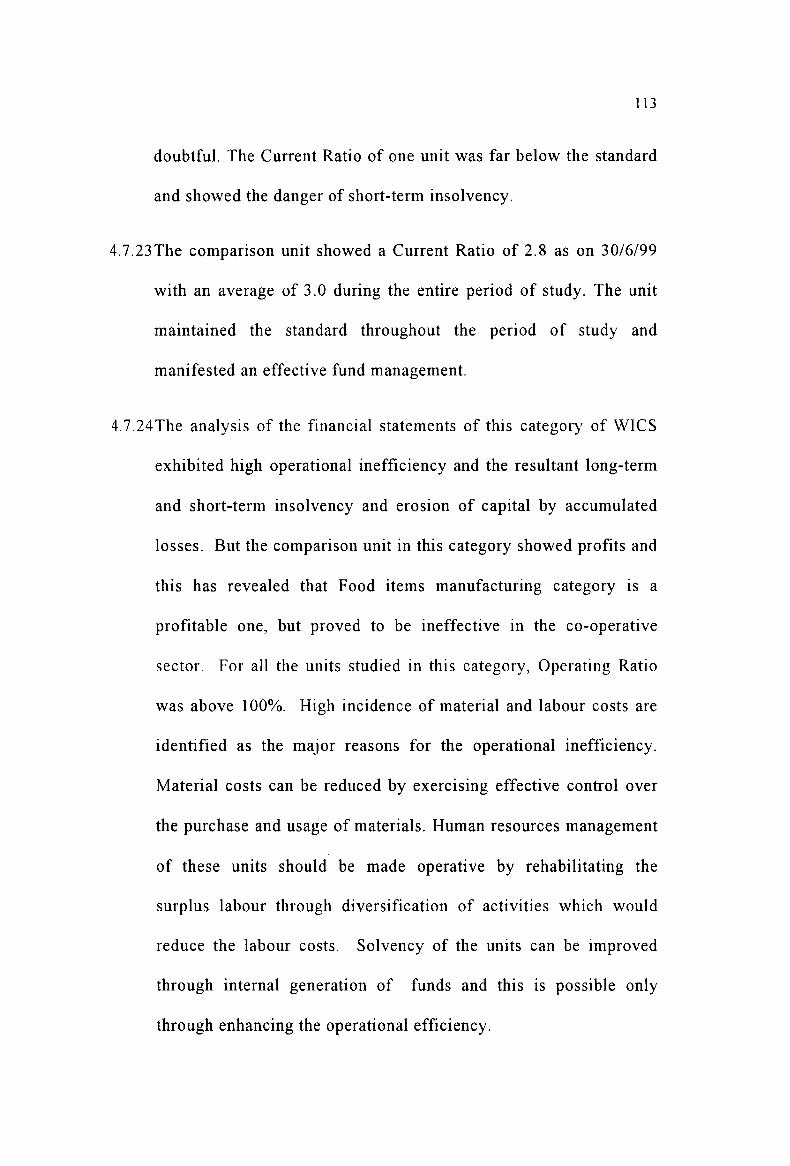
113
doubtful. The Current Ratio of one unit was far below the standard
and showed the danger of short-term insolvency.
4.7.23The comparison unit showed a Current Ratio of 2.8 as on 30/6/99
with an average of 3.0 during the entire period of study. The unit
maintained the standard throughout the period of study and
manifested an effective fund management.
4.7.24 The analysis of the financial statements of this category of WICS
exhibited high operational inefficiency and the resultant long-term
and short-term insolvency and erosion of capital by accumulated
losses. But the comparison unit in this category showed profits and
this has revealed that Food items manufacturing category is a
profitable one, but proved to be ineffective in the co-operative
sector. For all the units studied in this category, Operating Ratio
was above 100%. High incidence of material and labour costs are
identified as the major reasons for the operational inefficiency.
Material costs can be reduced by exercising effective control over
the purchase and usage of materials. Human resources management
of these units should be made operative by rehabilitating the
surplus labour through diversification of activities which would
reduce the labour costs. Solvency of the units can be improved
through internal generation of funds and this is possible only
through enhancing the operational efficiency.

114
4.8 Miscellaneous Products Manufacturing Units
4.8.1 Miscellaneous products manufacturing category of WICS includes
50 units engaged in different activities like printing and
bookbinding, manufacturing of leather chappals, fancy items,
cement paint, soap and detergent powder, handicrafts, meter
repairing, engineering and technical services. A sample of 20%,
i. e., 10 units are covered by the study. One unit from the
non co-operative sector is taken as comparison unit and this unit is
also owned and operated by women. This unit is engaged in
printing and bookbinding.
4.8.2 A scrutiny of profitability of this category reveals that 6 units
showed net profits for the year ended 30/6/99 and their Net Profit
Ratios varied between 15% and 49.3%. For the remaining 4 units,
Net Profit Ratios vary between -7.5% and -27.4%. Units engaged
III printing and bookbinding (two units among three),
manufacturing of fancy items and handicrafts had incurred net
losses. Meter repairing unit had the highest Net Profit Ratio and
handicraft unit incurred the highest net losses for the year ended
30/6/99. Leather chappals manufacturing unit, which had a Net
Profit Ratio of 1.5% during 98-99, incurred net losses during the
remaining five years and its average Net Profit Ratio during the
entire period of study was also negative, ie, -13 .4%. Similarly the

115
meter repairing unit which had a Net Profit Ratio of 49.3% for the
year ended 30/6/99 incurred net losses for one year, i.e., during
1993-94. The remaining units in this category evinced the same
trend throughout the period of study.
4.8.3 The comparison unit showed net profit during the entire period of
study. Net Profit Ratio for this unit for the year ended 30106/99 was
43.9% and its average Ratio during the entire period of study was
32.9%.
4.8.4 In order to ascertain the differences in the Net Profit Ratio between
the units in the WICS and the comparison case, Operating Ratios
were calculated. Income from sales constituted the only source of
operating income for all the units studied under this category. So a
companson is possible between Operating Ratio and Net Profit
Ratio.
4.8.5 Details regarding total income, total operating Income, total
expenses, total operating expenses, major components of operating
expenses and their relevant ratios for the year ended 30-6-99 are
given in the table 14.

~~--------
---.-
__
.IC
II
_ .......
O..
,.t.
... J
.I_
r~gftrdJ.ng
T~t:
... I I;nc~~e. T~t
:aI
C)p
erat:
in.g
In.c~~e.
T~t:
al C
)p
erat:
in.g
Ex
pen
.ses.
Majo
r C
OD
1p
on
en
t:s o
f
Op
erat:
ing
Ex
pen
ses a
nd
Rele
van
t: R
at:
ios f
or t
:he y
ear e
nd
ed
30
-0
6-1
99
9
WIC
S
Rs.
in
'O
OO
s -
--
1 2
3 4
5 6
7 8
9 10
11
12
13
1
4
15
16
17
CI.I 0
C/l CI.I
CI.I
CI.I -
C/l ~
o C/l
0 CI.I
C/l 0
o E
o
E
E
CI.I E
CI.I
CI.I CI.I
ui
-CI.I
-CI.I
-0
.;:
~
0 -
~.smC/l
~
0 0
E
0 E
E
C/l
.0::
'C
/l 'C
I.I
ra C/l
C;
m C
/l C/l
m
C/l
-0
U
C
o.
c o
.E
C/l C
ra
u C/l
u CI.I
C/l C
CI.I
CI.I
-U
0
o 0
0.-
X
CI.I X
0
C;~
C;
!-=
-.;:
C
CI.I
et:
C
CI.I C
CI.I
CI.I C
.e
C/l
C
C/l -=-
=-CI.I~
OC
/l :S
CI.I
:;:::;
C/l
:t:::
u-=
-u
U
0.
. W
o.
Wu
0t
: ui
rn-=
-CI.
I:;:::;
C/l C
I.I-
m:;:
::;
C/l m
-_
CI.
I-C
C/l
.C/l
EE
x
C/l
_CI.I
oI
j~
X
C/l _
raC
-m
ra
ra C
ra
m
o C/l
ra C
O
C/l
m
C
0.0:
: 'x
ei
..c
~o::
ra
~
CI.I ra
C
:is:
~CI.
I ... ~~~
... C
c
-0::
w~
ra C/l
o.w
w
O::
==.!:
=>
C
;-
0-
ei..
--
C
0_
0
-:
ra -
C/l
--
EC
I.Io
. E:
;:::;
CI.I
o.
o o
.o.x
o
CI.I
.-O
!!
o CI.I
~
... 8
"x
..
. 0.
x
... -0
.--
C;
C;
1-0
. ...
ra
...
0.
::a:
CI.I CI.I
...
ra O
Ow
o
ra ~~Ow ~x~
0 ..
. 0
-0
-0
0
m
.e
o W
o
~
~
o CI.I
CI.I I-
-0
1-
0 x
~{!.
ra
-CI.I
~
~CI.I
0 I-
W
~
:is:
0 ~
~o.
0 o
0.
0.
I-~
0 0
0 o
0 0
0 0
1 51
.2
51.2
10
0.0
62.2
59
.9
96.3
11
7.0
27.5
30
.0
2.4
45.9
53
.7
50.1
59
.0
4.0
4.7
2 50
.7
44.3
87
.4
55.8
54
.9
98.3
12
3.9
21.7
30
.2
3.0
39.5
49
.0
55.0
68
.2
5.5
6.8
3 35
6.4
349.
5 98
.1
317.
8 31
5.0
99.1
90
.1
132.
5 13
0.3
52.2
42
.1
37.9
41
.4
37.3
16
.6
14.9
4 30
0.0
300.
0 10
0.0
295.
6 29
2.0
98.8
97
.3
174.
5 11
2.6
4.9
59.8
58
.2
38.6
37
.5
1.7
1.6
5 14
2.2
113.
6 79
.9
173.
3 10
4.2
60.1
91
.7
57.0
43
.9
3.3
54.7
50
.2
42.1
38
.6
3.2
2.9
6 12
1.7
118.
2 97
.1
130.
6 13
0.0
99.5
11
0.0
57.5
66
.2
6.3
44.2
48
.6
50.9
56
.0
4.8
5.3
7 62
8.1
599.
3 95
.4
332.
5 16
7.2
50.3
27
.9
59.5
10
2.8
4.9
35.6
9.
9 61
.5
17.2
2.
9 0.
8
8 58
.4
58.4
10
0.0
46.3
44
.3
95.7
75
.9
13.5
29
.0
1.8
30.5
23
.1
65.5
49
.7
4.1
3.1
9 50
7.5
501.
0 98
.7
494.
8 48
9.7
99.0
97
.7
347.
4 12
5.8
16.5
70
.9
69.3
25
.7
25.1
3.
4 3.
3
10
1423
.7
1410
.9
99.1
13
44.7
13
04.9
97
.0
92.5
94
7.7
296.
7 60
.5
72.6
67
.2
22.7
21
.0
4.6
4.3
Tot
al
3639
.9
3546
.4
97.4
32
53.6
29
62.1
91
.0
83.5
18
38.8
96
7.5
155.
8 62
.1
51.8
32
.7
27.3
5.
3 4.
4
Co
mp
a
riso
n
489.
6 48
8.2
99
.7
275.
3 27
5.3
100.
0 5
6.4
16
6.2
73
.5
35.6
60
.3
34.0
26
.7
15.1
12
.9
7.3
case
-
--
-----
----
--
-
Sou
rce:
Sur
vey
Dat
a.

117
4.8.6 Operating income, on an average, constituted 97.4% of total
income for the units in the co-operative sector ranging from 79.9%
to 100%. The non-operating income for these units was derived
from the government as grants and subsidies. The unit, for which
this ratio was 79.9%, received financial assistance from the local
self government under people's planning. But, for the comparison
unit, 99.7% of its total income was derived as operating income.
The amount received from the panchayat for giving training in
printing and book binding to economically backward women was
their only source of non-operating income.
4.8.7 For WICS the operating expenses, on an average, constituted 91 %
of the total expenses. But this ratio was observed to be 100% for
the companson case. For WICS, a major share of the
non-operating expenses consisted of interest on borrowings. On
the other hand, the comparison unit, though dependant on
borrowings, did not incur any expenses under the head interest
because the loan was provided by family members free of interest.
H.8 It can be seen from table 14 that for the WICS, Operating Ratio
varied between 27.9% and 123.9% for the year ended 30-6-99 and
Operating Ratio of three units were above 100%. The meter
repairing unit showed ·the least Operating Ratio and printing and
bookbinding unit had the highest. For the comparison case,
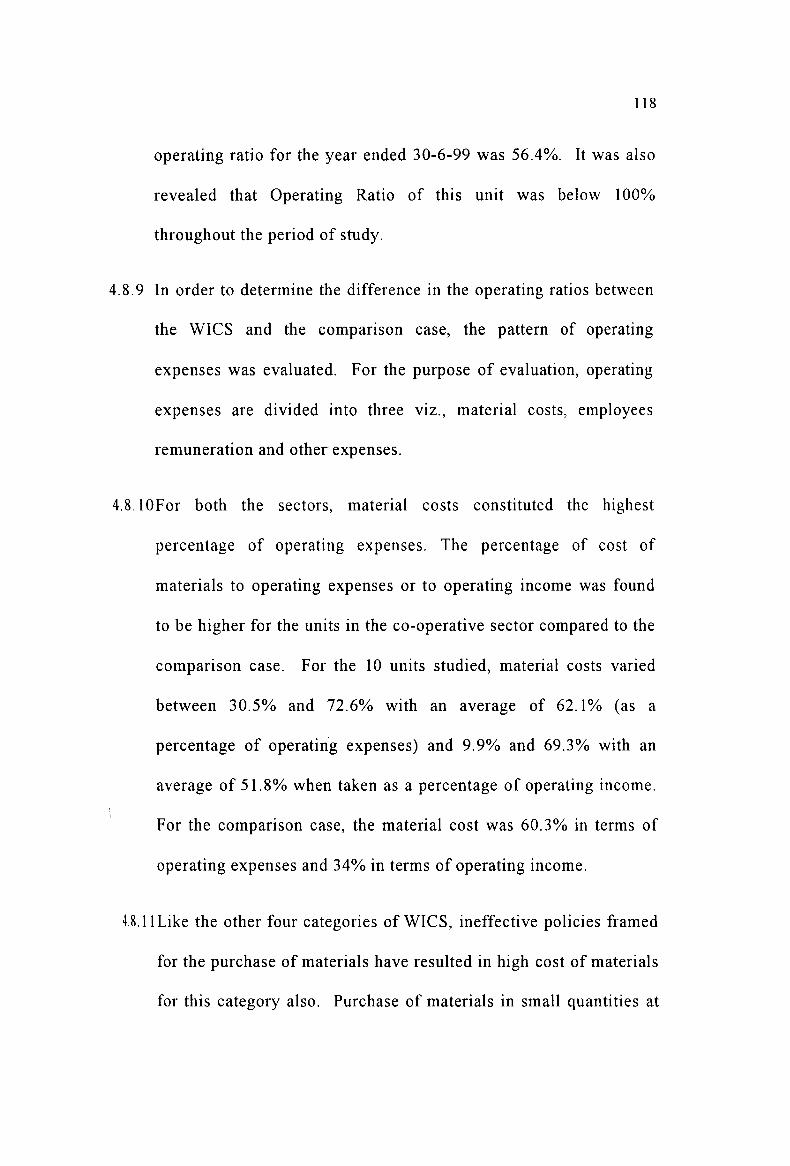
118
operating ratio for the year ended 30-6-99 was 56.4%. It was also
revealed that Operating Ratio of this unit was below 100%
throughout the period of study.
4.8.9 In order to determine the difference in the operating ratios between
the WICS and the comparison case, the pattern of operating
expenses was evaluated. For the purpose of evaluation, operating
expenses are divided into three viz., material costs, employees
remuneration and other expenses.
4.8.10For both the sectors, material costs constituted the highest
percentage of operating expenses. The percentage of cost of
materials to operating expenses or to operating income was found
to be higher for the units in the co-operative sector compared to the
comparison case. For the 10 units studied, material costs varied
between 30.5% and 72.6% with an average of 62.1% (as a
percentage of operatin'g expenses) and 9.9% and 69.3% with an
average of 51.8% when taken as a percentage of operating income.
For the comparison case, the material cost was 60.3% in terms of
operating expenses and 34% in terms of operating income.
4.8.11 Like the other four categories of WICS, ineffective policies framed
for the purchase of materials have resulted in high cost of materials
for this category also. Purchase of materials in small quantities at
119
high prices resulted in high cost of materials. Out of the 10 units
studied, 4 units make purchases once a week, two units twice a
month and 4 units once a month. 4 units in this category make
local purchases. However, the comparison unit makes monthly
purchases. This unit has regular vendors and customers which
enable it to adjust the production on the basis of demand and to
frame suitable purchasing policies. The comparison unit adopts
modern techniques, viz., DTP, offset printing etc which enhance its
bargaining power considerably.
4.8.12 'wages and salaries' the second important item under the head
operating expenses constituted, for WICS, 32.7% when expressed
as a percentage of operating expenses or 27.3% as a percentage of
operating income. But, for the comparison case, these ratios were
26.7% and 15.1% respectively.
4.8.13 High labour cost in the form of 'wages and salaries' in the
co-operative sector can be attributed to some important reasons.
The average number of employees in the co-operative sector was 14
including the secratary/manager. In this category, 6 units out of 10
adopt time-rate system as the system of wage payment. The
remaining 4 units have piece-rate system. The number of
employees remained the same throughout the year disregarding the
slack and peak seasons. This creates idle time which increases the

120
cost of labour. Since the machines used in these units are outdated,
their breakdown leads to frequent suspension of work. This has also
resulted in the loss of ' remunerated labour hours and thereby high
labour cost.
4,8, 14But for the comparison unit, the average number of employees was
5 including the owner. This unit followed piece-rate system as the
system of wage payment. During peak seasons, these units employ
casual workers on daily wages system. Careful handling and better
maintenance of machines reduce the idle time and thereby labour
cost.
4.8,15 To reduce the labour costs, WICS can frame a suitable human
resources management policy. To eliminate the disguised
unemployment, these units can go for diversification of activities.
4,8, 16In connection with the third component 'other expenses' WICS are
in an advantageous position. The ratio of depreciation is low for
these units. 7 out of 10, units have their own buildings and need not
pay rent. One unit had not paid any sitting fees either to the board
of directors or to the shareholders in their meetings. But the
repairing charges incurred by these units were high.
4.8, 170n the other hand, for the comparison unit, the rate of depreciation
is double that of the units in the co-operative sector. Similarly, this
121
unit owns expensive modern machines and thereby the amount of
depreciation was high. This unit is operated in hired buildings and
is required to pay rent. But the administrative expenses of this unit
are low since they ne"ed not pay any sitting fees either for the
meetings of the Board of Directors or shareholders.
4.8.18 Profitability analysis of Miscellaneous products producing category
of WICS indicates that units engaged in the production of some
articles operated efficiently and showed net profits. For some other
units, operating losses and net losses became a common
occurrence. Through proper control of expenses and framing of
suitable purchasing and human resources management policies,
these units can improve their performance considerably.
4.8.19The solvency position of units under this category was assessed
with the help of Debt Equity Ratios and Current Ratios. Table 15
reveals the details of Debt Equity and Current Ratios.

122
Table 15
Debt Equity and Current Ratios
WICS Comparison Case
Units Current Current Debt Equity Ratios
Ratio Debt Equity Ratios
Ratio
30/6/94 30/6/99 30/6/99 30/6/94 30/6/99 30/6/99
1 7.2 -3.3 0.5 0.1 0.1 2.5
2 77.9 -2.9 0.6
3 5.1 l.1 4.2
4 0.3 14.7 0.7
5 2.2 -3.5 0.8
6 -11.4 -6.3 l.2
7 4.8 0.3 15.5
8 0.1 0.1 6.5
9 0.2 0.2 4.7
10 6.0 l.1 l.6
Average 9.2 0.15 3.6
Source: Survey Data.
4.8.20In the co-operative sector, 6 units showed positive Debt Equity
Ratio as on 30/6/99 ranging between 0.1 and 14.7. For the
remaining 4 units it was negative because the shareholders fund
was negative as a result of erosion of equity shareholders fund by
huge accumulated losses. In general, the Debt Equity Ratio

123
revealed that the long-term solvency position of all the units is far
from satisfactory.
4.8.21 Debt Equity Ratio of the comparison case was 0.1 as on 30/6/94
and this Ratio remains the same as on 30/6/99. The smaller
proportion of debt content for this unit was the outcome of
adequacy of owners' fund for meeting the financial requirements
of the business.
4.8.22Short-term solvency position of WICS was computed with the help
of Current Ratio. This Ratio reveals that only two units had a
satisfactory short-term solvency position as on 30/6/99 taking the
standard ratio at 2: 1 with a maximum variation of ± 1. Current
Ratios of 4 units were high and this provides ground for suspecting
the efficiency of working capital management. For the remaining 4
units, this Ratio was below one and this showed symptoms of
short-term insolvency.
4.8.23For the comparison unit the Current Ratio was 2.5 as on 30/6/99.
Since the current ratio of this unit had attained the standard, the
short- term solvency position of this unit is said to be satisfactory.
4.8.24Analysis of the financial statements of WICS had revealed
operational inefficiency and the associated insufficient liquidity
compared to the comparison case. Operational inefficiency was

124
mainly because of high rate of material and labour costs. Adoption
of an effective purchasing policy and human resources management
policy can reduce these costs. Debt Equity and Current Ratios have
revealed an unsatisfactory solvency position. In order to solve this
problem, equity base has to be strengthened through internal
generation of funds. This proves that if caution and circumspection
are exercised for controlling operating expenses, WICS can operate
on profits.
4.9 Summary of the Analysis of Financial Statements
4.9.1 Profit and Loss Account analysis has revealed that the comparison
cases have earned profits throughout the period of study. But 23
out of 35 WICS studied were running on losses for the year ended
30-6-'99. Only 5 WICS showed profits during the entire period of
study. Among the 5 'categories of WICS, Petroleum byproducts
manufacturing category was the least profitable. All the 3 units in
the Petroleum byproduct manufacturing category were running at
losses. For the Tailoring and Garment manufacturing category, 60
per cent of the units were running on losses throughout the period
of study. For the remaining 3 categories the trend was more or less
the same. Grants and subsidies from the government constituted
the main source of non-operating income for the WICS. It was
observed that the ratio of non-operating income to total income, on

125
an average, was high for WICS. But for the comparison cases in 3
categories, namely, Petroleum byproducts manufacturing, Food
items manufacturing and Assembling, 100 per cent of its total
income were derived as operating income. Ratio of operating
expenses to total expenses was low for the comparison cases
because their rate of interest on borrowings was high compared to
the WICS. The Ratio of cost of 'materials' and 'wages and
salaries' to operating expenses/operating income favoured the
comparison cases while the ratio of 'other expenses' to operating
expenses/operating income favoured the WICS. The reasons for
high cost of materials and labour are observed to be due to
ineffective purchasing practices and improper human resources
management. Low rate of depreciation and the advantage of their
own building resulted in low percentage of the third component
'other expenses' for WICS. Adoption of suitable purchasing policy
and an effective human resources management policy can reduce
the material and labour cost in WICS.
4.9.2 Analysis of Balance sheet of the WICS has revealed that their
solvency position is under threat and worsening year after year.
The Debt Equity Ratio of 14 units was negative as on 30-06-99 due
to erosion of funds. As a major portion of share capital of WICS
was contributed by the government, erosion of capital means

126
wastage of public funds. But for the comparison cases networth
was observed to be on the increase due to internally generated
funds. Short-term solvency of the WICS was found feasible only in
the case of 15 units as on 30-06-99. But for the comparison cases,
this ratio was found reasonable for three units and found high for
two units. This implies that there is no threat to the solvency
aspects of the comparison units.
4.9.3 Thus it can be seen that when all the comparison cases were doing
well both in terms of operational efficiency and financial solvency,
these aspects of WICS are found to be far from satisfactory. This
obviously indicates that the problem lies not with the area of
activity of WICS, but with the way in which they carry them out.
In the light of views expressed by the respondents and on the basis
of analysis of data a few suggestions are given in 4.10, 4.11 and
4.12 for improving the operational efficiency and thereby the
financial health of the WICS.
4.10 Marketing Practices
4.10.1 The only source of operating income for all the WICS studied was
sales revenue. Marketing practices adopted by the WICS were
analysed on the basis of data collected in response to questions
under section 'F' of the interview schedule. Uniformity has been

127
observed in marketing practices among all the WICS. A cursory
reading of data in this regard has revealed that all the WICS are
totally unaware of the very concept of sales promotion.
4.10.2When production is not in anticipation of demand and products
have perfect substitutes in the market, the role of advertisement in
selling the products needs no emphasis. However in spite of the
fact that there were schemes of incentives from the government for
advertising, not even a single WICS has made use of advertisement
of any type for their products. The name board exhibited in front
of the office of each Society was observed to be the only medium
drawing the attention of the public to its existence and its products.
4.10.3 Though the average number of employees per Society was 17, not
even a single employee was assigned the job of selling the
products. All the WICS used to sell their products directly to the
customers during the turnout over the counter. The only exception
noticed was the WICS in the Thrissur district of which a portion of
the products are marketed through Central Vanitha Industrial
Co-operative Society. Even in this case, the percentage of sales
effected through the Central Society to the total sales revenue of
the WICS was around 30% only. All the WICS had only local
customers who were not very prosperous.

128
4.10.40nly 2 units m the Assembling category are engaged in the
manufacturing and selling of durable goods. For these 2 units, the
concept of after sales service was not known. Quality of the
products and services also was not found to be an advantageous
factor for the WICS. There were no schemes for WICS to get
feedback from the customers and hence the societies were unable to
do anything to ensure commendability in quality. However,
discussions with authorities of WICS, DICS etc, on conditions of
confidentiality and anonymity have proved ample evidence to
arrive at the certainty that WICS do not have much to be gratified
as far as the quality of their products and services is concerned.
4.10.5Further aggravating this bleak scenano probably in order to
increase the volume of sales, all WICS used to sell their products or
render services both on cash and credit basis. Though the exact
amount of bad debts was not available for each year because of the
defective accounting system they maintained, the respondents were
unanimous that 2 to 3 per cent of sales of every year are becoming
bad debts.
4.10.6As has already been stated, cost of production of WICS when
compared to the comparison units was high during the period of
study. This has invariably forced the WICS to keep the sales prices
129
of their products high when compared to that of comparison units
and other producers.
4.10.7What to produce and when to produce are two important questions
to be decided before initiating any manufacturing and trading
concern. Data collected in this context and the views expressed by
the respondents, testify to the fact that it is difficult for the units
concerned to justify the selection of their products. Before their
commencement or during their period of existence none of the units
had conducted a market study or even a survey to identify their
potential customers and their tastes and preferences.
4.10.80n the contrary, for all the companson units studied, cost of
production was comparatively less. Therefore, they could sell their
products at lower prices. In order to cater to the changing
requirements of the customers these units ensure regular training to
human resources both in the production and marketing sides. It is
important to note that even the comparison units have not depended
on advertisement for marketing their products. An exception was
food manufacturing unit which advertised its products through
cinema slides. Regular customers through personal contacts,
selling through external retailers, providing attractive incentives to
the retailers, negligible bad debts etc. help these units to ensure
better sales revenue.
130
4.10.9Thus it has been observed that higher cost of production, poor
quality, lack of publicity and absolute ignorance about sales
promotion measures constitute the other shortcomings of the WICS.
In view of the opinions expressed by the respondents and on the
basis of information emanating from the analysis made in this
respect it is found necessary that the WICS can overcome these
challenges by adopting necessary remedial measures. The following
are the guidelines pertaining to these measures;
a) Identify the right product suitable to the locality and alter or
diversify their activities.
b) Instead of continuing with sales over the counter, the WICS
have to seek the support of retailers and commission agents on
attractive schemes of incentives. It is necessary that the WICS
have to price their products and services comparatively with the
prices of the products of the competitors. This may necessarily
involve cost reduction methods like maximum utilisation of
human resources. In the initial stages reduction of the labour
force may constitute an imperative. However along with the
progress in sales and production the breach can be rectified or
reduced.

131
c) Largescale advertisements is neither possible nor desirable for
the WICS because of the present dismal state of affairs.
However modes of less expenSIve advertisement like
distribution of notices through newspaper agents, advertising
through cinema slides etc. seem to be timely and justifiable.
Introduction of door delivery system on commISSIon basis
through casual employees is also worth trying.
4.11 General Management .Practices
4.11.1 A democratic form of management prevails in a co-operative
society. In a co-operative unit power is vested in its general body
of members subject to the framework of the Co-Operative Societies
Act. For facilitating the administration, the members elect from
among themselves the members of the Board of Directors and the
Board is responsible for the direct management of the Society. All
important decisions fOf'the day to day management are taken in the
meetings of the Board of Directors.
4.11.2Analysis of the general management practices in the WICS is done
based on the data collected in response to questions under
Section G of the interview schedule.
4.11.3A cursory reading of data on educational qualifications of board
members has revealed that out of 245 Board Members, 183 (74.7%)

132
have Secondary School Education, 36 (14.7%) have Higher
Secondary School Education, 15 (6.1 %) are Graduates and 11
(4.5%) have professional qualifications, viz. ITI & Polytechnic
diplomas. Among the Board Members, 79% are the workers of the
Society and 21 % belong to the non-worker group. Housewives and
social workers constitute the non-worker Director Group. 88% of
the Board Members are directly associated with political parties.
4.11.4All the WICS have convened the Annual General Body Meeting
every year. Taking into account the views expressed by the
respondents it is observed that these meetings were convened only
to satisfy the statutory requirement rather than to transact any
genuine business of the society. The bylaws of all the WICS made
it mandatory to convene the meetings of Board of Directors at least
once in a month. It has been found that, on an average, three
meetings were held a year during the period of study. Discussions
with the Directors revealed that there was no necessity to convene
the Board meetings. Though 4.6% of operating expenses were
incurred for convening and conducting of the meetings of directors
and share holders, minutes of such meetings disclosed that the
meetings were more a ritual than serving any genuine business
requirement.
133
4.11.50n the other hand, all the companson cases were
sole-proprietorship firms. All important decisions are taken by the
proprietor by carefully analysing the economic and market pulses.
They are in an advantageous position compared to WICS since they
need not get the approval of any other person for taking and
implementing strategic decisions. If essential, they consult experts
in the field.
4.12 Human Resources Management
4.12.1 Management of human resources has a very important role to play
in the success of any business enterprise. This is due to the fact
that the human asset is the centre of all resources and that it
converts the various resources into productive resources. The
importance of human factors and their effective utilisation in any
type of co-operative is no exception to this rule. For a competent
human resources management, human resources recruitment,
training, performance evaluation etc are to be executed in an
effective manner. These factors are considered in the evaluation of
human resources management.
4.12.2Human resources management in WICS were analysed on the basis
of data collected in response to questions under section 'H' of the
interview schedule.

134
4.12.3All the WICS had only regular employees appointed from among
members and the only criterion for their appointment was their
share holding. There was no correlation between level of activity,
volume of turnover and the number of employees. The average
number of employees' in the WICS was 17 and the same for
comparison units was 6. On the other hand, the turnover of the
comparison cases has been found to be much higher than that of
WICS. This indicates that the WICS have been employing human
resources without employment causing chronic and acute disguised
unemployment.
4.12.4Every WICS had a Chief Executive Officer under the designation
of Secretary/ Manag~r. It was observed that in all cases the
Secretaries / Managers are qualified only in co-operation without
any know-how, expertise and explosure to the manufacturing and
marketing of the product. The appointment in WICS were a
consequence of the misinterpretation of co-operative Rules and
informal instructions from the Co-operative Department.
Entrepreneurial skills and basic business awareness are the
minimum qualifications required for the Chief Executive Officer of
the WICS. The selection of Secretary/Manager of WICS made by
inviting applications through newspapers and conducting an
interview. The interview Board consists of representatives from
135
the Government and Board of Directors. The final decision on
appointment is usually left to the discretion of the Board of
Directors. Since the Board of Directors is not competent enough
to select the Secretaries, the selection often proves to be unsound.
4.12.5A remuneration system based on the skill and ability of workers is
important. All the WICS studied except 5 had adopted time-rate
system as the system of wage payment. The daily average rate of
earning per employee in WICS was Rs.28. On the contrary, in
comparison cases, piece-rate system of remuneration prevailed and
this enabled these units to adjust the number of employees in tune
with seasonal fluctuations. Their daily earnings, on an average,
was Rs. 72/-.
4.12.6The remuneration of the Secretary/Manager is fixed by the Board
and it ranges from Rs.800 to Rs.1800 per month. Invariably
competent secretaries seek better avenues leading to instability with
regard to their functioning. Each new Secretary takes time to
acquaint herself with the working of the society.
4.12.7Working hours of a business organisation IS another important
factor in assessmg the effective utilisation of human resources.
Though the working time of the WICS is 10.00 a.m. to 5.00 p.m.,
the discussions with the employees and officials of District

136
Industries centres have revealed that they usually work from 10.00
a.m. to 2.00 or 3.00 p.m. They attributed this brief period of
activity to insufficient volume of work. But the comparison units
work from 10.00 a.m. to 5 p.m. and discussions with the workers
and entrepreneurs of these units revealed that they are ready to
work late hours and even on Sundays.
4.12.8Need-based training to' employees will enhance their efficiency in
performance of work. Data relating to training of employees
indicate that workers of 13 units had undergone training provided
by the Block Panchayat for a period of one week, 2 units for 2
weeks and one unit for three weeks. Discussions with the
respondents have revealed that training is not compulsory and the
existing training programme is inappropriate, inadequate and not
need-based.
4.12.9Secretary/manager of only 3 units had attended EDP training. This
was mainly due to frequent changes in the post of Secretary
because of better opportunities elsewhere.
4.12.10Monetary and non-monetary incentives in addition to wages/
salaries will boost the morale of the employees. But no WICS
had provided these incentives either to workers or to the
Secretary.
137
4.12.11 Performance appraisa} is desirable for enhancing the efficiency of
workers. However considering the views expressed by the
respondents, it was observed that WICS are not aware of this
concept and have not adopted an effective appraisal method. On
the other hand units in the comparison cases, through not in a
formal way, used to evaluate the performance of workers and
provide them with a feedback of work. This has enabled them to
improve their efficiency.
4.12. 12Since workers are the members of the WICS, loss of labour hours
due to strike, lockout etc. during the period of study was nil.
However it was observed that this created no favourable effect on
production or labour efficiency.
4.12.13 WICS face labour turnover problems which is evident from the
fact that this ratio was 4.3% for the year ended 30-06-1999. To
measure the level of labour turn over, Labour Quitting Ratio (the
ratio of number of employees left during the year to average
numbers of employees during the year) was used. Since WICS
face the problem of disguised unemployment, these employees
were not replaced. Discussions with the Directors and workers
have disclosed that dissatisfaction with the remuneration,
non-viability of the unit etc. are responsible for this. But for the
comparison cases, thi~ ratio was only 2.4%.

138
4.12.14The above facts elucidate that human resources management is
ineffective in WICS. Lack of a proper and need-based recruitment
policy, absence of effective training and lack of performance
appraisal methods are identified as indicators of ineffective human
resources management in WICS. To make it effective, the
following suggestions appear to be in the fitness of things.
(a) Prior to sanctioning registration to the WICS, the
Co-operative Department has to ensure that a minimum
number of members in each society have expertise in
that field.
(b) The terms and conditions for the appointment of
Secretary / Manager shall include prOVISIOn for a
mmImum period of serVIce m the WICS. Either
professionals shall be appointed as Secretary or
through proper training they shall be converted to
professionals.
(c) Disguised unemployment need be reduced through
diversification of activities.
(d) A remuneration system where wage rates are
determined on the basis of ability may be designed.

139
(e) Performance of employees need be evaluated and they
should be provided with a feedback of their work so as
to enable them to rectify their mistakes and improve
their efficiency.
* * *