Embed Size (px)
Citation preview

International Development
ISSN 1470-2320
Working paper Series 2014
No.14-151
Estimating Incumbency Advantages in African Politics:
Regression discontinuity evidence from Zambian parliamentary and local government
elections
Bobbie Macdonald
Published: April 2014 Department of International Development
London School of Economics and Political Science
Houghton Street Tel: +44 (020) 7955 7425/6252
London Email: [email protected]
WC2A 2AE UK Web site: www.lse.ac.uk/depts/ID

Abstract
Are incumbents disproportionately advantaged at the polls relative to non-incumbents in
Africa’s emerging democracies? The prevailing wisdom characterises African politics as
predominantly ‘neopatrimonial’ and ‘semi-authoritarian’ in which incumbents
systematically manipulate the electoral process to their own advantage. In stark contrast to
this perspective, this study finds significant incumbency dis-advantages in Zambia’s local
government elections using a regression discontinuity approach, as well as no discernible
incumbency advantages at the parliamentary level over the period 1991-2011.
Furthermore, the strength of these disadvantages appear to be closely associated with
higher levels of voter information, poorer economic conditions, and a structural shift in
party competition. These results effectively expand the incumbency effects literature into
the African context and offer an important contrast to the conventional wisdom of African
politics.

Table of Contents
1. Introduction.............................................................................................................. 1
2. Sources of incumbency advantage and disadvantage ................................................ 3
3. African politics and Zambia’s democratic transition .................................................. 6
3.1. The Prevailing wisdom on African politics....................................................................... 6
3.2. Zambia’s democratic transition ...................................................................................... 8
4. Methods and Data .................................................................................................... 9
4.1. Identification in the RD framework ................................................................................ 9
4.2. Estimation approach .................................................................................................... 11
5. Results.................................................................................................................... 13
6. Explaining Zambia’s incumbency disadvantages ..................................................... 22
6.1. The Role of voter information and economic conditions ............................................... 22
6.2. Political competitiveness and a shifting party system ................................................... 27
6.3. Limitations .................................................................................................................. 31
7. Concluding remarks ................................................................................................ 33
8. References .............................................................................................................. 34
Appendix A. Zambian electoral results, 1991-2011 ...................................................... 44
Appendix B. Number of observations and electoral performance in t+1 ....................... 45
Appendix C. Conditional estimates of incumbency effects, Ward and Parliamentary elections..................................................................................................................... 47
Appendix D. Placebo outcome tests ............................................................................ 48
Appendix E. McCrary Density tests .............................................................................. 50

page 1 of 52
1. Introduction
Do the many perks of holding public office translate into significant electoral
advantages for incumbents in Africa’s emerging democracies? The effects of holding
office on electoral performance has been one of the most widely studied topics in
American politics (Ansolabehere, Snyder, & Stewart, 2000; Gelman & King, 1990;
Erikson, 1971) and has generated much interest in other mature democracies (Katz &
King, 1999; Hainmueller & Kern, 2008; Ariga, 2010). Although these studies have largely
documented the strong advantages of incumbency, an emerging body of research has also
demonstrated strong incumbency dis-advantages in Brazil (Brambor & Ceneviva, 2011;
Titiunik, 2011), India (Uppal, 2009; Linden, 2004), and a range of other low and middle
income countries (for a review, see Klašnja, 2013). To date, however, these studies have
not ventured onto the landscape of African politics, where much more is arguably at stake
in multi-party elections.1
The study of incumbency effects is motivated by immediate concerns over
democratic competitiveness, political accountability, and the general ‘fairness’ of
elections. Yet incumbency effects also have important welfare consequences. For instance,
the distribution of public spending by incumbents on the basis of electoral rather than
developmental considerations can have strong distortionary effects (for a review, see
Golden & Min, 2013). Similarly, the presence of persistent incumbency disadvantages
may be part of a broader ‘pessimistic politics trap’ (Svolik, 2013; Myerson, 2006) in which
voters throw incumbents out of office after just one term under perceptions of widespread
political corruption. In turn, policy horizons remain short and ‘honest’ politicians have
little incentive to enter politics, thereby undermining long-term development strategies.
In this study, I use a regression discontinuity (RD) design to estimate the effects of
incumbency on electoral performance in Zambia across two local government elections
and five parliamentary contests since 1991. Due to the discontinuous property and non-
trivial random chance component of elections, candidates who narrowly win or lose by just
a ‘few’ votes are arguably comparable on average across all observable and unobservable
characteristics, thus differing only in their incumbency status. Specifically, I estimate the
party – as opposed to personal – incumbency effect on electoral performance given the
1 Miguel & Zaidi (2003) find no evidence of incumbency advantages in Ghana’s 2000 parliamentary election, yet their dataset covers only 200 electoral races (even before restricting the analysis to ‘bare’ winners and losers) and is given only peripheral treatment in a broader study on politicised targeting of public spending.

page 2 of 52 primary salience of party over individual identities in Zambian politics since 1991 (see
Posner, 2005). The dataset constructed for this study covers over 1,700 electoral contests
and more than 5,600 candidate-level observations.
The predominant characterisation of African politics as ‘neopatrimonial’ and
‘semi-authoritarian’ implies that incumbents are in a strong position to systematically
manipulate the political process to their own advantage (see Bratton & van de Walle,
1997; Bayart, 1993, 2000; Chabal & Daloz, 1999). However, in stark contrast to this
prevailing wisdom, I find significant incumbency dis-advantages in Zambia’s local
government elections and no discernible incumbency advantages in parliamentary
elections. Furthermore, the strength of these disadvantages appear to be closely associated
with higher levels of voter information, poorer economic conditions, and a structural shift
in the landscape of party competition.
This study makes three important contributions. First and foremost, it effectively
brings the incumbency effects literature to the African context. Similarly, these results run
against the common sentiment of ‘exceptionalism’ in the study of African politics,
showing that general theories of voter behaviour and empirical findings from other regions
are directly applicable in the Zambian context. Second, from a methodological standpoint,
this study is the first to my knowledge to apply the heterogeneous local average treatment
effects (HLATE) estimator for RD designs to the study of incumbency effects. Moreover,
the non-parametric methods employed and wide range of robustness checks used in this
context go well beyond most studies of incumbency effects in low and middle income
countries. Third, since incumbency comes as a significant disadvantage in Zambia’s local
government elections, these results add to the growing literature suggesting a re-evaluation
of the conventional wisdom on the nature of electoral politics in Africa’s emerging
democracies.
I proceed in the following fashion. First, I summarise the primary mechanisms of
incumbency advantage and disadvantage. Second, I describe the prevailing wisdom on
African politics and introduce Zambia’s democratic transition. Third, I describe the dataset
and my methodological approach. Fourth, I present the core RD results. Fifth, I investigate
the drivers of incumbency disadvantages in Zambia’s local government elections.

page 3 of 52 2. Sources of incumbency advantage and disadvantage
Incumbency effects have been one of the most widely studied features of US
elections, with numerous studies documenting persistent incumbency advantages in
various levels of government (see Lee, 2008; Gelman & King, 1990; Erikson, 1971).
Similarly, consistent evidence of incumbency advantages have been found across a range
of other mature democracies, such as the United Kingdom (Katz & King, 1999), Canada
(Kendall & Rekkas, 2012), Australia (Horiuchi & Leigh, 2009), and Germany
(Hainmueller & Kern, 2008).2
However, as this literature has expanded to many low and middle income
countries, strong evidence of persistent incumbency disadvantages has emerged in recent
years. Linden (2004) and Uppal (2009) find strong evidence of incumbency disadvantages
in Indian state and national elections (see also, Aidt, Golden, & Tiwari, 2011; Fisman,
Schulz, & Vig, 2012). In the Brazilian context, Titiunik (2011) and Brambor & Ceneviva
(2011) find that incumbents are significantly disadvantaged in municipal mayoral
elections. The frequent turnover in presidential elections across many other Latin
American countries has also been well-documented (see Molina, 2001; Dix, 1984), along
with the low re-election rates of political parties in much of Eastern Europe (see Pop-
Eleches, 2010; Roberts, 2008). Finally, incumbents have also widely failed to seal re-
election in various Pacific Island countries – such as Papua New Guinea, the Solomon
Islands, and Vanuatu (Fraenkel, 2004, 2006; Trease, 2005). However, to date this literature
has not meaningfully ventured onto the African political landscape, where the stakes of
elections are exceptionally high.3
To date, most scholarly attention has focused on explaining incumbency
advantages rather than disadvantages, given that the literature originated in the study of
incumbency advantages in US politics. Nevertheless, the main sources of incumbency
advantage and disadvantage relate closely to one another and touch on many shared
concerns. The eight general classes of explanations I describe below offer important hints
as to why incumbency effects vary across contexts, although no consensus exists on the
relative centrality of any one mechanism – even in US elections.
Signalling and information manipulation: One leading class of explanations for
incumbency advantages focus on incumbent control over voter information and individual
2 See Ariga (2010) for an in-depth review and comparative analysis. 3 See note 1 above regarding Miguel & Zaidi’s (2003) peripheral treatment of incumbency effects in Ghana with a sample of only 200 observations, even before restricting the analysis to very ‘close’ elections.

page 4 of 52 effort. Essentially, the perks of public office may allow incumbents to strategically
manipulate voter information and individual effort in order to signal their desirability to
voters (Besley, 2006; Ashworth, 2006; Serra & Moon, 1994). For instance, Boas &
Hidalgo (2011) find that incumbent control of local radio stations is closely associated
with subsequent electoral success in Brazil (see also, Besley & Burgess, 2002). This notion
of incumbent control over voter information also relates closely to Downsian persuasive
advertising models, where the perks of public office provide incumbents with more
effective persuasive advertising ‘technologies’ (see Mueller, 2003: Ch. 20).
Political targeting and clientelism: A second and closely related class of explanations suggest that incumbents attract voter support by channelling national public
spending – or redistributive ‘pork’ – to their constituents in exchange for political loyalty.4
This mechanism may manifest itself in various ways, such as where senior legislators can
secure more clientelistic goods for constituents through increased bargaining power in
legislative decision-making (see McKelvey & Reitzman, 1992; Owens & Wade, 1984), or
where institutional learning and the development of stronger political networks over time
allow incumbents to more effectively deliver pork to their constituents (Baldwin, 2013;
Fisman, et al., 2012). Moreover, in contexts where opposition parties are weak and
fragmented, voters may overwhelmingly vote for the incumbent party in order to gain
access to patronage and avoid retribution (Bratton, Bhavnani, Chen, 2013; Wantchekon,
2003).
Pre-electoral resource mobilisation: In the pre-electoral stage, incumbents may
also have advantages in the mobilisation of campaign funds and political endorsements
through stronger political networks and the incentives of potential contributors to align
themselves with the expected winner (see Gordon & Landa, 2009). Similarly, the existence
of a political business cycle – where levels of public spending fluctuates in accordance
with electoral cycles – has been documented around the world, including in many African
contexts (Block, Ferree, & Singh 2003; Nordhaus, 1975).
Economic conditions: Poor economic conditions and weak management of the
economy by incumbents has been suggested as a core explanation for the persistent
incumbency disadvantages in many low and middle income countries (see Uppal, 2009;
Lewis-Beck & Stegmaier, 2008; Molina, 2001). However, this source of incumbency
4 For a comprehensive review of the expansive literature on distributive politics see Golden & Min (2013). For several recent contributions, see Larcinese, Snyder, & Testa (2013), Posner & Kramon (2013), and Solé- Ollé (2013).

page 5 of 52 disadvantage is likely to be much weaker where social identities and ideology form the
basis of partisan attachments, such as in many African democracies where ‘ethnic voting’
is a widespread phenomenon (see Horowitz, 1985; Posner, 2005). Making matters worse,
poorer segments of the population are often more likely to be ‘captured’ by political elites
through manipulation and intimidation (Crook & Manor, 1998; Bardhan & Mookherjee,
2006).
Rent-seeking and the ‘pessimistic politics trap’: A closely related class of
explanations suggest that the high levels of political corruption and rent-seeking in many
low and middle income countries are responsible for persistent incumbency disadvantages,
leading to a ‘pessimistic politics trap’ in which voters come to expect little from
incumbents who in turn perform poorly (Svolik, 2013; Myerson, 2006; Ashworth et al.,
2013). Similarly, Klašnja (2013) models incumbency disadvantages as resulting from the
potential of incumbents to extract increasing rents over time as they learn how to
manipulate political rules and circumvent institutional constraints, thus leading voters to
prefer inexperienced challengers over well-adapted rent-seeking incumbents.
Deterrence effects: Incumbency advantages may also arise through a deterrence
effect in which high-quality challengers strategically choose to run in districts where an
incumbent candidate is not running for re-election (see Butler, 2009; Levitt & Wolfram,
1997; Cox & Katz, 1996). At the level of party politics, however, opposition parties may
instead strategically nominate their strongest candidates to run against incumbents in
competitive districts, leading to the possibility of incumbency disadvantages (see Aidt,
Golden, & Tiwari, 2011).
Weak party systems and opposition coordination: Similarly, weak party systems
can drive incumbency disadvantages where parties are unable to deter legislators from
corrosive rent-seeking behaviour (Titiunik, 2011).5 Moreover, structural shifts in the party
system – such as frequent party entry and exit – can manifest themselves as incumbency
disadvantages, as Linden (2004) argues in the case of India. On the other hand, dominant
ruling parties in an environment of weak and fragmented opposition parties may
conversely enjoy substantial incumbency advantages (see Ziegfeld & Tudor, 2013).
Political institutions: Finally, formal and informal institutional structures – such as
electoral rules and political cultures – interact closely with many of the mechanisms
5 For various models of party reputation as a public good, see Shepsle & Weingast (1994).

page 6 of 52
described above.6 Of course, phenomena such as the nature of party competition,
government control over the media, and political corruption are all deeply embedded in
institutional structures. Overall, empirical investigation on the complexities and nuances of
these various sources of incumbency advantage and disadvantage is growing rapidly as the
study incumbency effects continues to expand across the globe, yet this literature has not
yet meaningfully expanded to the study of Africa’s many young democracies. Before
turning to the analysis of incumbency effects in Zambia, I briefly review the prevailing
wisdom in the study of African politics and introduce the Zambia’s democratic transition. 3. African politics and Zambia’s democratic transition
3.1. The Prevailing wisdom on African politics
Spanning a wide range of scholarly traditions, the conventional wisdom on African
politics characterises it as driven primarily by neopatrimonial patterns of exchange in
which a narrow set of rulers selectively distribute resources and privileges among elite
groups in order to maintain political order – variously labelled as ‘big man politics’,
‘politics of the belly’, or ‘personal rule’ (see Erdmann & Engel, 2007 for a review; see
also, Hyden, 2005; Bates, 2008, 1983; Medard, 1982). As Bratton & van de Walle (1997:
62) put it: “whereas personal relationships occur on the margins of all bureaucratic
systems, they constitute the foundation and superstructure of political institutions in
Africa.”
This neopatrimonial logic often manifests itself in the form of political clientelism,
which can best be understood as ‘exchange among unequals’ where a powerful agent
provides material goods to a less powerful agent in exchange for political loyalty (van de
Walle, 2012). Clientelism exists in all modern states, yet in most African contexts it has
tended more towards elite clientelism – in which key elites are granted personal control
over state offices to be used for their personal enrichment – as opposed to the mass
clientelism associated with the political machines of 20th century US and European politics
where political parties delivered wide-ranging public services to constituents in exchange
for political support (see van de Walle, 2012, 2007).
Alongside this neopatrimonialism literature, the study of the ‘Third Wave’ of
democratisation (Huntington, 1991) has raised additional concerns that authoritarian
6 See Ariga (2010) for a review.

page 7 of 52 practices in many nominally democratic African countries effectively prevent elections
from taking place on a level playing field (see Levitsky & Way, 2010; Carothers, 2002;
Diamond & Plattner, 2001). For instance, a total of 344 competitive presidential or
legislative elections have been held across 48 African countries between 1990 and 2011,
yet an alternation of power has taken place only 64 times (Bratton, 2013). Although this
rate of turnover is much higher than in preceding decades, the common sentiment is that
political elites remain able to significantly ‘bias’ the operation of democratic institutions to
their own advantage (Albertus & Menaldo, 2013; Collier & Vicente, 2012). Making
matters worse, patterns of ethno-linguistic cleavages and narrow patronage considerations
have long been understood to form the basis for political mobilisation and voter behaviour
across much of Africa (Posner, 2005; Horowitz, 1985; Young, 1976).
Nevertheless, criticisms made 30 years ago relating to the dearth of empirical
research on the nature of clientelism in African countries remain far too relevant today
(Lande, 1983; see also, Herbst, 2001; Bach & Gazibo, 2012). Fortunately, however, a
rapidly growing line of inquiry is offering many new insights into the increasing
sophistication of African voters and the deepening of democratic institutions and values
(see Bratton, 2013; Lindberg, 2006). For instance, Bratton, Bhavnani, & Chen (2013) find
that voter perceptions of incumbent economic performance have more than double the
effect on partisan attachment than does ethnic identity across 16 African democracies (see
also, Norris & Mattes, 2013). Similarly, economic conditions and the provision of public
goods have been shown to play an important role in Ghana’s recent elections (see
Weghorst & Lindberg, 2013, 2011). Moreover, Conroy-Krutz & Logan (2013) argue that
the conventional account of Museveni effectively ‘buying’ victory in Uganda’s 2011
elections is mis-guided, since voters who benefited from this patronage were only
marginally more likely to vote for him. In sum, the conventional wisdom of African
politics as predominantly ‘neopatrimonial’ and ‘semi-authoritarian’ suggests that
incumbents are significantly advantaged at the polls relative to non-incumbents. However,
this perspective may be overlooking important shifts in the landscape of voter and elite
behaviour currently underway, which may manifest themselves in incumbency
disadvantages where voters learn to systematically punish incumbents for poor
performance.

page 8 of 52 3.2. Zambia’s democratic transition
Starting with the decisive victory of Frederick Chiluba’s Movement for Multiparty
Democracy (MMD) in the 1991 presidential and parliamentary elections that marked the
return to multi-party politics, Zambia has now held five contiguous legislative elections,
six presidential elections, and three local government elections. Although initially heralded
as one of the most peaceful and complete transitions, throughout the 1990s the MMD
employed a wide variety of authoritarian tactics to alienate civil society and re-create long-
standing patterns of elite clientelism (see Rakner, 2003; von Soest, 2007; Di John, 2010;
Lindemann, 2010; Baylies & Szeftel, 1997). Since the early 2000s, however, Zambia’s
political landscape has become increasingly competitive due to growing public discontent
with the MMD’s economic performance and the re-emergence of civil society (see Larmer
& Fraser, 2007; Young, 2009; Posner & Simon, 2002).7 The 2006 elections in particular
represent an important turning point in Zambian politics, where Michael Sata’s Patriotic
Front (PF) stormed onto the political landscape. Today, Zambia is ranked as ‘partly free’
with an average freedom rating of 3.5 in Freedom House’s 2013 Freedom in the World
index, just ahead of Kenya and slightly behind Tanzania.8
Still, over the course of Zambia’s entire democratic transition, it is widely accepted
that the MMD has extensively manipulated the political system, such as using state
vehicles in electoral campaigning, employing vote-buying tactics, and detaining opposition
candidates (see Larmer, 2009; Rakner, 2003; Bartlett, 2000). Moreover, Zambia’s high
levels of ethnic fractionalisation have been heavily exploited by political elites to mobilise
voters around ethnic cleavages (Posner, 2005). At the same time, however, public opinion
indicates a strong and growing acceptance of democracy and the efforts of civil society are
placing stronger pressures on politicians to meet the demands of ordinary citizens (see
Chipenzi et al., 2011; Larmer, 2009; Larmer & Fraser, 2007). Consequently, on the one
hand, there are strong reasons to expect persistent incumbency advantages in Zambian
elections given the long history of elite clientelism and electoral manipulation. Yet, on the
other hand, the resurgence of civil society, growing public discontent over economic
conditions, and newfound strength of opposition parties could be generating patterns of
systematic punishment of incumbents at the polls.
7 A summary of all election results is provided in Appendix A 8 See: http://www.freedomhouse.org/report-types/freedom-world

page 9 of 52 4. Methods and Data
The ideal experiment for estimating incumbency effects would be to randomise
who gets appointed to public office and simply measure the resulting differences in
electoral performance between incumbents and non-incumbents. Yet, in reality,
incumbency is assigned non-randomly through elections, implying that much of the
difference in outcomes between incumbents and non-incumbents will likely be due to a
simple selection effect. Past scholars have attempted to account for this selection bias in
various ways (see Gelman & King, 1990; Levitt & Wolfram, 1997; Cox & Katz, 2002),
yet these approaches have generally continued to suffer from important identification
problems.
Recently, there has been a surge of interest in the application of the regression
discontinuity (RD) design to electoral settings to estimate the effects of public office on
various political and economic outcomes (see, for instance, Eggers & Hainmueller, 2009;
Broockman, 2009; Lee et al., 2004). Specifically, the RD design exploits the discontinuous
property of elections by comparing candidates who win or lose by just a ‘few’ votes in
order to generate causal inferences under a minimal identification assumption. Given
random shocks that affect final election results irrespective of the qualities of candidates
(e.g. weather conditions, traffic jams), such candidates in a narrow window around the
threshold of winning are arguably identical (on average) across all observable and
unobservable characteristics as in a randomised experiment, thus differing only in their
incumbency status. 4.1. Identification in the RD framework
Lee (2008) provides a formal treatment of the conditions under which RD designs
generate valid causal inferences in the context of electoral settings (see also, Angrist &
Pischke, 2009; Hahn et al., 2001). In this basic formulation, each unit is assigned a score
on some running variable V that has a continuous probability density function (pdf), and
treatment is given only if v is greater than some known threshold v0. In an electoral setting,
V represents the share of votes accrued to candidate i in constituency j, where all
candidates with v > v0 win the election and are assigned to the ‘treatment’ group.
For simplicity, take V to be comprised of two main components:

page 10 of 52 V = Z + e,
where Z reflects individual characteristics and actions and e is an exogenous random
chance variable with a continuous density function. This formulation generates the ‘local
randomisation’ result, which states that assignment to treatment will be ‘as if’ randomly
assigned within some neighbourhood of ‘closeness’ to the threshold V = v0 due to the non-
trivial random chance element of V. More formally, identification of the causal effect of
incumbency on some outcome of interest relies on the assumption that E[Y0 | V=v] and E[Y1 | V=v] are continuous in v at the threshold v0,
where Y1 and Y0 are the potential outcomes under the treatment and control states.9 In
other words, identification relies on the core assumption that only treatment status changes
discontinuously at the threshold. Intuitively, this assumption simply states that the average
outcome for observations just below the threshold must represent a valid counterfactual for
the treated group just above the threshold (Lee, 2008). When this continuity assumption
holds, the discontinuity in the average expectation function of the outcome at the threshold
identifies the ‘local’ average treatment effect (LATE) – where ‘localness’ refers to
observations in the neighbourhood of the threshold. By implication, the pdf of V must be
continuous around the threshold v0 for each observation. In other words, individuals and
parties must not be able to strategically alter their probability of receiving the treatment by
precisely manipulating their vote share V in the neighbourhood of the threshold.
On this note, several recent studies have raised skepticism about the validity of RD
studies in electoral settings, finding that – even in very close elections – winning
candidates in the US House of Representatives since 1946 have significantly more political
experience and spend more on election campaigns than losing candidates (Snyder, 2005;
Caughey and Sekhon, 2011; Grimmer et al., 2012). Essentially, these studies suggest that
strategic sorting in the neighbourhood of the threshold may be a persistent feature of
elections, thus violating the local randomisation result. In response, Eggers et al. (2013)
study over 40,000 electoral contests around the world, finding no other case of strategic
sorting outside of US House elections in the post-War era (see also, Erikson & Rader,
2013). The authors conclude that these criticisms of the RD design in the context of US
9 See Angrist & Pischke (2009) for more detail on the potential outcomes framework and notation.

page 11 of 52 House elections thus do not pose a general threat to the validity of RD estimates in
electoral studies, yet the burden remains on the researcher to justify the validity of the RD
design in any given context. 4.2. Estimation approach
In this study, I estimate the party – as opposed to personal – incumbency effect on
electoral performance using a RD design for five parliamentary elections (1991-2011) and
two local government elections (2006-2011) in Zambia.10 In other words, I estimate the
electoral gain of being the incumbent party in a given constituency relative to being a non-
incumbent party, disregarding the identity of the individual candidate. This focus on party
incumbency effects is justified on two main grounds. First, in terms of substantive interest,
there is strong evidence that party labels have played a more important role in voter
behaviour than the identities of individual candidates in the Zambian context (see Posner,
2005). Second, from a methodological standpoint, the estimation of party incumbency
effects is less prone to selection bias induced by the strategic decision of candidates on
whether or not to run in the next election (see Magalhaes, 2013).
In Zambian elections, ward councillor and parliamentary candidates compete in
1,421 and 150 single-member constituencies under plurality rule at the local and
parliamentary levels, respectively.11 The importance of parliamentary elections is in some
ways diluted by the concentration of fiscal discretionary power in the executive, which
severely limits the capacity of MPs to channel public spending to their constituents (see
Larmer, 2009). At the local level, however, ward councillors enjoy substantial discretion
over the provision of local public services and have more immediate effects on the welfare
of citizens, thus making these local elections of significant practical importance to voters
(Enemark et al., 2013).
Data for the outcome and explanatory variables comes from election results
provided by the Electoral Commission of Zambia (ECZ). Two measures are used to
capture next period electoral performance: (1) a binary indicator for whether for party i in
constituency j wins in period t+1; and (2) the proportion of votes received by party i in
constituency j for period t+1 of all votes cast. To evaluate the party incumbency effect
10 Local government elections also took place in 2001, yet these results have not been published by the ECZ. 11 Only minor redistricting has occurred over the period under consideration. Nevertheless, I exclude any observations where the constituency names change between t and t+1.

page 12 of 52 unconditional on the decision to re-run, a party in a given constituency that does not field a
candidate in the next election receives a value of 0 for both outcome variables. The
running variable V is the margin of victory (MOV) for party i in constituency j and period
t, constructed as the difference between party i’s vote share and the vote share of the
strongest opponent in the constituency. Treatment status is then a deterministic function of
MOV, such that observations with MOV > 0 are elected and form the treatment group and
observations with MOV < 0 form the control group. Table 4.1. Description of key variables
Variable Description
Outcome Electoral victory, t+1 Takes a value of 1 party i wins in
constituency j in period t+1
Vote share, t+1 Proportion of total votes cast that party i
receives in constituency j in period t+1
Treatment Electoral victory, t Takes a value of 1 party I wins in
constituency j in period t
Running
variable
Margin of victory, t Difference between party i’s vote share in
constituency j and the vote share of the
strongest opponent.
The United Democratic Alliance (UDA) coalition that brought together UNIP,
UPND, and FDD just for the 2006 elections is coded as follows. First, the electoral
performance of UDA candidates in 2006 is used to generate the outcome data for all
UNIP, UPND, and FDD observations in the 2001 elections. Second, the electoral
performance of the best-performing UNIP, UPND, or FDD candidate in the 2011 elections
is used to generate the outcome data for all UDA candidates in 2006 for a given
constituency. This coding procedure creates an upward bias, suggesting that the strong
incumbency disadvantages found below may be even stronger in reality.
Finally, a number of observations are excluded from the analysis, including all
independents and unopposed/postponed races. Moreover, all races where a by-election
took place between t and t+1 are excluded as detailed by-election results are not available

page 13 of 52 for all years between 1991 and 2011. Following these exclusions, the dataset used for the
analyses contains 1183 electoral races and 3278 candidate-level observations for the 2006
local government elections, in addition to 558 electoral races and 2350 candidate-level
observations over four parliamentary elections. As shown in Appendix B, even the number
of ‘close’ electoral races used in this study is much larger than the entire range of
observations used by Miguel & Zaidi (2003) in their peripheral treatment of incumbency
effects in Ghana (N=200). 5. Results
Looking at the entire range of observations, incumbents have clearly outperformed
non-incumbents, as would be expected by non-random self-selection (see Appendix B). At
the local level, incumbent parties won 64.8% of attempts, compared to only a 16.7%
success rate among non-incumbents. Similarly, at the parliamentary level, incumbents won
57.2% of attempts, compared to a 10.5% success rate among non-incumbents.
Tables 5.1 and 5.2 present the main RD results for ward and parliamentary
elections, respectively. ‘GLM’ specifications are estimated by a logistic regression fit for
the probability of winning in t+1 and a linear regression fit for vote share in t+1 regressed
on a binary indicator for incumbency status, MOV, and a multiplicative interaction term
between the two to allow for differences in slopes between incumbents and non-
incumbents. ‘Polynomial’ specifications are estimated from the same generalised linear
models (GLM), but with polynomial terms for MOV added up to the 4th order along with
corresponding interaction terms. Finally, as recommended by Hahn et al. (2001) and
Imbens & Lemieux (2007), the ‘non-parametric’ specifications fit a locally weighted linear
regression of next period electoral performance on incumbency status, MOV, and an
interaction term. The window of inclusion for all specifications is determined using the
cross-validated optimal bandwidth determination procedure recommended by Imbens &
Kalyanaraman (2009).12 Emphasis is placed mostly on the non-parametric estimates, yet I
nevertheless include the GLM and polynomial specifications to illustrate sensitivity to
alternative estimators.13
12 The sensitivity of results was also assessed by re-estimating all specifications at double and half the optimal bandwidths, with the core results remaining substantively unchanged (results not shown). 13 I do not present coefficients for the running variable or goodness of fit measures such as adjusted R- squared or AIC in any specifications throughout the analyses below in order to rightly focus the attention of readers on the quantities of substantive interest in this study.

page 14 of 52
Turning to the results, incumbent parties in ward elections appear to be
significantly dis-advantaged relative to non-incumbents in the neighbourhood of the
threshold. In particular, the LATE of incumbency in the non-parametric specifications is
an estimated 19.6% decrease in the probability of winning the next election relative to
non-incumbents (p=0.032), alongside an estimated decrease in vote share of 7.5
percentage points (p=0.064). At the parliamentary level, on the other hand, the coefficient
on incumbency is negative in three of the six specifications, yet the null hypothesis of no
effect cannot be rejected for any specification at the 90% level of significance.
Table 5.1. Incumbency effect on electoral performance in t+1, Ward
candidates
Dependent variable: Probability of victory, t+1
Dependent variable: Vote share, t+1
GLM (1)
Poly. (2)
Non-par. (3)
GLM (4)
Poly. (5)
Non-par. (6)
Bandwidth =
0.077
0.077
0.077
0.080
0.080
0.080
Incumbency effect
-0.776*
-1.842
-0.196**
-0.057
-0.275**
-0.075*
Standard error
0.441
1.177
0.091
0.047
0.121
0.040
Observations
354
354
354
366
366
366
*** = p < 0.01; ** = p < 0.05; * = p < 0.10.
Notes: Imbens-Kalyanamaran optimal bandwidths and Huber-White standard errors are used.

page 15 of 52 Table 5.2. Incumbency effect on electoral performance in t+1,
Parliamentary candidates
Dependent variable: Probability of victory, t+1
Dependent variable: Vote share, t+1
GLM (1)
Poly. (2)
Non-par. (3)
GLM (4)
Poly. (5)
Non-par. (6)
Bandwidth =
0.112
0.112
0.112
0.088
0.088
0.088
Incumbency effect
-0.132
-2.010
0.083
0.047
-0.2493
0.029
Standard error
0.653
1.869
0.118
0.077
0.2126
0.070
Observations
198
198
198
143
143
143
*** = p < 0.01; ** = p < 0.05; * = p < 0.10.
Notes: Imbens-Kalyanamaran optimal bandwidths and Huber-White standard errors are used.
Figures 5.1 and 5.2 below plot the predicted electoral performance in t+1 against
MOV in t from the estimated non-parametric specifications. The discontinuity at MOV=0
captures the estimated LATE of incumbency on electoral performance at the threshold. As
the large discontinuity at the threshold in Figure 6.1 indicates, incumbents in ward
elections are significantly disadvantaged relative to non-incumbents. At the parliamentary
level, a small positive discontinuity at the threshold is apparent, yet the average
expectation functions on each side of the threshold fall well within one another’s point-
wise 95% confidence intervals.

page 16 of 52 Figure 5.1. Incumbency effect on electoral performance in t+1, Ward
candidates
Fig. 5.1. The above plots show the estimated LATE of incumbency on electoral performance in
ward elections at the threshold MOV=0. The plotted curves are from non-parametric locally
weighted linear regressions with triangular kernel estimated separately for incumbents and non-
incumbents.

page 17 of 52 Figure 5.2. Incumbency effect on electoral performance in t+1,
Parliamentary candidates
Fig. 5.2. The above plots show the estimated LATE of incumbency on electoral performance in
parliamentary elections at the threshold MOV=0. The plotted curves are from non-parametric
locally weighted linear regressions with triangular kernel estimated separately for incumbents and
non-incumbents.

page 18 of 52
To demonstrate that these results are not biased by the possibility of strategic
decisions among parties regarding whether or not to field a candidate in the next election,
Figure 5.3 below shows the effect of incumbency on the probability of fielding a candidate
in t+1. As the resulting plots clearly illustrate, bare winners are no more or less likely to
field a candidate again in the next election relative to bare losers, suggesting that selective
attrition is not a major concern for the RD estimates. To be sure, the main non-parametric
specifications from Tables 5.1 and 5.2 above are re-estimated conditional on a party’s
decision to field a candidate again in the next election, with both sets of non-parametric
estimates remaining effectively unchanged (see Appendix C).
Figure 5.3. Probability of re-running in t+1 by margin of victory in t
Fig. 5.3. The above plots are estimated using non-parametric specifications as in Figures 5.1 and 5.2, but
using a party’s decision to field a candidate again in the next election as the outcome variable. Imbens-
Kalyanamaran optimal bandwidths are 0.101 and 0.088 for local and parliamentary elections, respectively.
A clear advantage of the RD design is that it bypasses important questions about
what variables to include, since bare winners and bare losers are ex ante comparable across
all observed and unobserved characteristics as in a randomised experiment (Hahn et al.,
2001; Lee, 2008). However, this advantage hinges on the validity of the key identification
assumption for the RD design, which cannot be directly proven. Nevertheless, this
assumption gives rise to a number of testable implications that researchers can employ to
assess the validity of the RD design in a given context. I employ three groups of these tests
below: (1) ‘placebo outcome’ tests; (2) ‘placebo treatment’ tests; and (3) density tests for
strategic sorting.

page 19 of 52 Placebo outcomes
As in Lee et al. (2004) and Eggers & Hainmueller (2009), I begin by checking that
there is no discontinuity at the threshold for a range of race-level and candidate
characteristics by regressing each on incumbency status, MOV, and an interaction term
using the same non-parametric estimation procedure from above. These ‘placebo
outcomes’ should be continuous in V and thus the coefficients on incumbency in these
specifications should not be significantly different from what would be expected by
chance. Appendix D presents the results of these balance checks separately for: (1)
observations with an absolute MOV of less than 7.5%; (2) observations with an absolute
MOV of less than 25%; and (3) all available observations. As would be expected due to
non-random selection, winners and losers are unbalanced on a number of covariates for the
entire range of observations. But for observations with an absolute MOV of less than
7.5%, none of the 23 tests find a significant discontinuity in ward elections and only one
test – vote share in t-1 – contains a significant discontinuity in parliamentary elections (see
Figure 5.4). As every 1 out of 20 tests is expected to find a significant difference when
evaluated against the 95% level of statistical significance even when the null hypothesis is
true, the presence of this single imbalance in 46 tests is well under what would be expected
by chance.
As a strong boost of added confidence, Enemark et al. (2013) recently collected
detailed individual data for 143 ward-level candidates that barely won or lost in the 2006
local government elections for an experimental study on reciprocity and sharing. Enemark
et al.’s sample does not overlap perfectly with the sample of ward-level candidates under
consideration here, yet their demonstration of strong covariate balance between
incumbents and non-incumbents across a wide range of socio-economic and demographic
characteristics provides us with much added confidence that non-incumbents represent a
valid counterfactual for incumbents in this context.

page 20 of 52 Figure 5.4. Incumbency effect on electoral performance in t-1
Fig. 5.4. The above plots are estimated using non-parametric specifications as in Figures 5.1 and 5.2
(maintaining the same bandwidths), but using electoral performance in t-1 as outcomes. Placebo treatments
Next, as recommended by Imbens & Lemieux (2007), I check for discontinuous
jumps in the running variable at points other than the known threshold. Specifically, I
replicate the main non-parametric specifications from Tables 5.1 and 5.2 above, but using
alternative ‘fake’ thresholds for treatment assignment. Following Eggers & Hainmueller
(2009), I limit analysis to either the winning or losing candidates in each case to avoid assuming
continuity where a break is known to exist. The results of this exercise are presented in Table
5.3 below, showing no evidence of significant jumps in electoral performance other than at
the true threshold of treatment assignment.

page 21 of 52 Table 5.3. Placebo treatments
Threshold -0.15 -0.1 -0.05 0 0.05 0.1 0.15
Ward elections
Dependent variable: Probability of victory, t+1
Incumbency effect -0.038 0.076 0.163 -0.196** 0.066 -0.020 -0.019
Standard error 0.078 0.089 0.105 0.091 0.112 0.095 0.096
Dependent variable: Vote Share, t+1
Incumbency effect 0.015 -0.013 0.040 -0.075* -0.018 0.015 0.044
Standard error 0.035 0.038 0.045 0.040 0.049 0.039 0.037
Parliamentary elections
Dependent variable: Probability of victory, t+1
Incumbency effect 0.053 0.021 0.026 0.083 0.044 -0.022 0.005
Standard error 0.076 0.082 0.120 0.118 0.165 0.117 0.132
Dependent variable: Vote Share, t+1
Incumbency effect 0.051 0.054 -0.075 0.029 -0.010 0.022 0.039
Standard error 0.043 0.044 0.064 0.070 0.080 0.057 0.062 *** = p < 0.01; ** = p < 0.05; * = p < 0.10.
Notes: the discontinuity in next period electoral performance is estimated at ‘fake’ vote share thresholds
from -0.15 to 0.15. All estimates are obtained from the same non-parametric estimation procedure and
bandwidths presented in Tables 5.1 and 5.2. Estimates at MOV=0 reflect the ‘true’ LATE of incumbency. Strategic Sorting
Appendix E shows the marginal distribution of V for observations around the
threshold separately for incumbents, non-incumbents, and specific parties in ward and
parliamentary elections using McCrary’s (2008) density test. In these tests, none of the
sub-groups under consideration are significantly more likely to win very close elections,
suggesting that strategic sorting in the neighbourhood of the threshold is not a major
concern in the period under consideration.
Although the MMD has been widely accused of electoral fraud and manipulation,
it thus appears unlikely that these tactics have allowed incumbents to precisely sort
themselves into barely winning an election. For instance, Enemark et al. (2013) claim that
electoral fraud in Zambia has in fact been most likely where margins of victory are large.

page 22 of 52 Similarly, the high levels of uncertainty regarding expected vote share in Zambian
elections makes it unlikely that such precise manipulation would be possible. Indeed, even
in the US context where electoral polling is far more sophisticated, Enos & Hersh (2013)
find that campaign workers mis-predicted their vote share by an average of 8 percentage
points leading up to the 2012 general election.
In sum, these tests provide us with much added confidence in the internal validity
of the RD design in the Zambian context. In other words, the significant incumbency
disadvantages in ward elections – as well as the absence of any significant incumbency
advantages in parliamentary elections – do not appear to be merely random artefacts of the
data. Consequently, these results stand in stark contrast to the prevailing wisdom on
African politics, where incumbents are assumed to hold substantial advantages over non-
incumbents through the many perks of public office. Instead, these findings are consistent
with the persistent incumbency disadvantages found in many other low and middle income
countries outside of the African context. But, to take the next logical step, what explains
these incumbency disadvantages in Zambia’s ward elections? Although in-depth analysis
must await further inquiry, I devote the remaining space to an investigation of this
question. 6. Explaining Zambia’s incumbency disadvantages
In the analysis that follows, I consider four mechanisms that may drive
incumbency disadvantages at the local level: (1) voter information; (2) economic
conditions; (3) political competitiveness; and (4) structural shifts in party competition. To
allow for sufficient analytical depth, I focus only on the ward-level results given the
significant incumbency disadvantages found above. Similar analyses have been conducted
on the parliamentary elections – reaching many of the same core conclusions – although I
leave detailed analysis of these parliamentary results for future work. 6.1. The Role of voter information and economic conditions
The emergent literature on the growing sophistication of voters in many African
countries provides the basis for several straightforward hypotheses for explaining
incumbency disadvantages. First, the growing strength of civil society and the independent
media may be hindering the ability of incumbents to manipulate voter information. Hence,

page 23 of 52 we might expect incumbency disadvantages to be stronger where voters have more access
to independent information on political issues (H1). Second, public discontent with poor
economic conditions should lead us to expect incumbency disadvantages to be stronger
where economic conditions are poorest (H2). Third, the extent to which voters punish
incumbents for poor economic conditions should depend on levels of voter information
and vice versa (H3).
I examine these three hypotheses using data collected from the 2000 Zambian
household census, which contains representative constituency-level data on a variety of
household characteristics.14 I use the proportion of households with a radio as a measure of
voter access to information on political issues, given that radio is the dominant mass-
medium in Zambia and is used widely by civil society to offer independent political
information (see Chipenzi et al., 2011). For economic conditions, I use the proportion of
households with access to electricity. Although this is of course only one of many possible
measures relating to this construct, the results remain substantively unchanged when it is
replaced with the proportion of households with access to sanitary means of excreta
disposal, access to safe drinking water, or proper garbage disposal.
To estimate the moderating role of voter information and economic conditions in
incumbency disadvantages, I adopt the heterogeneous LATE (HLATE) estimator for RD
designs proposed and used by Becker, Egger, & Ehrlich (in press). Essentially, HLATE
allows for the investigation of heterogeneous treatment effects – such that marginal
treatment effects vary strength along some covariate(s) of interest – in an RD framework.
In this set-up, I adapt the main non-parametric RD specifications from Table 5.1 above and
add an additional term on the right-hand side for the moderator of interest (i.e. voter
information/economic conditions) as well as an interaction term in order to allow the
LATE of incumbency to vary along different values of the moderating variable. In all
specifications, radio ownership and access to electricity are mean-centred so that the
coefficient on incumbency can be interpreted as the LATE of incumbency on electoral
performance when voter information and/or economic conditions are held constant at their
average value. Finally, as shown in the placebo outcome tests in Appendix D, all
moderators used in this section are balanced across incumbents and non-incumbents in the
neighbourhood of the threshold.
14 Summary figures and tables are available for the 2010 census, however the corresponding microdata has not been released as of August 2013.

page 24 of 52
Table 6.1 presents the results of the analyses for H1-H3. In the specifications that
test only H1 or H2, the two-way interactions are close to zero in magnitude and are not
significant at conventional levels. On the other hand, the specifications that
simultaneously test H1-H3 tell a very different story. Here, the null hypothesis of no
effect for the two-way interaction between radio ownership and incumbency can be safely
rejected at the 99% level when access to electricity is held constant at its average value,
and the same holds true for the two-way interaction between access to electricity and
incumbency. Moreover, the three-way interaction between radio ownership, access to
electricity, and incumbency is non-zero and significant at the 99% level. As the
coefficients on interaction terms tell us relatively little on their own (see Brambor, Clark,
& Golder, 2005; Braumoeller, 2004), I plot the marginal effect of incumbency on next
period vote share at all values of these two moderators in Figure 6.1.

page 25 of 52
Main
H1
H2
H1-H3
Main
H1
H2
H1-H3
(1)
(2)
(3)
(4)
(5)
(6)
(7)
(8)
Bandwidth =
0.077
0.077
0.077
0.077
0.080
0.080
0.080
0.080
Incumbency -0.196** -0.199** -0.196** 0.111 -0.075* -0.075* -0.075* 0.024 (0.091) (0.091) (0.091) (0.130) (0.040) (0.040) (0.040 (0.058)
Radio
0.004*
0.018***
0.001
0.007** ownership (0.002) (0.006) (0.001) (0.003)
Radio * Incumbency
-0.004 (0.003)
-0.027*** (0.009)
-0.001 (0.001)
-0.012*** (0.004)
Access to 0.002 -0.020*** 0.001 -0.007** electricity (0.002) (0.007) (0.001) (0.003)
Electricity * Incumbency
-0.002 (0.002)
0.034*** (0.011)
-0.00001 (0.001)
0.035*** (0.005)
Electricity * Radio
0.053*** (0.019)
0.017** (0.008)
Electricity * -0.090*** (0.027)
-0.030** (0.012)
Incumbency
Observations
352
352
352
352
366
366
366
366
Table 6.1. Drivers of ward-level incumbency disadvantages: voter
information and economic conditions
Dependent Variable: Probability of victory, t+1 Dependent variable: Vote share, t+1
Radio *
*** = p < 0.01; ** = p < 0.05; * = p < 0.10.
Notes: All specifications are estimated using non-parametric locally weighted linear regressions with
triangular kernel, Imbens-Kalyanamaran optimal bandwidths, and Huber-White standard errors.

page 26 of 52 Figure 6.1. Drivers of ward-level incumbency disadvantages: voter
information and economic conditions
Fig. 6.1. The above plots show the estimated HLATE of incumbency at difference values of radio ownership
and access to electricity. The corresponding two-way interactions are shown in the top panel along with 95%
confidence intervals and the three-way interaction is shown in the lower panel. Asterisks in the three-way
plots indicate incumbency HLATEs different from 0 at the 95% significance level.
Three main observations from these plots are worth noting. First, incumbency
effects vary significantly with both access to radio and electricity. In other words, holding
access to electricity constant at its average value, incumbency disadvantages are stronger
in wards with more radio ownership. Conversely, holding radio ownership constant at its
average value, incumbency disadvantages are stronger where fewer households have
electricity access. Second, we can see that at values of radio ownership below
approximately 20% or for values of access to electricity above approximately 40%,
incumbents actually become significantly advantaged relative to non-incumbents. Third,

page 27 of 52
i
the co-variation of radio ownership and access to electricity with incumbency
disadvantages depend substantially on the value of one another, such that the
disadvantaging role of radio ownership is strongest when access to electricity is below
average (i.e. less than 40% access) and access to electricity is most likely to translate into
significant incumbency advantages when access to radio is below average (i.e. less than
14.55% ownership). 6.2. Political competitiveness and a shifting party system
Beyond these patterns of voter behaviour, incumbency disadvantages may also
vary with levels of political competitiveness. For instance, electoral races with more
parties competing against one another may be systematically more competitive, thus
making it more unlikely for an incumbent party to retain its seat over time. On the other
hand, a large number of candidates may split the opposition vote, thereby making it easier
for incumbents to retain their seat (see Ziegfeld & Tudor, 2013; Chhibber & Nooruddin,
2004). Either way, we may thus expect the competitiveness of electoral races to co-vary
with incumbency disadvantages (H4).
More broadly, shifts in the landscape of party competition – such as the entry and
exit of new parties and coalitions – may also play an important role in explaining
incumbency disadvantages. For instance, the break-up of the UDA coalition after 2006
may have created strong disadvantages for its former members going into the 2011
elections. Hence, simply formulated, we should expect incumbency disadvantages to be
driven in part by the poor performance of the UDA coalition (H5).
In Table 6.2, I estimate the moderating effects of the number of parties competing
in each race, as well as the effective number of parties (ENP), on incumbency
disadvantages.15 The coefficients on the interaction terms for either of these measures of
political competitiveness are insignificant across all specifications. Similarly, the plots in
Figure 6.2 show that incumbency effects do not vary significantly with either moderator.
Hence, political competitiveness appears to play little role in explaining incumbency
disadvantages in Zambia’s ward-level elections.
15 The effective number of parties is calculated using the Laakso-Taagepara (1979) index: N = 1/∑p 2, in which p is the vote share for party i.

page 28 of 52 Table 6.2. Drivers of ward-level incumbency disadvantages: electoral
competitiveness
Dependent Variable: Probability of victory, t+1
Dependent variable: Vote share, t+1
(1)
(2)
(3)
(4)
(5)
(6)
(7)
(8)
Bandwidth =
0.077
0.077
0.077
0.077
0.080
0.080
0.080
0.080
Incumbency -0.196** -0.194** -0.234** -0.274** -0.075* -0.073* -0.094** -0.102** (0.091) (0.092) (0.010) (0.113) (0.040) (0.041) (0.043) (0.050)
# of Parties -0.002 0.006 -0.019 -0.012 (0.042) (0.059) (0.019) (0.026)
# of Parties * 0.012 -0.065 0.016 -0.011 Incumbency (0.062) (0.088) (0.027) (0.039)
ENP -0.010 (0.061)
-0.017 (0.085)
-0.027 (0.027)
-0.015 (0.037)
ENP * Incumbency
0.081
(0.086)
0.144
(0.122)
0.042
(0.038)
0.053
(0.054)
Observations 352 352 352 352 366 366 366 366
*** = p < 0.01; ** = p < 0.05; * = p < 0.10.
Notes: All specifications are estimated using non-parametric locally weighted linear regressions with
triangular kernel, Imbens-Kalyanamaran optimal bandwidths, and Huber-White standard errors.
Figure 6.2. Drivers of ward-level incumbency disadvantages: electoral
competitiveness
Fig. 6.2. The above plots show the estimated HLATE of incumbency at difference values of the number of
parties and ENP along with corresponding 95% confidence intervals.

page 29 of 52
All
Next, I re-estimate incumbency disadvantages in ward elections by removing one
of the three major parties at a time in order to assess how incumbency disadvantages vary
by party. As Table 6.3 illustrates, the LATE of incumbency on electoral performance
changes little in magnitude or significance when either MMD or PF candidates are
removed from the analysis. However, when members of the UDA coalition are excluded,
the estimated incumbency disadvantage drops to roughly half the size of the original
estimates for both outcome variables. In other words, although incumbents from all three
major parties are on average disadvantaged relative to non-incumbents, these
disadvantages are concentrated most heavily among the former UDA coalition members.
Table 6.3. Drivers of ward-level incumbency disadvantages: Party
identity
Dependent Variable: Probability of victory, t+1
Dependent variable: Vote share, t+1
Non- MMD Non-PF
Non- UDA All
Non- MMD Non-PF
Non- UDA
(1) (2) (3) (4) (5) (6) (7) (8)
Bandwidth = 0.077 0.077 0.077 0.077 0.080 0.080 0.080 0.080
Incumbency effect -0.196** -0.268** -0.226** -0.115 -0.075* -0.114* -0.085* -0.046 Standard error 0.091 0.128 0.097 0.103 0.040 0.064 0.043 0.044
Observations 352 179 258 281 366 186 269 291
*** = p < 0.01; ** = p < 0.05; * = p < 0.10.
Notes: All specifications are estimated using non-parametric locally weighted linear regressions with
triangular kernel, Imbens-Kalyanamaran optimal bandwidths, and Huber-White standard errors.
As a final analysis, I re-estimate the moderating role of voter information and
economic conditions separately for MMD and non-MMD candidates.16 The corresponding
two-way interaction plots are shown in Figure 6.3 below. For non-MMD candidates, the
moderating effects of radio ownership and access to electricity are not discernible from 0
at the 95% significance level across any value (when the other moderator is held constant
at its average). For MMD candidates, on the other hand, radio ownership is significantly
16 Sub-setting by MMD and non-MMD candidates splits the samples into roughly equal sizes of around 180 observations, while sub-setting individually by all three major parties leads to sample sizes below 100 observations and highly imprecise estimates.

page 30 of 52 associated with incumbency disadvantages at values higher than approximately 55%
ownership and the effect of access to electricity crosses the threshold of 95% significance
at values very close to 0% ownership. Nevertheless, despite these small differences in the
precision of estimates, the plots show that the substantive moderating roles of radio
ownership and access to electricity appear to be broadly similar across MMD and non-
MMD candidates. Figure 6.3. Drivers of ward-level incumbency disadvantages: Voter
information and economic conditions by MMD and Non-MMD candidates
Fig. 6.3. The above plots show the estimated HLATE of incumbency for MMD and non-MMD candidates at
difference values of radio ownership and access to electricity along with corresponding 95% confidence
intervals. All specifications estimated from non-parametric locally weighted linear regressions with
triangular kernel, Imbens-Kalyanamaran optimal bandwidths, and Huber-White standard errors.

page 31 of 52
In sum, three core lessons emerge from these results. First, incumbency effects in
Zambia’s local government elections do not appear to vary with the competitiveness of
electoral races – as measured by the number of competing parties or ENP. Second,
changes in the landscape of political competition – namely, the break-up of the UDA
coalition – are closely related with the strong incumbency disadvantages found in local
government elections. Third, incumbency disadvantages appear to be significantly
associated with levels of voter information and economic conditions – as measured by
radio ownership and access to electricity, respectively.
These results align closely with an emerging perspective on voter behaviour in the
Zambian context pointing to the importance voters place on economic conditions and the
provision of local public goods over private clientelistic goods, in addition to the growing
influence of civil society on political participation (Norris & Mattes, 2013; Young, 2009;
Larmer, 2009; Chipenzi et al., 2011). Similarly, these findings support the burgeoning
literature introduced in Section 3.1 suggesting that African voters are becoming more
sophisticated and are increasingly using elections to punish incumbents for poor
performance rather than being passive ‘subjects’ (Mamdani, 1996) in an elite-dominated
political landscape.
Finally, these findings are broadly consistent with the explanations for incumbency
disadvantages proposed in a range of other low and middle income countries. For instance,
Uppal (2009) finds that incumbency disadvantages are significantly higher in regions of
India with lower provision of public goods, while Molina (2001) contends that strong
popular discontent with economic conditions is responsible for the high levels of
incumbent turnover in Latin America and Fraenkel (2004, 2006) and Trease (2005)
suggest that a lack of responsiveness among incumbents play an important role in the high
levels of incumbent turnover in many Pacific island countries. Similarly, the importance of
voter information in the extent to which incumbents are punished for corruption and poor
economic performance has been widely documented (Ferraz & Finan, 2011; Winters &
Weitz-Shapiro, 2013; Banarjee et al., 2012). 6.3. Limitations
The analyses conducted above naturally raise a number of concerns. First and
foremost, a causal interpretation of the main RD results presented in Section 5 and the
various (non-causal) inferences made in this section hinge on the internal validity of the

page 32 of 52 RD design in this context. The various robustness checks employed above and the strong
covariate balance among 2006 ward-level candidates found by Enemark et al. (2013) give
us much confidence that the key RD identification assumption is plausible in the Zambian
context, yet the ongoing debate about the general validity of RD designs in electoral
contexts nevertheless makes this concern worth re-iterating.
Second, the main RD results do not capture the extent to which personal
incumbency influences the estimates of party incumbency effects. In other words,
wherever the same individual runs for a given party in period t and t+1, the resulting
incumbency effect estimates capture both the personal and party effect (see Lee, 2008).
Third, the analyses presented in this section on the moderators of incumbency
disadvantage do not warrant causal interpretations. For instance, there is strong reason to
believe that indicators such as radio ownership and access to electricity co-vary with other
drivers of incumbency disadvantages – such as rent-seeking or pre-electoral resource
mobilisation. Similarly, measurement validity is an important concern, since variables like
radio ownership and access to electricity are merely rough measures of the underlying
theoretical constructs of interest.
Fourth, the external validity – or generalisability – of the results remains an open
question. Indeed, the generally high levels of internal validity of RD designs come at the
price of decreased external validity, since the LATE estimates apply only to observations
in the neighbourhood of the threshold. More broadly, although various features arguably
make Zambia a ‘modal case’ for Africa, there is also reason to believe these results might
be unique to the Zambian context. For instance, like many young African democracies,
Zambia transitioned to multi-party democracy in the early 1990s following economic
hardship, power remains heavily concentrated in the executive, political competition has
been historically restricted by a dominant ruling party, state capacities remain weak, and
elite clientelism has been a predominant feature of the political landscape since
independence. On the other hand, Zambia is simultaneously one of the few African
countries where an opposition party has successfully defeated a sitting incumbent and
political violence has remained comparatively low since independence relative to many
other African countries (see Di John, 2010).

page 33 of 52 7. Concluding remarks
The prevailing wisdom of how politics ‘work’ in Africa’s emerging democracies
states that incumbents systematically manipulate the electoral process to their own
advantage through a wide range of licit and illicit tactics, such as vote-buying, repression,
and elite co-optation. Yet, in direct contrast to this perspective, this study has found that
incumbent parties in Zambia’s local government elections are significantly dis-advantaged
relative to non-incumbents, on the order of an estimated 19.6% decrease in the probability
of electoral victory and a 7.5 percentage point decrease in vote share relative to non-
incumbents in the neighbourhood of the threshold. Moreover, even at the parliamentary
level, there are no discernible party incumbency advantages over the period 1991-2011.
These non-parametric RD results not only remain robust to a variety of alternative
estimators and bandwidths, but also appear to satisfy the minimal continuity assumption
necessary to identify an unbiased treatment effect of incumbency on electoral performance
in the neighbourhood of very ‘close’ elections.
How can we explain these results? In other words, why are incumbent parties
disadvantaged in Zambia’s local government elections? For one, Zambia’s formative and
still unstable party system appears to be an important source of explanation. Specifically,
incumbency disadvantages are concentrated most heavily among the members of the
former UDA coalition that broke apart after the 2006 elections. Moreover, the results
suggest that levels of voter information (as measured by radio ownership) and economic
conditions (as measured by access to electricity, safe drinking water, et cetera) play an
important role in explaining these disadvantages. Specifically, incumbency disadvantages
are strongest in constituencies with high levels of voter information and poor economic
conditions.
Although a more nuanced consideration of these factors awaits further analysis,
these results are broadly consistent with the mechanisms that have been argued to play a
key role in the incumbency disadvantages across many other low and middle income
countries. Moreover, these findings support the growing literature on voter behaviour in
Africa that points to increasing voter sophistication, improvements in political
accountability, and the deepening of democratic values. Overall, this study not only brings
the incumbency effects literature to the African context, but also makes a unique
contribution to the study of African politics through an application of the non-parametric
HLATE estimator in an RD framework.

page 34 of 52
In touching on deeper issues relating to the nature of political power and
accountability beyond concerns with incumbency effects alone, these results point to a
number of directions for further inquiry. For instance, the relative dearth of understanding
on what drives the persistent incumbency disadvantages in many low and middle income
countries demands much further attention. Moreover, strong incumbency disadvantages in
the Zambian context raise important questions about possible shifts in the clientelistic
strategies that elites may choose to employ (see van de Walle, 2012; Werghorst &
Lindberg, 2013; Kosack, 2013). Similarly, an important line of inquiry relates to how the
behaviour of elites influence what voters value and base their decisions upon (see Eifert,
Miguel, & Posner, 2010; Bandyopadhyay & Green, 2013; Posner, 2005).
Finally, perhaps the most important yet unanswered question is how incumbency
advantages and disadvantages affect the welfare of ordinary citizens. Do incumbency
disadvantages reflect improvements in the ability of citizens to make their voices heard –
and thus force public policies to reflect their preferences – or do they merely facilitate
short-term policy horizons and discourage ‘honest’ candidates from entering politics (see
Svolik, 2013; Leftwich, 2005)? On the flip side, do incumbency advantages reflect low
levels of political accountability – and thus a significant divergence in public policies from
the preferences of ordinary citizens – or can they in fact facilitate strong dynamic growth
trajectories through centralising economic rents and encouraging long-term policy
horizons (see Khan, 2010; Putzel & Di John, 2012; North, Wallis, & Weingast, 2009)? 8. References
Aidt, T., Golden, M., & Tiwari, D. (2011). Incumbents and Criminals in the Indian National Legislature.
Working Paper. Retrieved from http://www.dspace.cam.ac.uk/handle/1810/242058
Albertus, M., & Menaldo, V. (2013). Gaming Democracy: Elite Dominance during Transition and the
Prospects for Redistribution. British Journal of Political Science, 1–29.
doi:10.1017/S0007123413000124
Angrist, J. D., & Pischke, J.-S. (2009). Mostly harmless econometrics: an empiricist’s companion. Princeton
NJ: Princeton University Press.
Ansolabehere, S., Snyder Jr., J. M., & Stewart III, C. (2000). Old Voters, New Voters, and the Personal
Vote: Using Redistricting to Measure the Incumbency Advantage. American Journal of Political
Science, 44(1), 17–34. doi:10.2307/2669290

page 35 of 52
Ashworth, S. (2005). Reputational Dynamics and Political Careers. Journal of Law, Economics, and
Organization, 21(2), 441–466. doi:10.1093/jleo/ewi015
Ashworth, S., & Bueno de Mesquita, E. (2008). Electoral Selection, Strategic Challenger Entry, and the
Incumbency Advantage. The Journal of Politics, 70(04), 1006–1025.
Ashworth, S., Mesquita, E. B. De, & Friedenberg, A. (2013). Accountability Traps. Working Paper.
Retrieved from http://home.uchicago.edu/~bdm/PDF/traps.pdf
Baldwin, K. (2013). Why Vote with the Chief? Political Connections and Public Goods Provision in Zambia.
American Journal of Political Science, n/a–n/a. doi:10.1111/ajps.12023
Banarjee, A., Green, D. P., McManus, J., & Pande, R. (2012). Are Poor Voters Indifferent to Whether
Elected Leaders are Criminal or Corrupt? A Vignette Experiment in Rural India. Working paper.
Bandyopadhyay, S., & Green, E. (2013). Nation-Building and Conflict in Modern Africa. World
Development, 45(0), 108–118.
Bardhan, P., & Mookherjee, D. (2006). Pro-poor targeting and accountability of local governments in West
Bengal. Journal of Development Economics, 79(2), 303–327.
Bartlett, D. M. (2000). Civil society and democracy: a Zambian case study. Journal of Southern African
Studies, 26(3), 429–446.
Bates, R. (2008). When things fell apart: State failure in late-century Africa. Cambridge, UK: Cambridge
University Press.
Bates, R. H. (1983). The Nature and Origin of Agricultural Policies in Africa. In Essays on the Political
Economy of Rural Africa (pp. 107–133). Cambridge University Press.
Bayart, J-F. (2000). Africa in the world: a history of extraversion. African Affairs, 99(395), 217–267.
doi:10.1093/afraf/99.395.217
Bayart, Jean-Francois. (1993). The State in Africa: The Politics of the Belly. London, UK: Longman.
Baylies, C., & Szeftel, M. (1997). The fall and rise of multi-party politics in Zambia. Review of African
Political Economy, 19(54), 75–91.
Becker, S., Egger, P., & Ehrlich, M. Von. (in press). Absorptive capacity and the growth effects of regional
transfers: A regression discontinuity design with heterogeneous treatment effects. Forthcoming in
AEJ: Economic Policy.
Besley, T., & Burgess, R. (2002). The political economy of government responsiveness: Theory and
evidence from India. The Quarterly Journal of Economics, 117(4), 1415–1451.
doi:10.1162/003355302320935061

page 36 of 52
Besley, Timothy. (2006). Principled Agents?: The Political Economy of Good Government. Oxford
University Press.
Block, S. A., Ferree, K. E., & Singh, S. (2003). Multiparty Competition, Founding Elections and Political
Business Cycles in Africa. Journal of African Economies, 12(3), 444–468. doi:10.1093/jae/12.3.444
Boas, T. C., & Hidalgo, F. D. (2011). Controlling the Airwaves: Incumbency Advantage and Community
Radio in Brazil. American Journal of Political Science, 55(4), 869–885. doi:10.2307/23025125
Booth, D. (2012). Development as a collective action problem: Addressing the real challenges of African
governance. APPP Synthesis report, London, UK. Retrieved from http://www.institutions-
africa.org/filestream/20121024-appp-synthesis-report-development-as-a-collective-action-problem
Brambor, T., Clark, W. R., & Golder, M. (2005). Understanding Interaction Models: Improving Empirical
Analyses. Political Analysis, 14(1), 63–82. doi:10.1093/pan/mpi014
Brambor, Thomas, & Ceneviva, R. (2011). Incumbency Advantage in Brazilian Mayoral Elections. APSA
2011 Annual Meeting Paper. Retrieved from
http://papers.ssrn.com/sol3/papers.cfm?abstract_id=1903410
Bratton, M, & van de Walle, N. (1997). Democratic experiments in Africa: regime transitions in comparative
perspective. Democratic experiments in Africa: regime transitions in comparative perspective.
Bratton, Michael. (2013). Voting and democratic citizenship in Africa. Boulder, CO: Lynne Rienner
Publishers.
Bratton, Michael, Bhavnani, R., & Chen, T.-H. (2013). Voting intentions in Africa: Ethnic, economic, or
partisan? In Michael Bratton (Ed.), Voting and democratic citizenship in Africa (pp. 79–100).
Boulder, CO: Lynne Rienner Publishers.
Braumoeller, B. F. (2004). Hypothesis Testing and Multiplicative Interaction Terms. International
Organization, 58(04), 807–820. doi:10.1017/S0020818304040251
Broockman, D. E. (2009). Do Congressional Candidates Have Reverse Coattails? Evidence from a
Regression Discontinuity Design. Political Analysis, 17(4), 418–434. doi:10.1093/pan/mpp013
Butler, D. M. (2009). A regression discontinuity design analysis of the incumbency advantage and tenure in
the U.S. House. Electoral Studies, 28(1), 123–128.
Carothers, T. (2002). The end of the transition paradigm. Journal of Democracy, 13(1), 5–21.
Caughey, D., & Sekhon, J. S. (2011). lections and the Regression Discontinuity Design: Lessons from Close
US House Races, 1942–2008. Political Analysis, 19(4), 385–408.

page 37 of 52
Chabal, P., & Daloz, J.-P. (1999). Africa works: Disorder as political instrument. Bloomington, Indiana:
James Currey.
Chhibber, P., & Nooruddin, I. (2004). Do party systems count? The number of parties and government per-
formance in the Indian state. Comparative Political Studies, 41(8), 152–187.
Chipenzi, M., Kaela, L., Madimutsa, C., Momba, J., Mubanga, H., Muleya, N., & Musamba, C. (2011). The
state of democracy in Zambia. Lusaka, Zambia: FODEP &UNZA-PAS.
Collier, P., & Vicente, P. (2012). Violence, bribery, and fraud: the political economy of elections in Sub-
Saharan Africa. Public Choice, 153(1-2), 117–147. doi:10.1007/s11127-011-9777-z
Conroy-Krutz, J., & Logan, C. (2013). Museveni and the 2011 Ugandan election: Did the money matter? In
Michael Bratton (Ed.), Voting and democratic citizenship in Africa (pp. 139–158). Boulder, CO:
Lynne Rienner Publishers.
Cox, G. W., & Katz, J. N. (1996). Why Did the Incumbency Advantage in U.S. House Elections Grow?
American Journal of Political Science, 40(2), 478–497. doi:10.2307/2111633
Crook, R., & Manor, J. (1998). Democracy and decentralization in South Asia and West Africa. Cambridge:
Cambridge University Press.
Di john, J. (2010). State Resilience Against the Odds: An Analytical Narrative on the Construction and
Maintenance of Political Order in Zambia since 1960. CSRC Working Paper. Retrieved from
http://www.lse.ac.uk/internationalDevelopment/research/crisisStates/download/wp/wpSeries2/WP75
2.pdf
Diamond, L., & Plattner, M. F. (eds.). (2001). The Global Divergence of Democracies. The Johns Hopkins
University Press.
Dix, R. H. (1984). Incumbency and Electoral Turnover in Latin America. Journal of Interamerican Studies
and World Affairs, 26(4), 435–448. doi:10.2307/165475
Eggers, A. C., Folke, O., Fowler, A., Hainmueller, J., Hall, A. B., & Snyder, J. M. (2013). On The Validity
Of The Regression Discontinuity Design For Estimating Electoral Effects: New Evidence From Over
40,000 Close Races, 0–32.
Eifert, B., Miguel, E., & Posner, D. (2010). Political competition and ethnic identification in Africa.
American Journal of Political Science, 54(89), 494–510.
Enemark, D. P., Gibson, C. C., McCubbins, M. D., & Zimmerman, B. (2013). The Effect of Holding Office
on the Behavior of Politicians. doi:10.2139/ssrn.2247147

page 38 of 52
Erdmann, G., & Engel, U. (2007). Neopatrimonialism Reconsidered: Critical Review and Elaboration of an
Elusive Concept. Commonwealth & Comparative Politics, 45(1), 95–119.
doi:10.1080/14662040601135813
Erikson, R., & Rader, K. (2013). Much Ado About Nothing: RDD and the Incumbency Advantage. In
Prepared for the 3rd Annual European Political Science Association Convention, Barcelona Spain,
June 2013.
Erikson, R. S. (1971). The Advantage of Incumbency in Congressional Elections. Polity, 3(3), 395–405 CR
– Copyright © 1971 Northeastern P. doi:10.2307/3234117
Ferejohn, J. A. (1977). On the Decline of Competition in Congressional Elections. The American Political
Science Review, 71(1), 166–176. doi:10.2307/1956960
Ferraz, C., & Finan, F. (2011). Electoral Accountability and Corruption: Evidence from the Audits of Local
Governments. American Economic Review, 101(4), 1274–1311.
Fisman, R., Schulz, F., & Vig, V. (2012). Private Returns to Public Office. National Bureau of Economic
Research Working Paper Series, No. 18095. Retrieved from http://www.nber.org/papers/w18095
Fraenkel, J. (2004). Electoral engineering in Papua New Guinea; lessons from Fiji and elsewhere. Pacific
Economic Bulletin, 19(1), 122–133.
Fraenkel, J. (2006). The impact of RAMSI on the 2006 elections in Solomon Islands. Political Science,
58(2), 58–63–85.
Gelman, A., & King, G. (1990). Estimating Incumbency Advantage without Bias. American Journal of
Political Science, 34(4), 1142–1164. doi:10.2307/2111475
Golden, M., & Min, B. (2013). Distributive Politics Around the World. Annual Review of Political Science,
16(1), 73–99. doi:10.1146/annurev-polisci-052209-121553
Gordon, S. C., & Landa, D. (2009). Do the Advantages of Incumbency Advantage Incumbents? Journal of
Politics, 71(4), 1481–1498.
Grimmer, J., Hirsh, E., Feinstein, B., & Carpenter, D. (2012). Are Close Elections Random? Working paper.
Hahn, J., Todd, P., & Klaauw, W. Van der. (2001). Identification and estimation of treatment effects with a
regression-discontinuity design. Econometrica, 69(1), 201–209.
Hainmueller, J., & Kern, H. L. (2008). Incumbency as a source of spillover effects in mixed electoral
systems: Evidence from a regression-discontinuity design. Electoral Studies, 27(2), 213–227.

page 39 of 52
Horiuchi, Y., & Leigh, A. (2009). Estimating Incumbency Advantage: Evidence from Three Natural
Experiments, 1–26. Unpublished manuscript. Retrieved from
http://wwwdocs.fce.unsw.edu.au/economics/news/VisitorSeminar/091014_YusakuHoriuchi.pdf
Horowitz, D. (1985). Ethnic groups in conflict. Berkeley: University of California Press.
Huntington, S. P. (1991). The third wave: democratization in the late twentieth century. Julian J. Rothbaum
distinguished lecture series. University of Oklahoma Press.
Hyden, G. (2005). African Politics in Comparative Perspective. Cambridge, UK: Cambridge University
Press.
Imbens, G., & Kalyanaraman, K. (2009). Optimal Bandwidth Choice for the regression discontinuity
estimator. Retrieved from http://www.nber.org/papers/w14726
Imbens, G., & Lemieux, T. (2007). Regression Discontinuity Designs: A Guide to Practice. National Bureau
of Economic Research Technical Working Paper Series, No. 337. Retrieved from
http://www.nber.org/papers/t0337
Katz, J. N., & King, G. (1999). A statistical model for multiparty electoral data. The American Political
Science Review, 93(1), 15–32.
Kendall, C., & Rekkas, M. (2012). Incumbency advantages in the Canadian Parliament. The Canadian
Journal of Economics, 45(4), 1560–1584.
Khan, M. H. (2005). Markets, states and democracy: Patron–client networks and the case for democracy in
developing countries. Democratization, 12(5), 704–724. doi:10.1080/13510340500322157
Khan, M. H. (2010). Political Settlements and the Governance of Growth-Enhancing Institutions. London,
UK. Working Paper. Retrieved from
http://eprints.soas.ac.uk/9968/1/Political_Settlements_internet.pdf
Khan, M. H. (2012). Governance during Social Transformations: Challenges for Africa. New Political
Economy, 17(5), 667–675. doi:10.1080/13563467.2012.732276
Klašnja, M. (2013). Increasing Rents and Incumbency Disadvantage. Working Paper. Retrieved from
https://files.nyu.edu/mk3296/public/research.html
Kosack, S. (2013). The Logic of Pro-Poor Policymaking: Political Entrepreneurship and Mass Education.
British Journal of Political Science (pp. 1–36). doi:10.1017/S0007123412000695
Laakso, M., & Taagepera, R. (1979). Effective Number of Parties: A Measure with Application to West
Europe. Comparative Political Studies, 12, 3–27.

page 40 of 52
Lande, C. (1983). Political Clientelism in Political Studies. International Political Science Review, 4(4),
435–454.
Larcinese, V., Snyder, J. M., & Testa, C. (2012). Testing Models of Distributive Politics using Exit Polls to
Measure Voters’ Preferences and Partisanship. British Journal of Political Science, 43(04), 845–875.
doi:10.1017/S0007123412000245
Larmer, M. (2009). Zambia since 1990: Paradoxes od democratic transition. In A. R. Mustapha & L.
Whitfield (Eds.), Turning points in African democracy (pp. 114–133). Rochester: James Currey.
Larmer, M., & Fraser, A. (2007). Of Cabbages and King Cobra: Populist Politics and Zambia’s 2006
Election. African Affairs, 106(425), 611–637.
Lee, D. S. (2008). Randomized experiments from non-random selection in U.S. House elections. Journal of
Econometrics, 142(2), 675–697.
Lee, D. S., Moretti, E., & Butler, M. J. (2004). Do Voters Affect or Elect Policies? Evidence from the U. S.
House. The Quarterly Journal of Economics, 119(3), 807–859. doi:10.1162/0033553041502153
Leftwich, A. (2005). Democracy and development: is there institutional incompatibility? Democratization,
12(5), 686–703.
Levitsky, S., & Way, L. (2010). Competitive authoritarianism: Hybrid regimes after the Cold War. New
York: Cambridge University Press.
Levitt, S. D., & Wolfram, C. D. (1997). Decomposing the Sources of Incumbency Advantage in the U. S.
House. Legislative Studies Quarterly, 22(1), 45–60. doi:10.2307/440290
Lewis-Beck, M., & Stegmaier, M. (2000). Economic Determinants of Electoral Outcomes. Annual Review of
Political Science, 3, 183–219.
Lewis-Beck, M., & Stegmaier, M. (2008). The economic vote in transitional democracies. Journal of
Elections, Public Opinion, and Parties, 18(3), 303–323.
Lindberg, S. I. (2006). Democracy and elections in Africa. Baltimore, MD: John Hopkins University Press.
Lindemann, S. (2010). Inclusive elite bargains and civil war avoidance: The case of Zambia. CSRC Working
Paper. Retrieved from
http://www.lse.ac.uk/internationalDevelopment/research/crisisStates/download/wp/wpSeries2/WP77
2.pdf
Linden, L. (2004). Are Incumbents Really Advantaged? The Preference for Non-Incumbents in Indian
National Elections. Working paper. Retrieved from http://leighlinden.com/Incumbency Disad.pdf

page 41 of 52
Lynch, G., & Crawford, G. (2011). Democratization in Africa 1990–2010: an assessment. Democratization,
18(2), 275–310. doi:10.1080/13510347.2011.554175
Magalhaes, L. (2013). Incumbency effects in a comparative perspective: Evidence from Brazilian mayoral
elections. Paper presented at the EPSA 2013 meeting, Barcelona, Spain.
Mamdani, M. (1996). Citizen and subject: Contemporary Africa and the legacy of late colonialism.
Princeton NJ: Princeton University Press.
McCrary, J. (2008). Manipulation of the running variable in the regression discontinuity design: A density
test. Journal of Econometrics, 142(2), 698–714.
McKelvey, R. D., & Riezman, R. (1992). Seniority in Legislatures. The American Political Science Review,
86(4), 951–965. doi:10.2307/1964347
Medard, J.-F. (1982). The Underdeveloped State in Tropical Africa: Politi- cal Clientelism or Neo-
patrimonialism? In C. Clapham (Ed.), Private Patronage and Public Power: Political Clientelism
and the Modern State (pp. 162–192). New York: St. Marten’s Press.
Miguel, E., & Zaidi, F. (2003). Do Politicians Reward their Supporters? Regression Discontinuity Evidence
from Ghana. Unpublished manuscript. Retrieved from
http://www.polisci.ucla.edu/wgape/papers/2_MiguelZaidi.pdf
Molina, J. (2001). The electoral effect of underdevelopment: government turnover and its causes in Latin–
American, Caribbean and industrialized countries. Electoral Studies, 20(3), 427–446.
Mueller, D. (2003). Public Choice III. Cambridge, UK: Cambridge University Press
Myerson, R. B. (2006). Does Advertising Exposure Affect Turnout? Quarterly Journal of Political Science,
1, 3–23. doi:10.1561/100.00000002
Nordhaus, W. (1975). The political business cycle. Review of Economic Studies, 169–190.
Norris, P., & Mattes, R. (2013). Does ethnicity determine support for the governing party? In Michael
Bratton (Ed.), Voting and democratic citizenship in Africa (pp. 41–60). Boulder, CO: Lynne Rienner
Publishers.
North, D. C., Wallis, J. J., & Weingast, B. R. (2009). Violence and social orders: a conceptual framework
for interpreting recorded human history. New York, NY: Cambridge University Press.
Owens, J., & Wade, L. (1984). Federal Spending in Congressional Districts. Western Political Quarterly, 37,
404–423.
Persson, A., Rothstein, B., & Teorell, J. (2012). Why Anticorruption Reforms Fail-Systemic Corruption as a
Collective Action Problem. Governance. doi:10.1111/j.1468-0491.2012.01604.x

page 42 of 52
Pop-Eleches, G. (2010). Throwing out the Bums: Protest Voting and Unorthodox Parties after Communism.
World Politics, 62(02), 221–260. doi:10.1017/S0043887110000043
Posner, D. N., & Simon, D. J. (2002). Economic Conditions and Incumbent Support in Africa’s New
Democracies: Evidence from Zambia. Comparative Political Studies, 35(3), 313–336.
doi:10.1177/0010414002035003003
Posner, Daniel N. (2005). Institutions and ethnic politics in Africa.
Posner, Daniel N., & Kramon, E. (2013). Who Benefits from Distributive Politics? How the Outcome One
Studies Affects the Answer One. Perspectives on Politics, 11(2), 461–474.
Putzel, J., & John, J. Di. (2012). Meeting the challenges of crisis states. London, UK: CSRC. Retrieved from
http://www2.lse.ac.uk/internationalDevelopment/research/crisisStates/Publications/Final-
Report.aspx
Rakner, L. (2003). Political and Economic Liberalisation in Zambia 1991–2001. Boulder, CO: Lynne
Rienner Publishers.
Roberts, A. (2008). Hyperaccountability: Economic voting in Central and Eastern Europe. Electoral Studies,
27(3), 533–546.
Serra, G., & Moon, D. (1994). Casework, Issue Positions, and Voting in Congressional Elections: A District
Analysis. Journal of Politics, 56(1), 200–213.
Shepsle, K. A., & Weingast, B. R. (1994). Positive Theories of Congressional Institutions. Legislative
Studies Quarterly, 19(2), 149–179. doi:10.2307/440423
Snyder, Ja. (2005). Detecting Manipulation in U.S. House Elections. unpublished.
Solé-Ollé, A. (2013). Inter-regional redistribution through infrastructure investment: tactical or
programmatic? Public Choice, 156(1-2), 229–252. doi:10.1007/s11127-011-9896-6
Svolik, M. W. (2013). Learning to Love Democracy: Electoral Accountability and the Success of
Democracy. American Journal of Political Science, no–no. doi:10.1111/ajps.12005
Titiunik, R. (2011). Incumbency Advantage in Brazil: Evidence from Municipal Mayor Elections.
Unpublished manuscript. Retrieved from http://www-
personal.umich.edu/~titiunik/papers/Titiunik_IABrazil.pdf
Trease, H. Van. (2005). The Operation of the single non-transferable vote system in Vanuatu.
Commonwealth & Comparative Politics, 43(3), 296–332. doi:10.1080/14662040500304833
Uddhammar, E., Green, E., & Söderström, J. (2011). Political opposition and democracy in sub-Saharan
Africa. Democratization, 18(5), 1057–1066. doi:10.1080/13510347.2011.603466

page 43 of 52
Uppal, Y. (2009). The disadvantaged incumbents: estimating incumbency effects in Indian state legislatures.
Public Choice, 138(1-2), 9–27. doi:10.1007/s11127-008-9336-4
Van de Walle, N. (2001). African economies and the politics of permanent crisis: 1979-1999. Cambridge:
Cambridge University Press.
Van de Walle, N. (2007). Meet the new boss , same as the old boss ? The evolution of political clientelism in
Africa. In H. Kitschelt & S. I. Wilkinson (Eds.), Patrons, Clients and Policies: Patterns of
Democratic Accountability and Political Competition (pp. 50–67). Cambridge, MA: Cambridge
University Press.
Von Soest, C. (2007). How Does Neopatrimonialism Affect the African Staté’s Revenues? The Case of Tax
Collection in Zambia. The Journal of Modern African Studies, 45(4), 621–645. doi:10.2307/4501949
Wantchekon, L. (2003). Clientelism and voting behaviour: Evidence from a field experiment in Benin.
World Politics, 55(2), 399–422.
Weghorst, K. R., & Lindberg, S. I. (2011). Effective Opposition Strategies: Collective Goods or Clientelism?
Working paper. Retrieved from
http://www.tandfonline.com.gate2.library.lse.ac.uk/doi/abs/10.1080/13510347.2011.603483
Weghorst, K. R., & Lindberg, S. I. (2013). What Drives the Swing Voter in Africa? American Journal of
Political Science, n/a–n/a. doi:10.1111/ajps.12022
Winters, M. S., & Weitz-Shapiro, R. (2013). Lacking Information or Condoning Corruption: When Do
Voters Support Corrupt Politicians? Comparative Politics, 45(4), 418–436.
doi:doi:10.5129/001041513806933583
Young, D. J. (2009). Is Clientelism at Work in African Elections? A Study of Voting Behavior in Kenya and
Zambia, (106).
Young, M. C. (1976). The politics of cultural pluralism. Madison: University of Wisconsin Press.
Ziegfeld, A., & Tudor, M. (2013). Bringing Down Dominant Parties: Evidence from Indian States, (January),
1–52. Unpublished manuscript. Retrieved from
http://www.adamziegfeld.com/uploads/1/6/9/1/16910526/bringing_down_dominant_parties_jan_201
3.pdf

page 44 of 52 Appendix A. Zambian electoral results, 1991-2011
Parliamentary elections Ward elections
1991 1996 2001 2006 2011 2006 2011
MMD 125 131 69 72 55 707 540
PF - - 1 43 60 314 527
UDAa - - - 26 - 286 -
UNIP 25 0b 13 - - - 3
UPND - - 49 - 28 7 258
FDD - - 12 - 1 - 3
IND - 10 1 3 3 38 31
Other 9 5 4 1 17 14
Total 150 150 150 148c 148c
1369d 1376d
Notes: Election results obtained from the Electoral Commission of Zambia (ECZ). a UDA was a coalition between three opposition parties – UNIP, UPND, and FDD – that formed for the 2006
local government and parliamentary elections only; b The 1996 parliamentary elections were boycotted by UNIP; c Two races were postponed in the 2006 and 2011 parliamentary elections; d Zambia has a total of 1,421 ward constituencies, yet a number of postponed and unopposed elections are
not reported by the EZC and are thus not included in this table.

page 45 of 52
All |MOV| |MOV| |MOV| |MOV| |MOV| |MOV| |MOV| Obs. < 25% < 15% < 10% < 7.5% < 5% < 2% < 1%
3278
1216
721
475
347
211
92
48
2350
611
319
189
131
95
35
22
Appendix B. Number of observations and electoral
perf ormance in t+1 Appendix B.1. Number of candidate-level observations
Local Government
elections (2006)
Parliamentary
elections (1991-2006)
Appendix B.2. Electoral performance in t+1, Ward candidates
P(win), t+1
Vote share, t+1
Mean Mean Min 1st Qtr. Med. 3rd Qtr. Max. Obs. All parties
All candidates, t Winning candidates, t Losing candidates, t
0.31 0 0.08 0.29 0.51 0.95 3278 0.49 0 0.34 0.51 0.64 0.95 1183 0.21 0 0.02 0.17 0.35 0.92 2095
0.34 0.65 0.17
MMD All MMD candidates, t Winning candidates, t Losing candidates, t
0.38 0 0.23 0.36 0.51 0.92 1212
0.46 0 0.33 0.45 0.57 0.92 634 0.30 0 0.19 0.25 0.38 0.92 578
0.38
0.56 0.18
PF All PF candidates, t Winning candidates, t Losing candidates, t
0.47 0 0.28 0.51 0.64 0.90 710 0.63 0 0.57 0.65 0.73 0.90 279 0.36 0 0.19 0.37 0.53 0.81 431
0.61 0.95 0.40
UDA All UDA candidates, t Winning candidates, t Losing candidates, t
0.23 0 0.04 0.15 0.38 0.95 961 0.43 0 0.19 0.47 0.65 0.95 257 0.16 0 0.03 0.10 0.27 0.71 704
0.23 0.58 0.11

page 46 of 52 Appendix B.3. Electoral performance in t+1, Parliamentary candidates
P(win), t+1
Vote share, t+1
Mean Mean Min 1st Qtr. Median 3rd Qtr. Max. Obs.
All parties All candidates, t Winning candidates, t Losing candidates, t
0.18 0 0.00 0.04 0.33 1.00 2350 0.42 0 0.25 0.42 0.60 1.00 556 0.11 0 0.00 0.00 0.16 0.90 1786
0.22 0.57 0.10
MMD All MMD candidates, t Winning candidates, t Losing candidates, t
0.42 0 0.26 0.39 0.57 1.00 571 0.45 0 0.30 0.43 0.59 1.00 382 0.35 0 0.21 0.30 0.48 0.86 187
0.54 0.62 0.39
All other parties All non-MMD candidates, t Winning candidates, t Losing candidates, t
0.11 0 0.00 0.00 0.12 0.90 1779
0.35 0 0.04 0.34 0.6 0.89 174 0.08 0 0.00 0.00 0.08 0.90 1599
0.11
0.47 0.07

page 47 of 52 Appendix C. Conditional estimates of incumbency effects,
Ward and Parliamentary elections
Notes: The above plots exhibit the estimated causal effect of incumbency on vote share in election
period t+1 and probability of winning in election t+1 in both ward-level and parliamentary
elections. The plotted curves are estimated from non-parametric locally weighted regressions of
next period electoral performance on incumbency status and margin of victory in period t as well
as incumbency status interacted with margin of victory.

page 48 of 52
sample ≤ 25% ≤ 7.5% sample ≤ 25% ≤ 7.5%
Probability of 0.106 0.041 0.063 -0.381 -0.350*** -0.482*** winning, t-1 (0.141) (0.044) (0.082) (0.288) (0.078) (0.163)
Vote share, t-1 0.059*** 0.030 0.042 0.147*** 0.070* -0.003 (0.018) (0.023) (0.043) (0.023) (0.036) (0.086)
Voter turnout (%) 0.012** -0.001 -0.010 -0.014 -0.001 -0.020 (0.006) (0.009) (0.017) (0.011) (0.019) (0.043)
Total votes cast -237.4* 73.28 8.676 -1070.6 -140.0 -816.8 (141.48) (203.06) (441.19) (736.3) (1373.0) (3637.7)
Number of 189.5 52.16 319.8 -1328.4 -266.4 -571.6 registered voters (238.3) (210.40) (285.7) (1044.3) (1880.8) (4853.6)
Rejected ballots (%) -0.001 -0.001 -0.0004 0.005*** -0.0004 -0.0002 (0.002) (0.002) (0.003) (0.002) (0.003) (0.005)
Winner vote share, t 0.0305*** -0.003 0.001 0.122*** 0.005 0.028 (0.005) (0.007) (0.012) (0.008) (0.013) (0.030)
Best opposition 0.0106** (0.004)
0.003 (0.006)
0.001 (0.012)
0.028*** (0.007)
0.017 (0.012)
0.029 (0.030)
share, t
Number of candidates
-0.021 (0.040)
0.057 (0.088)
-0.058 (0.160)
-0.253*** (0.041)
0.070 (0.372)
-0.191 (0.797)
Effective number of parties
-0.212 (0.032)
0.020
(0.060)
-0.002 (0.115)
-1.112***
(0.090)
-0.105 (0.182)
-0.365 (0.400)
Access to electricity (%)
-0.861 (1.433)
1.209
(2.090)
-0.123 (4.22)
-4.515** (2.246)
2.034
(3.412)
1.186
(8.316) Radio ownership (%)
-1.381 (6.569)
0.592
(1.550)
-0.600 (3.027)
-3.764** (1.647)
0.731
(2.560)
1.004
(6.180) Access to safe
-2.494
0.882
-1.675
-5.447*
1.411
1.534
drinking water (%) (1.878) (2.872) (5.323) (2.976) (4.511) (10.333)
Total population -2777 1671 296.8 -8204** -3061 -2363 (2174) (3136) (6028) (3744) (5736) (12689)
Province: Central 0.249 -0.002 0.001 0.255 -0.032 -0.027 (0.271) (0.024) (0.035) (0.321) (0.041) (0.089)
Province: 0.006 0.005 -0.026 -0.519* 0.006 0.031 Copperbelt (0.178) (0.038) (0.065) (0.281) (0.055) (0.111)
Province: Eastern -0.085 -0.026 -0.020 -0.182 0.030 0.015 (0.195) (0.038) (0.071) (0.263) (0.060) (0.133)
Province: Luapula 0.027 0.009 0.002 0.268 0.018 0.054 (0.233) (0.0307) (0.050) (0.345) (0.034) (0.093)
Appendix D. Placebo outcome tests
Local gov’t elections Parliamentary elections
Placebo outcome Full |MOV| |MOV| Full |MOV| |MOV|
candidate vote

page 49 of 52
Province: Lusaka -0.085 0.017 0.016 -0.468 -0.014 -0.013 ( 0.268) (0.025) (0.032) (0.317) (0.050) (0.129)
Province: 0.017 -0.005 -0.001 - - - Northwestern (0.271) ( 0.018) (0.051)
Province: Northern 0.097 -0.007 -0.001 -0.429 -0.015 -0.081 (0.183) (0.041) (0.081) (0.279) (0.051) (0.105)
Province: Southern 0.069 -0.009 -0.008 1.246*** 0.003 0.012 (0.241) (0.028) (0.048) (0.352) (0.031) (0.064)
Province: Western 0.091 0.019 0.025 0.106 -0.005 0.001 (0.239) (0.027) (0.050) (0.293) (0.055) (0.121)
*** = p < 0.01; ** = p < 0.05; * = p < 0.10.
Notes: Every row contains a placebo treatment effect estimated at the threshold MOV=0, obtained
from non-parametric locally weighted linear regression with a triangular kernel. Huber-White
standard errors are used. Ward-level placebo outcomes for electoral performance in t-1 are
estimated using 2011 election data. Placebo outcome for Northwestern province is not estimated in
parliamentary elections due to insufficient sample size around the threshold.

page 50 of 52 Appendix E. McCrary Density tests
Appendix E.1. McCrary density tests by incumbency, Ward elections
Appendix E.2. McCrary density tests by party, Ward elections
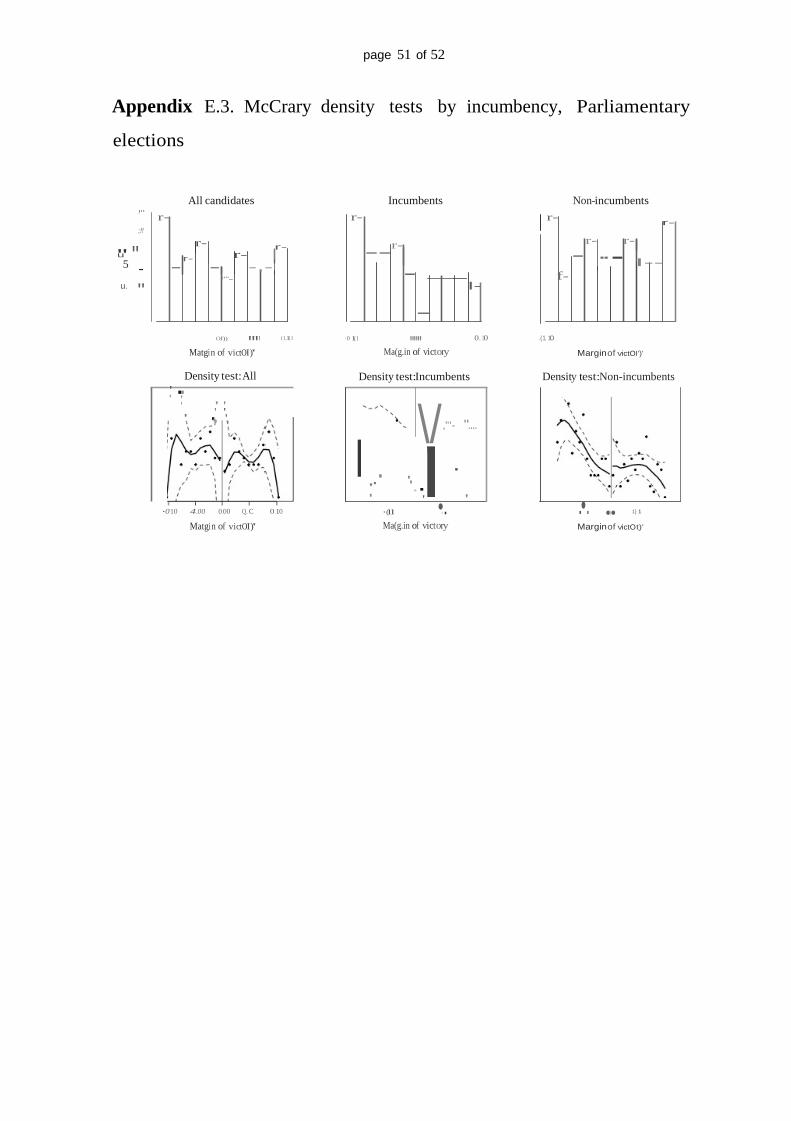
page 51 of 52
"" """
' ' '
' '
n M
Appendix E.3. McCrary density tests by incumbency, Parliamentary
elections
,.. r-
;!!
"u "
All candidates
r- r- r- r-
Incumbents r- --r-
Non-incumbents r- r-
r- r- - -- - I--
5 - u. "
- - ,..._ -,- - f- I-
-
' ..
OJ)) (1,1(1
Matgin of victOI)'
·0 1(1 0.10
Ma(g.in of victory .(1.10
Marginof victOI')'
Density test:All
' '
Density test:Incumbents
\/ Density test:Non-incumbents
' ' ' ' '
''' '
''' ''..
,"'- "....
'
·0 10 4.00 0.00 Q.C 0.10
Matgin of victOI)' ·(ll •.. Ma(g.in of victory
.•. ••• 1} 1
Marginof victOt)'

page 52 of 52 Appendix E.3. McCrary density tests by party, Parliamentary elections
Note: In these assessments of the marginal distribution of V, two plots are noteworthy. First, the histogram
and density test for parliamentary incumbents in figure m appears to be unbalanced around the threshold.
The density test, however, returns a p-value of 0.21 for a discontinuous jump in the density at the threshold.
Second, the plots for MMD candidates at the parliamentary level similarly appear relatively unbalanced
around the threshold. Again, however, this discontinuity is not significantly different from zero (p=0.20).
The ward figures, on the other hand, do not show any evidence of discontinuities at the threshold.