Embed Size (px)
Citation preview
METRICS 1
In “Knowledge Management: Classic and Contemporary Works” editors D. Morey, M. Maybury and Bhavani
Thuraisingham, MIT Press 2000
Knowledge Sharing Metrics for Large
Organisations
by Laurence Lock Lee BHP Information Technology How can organisations systematically monitor their knowledge sharing performance?
Summary Knowledge sharing is a fundamental knowledge
management process. For large organisations, the ability to effectively share knowledge across the organisation can lead to new competitive intelligence being created and best practices being achieved, organisation wide. This paper introduces the concept of “in process” metrics for tacit to tacit knowledge sharing. Drawing from TQM concepts, “in process” knowledge sharing metrics can provide a means for continuously improving knowledge sharing performance, reducing the reliance on outcome based measures typically found in balanced scorecards. BHP’s global maintenance engineering practice network is used as a case study to illustrate the practical application of these knowledge sharing metrics. The maintenance engineering network is charged with the responsibility
ADVANCES IN KNOWLEDGE MANAGEMENT 2
for achieving best maintenance practice performance, through knowledge sharing, world wide. Measures for tacit to tacit knowledge sharing are derived from social network analyses. Quantitative measures are derived for knowledge sharing intensity and density as well as characteristics like inter- and intra- business unit sharing.
Introduction
While the field of knowledge management is currently enjoying “latest fad” status, its longer term endurance in the business world will only come with demonstrable results. This means an ability to measure knowledge management performance and demonstrate a clear cause and effect relationship between excellent knowledge management practices and superior business results. To date the cause and effect relationships are mostly represented by anecdotal evidence [1]. This is unlikely to be sufficient to sustain knowledge management at the forefront of best management practices. More detailed metrics will be required.
Proof of a strong correlation between knowledge management practices and business performance using a comprehensive suite of knowledge management and business metrics cannot happen overnight. Intellectual asset measures pioneered by the Swedes [2][3][4] and further progressed to the “Balanced Scorecard” concept by Kaplan and Norton [5] have been in the making for more than 10 years. They are only now making inroads into the mainstream of corporate reporting as knowledge based service companies displace physical asset based industrial and resource stocks at the top of the world’s stock markets.
The balanced scorecard concepts have been successful in highlighting the importance of non financial measures in assessing the long term health of an organisation. The measures encompassed within balanced scorecards are however largely “outcomes”. Measures like customer loyalty, staff satisfaction level, R&D expenditure, revenue per employee all indicate results without
METRICS 3
providing any insight into the processes that have led to the result being achieved or the cause and effect relationships. This paper addresses some “in process” metrics for knowledge sharing as a key knowledge management process. In particular the focus is on how we might measure levels of knowledge sharing within large organisations. BHP’s Global Maintenance Improvement Practice network is used as a case study to illustrate its use. The importance of “in process” metrics has been demonstrated by the Total Quality Management (TQM) movement in industrial domains. TQM practitioners have demonstrated that superior quality can be achieved without the need for extensive inspection checks, by keeping processes “in control”. If Knowledge Management processes could likewise be kept “in control” excellent performance could be “designed in” rather than relying on “inspections” using extensive balanced scorecard metrics.
Knowledge Processes
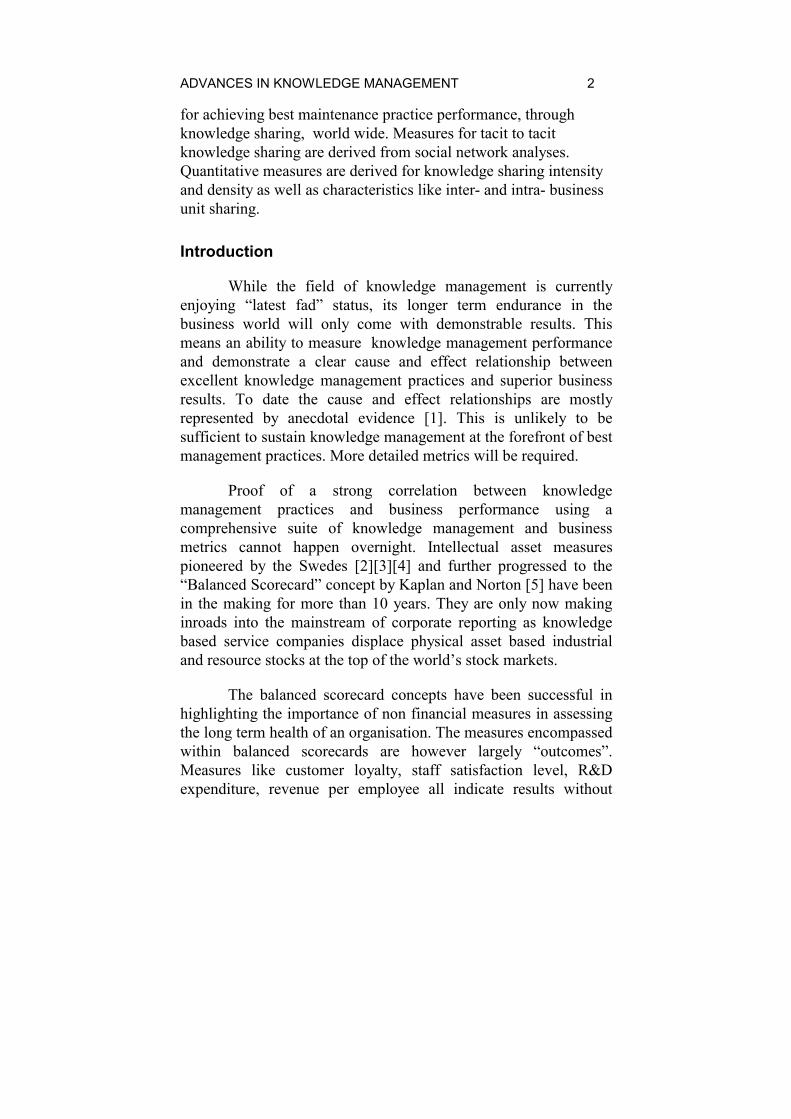
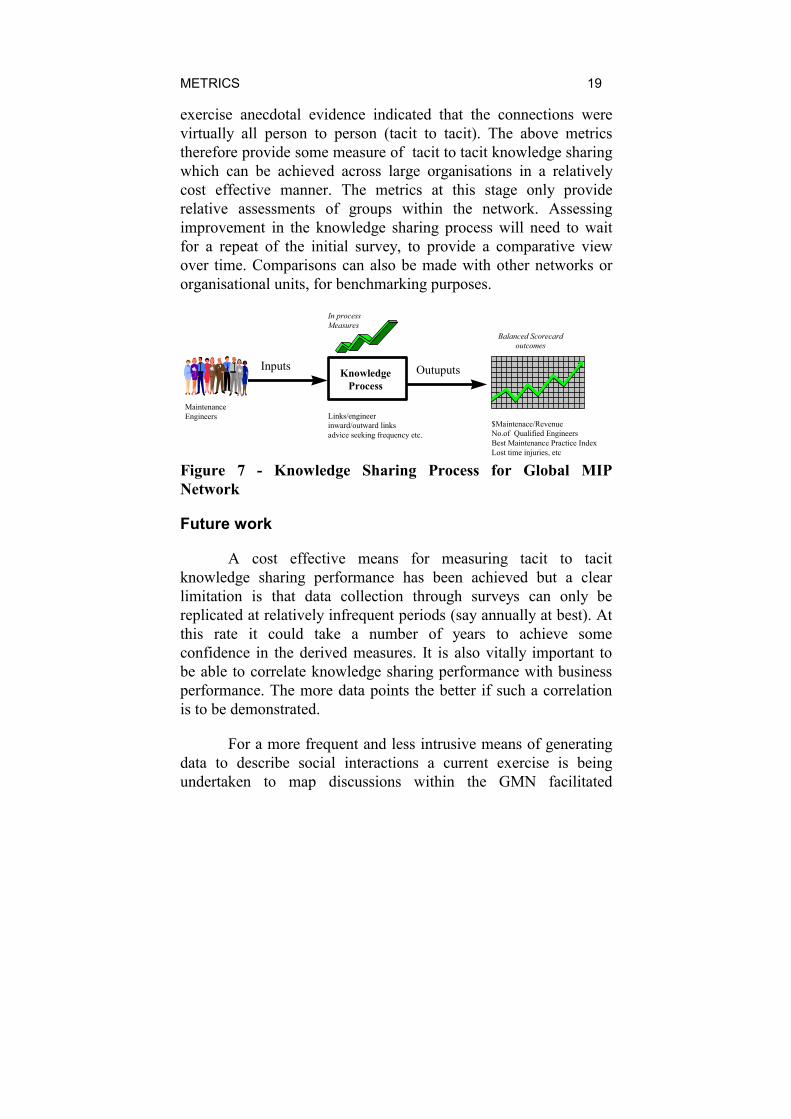
Knowledge Management could be viewed as a suite of sub-processes which together make up the field of knowledge management. Some examples of knowledge management sub-processes are knowledge publishing, knowledge acquisition (for expert systems), knowledge discovery (through data mining). Figure 1 provides a generic representation of a Knowledge Management process. Individuals provide input into a knowledge process which in turn provides a given result which can be reported on. Example outputs could be published documents, staff education levels, patents etc.. Without the benefit of “in process” metrics the effectiveness of the knowledge process will be compromised by an over reliance on output measures and long process improvement cycles.
ADVANCES IN KNOWLEDGE MANAGEMENT 4
KnowledgeProcess
Inputs Outuputs
BalancedScorecard
Results
“In Process”Metrics
Individuals
Figure 1 - A Knowledge Management Process
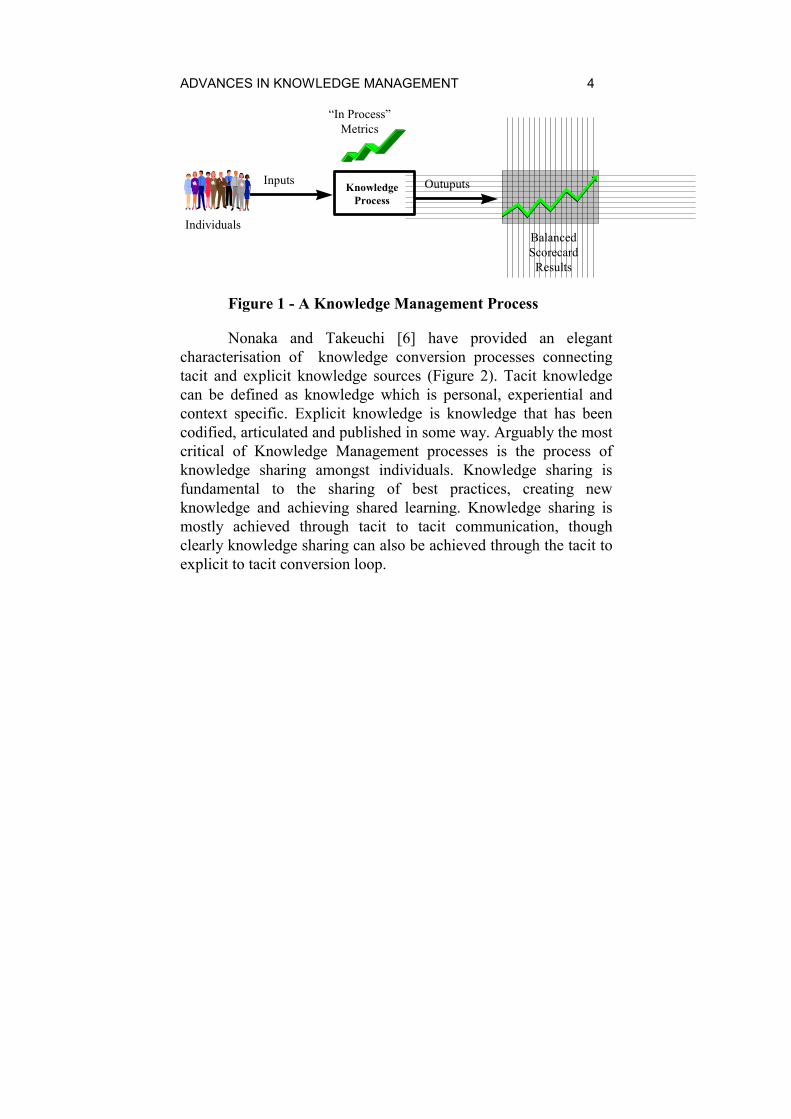
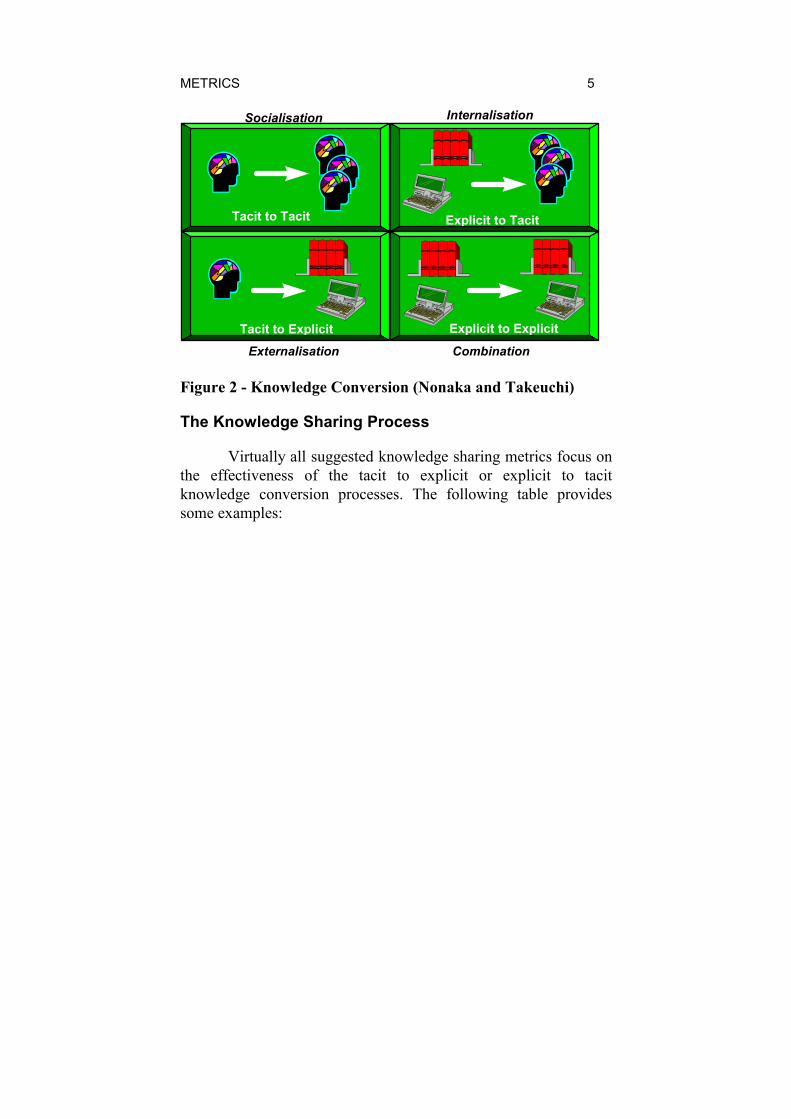
Nonaka and Takeuchi [6] have provided an elegant characterisation of knowledge conversion processes connecting tacit and explicit knowledge sources (Figure 2). Tacit knowledge can be defined as knowledge which is personal, experiential and context specific. Explicit knowledge is knowledge that has been codified, articulated and published in some way. Arguably the most critical of Knowledge Management processes is the process of knowledge sharing amongst individuals. Knowledge sharing is fundamental to the sharing of best practices, creating new knowledge and achieving shared learning. Knowledge sharing is mostly achieved through tacit to tacit communication, though clearly knowledge sharing can also be achieved through the tacit to explicit to tacit conversion loop.
METRICS 5
Tacit to Tacit
Tacit to Explicit
Explicit to Tacit
Explicit to Explicit
Socialisation Internalisation
Externalisation Combination
Figure 2 - Knowledge Conversion (Nonaka and Takeuchi)
The Knowledge Sharing Process
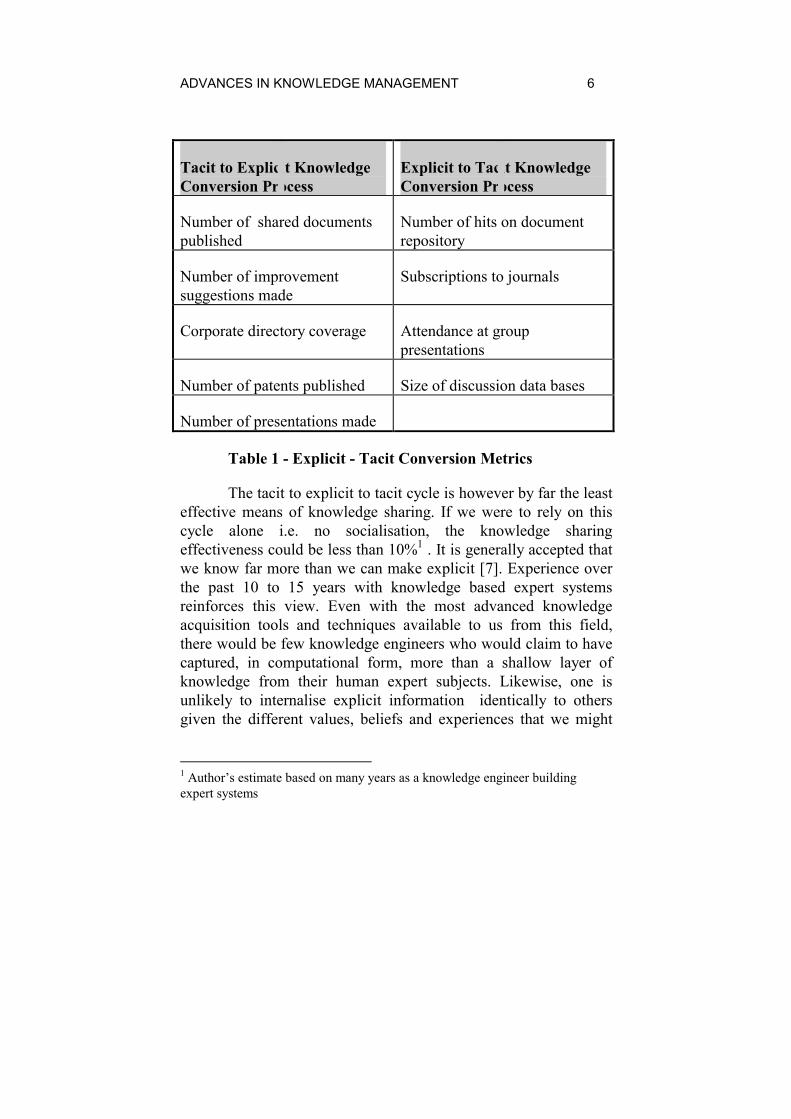
Virtually all suggested knowledge sharing metrics focus on the effectiveness of the tacit to explicit or explicit to tacit knowledge conversion processes. The following table provides some examples:
ADVANCES IN KNOWLEDGE MANAGEMENT 6
Tacit to Explicit Knowledge Conversion Process
Explicit to Tacit Knowledge Conversion Process
Number of shared documents published
Number of hits on document repository
Number of improvement suggestions made
Subscriptions to journals
Corporate directory coverage Attendance at group presentations
Number of patents published Size of discussion data bases
Number of presentations made
Table 1 - Explicit - Tacit Conversion Metrics
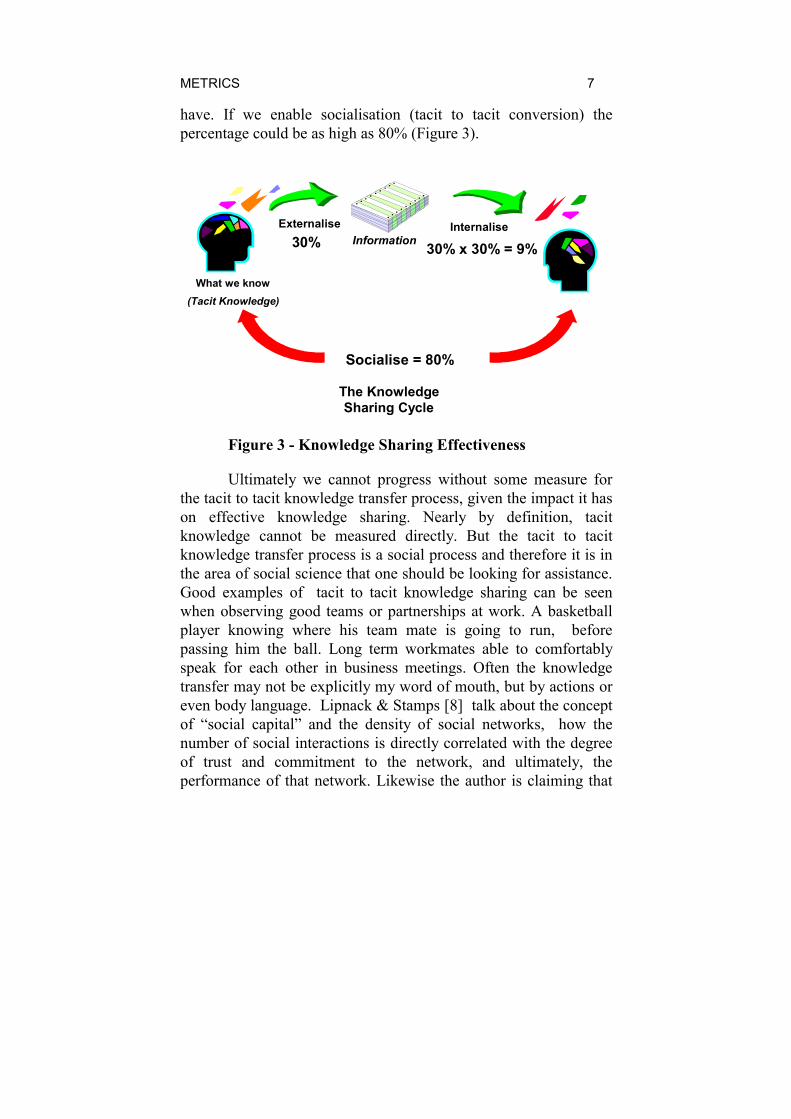
The tacit to explicit to tacit cycle is however by far the least effective means of knowledge sharing. If we were to rely on this cycle alone i.e. no socialisation, the knowledge sharing effectiveness could be less than 10%1 . It is generally accepted that we know far more than we can make explicit [7]. Experience over the past 10 to 15 years with knowledge based expert systems reinforces this view. Even with the most advanced knowledge acquisition tools and techniques available to us from this field, there would be few knowledge engineers who would claim to have captured, in computational form, more than a shallow layer of knowledge from their human expert subjects. Likewise, one is unlikely to internalise explicit information identically to others given the different values, beliefs and experiences that we might
1 Author’s estimate based on many years as a knowledge engineer building expert systems
METRICS 7
have. If we enable socialisation (tacit to tacit conversion) the percentage could be as high as 80% (Figure 3).
What we know(Tacit Knowledge)
Externalise30% Information
Internalise
30% x 30% = 9%
Socialise = 80%
The KnowledgeSharing Cycle
Figure 3 - Knowledge Sharing Effectiveness
Ultimately we cannot progress without some measure for the tacit to tacit knowledge transfer process, given the impact it has on effective knowledge sharing. Nearly by definition, tacit knowledge cannot be measured directly. But the tacit to tacit knowledge transfer process is a social process and therefore it is in the area of social science that one should be looking for assistance. Good examples of tacit to tacit knowledge sharing can be seen when observing good teams or partnerships at work. A basketball player knowing where his team mate is going to run, before passing him the ball. Long term workmates able to comfortably speak for each other in business meetings. Often the knowledge transfer may not be explicitly my word of mouth, but by actions or even body language. Lipnack & Stamps [8] talk about the concept of “social capital” and the density of social networks, how the number of social interactions is directly correlated with the degree of trust and commitment to the network, and ultimately, the performance of that network. Likewise the author is claiming that
ADVANCES IN KNOWLEDGE MANAGEMENT 8
the density of social interactions will be directly correlated with the degree of tacit to tacit knowledge sharing. In a business context this would include business meetings, seminars, conferences as well as traditional social events. As such, measuring social interactions (for which there are a number of available techniques) can provide a workable proxy for measuring the degree of tacit to tacit knowledge sharing occurring within an organisation.
Social Network Analysis
Social Network Analysis has become a well accepted technique for understanding the informal networks which exist outside the formal structure of an organisation, or for diagnosing the dysfunctional aspects of formal structures [9][10]. Typically, questionnaires are used to collect information on “who communicates with whom”. The interactions can then be plotted using specialised graphical software for analysis. Dysfunctional behaviour can easily be identified e.g. are R&D and marketing communicating sufficiently? Are the human resource people being used or bypassed? How well is the new finance manager being accepted across the organisation? With only some modest changes this technique has been used to create a knowledge sharing metric for tacit to tacit knowledge transfer, based on the number, and perceived quality, of relationships within the organisation.
BHP Case Study
The Business Driver
BHP is a large global resources company. Headquartered in Australia, BHP has interests in Minerals, Oil and Gas, Steel, Transport, Engineering and Information Technology which span the globe. The Company has grown substantially over the past 10 years, now operating through 8 major business divisions in over 50 countries. In 1997 BHP created a Global Maintenance Network (GMN) from a number of site and business unit networks. The network now spans all eight business divisions. This initiative was
METRICS 9
triggered by the realisation that substantial economies from the over $2 billion annual maintenance expense could not be achieved without gaining best maintenance practices, through knowledge sharing world wide. The network members determined that the value of sharing best maintenance practices across the Company could be over $500,000 per year in cost reduction opportunities alone and perhaps 10 times this in enhancing equipment capability. As a cross divisional network, it is critically important for the GMN to demonstrate the value it adds. The network is now working to an agreed set of key performance measures akin to those found in a balanced scorecard. To complement these measures a set of “in process” knowledge sharing metrics have now been designed and implemented to monitor tacit to tacit knowledge sharing.
The Network Structure and Operation
The GMN is a mixture of formal and informal structures. The network is facilitated by a “full-time” secretariat and has a steering committee and leadership group drawn from the major business units. Less formal sub-networks exist at regional sites. Informal structures have emerged around particular maintenance topics like condition monitoring, maintenance management systems, etc.. Unlike a community of practice, which is largely unstructured, the GMN is an example of a facilitated network. Some structure exists but the principles of operation are closer to a community of practice than a traditional business unit. The rationale for a facilitated network over a pure community of practice is the business need to meet performance targets and deadlines, which are less of a driver for communities of practice. The interplay between the structured (both in the network and the member’s business unit) and unstructured roles generates some quite unique dynamics in the network. The full-time secretariat team of facilitators have had a considerable influence over network activities. The secretariat formally organises “events” like practice meetings, maintenance reviews, best practice studies, all of which generate enhanced activity in the network, while at the same
ADVANCES IN KNOWLEDGE MANAGEMENT 10
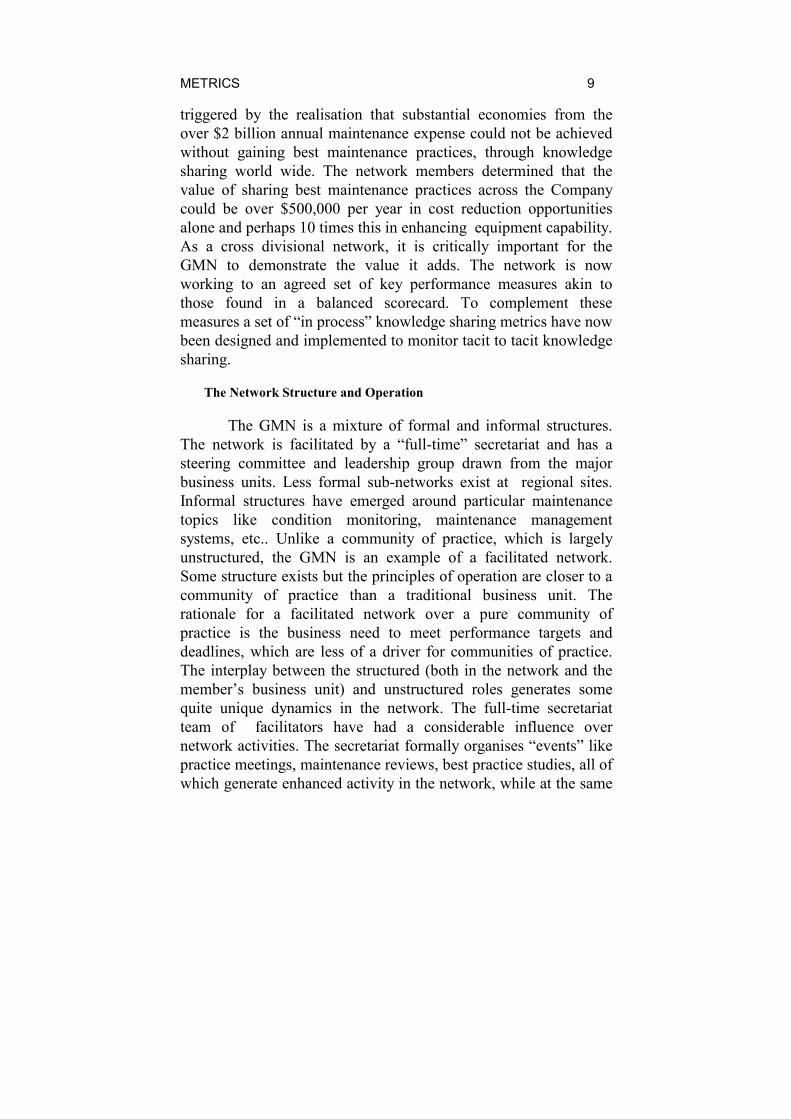
time sharing best practices. The secretariat also facilitates a number of electronic discussion groups. With the assistance of the secretariat, over 2,000 discussion transactions have occurred in the first year of operation. Anecdotal evidence indicates that many of these interactions have generated real value to the company from time saved on developing a practice through to brokering unused equipment around the Company.
97 98
50%
93 95 9691
Net
wor
king
Eff
ectiv
enes
s(P
artic
ipat
ion)
99
New
man Minerals
MIPBegins
Brisb
ane
MIMSKPI’s A
ntof
agas
taBr
isban
eTu
cson
New
man
Launch of Newsgroup
& Web Site
Farm
ingt
onEm
eral
dSh
ared
Lea
rnin
g
MIP Goes Global
Wol
long
ong
Port
Hed
land
Workshops/ForumsMaint. Evaluations
“The PULSEof the
network isMEETINGS”
Source: BHP Global Maintenance Network
Figure 4 - Network participation over time
Figure 4 maps the participation rate in one of the divisional maintenance networks up to and including the formation of the Global Maintenance Network. Of interest is the impact the formal “events” have on re-energising the network over time.
METRICS 11
Social Network Analysis
The GMN has processes in place to measure the benefits that its activities achieve. They also have a suite of KPI’s to monitor their improvement in maintenance capability. The metrics derived from social network analysis are aimed at providing a leading indicator of the “health” of the network. The inference is that if the network is active in both number and breadth of contact, more knowledge sharing will occur, which will result in superior maintenance practices being more broadly adopted, and clearly a better financial result for the Company. The conduct of the social network analysis exercise at the creation of the Global Network from prior business divisional networks was important in developing a base line to assess improvement in the Global Network as it evolves.
Social network analysis techniques, a software package and accompanying methodology from NetMap Solutions2 were used to generate the knowledge sharing metrics based on the strength of relationships which exist in the network. Questionnaires were used to collect the base data. Unlike traditional social network analyses, respondents were not asked who they communicate with, but who they seek advice from, in an area they had already nominated themselves as a specialist in. While only a subtle change, this enabled a separation between communications which support day to day operations and communications which are quality knowledge sharing contacts. This change is important in that within a network there will be many contacts that do not result in a sharing of tacit knowledge. However, where there exists a respectful relationship we could reasonably expect tacit to tacit knowledge sharing is occurring. Where two individuals nominate each other, we would infer a relationship of strong mutual respect
2 Netmap™ software and the OrgMap methodology from NetMap Solutions Pty Ltd ( Sydney, Australia: telephone +61 (2) 9438 5900; fax +61 (2) 9438 5911; email [email protected])
ADVANCES IN KNOWLEDGE MANAGEMENT 12
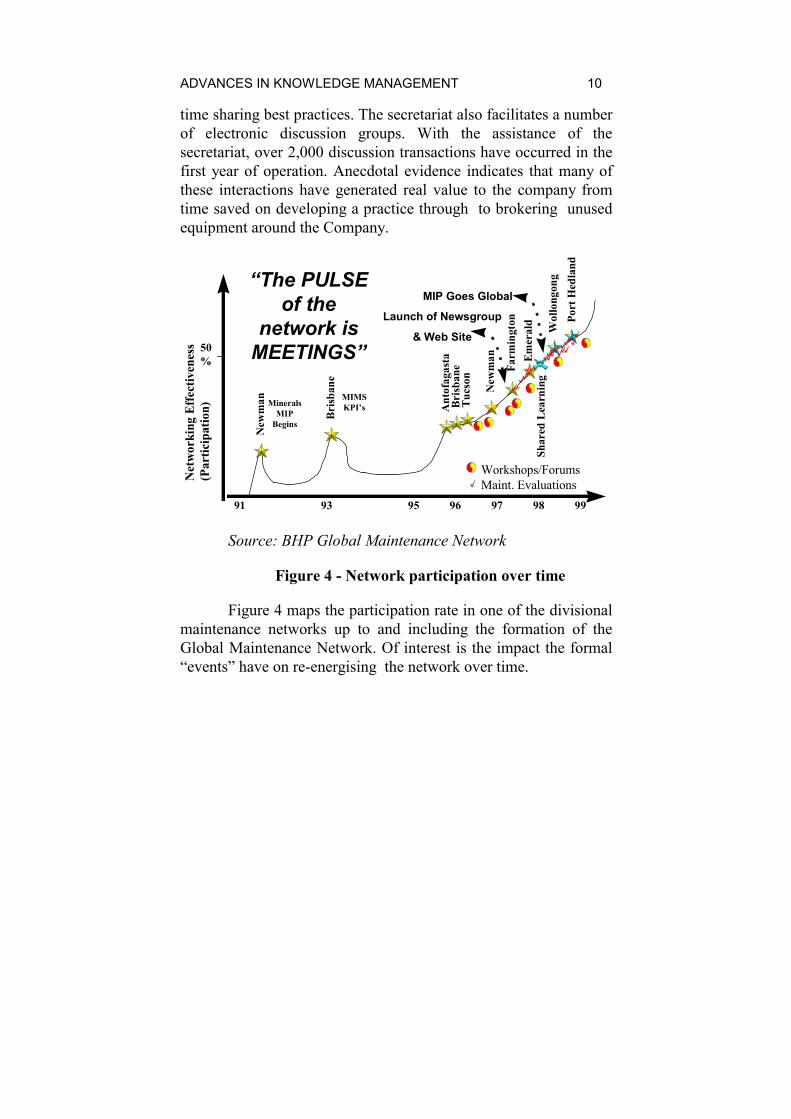
exists. Questions on frequency of advice seeking were also collected as an additional attribute for tacit to tacit knowledge transfer. Business unit membership and geographic location were also collected, enabling social network maps to be drawn from a business unit or a geographic perspective.
Minerals - Coal
Minerals - Iron Ore
Minerals - Manganese
Minerals -World Minerals
Copper - Escondida
Copper -Metals
Copper - North America
Copper -OK Tedi
Steel -Building Products
Steel -Coated
Steel -Integrated Steel -
Rod, Bar & Wire
Petroleum -Americas
Petroleum -Aust./Asia
Petroleum -Europe ...
Petroleum -Hawaii
Services -Engineering
Services -IT
Services -Transport
CorporateResearch
External
Figure 5 - Knowledge Sharing Netmap™ by Business Unit
The above figure illustrates the knowledge sharing connections between and within business units. The satellites represent different business units and connections within those units. The links between the arcs in front of the satellites indicate inter-business unit connections. Each line indicates a link between two individuals. The links are directional, indicating who nominates who. Figure 5 describes the nature of interpersonal links between some 1,000 individuals across 20 different business units. As well as providing a means for understanding current knowledge
METRICS 13
sharing relationships and identifying opportunities for improvement, the data underlying the maps are a rich source for knowledge sharing metrics. The Netmap™ software incorporates a data warehouse for capturing relationship data. As with most databases, once the data is established there is nearly an unlimited number of questions that can be posed and results analysed. The base data collected (see Appendix) was somewhat limited but did enable assessment of the impacts of business unit membership (formal structure) and geographic location on network activity patterns. The data could be grouped and sub-divided to enable different analyses to be conducted. Some of the more interesting findings were:
• Business Unit membership appeared to have a large influence over knowledge sharing patterns. Some business units were quite insular with many internal contacts compared to external contacts. Some of this is explained by the newness of the network. But not all, as some business units belonging to the same division showed relatively poor networking.
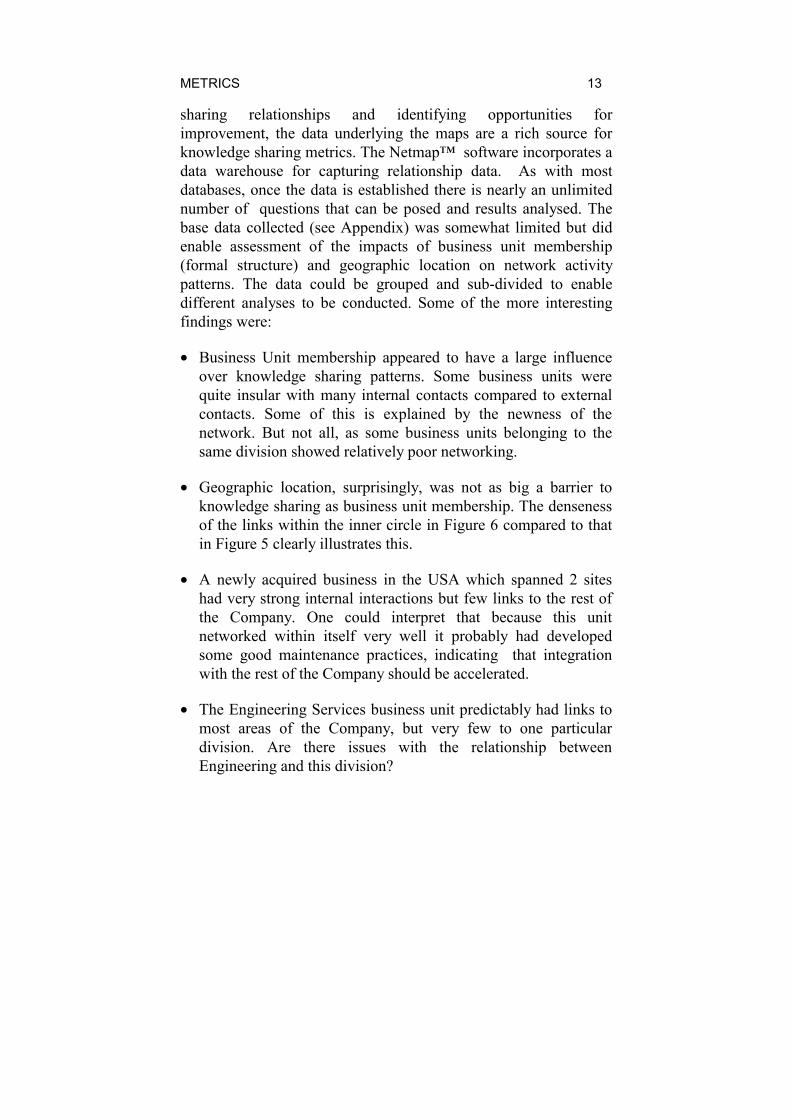
• Geographic location, surprisingly, was not as big a barrier to knowledge sharing as business unit membership. The denseness of the links within the inner circle in Figure 6 compared to that in Figure 5 clearly illustrates this.
• A newly acquired business in the USA which spanned 2 sites had very strong internal interactions but few links to the rest of the Company. One could interpret that because this unit networked within itself very well it probably had developed some good maintenance practices, indicating that integration with the rest of the Company should be accelerated.
• The Engineering Services business unit predictably had links to most areas of the Company, but very few to one particular division. Are there issues with the relationship between Engineering and this division?
ADVANCES IN KNOWLEDGE MANAGEMENT 14
Beenup
Brisbane
CanningtonDarwin
Groote Eylandt
Melbourne
Newcastle
PerthSydney
Tasmania
Whyalla
Wollongong
Qld Central/North
Qld South
WA North
Indonesia - Cilegon
Indonesia - Satui
Kuala Lumpur
NZ - Glenbrook
OK Tedi
Arizona
Hawaii
Nevada
New Mexico
San Francisco
Escondida
Peru
ScotlandLondonZimbabwe
Figure 6 - Knowledge Sharing Netmap™ by Geographic Site
Further analyses were conducted around identified special interest areas of Maintenance Management, Resource Management, Equipment, Work Control and Enabling Functions (areas that were nominated in the survey). Using the relationships data around each interest topic, emerging “centres of excellence” were identified by looking at where there was a concentration of links across business units co-located in a single geographic site. These emerging centres could be used to concentrate best practice development initiatives. Also a league table of “good contacts” in each of the special interest areas was identified.
Knowledge Sharing Metrics
Social Network Analysis is a diagnostic tool. It identifies potential problem areas or new opportunities. The GMN, through
METRICS 15
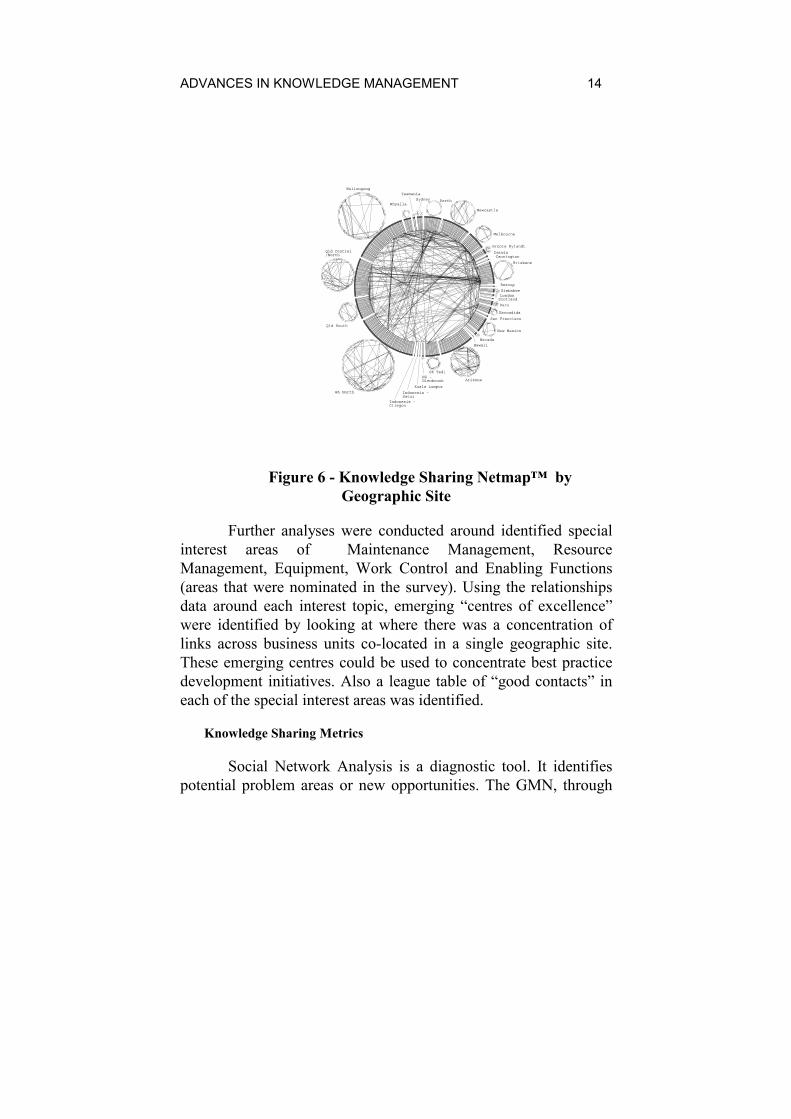
their facilitation and management of maintenance “events”, are able to orchestrate the membership of maintenance reviews or best practice studies teams to encourage working relationships to develop across poor networking areas identified by the social network analysis. Once areas of concern are identified, the role of the knowledge sharing metrics is to monitor overall improvement in the network, especially in areas where corrective action has been performed. Some of the knowledge sharing metrics derived from the data for the GMN base case were:
Knowledge Sharing Metric Interpretation
1. Number of links per respondents
Knowledge sharing density
2. Frequency of advice seeking Intensity of knowledge sharing contacts
3. Individuals with highest number of nominations
Identifies the true experts. Frequency chart indicates how expertise is spread (concentrated or thinly spread)
4. Ratio of internal to external links
How inward looking, or otherwise a business unit is
5. Proportion of total contacts that are inward
How sought after the knowledge of that business unit is
6. Proportion of total contacts that are outward
Which business units seek help the most
Table 2 - Tacit to Tacit Knowledge Sharing Metrics
The first three metrics characterise the intensity of
ADVANCES IN KNOWLEDGE MANAGEMENT 16
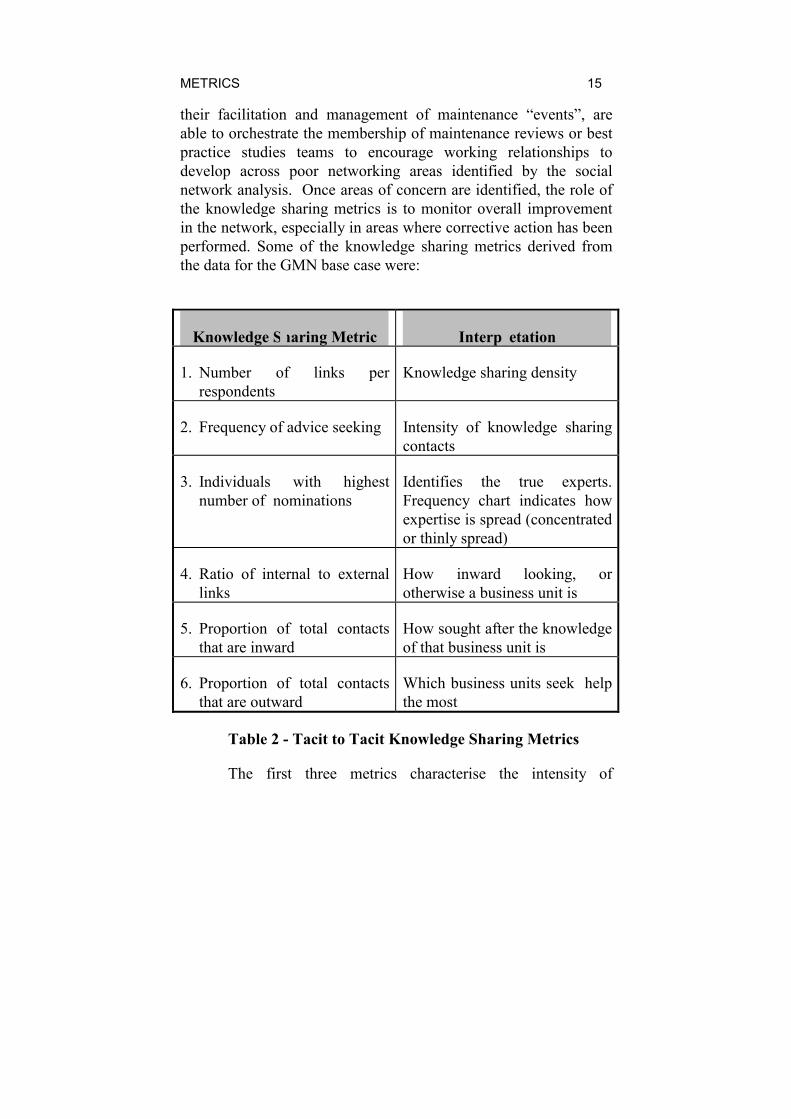
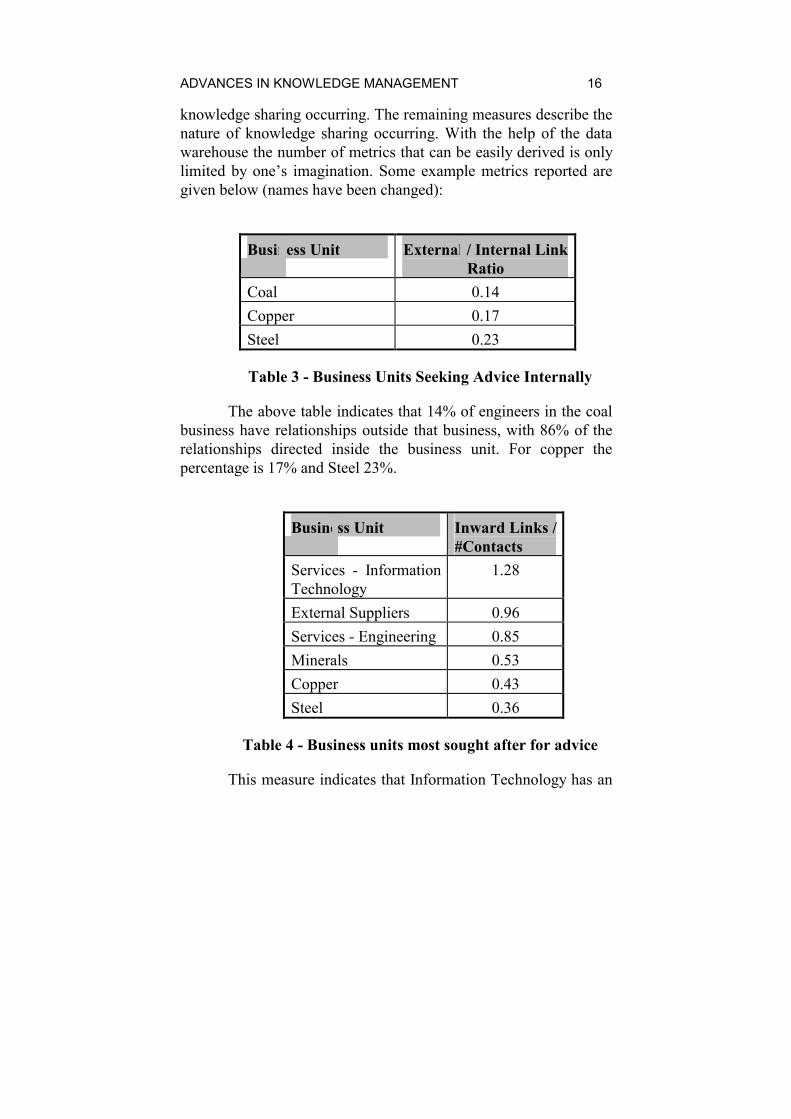
knowledge sharing occurring. The remaining measures describe the nature of knowledge sharing occurring. With the help of the data warehouse the number of metrics that can be easily derived is only limited by one’s imagination. Some example metrics reported are given below (names have been changed):
Business Unit External / Internal Link
Ratio Coal 0.14 Copper 0.17 Steel 0.23
Table 3 - Business Units Seeking Advice Internally
The above table indicates that 14% of engineers in the coal business have relationships outside that business, with 86% of the relationships directed inside the business unit. For copper the percentage is 17% and Steel 23%.
Business Unit Inward Links /
#Contacts Services - Information Technology
1.28
External Suppliers 0.96 Services - Engineering 0.85 Minerals 0.53 Copper 0.43 Steel 0.36
Table 4 - Business units most sought after for advice
This measure indicates that Information Technology has an
METRICS 17
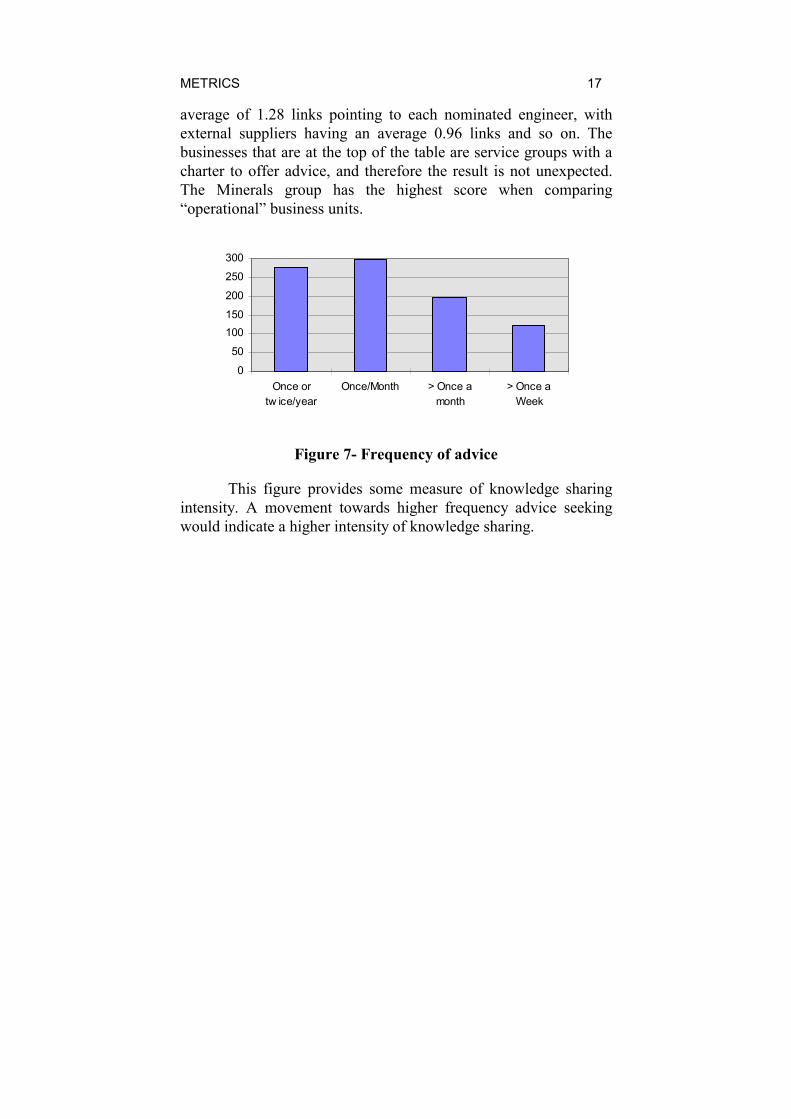
average of 1.28 links pointing to each nominated engineer, with external suppliers having an average 0.96 links and so on. The businesses that are at the top of the table are service groups with a charter to offer advice, and therefore the result is not unexpected. The Minerals group has the highest score when comparing “operational” business units.
0
50
100150
200
250
300
Once ortw ice/year
Once/Month > Once amonth
> Once aWeek
Figure 7- Frequency of advice
This figure provides some measure of knowledge sharing intensity. A movement towards higher frequency advice seeking would indicate a higher intensity of knowledge sharing.
ADVANCES IN KNOWLEDGE MANAGEMENT 18
0 2 4 6 8 10 12
GARY POTTERInformation Tech.
HON LIMMinerals
KEVIN PHILPOTTCopper
ERIC LOVELLEngineering
GERRY DANIELSFerrous
WARREN KILPATRICKSteel
JOHN VINCENTEngineering
RICHARD BLUNTMinerals
RICK NIELSONEngineering
ALAN BONJOVICopper
No. of Reference Links
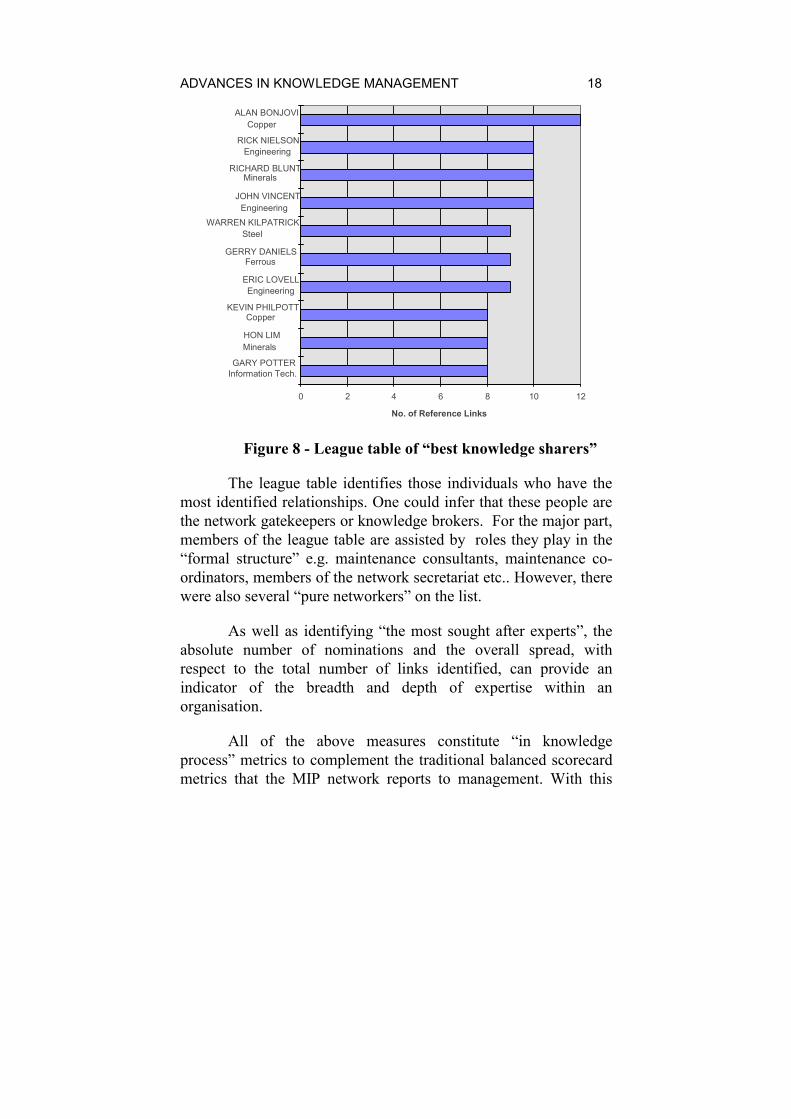
Figure 8 - League table of “best knowledge sharers”
The league table identifies those individuals who have the most identified relationships. One could infer that these people are the network gatekeepers or knowledge brokers. For the major part, members of the league table are assisted by roles they play in the “formal structure” e.g. maintenance consultants, maintenance co-ordinators, members of the network secretariat etc.. However, there were also several “pure networkers” on the list.
As well as identifying “the most sought after experts”, the absolute number of nominations and the overall spread, with respect to the total number of links identified, can provide an indicator of the breadth and depth of expertise within an organisation.
All of the above measures constitute “in knowledge process” metrics to complement the traditional balanced scorecard metrics that the MIP network reports to management. With this
METRICS 19
exercise anecdotal evidence indicated that the connections were virtually all person to person (tacit to tacit). The above metrics therefore provide some measure of tacit to tacit knowledge sharing which can be achieved across large organisations in a relatively cost effective manner. The metrics at this stage only provide relative assessments of groups within the network. Assessing improvement in the knowledge sharing process will need to wait for a repeat of the initial survey, to provide a comparative view over time. Comparisons can also be made with other networks or organisational units, for benchmarking purposes.
KnowledgeProcess
Inputs Outuputs
$Maintenace/RevenueNo.of Qualified EngineersBest Maintenance Practice IndexLost time injuries, etc
MaintenanceEngineers Links/engineer
inward/outward linksadvice seeking frequency etc.
In processMeasures
Balanced Scorecardoutcomes
Figure 7 - Knowledge Sharing Process for Global MIP Network
Future work
A cost effective means for measuring tacit to tacit knowledge sharing performance has been achieved but a clear limitation is that data collection through surveys can only be replicated at relatively infrequent periods (say annually at best). At this rate it could take a number of years to achieve some confidence in the derived measures. It is also vitally important to be able to correlate knowledge sharing performance with business performance. The more data points the better if such a correlation is to be demonstrated.
For a more frequent and less intrusive means of generating data to describe social interactions a current exercise is being undertaken to map discussions within the GMN facilitated
ADVANCES IN KNOWLEDGE MANAGEMENT 20
electronic discussion group. Being a discussion group, the majority of interactions could be described as true knowledge sharing contacts (unlike e-mail). Unlike the survey, one could not infer that these contacts constituted tacit to tacit knowledge transfer, but they could act as triggers to follow up personal contacts, which could then result in tacit knowledge sharing. Preliminary results indicate that the electronic discussion group is becoming a powerful means for enhancing the number of contacts between business units or geographic sites. Participants in electronic discussions are not identified by their position in the formal structure, or which business unit they come from, so knowledge sharing can largely progress untethered by political or social biases. In contrast to the results from the survey, the electronic discussion logs indicate far more activity between business units than within business units. The intention is to use the more reliable survey results to help qualify the electronically collected data and results. In this way continuous information could be collected and reported on virtually a daily or weekly basis, with “reality checks” achieved via the survey process.
Summary
This paper introduces the concept of “in process” metrics for knowledge management processes. Building on lessons learnt from the TQM movement, “in knowledge process” metrics have the potential to more rapidly improve the quality of knowledge management processes and usurp the need for extensive outcome based measures. Knowledge processes were then described in terms of the interaction between explicit and tacit knowledge. The argument was made that the tacit to tacit knowledge transfer process is responsible for over 90% of true knowledge sharing while 90% of the currently promoted knowledge management metrics focus on the tacit to explicit to tacit knowledge transfer cycle. Given that tacit to tacit knowledge sharing is a social process, the field of social science and social network analysis was introduced as a means for achieving workable metrics for the tacit to tacit knowledge sharing process.
METRICS 21
BHP’s newly formed Global Maintenance Improvement Practice network was used as a case study to illustrate how metrics derived from social network analysis could be practically used to provide in-process measures for knowledge sharing within the network.
Finally, current work on incorporating electronically collected electronic discussion group logs to augment the survey derived measures was described. This should enable more regular monitoring of knowledge sharing performance and provide more data points for assessing the correlation between knowledge sharing performance and business performance.
Acknowledgements
This work has been supported by BHP’s Global Maintenance Network. The support of LeRoy Dugger, John Vucko, Philip St. Baker and David Lawrence is gratefully acknowledged. The contributions from Dr John Galloway and Philip Magson from Netmap Solutions is also acknowledged.
References
1. Arthur Andersen Best Practices Handbook, “www.arthurandersen.com”
2. L. Edvinsson and M. Malone, Intellectual Capital: Realising Your Company’s True Value by Finding its Roots, Harperbusiness, 1997
3. Michael S Malone, “New Metrics for a New Age”, Forbes April 7 - 1997
4. Karl Erik Sveiby, The New Organisational Wealth: Managing & Measuring Knowledge Based Assets, Berrett-Koehler Publishers, Inc 1997
ADVANCES IN KNOWLEDGE MANAGEMENT 22
5. Robert S Kaplan and David P Norton, The Balanced Scorecard, Harvard Business School Press, 1996
6. Ikujiro Nonaka, and Hirotaka Takeuchi, The Knowledge Creating Company, Oxford University Press, 1995.
7. M. Polanyi, The Tacit Dimension London; Routledge & Kegan Paul, 1966
8. Jessica Lipnack and Jeffrey Stamps, Virtual Teams: Reaching across space, time, and organisations with technology, John Wiley & Sons, Inc, 1997
9. Carol Hilderbrand, “Mapping the Invisible Workplace”, CIO Magazine, July 15th 1998
10.D. Krackhardt and J. Hanson, “Informal Networks: The Company”, Harvard Business Review, July-Aug. 1993
METRICS 23
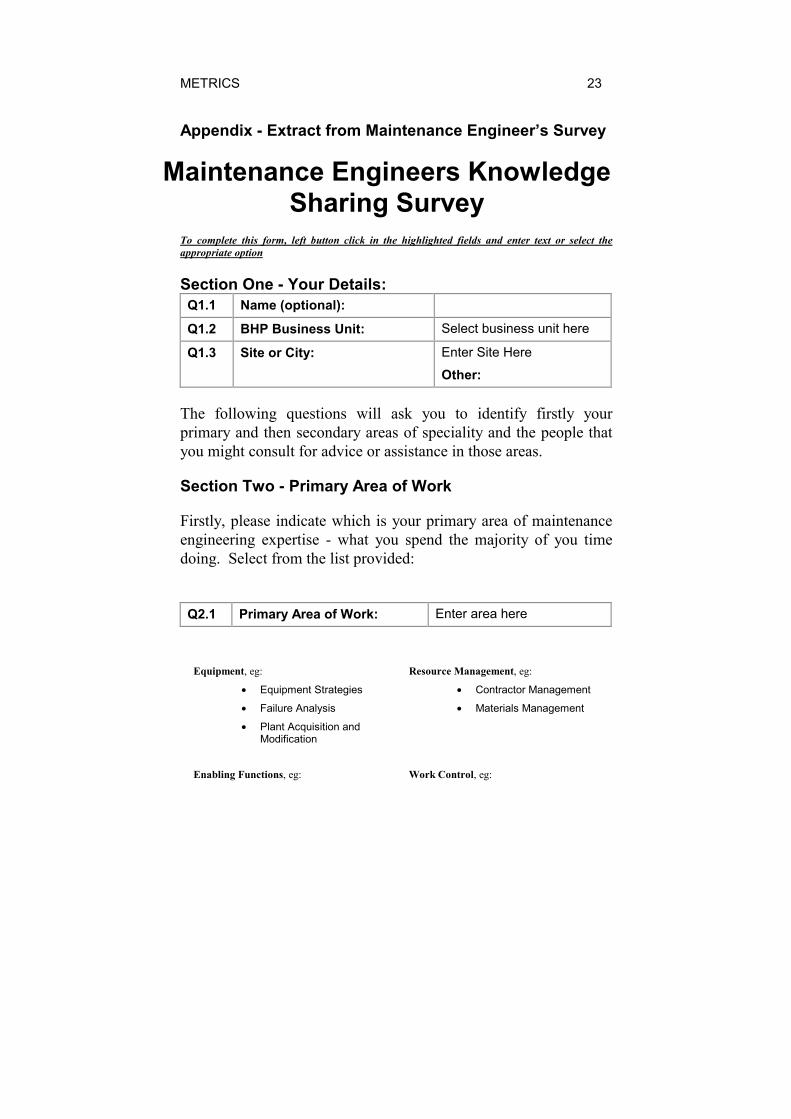
Appendix - Extract from Maintenance Engineer’s Survey
Maintenance Engineers Knowledge Sharing Survey
To complete this form, left button click in the highlighted fields and enter text or select the appropriate option
Section One - Your Details: Q1.1 Name (optional):
Q1.2 BHP Business Unit: Select business unit here
Q1.3 Site or City: Enter Site Here
Other:
The following questions will ask you to identify firstly your primary and then secondary areas of speciality and the people that you might consult for advice or assistance in those areas.
Section Two - Primary Area of Work
Firstly, please indicate which is your primary area of maintenance engineering expertise - what you spend the majority of you time doing. Select from the list provided:
Q2.1 Primary Area of Work: Enter area here
Equipment, eg:
• Equipment Strategies
• Failure Analysis
• Plant Acquisition and Modification
Resource Management, eg:
• Contractor Management
• Materials Management
Enabling Functions, eg: Work Control, eg:
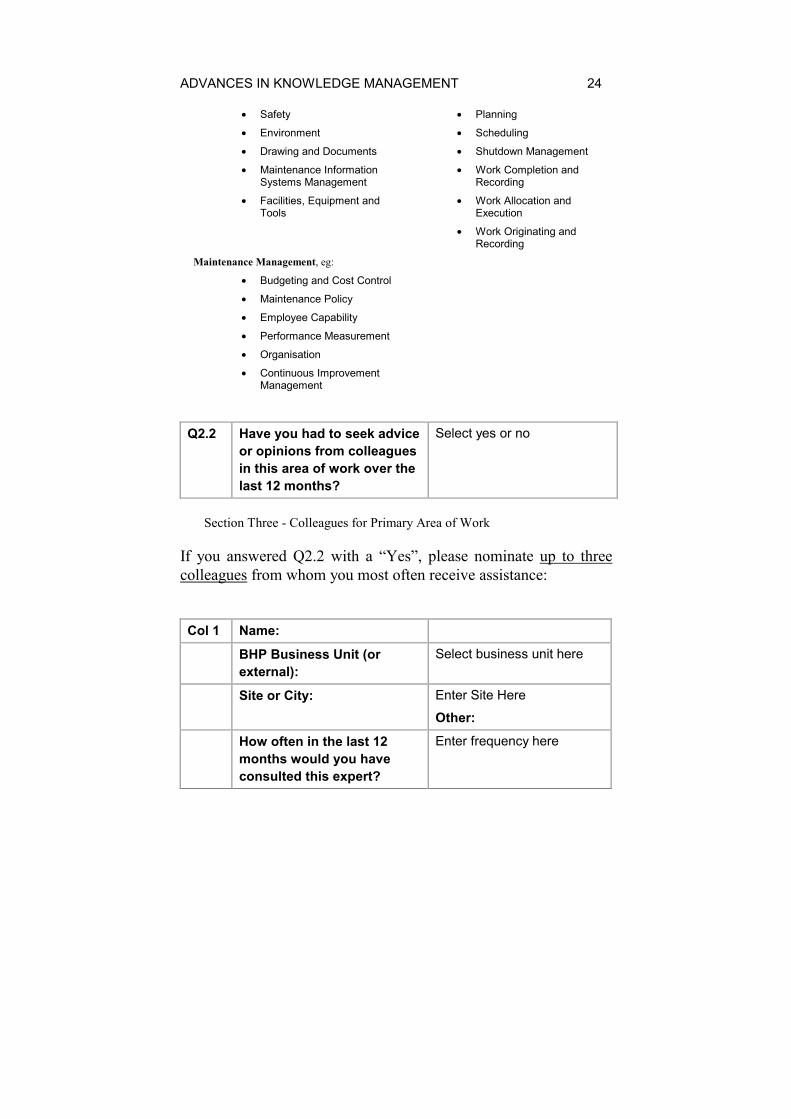
ADVANCES IN KNOWLEDGE MANAGEMENT 24
• Safety
• Environment
• Drawing and Documents
• Maintenance Information Systems Management
• Facilities, Equipment and Tools
• Planning
• Scheduling
• Shutdown Management
• Work Completion and Recording
• Work Allocation and Execution
• Work Originating and Recording
Maintenance Management, eg:
• Budgeting and Cost Control
• Maintenance Policy
• Employee Capability
• Performance Measurement
• Organisation
• Continuous Improvement Management
Q2.2 Have you had to seek advice or opinions from colleagues in this area of work over the last 12 months?
Select yes or no
Section Three - Colleagues for Primary Area of Work
If you answered Q2.2 with a “Yes”, please nominate up to three colleagues from whom you most often receive assistance:
Col 1 Name:
BHP Business Unit (or external):
Select business unit here
Site or City: Enter Site Here
Other:
How often in the last 12 months would you have consulted this expert?
Enter frequency here

METRICS 25