Embed Size (px)
Citation preview
WANO monitors six additional performance indicators: safety system performance, chemistry performance, fuel reliability, grid-related loss factor, unplanned total scrams per 7,000 hours critical and contractor industrial safety accident rate. The first three indicators are defined in a manner that reflects differences in plant-specific designs, configurations, or operational practices. As a result, data for these three indicators cannot be summarised across reactor types for inclusion in this report. Additionally, grid-related loss factor is out of plant management control. Contractor industrial safety accident rate and unplanned total scrams per 7,000 hours critical are not plotted because data has not been collected for these indicators long enough to show a significant trend over time. These indicators are available to WANO members in more detailed reports on the WANO member website.
Safety System Performance (SSPI)The safety system performance indicator monitors the availability of three important standby safety systems at each plant. Safety systems that are maintained in a high state of readiness have a high probability of being capable of mitigating off-normal events.
Chemistry Performance (CPI)The chemistry performance indicator provides an indication of progress in controlling chemical parameters to retard deterioration of key plant materials and components. These parameters are to be maintained within strict guidance developed by the industry.
Fuel Reliability (FRI)The fuel reliability indicator monitors progress in preventing defects in the metal cladding that surrounds fuel. Maintenance of fuel cladding integrity reduces radiological impact on plant operations and maintenance activities.
The WANO Performance Indicator Programme supports the exchange of operating experience information by collecting, trending and disseminating nuclear plant performance data in 12 key areas. The data is gathered for a set of quantitative indicators of plant performance. These indicators are intended principally for use as a management tool by nuclear operating organisations to monitor their own performance and progress, to set their own challenging goals for improvement, and to gain additional perspective on performance relative to that of other plants.
It is now widely recognised that a good set of overall performance indicators can provide a partial, but important and useful, measure of how well a nuclear plant is managed overall.
WANO published and distributed the first performance indicator report in April 1991. In 1993, reporting of data began for all reactor designs. Currently, more than 98% of the operating nuclear power plants report all indicators.
It is expected that the use of WANO performance indicators will encourage emulation of the best industry performance. It should also further motivate the identification and exchange of good practices in nuclear plant operations.
Notes: 1. The median values are displayed for all indicators except unplanned automatic scrams per 7,000 hours critical (UA7), where
the mean values are shown, and industrial safety accident rate, which is an overall industry value.
2. Half of the values are above and half are below the displayed median values. The mean is the arithmetical average of thevalues. The median value is normally displayed rather than the mean value because the median value is less susceptible toinfluence of outliers and is therefore more representative of overall performance.
3. Worldwide collection of data needed to calculate the forced loss rate indicator did not begin until 2001.
4. Charts are based on performance indicator results obtained 24 March 2015.
Grid-Related Loss Factor (GRLF)The grid-related loss factor is the percentage of maximum energy generation that a plant could not supply due to grid issues not under plant management control.
Unplanned Total Scrams per 7,000 Hours Critical (US7)The unplanned total scrams per 7,000 hours critical monitors the number of unplanned reactor shutdowns for approximately one year (7,000 hours) of operation. Unplanned scrams result in thermal and hydraulic transients that affect plant systems. This indicator was introduced in 2012.
Contractor Industrial Safety Accident Rate (CISA)The contractor industrial safety accident rate tracks the number of accidents among contractors that result in lost work time, restricted work, or fatalities per 200,000 work-hours (and 1,000,000 hours worked).
Our MissionTo maximise the safety and reliability of nuclear power plants worldwide by working together to assess, benchmark and improve performance through mutual support, exchange of information, and emulation of best practices.
World Association of Nuclear OperatorsWANO LondonLevel 35, 25 Canada SquareCanary WharfLondon, E14 5LQUNITED KINGDOM
www.wano.org & www.wano.info
PerformanceIndicators
W O R L D A S S O C I AT I O N O F N U C L E A R O P E R ATO R S
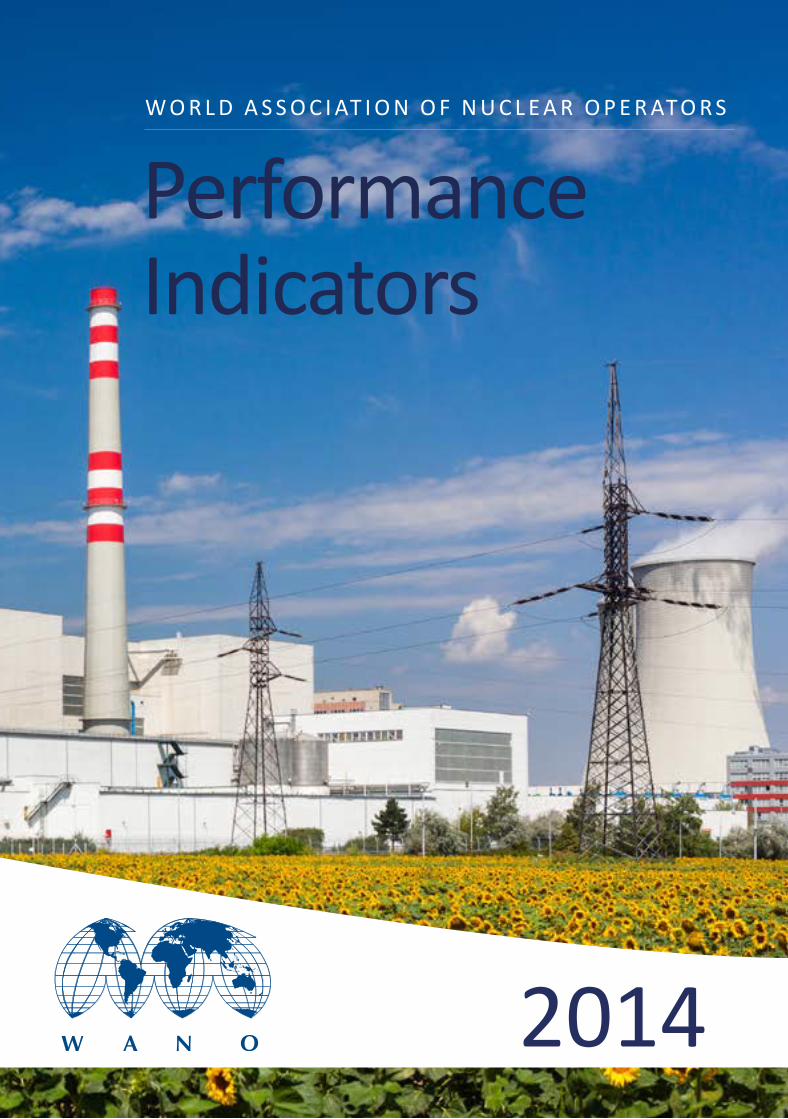
Cover image: Bohunice Nuclear Power Plant
2014
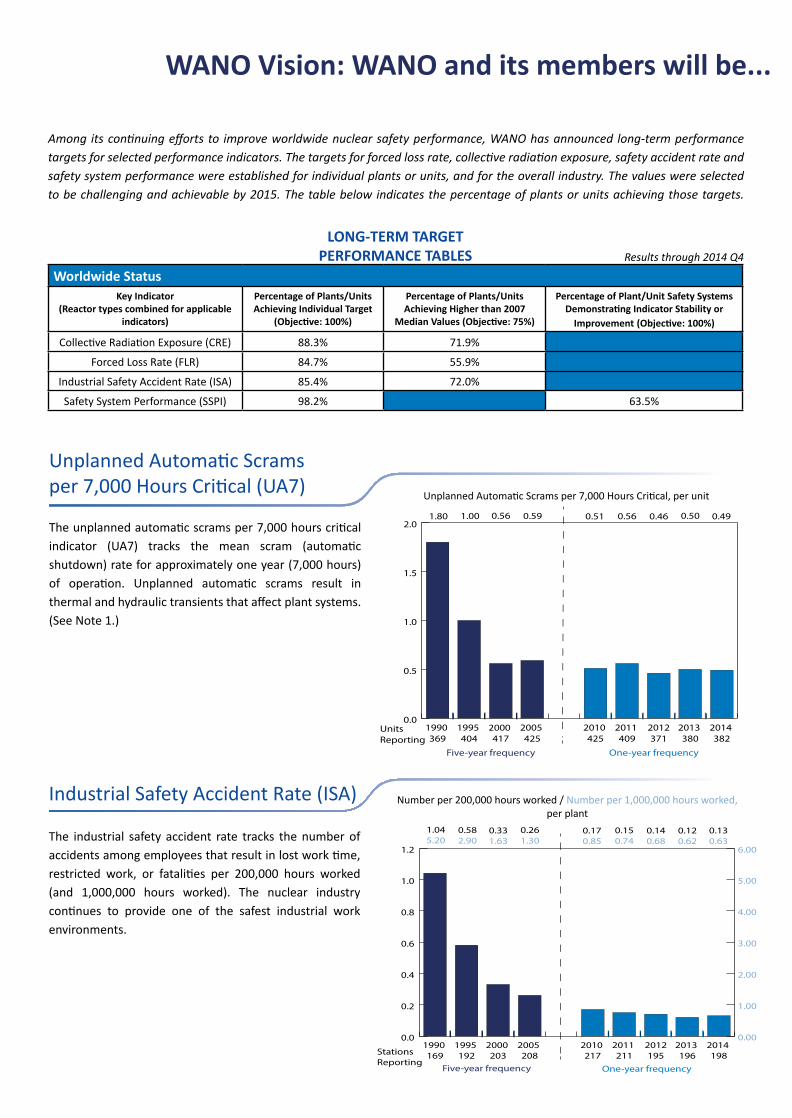
Among its continuing efforts to improve worldwide nuclear safety performance, WANO has announced long-term performance targets for selected performance indicators. The targets for forced loss rate, collective radiation exposure, safety accident rate and safety system performance were established for individual plants or units, and for the overall industry. The values were selected to be challenging and achievable by 2015. The table below indicates the percentage of plants or units achieving those targets.
Worldwide StatusKey Indicator
(Reactor types combined for applicable indicators)
Percentage of Plants/Units Achieving Individual Target
(Objective: 100%)
Percentage of Plants/Units Achieving Higher than 2007
Median Values (Objective: 75%)
Percentage of Plant/Unit Safety Systems Demonstrating Indicator Stability or
Improvement (Objective: 100%)
Collective Radiation Exposure (CRE) 88.3% 71.9%
Forced Loss Rate (FLR) 84.7% 55.9%
Industrial Safety Accident Rate (ISA) 85.4% 72.0%
Safety System Performance (SSPI) 98.2% 63.5%
LONG-TERM TARGETPERFORMANCE TABLES
The industrial safety accident rate tracks the number of accidents among employees that result in lost work time, restricted work, or fatalities per 200,000 hours worked (and 1,000,000 hours worked). The nuclear industry continues to provide one of the safest industrial work environments.
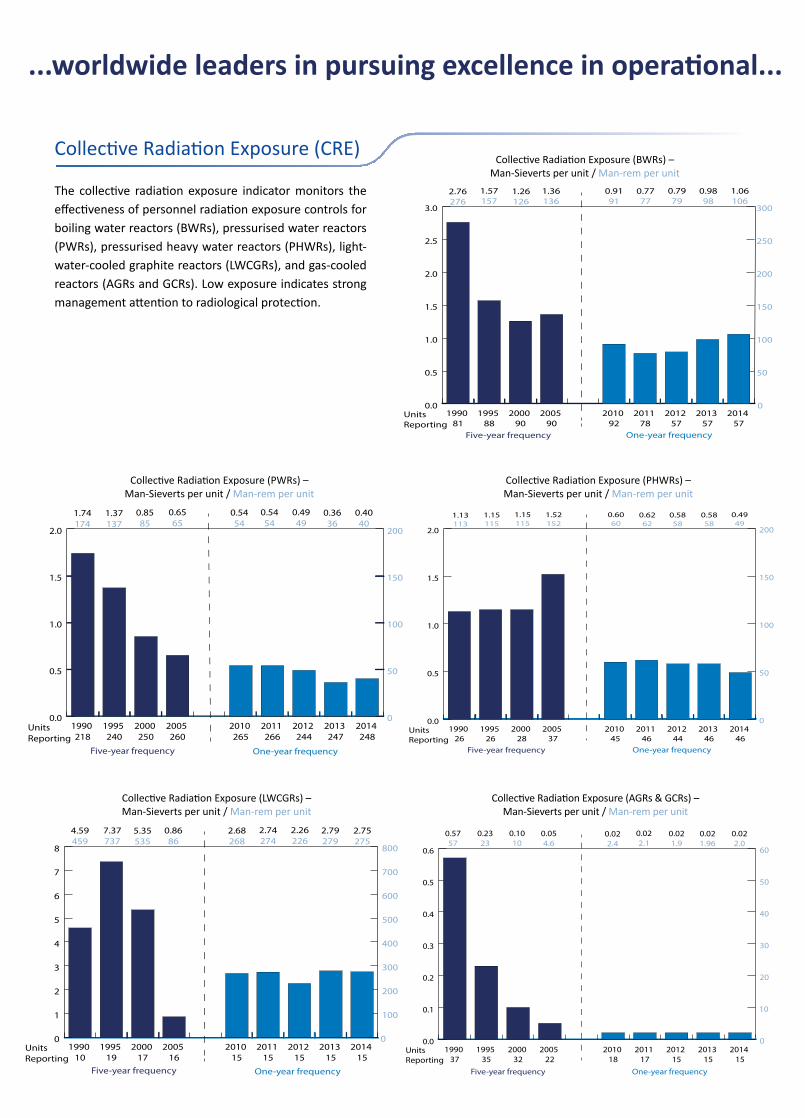
The collective radiation exposure indicator monitors the effectiveness of personnel radiation exposure controls for boiling water reactors (BWRs), pressurised water reactors (PWRs), pressurised heavy water reactors (PHWRs), light-water-cooled graphite reactors (LWCGRs), and gas-cooled reactors (AGRs and GCRs). Low exposure indicates strong management attention to radiological protection.
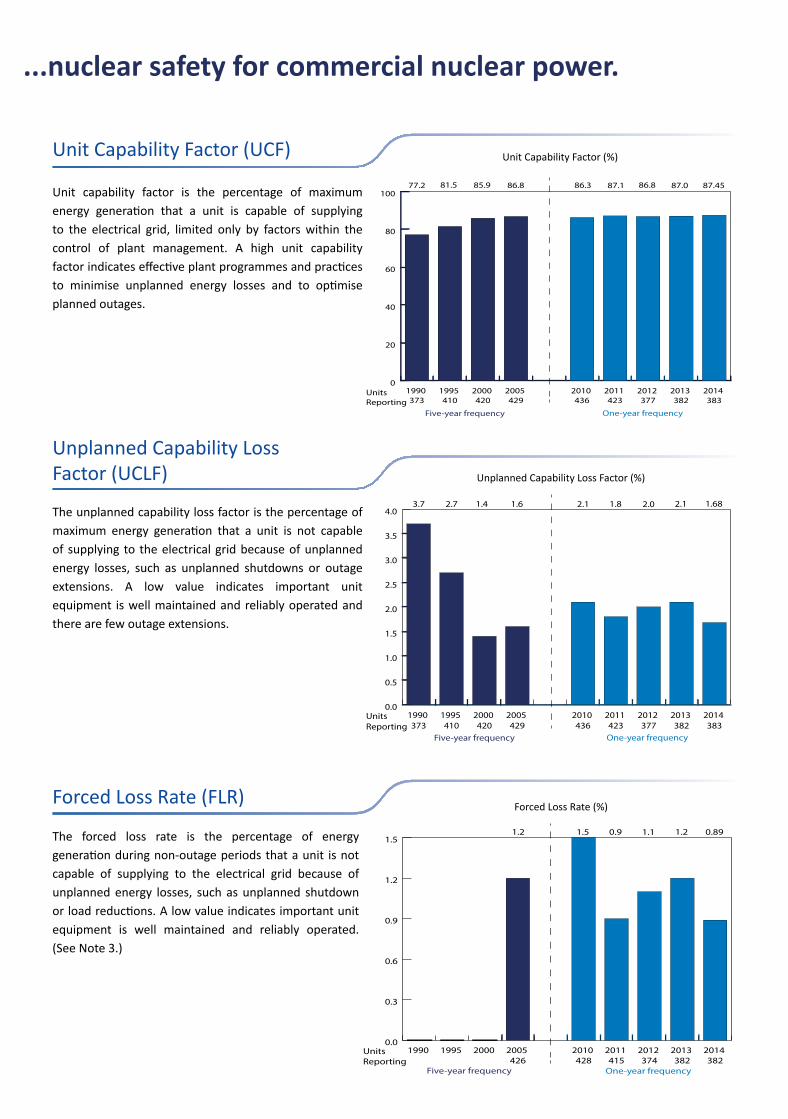
Unit capability factor is the percentage of maximum energy generation that a unit is capable of supplying to the electrical grid, limited only by factors within the control of plant management. A high unit capability factor indicates effective plant programmes and practices to minimise unplanned energy losses and to optimise planned outages.
The unplanned capability loss factor is the percentage of maximum energy generation that a unit is not capable of supplying to the electrical grid because of unplanned energy losses, such as unplanned shutdowns or outage extensions. A low value indicates important unit equipment is well maintained and reliably operated and there are few outage extensions.
The forced loss rate is the percentage of energy generation during non-outage periods that a unit is not capable of supplying to the electrical grid because of unplanned energy losses, such as unplanned shutdown or load reductions. A low value indicates important unit equipment is well maintained and reliably operated. (See Note 3.)
Unplanned Automatic Scramsper 7,000 Hours Critical (UA7)
Industrial Safety Accident Rate (ISA)
Collective Radiation Exposure (CRE) Unit Capability Factor (UCF)
Unplanned Capability Loss Factor (UCLF)
Forced Loss Rate (FLR)
The unplanned automatic scrams per 7,000 hours critical indicator (UA7) tracks the mean scram (automatic shutdown) rate for approximately one year (7,000 hours) of operation. Unplanned automatic scrams result in thermal and hydraulic transients that affect plant systems. (See Note 1.)
Unplanned Automatic Scrams per 7,000 Hours Critical, per unit
Number per 200,000 hours worked / Number per 1,000,000 hours worked, per plant
Collective Radiation Exposure (BWRs) – Man-Sieverts per unit / Man-rem per unit
Collective Radiation Exposure (PWRs) – Man-Sieverts per unit / Man-rem per unit
Collective Radiation Exposure (PHWRs) – Man-Sieverts per unit / Man-rem per unit
Collective Radiation Exposure (AGRs & GCRs) – Man-Sieverts per unit / Man-rem per unit
Collective Radiation Exposure (LWCGRs) – Man-Sieverts per unit / Man-rem per unit
Unit Capability Factor (%)
Unplanned Capability Loss Factor (%)
Forced Loss Rate (%)
0.0
0.5
1.0
1.5
2.0
2014 382
2013 380
2012371
2011 409
2010 425
2005 425
2000 417
1995 404
1990 369
0.51 0.56 0.46 0.50 0.49
One-year frequencyFive-year frequency
Units Reporting
0.590.561.001.80
0.0
0.5
1.0
1.5
2.0
2.5
3.0
2014 57
2013 57
2012 57
2011 78
2010 92
2005 90
2000 90
1995 88
1990 81
0.9191
0.7777
0.7979
0.9898
1.06106
Units Reporting
Five-year frequency One-year frequency
1.36136
1.26126
1.57157
2.76276
0
50
100
150
200
250
300
0.0
0.5
1.0
1.5
2.0
2014 248
2013 247
2012 244
2011 266
2010 265
2005 260
2000 250
1995 240
1990 218
0.5454
0.5454
0.4949
0.3636
0.4040
1.74174
1.37137
0.8585
0.6565
Units Reporting
Five-year frequency One-year frequency
0
50
100
150
200
0
1
2
3
4
5
6
7
8
2014 15
2013 15
2012 15
2011 15
2010 15
2005 16
2000 17
1995 19
1990 10
2.68268
2.74274
2.26226
2.79279
2.75275
0.8686
5.35535
7.37737
4.59459
Units Reporting
Five-year frequency One-year frequency
0
100
200
300
400
500
600
700
800
0.0
0.1
0.2
0.3
0.4
0.5
0.6
2014 15
2013 15
2012 15
2011 17
2010 18
2005 22
2000 32
1995 35
1990 37
0.022.4
0.022.1
0.021.9
0.021.96
0.022.0
0.2323
0.1010
0.054.6
0.5757
Five-year frequency One-year frequency
Units Reporting
0
10
20
30
40
50
60
0.0
0.3
0.6
0.9
1.2
1.5
2014 382
2013 382
2012 374
2011 415
2010 428
2005 426
2000 1995 1990
1.5 0.9 1.1 1.2 0.891.2
Units Reporting
Five-year frequency One-year frequency
0.0
0.5
1.0
1.5
2.0
2014 46
2013 46
2012 44
2011 46
2010 45
2005 37
2000 28
1995 26
1990 26
0.6060
0.6262
0.5858
0.5858
0.4949
1.52152
1.15115
1.15115
1.13113
Units Reporting
Five-year frequency One-year frequency
0
50
100
150
200
0.0
0.5
1.0
1.5
2.0
2.5
3.0
3.5
4.0
2014 383
2013 382
2012 377
2011 423
2010 436
2005 429
2000 420
1995 410
1990 373
2.1 2.12.01.8 1.681.61.42.73.7
Five-year frequency One-year frequency
Units Reporting
0
20
40
60
80
100
2014 383
2013 382
2012 377
2011 423
2010 436
2005 429
2000 420
1995 410
1990 373
86.3 87.1 86.8 87.0 87.4586.885.981.577.2
Units Reporting
Five-year frequency One-year frequency
0.0
0.2
0.4
0.6
0.8
1.0
1.2
2014 198
2013 196
2012195
2011 211
2010 217
2005 208
2000 203
1995 192
1990 169
0.170.85
0.150.74
0.140.68
0.120.62
0.130.63
One-year frequencyFive-year frequency
Stations Reporting
0.261.30
0.331.63
0.582.90
1.045.20
6.00
0.00
1.00
2.00
3.00
4.00
5.00
WANO Vision: WANO and its members will be... ...worldwide leaders in pursuing excellence in operational... ...nuclear safety for commercial nuclear power.
Results through 2014 Q4
Among its continuing efforts to improve worldwide nuclear safety performance, WANO has announced long-term performance targets for selected performance indicators. The targets for forced loss rate, collective radiation exposure, safety accident rate and safety system performance were established for individual plants or units, and for the overall industry. The values were selected to be challenging and achievable by 2015. The table below indicates the percentage of plants or units achieving those targets.
Worldwide StatusKey Indicator
(Reactor types combined for applicable indicators)
Percentage of Plants/Units Achieving Individual Target
(Objective: 100%)
Percentage of Plants/Units Achieving Higher than 2007
Median Values (Objective: 75%)
Percentage of Plant/Unit Safety Systems Demonstrating Indicator Stability or
Improvement (Objective: 100%)
Collective Radiation Exposure (CRE) 88.3% 71.9%
Forced Loss Rate (FLR) 84.7% 55.9%
Industrial Safety Accident Rate (ISA) 85.4% 72.0%
Safety System Performance (SSPI) 98.2% 63.5%
LONG-TERM TARGETPERFORMANCE TABLES
The industrial safety accident rate tracks the number of accidents among employees that result in lost work time, restricted work, or fatalities per 200,000 hours worked (and 1,000,000 hours worked). The nuclear industry continues to provide one of the safest industrial work environments.
The collective radiation exposure indicator monitors the effectiveness of personnel radiation exposure controls for boiling water reactors (BWRs), pressurised water reactors (PWRs), pressurised heavy water reactors (PHWRs), light-water-cooled graphite reactors (LWCGRs), and gas-cooled reactors (AGRs and GCRs). Low exposure indicates strong management attention to radiological protection.
Unit capability factor is the percentage of maximum energy generation that a unit is capable of supplying to the electrical grid, limited only by factors within the control of plant management. A high unit capability factor indicates effective plant programmes and practices to minimise unplanned energy losses and to optimise planned outages.
The unplanned capability loss factor is the percentage of maximum energy generation that a unit is not capable of supplying to the electrical grid because of unplanned energy losses, such as unplanned shutdowns or outage extensions. A low value indicates important unit equipment is well maintained and reliably operated and there are few outage extensions.
The forced loss rate is the percentage of energy generation during non-outage periods that a unit is not capable of supplying to the electrical grid because of unplanned energy losses, such as unplanned shutdown or load reductions. A low value indicates important unit equipment is well maintained and reliably operated. (See Note 3.)
Unplanned Automatic Scramsper 7,000 Hours Critical (UA7)
Industrial Safety Accident Rate (ISA)
Collective Radiation Exposure (CRE) Unit Capability Factor (UCF)
Unplanned Capability Loss Factor (UCLF)
Forced Loss Rate (FLR)
The unplanned automatic scrams per 7,000 hours critical indicator (UA7) tracks the mean scram (automatic shutdown) rate for approximately one year (7,000 hours) of operation. Unplanned automatic scrams result in thermal and hydraulic transients that affect plant systems. (See Note 1.)
Unplanned Automatic Scrams per 7,000 Hours Critical, per unit
Number per 200,000 hours worked / Number per 1,000,000 hours worked, per plant
Collective Radiation Exposure (BWRs) – Man-Sieverts per unit / Man-rem per unit
Collective Radiation Exposure (PWRs) – Man-Sieverts per unit / Man-rem per unit
Collective Radiation Exposure (PHWRs) – Man-Sieverts per unit / Man-rem per unit
Collective Radiation Exposure (AGRs & GCRs) – Man-Sieverts per unit / Man-rem per unit
Collective Radiation Exposure (LWCGRs) – Man-Sieverts per unit / Man-rem per unit
Unit Capability Factor (%)
Unplanned Capability Loss Factor (%)
Forced Loss Rate (%)
0.0
0.5
1.0
1.5
2.0
2014 382
2013 380
2012371
2011 409
2010 425
2005 425
2000 417
1995 404
1990 369
0.51 0.56 0.46 0.50 0.49
One-year frequencyFive-year frequency
Units Reporting
0.590.561.001.80
0.0
0.5
1.0
1.5
2.0
2.5
3.0
2014 57
2013 57
2012 57
2011 78
2010 92
2005 90
2000 90
1995 88
1990 81
0.9191
0.7777
0.7979
0.9898
1.06106
Units Reporting
Five-year frequency One-year frequency
1.36136
1.26126
1.57157
2.76276
0
50
100
150
200
250
300
0.0
0.5
1.0
1.5
2.0
2014 248
2013 247
2012 244
2011 266
2010 265
2005 260
2000 250
1995 240
1990 218
0.5454
0.5454
0.4949
0.3636
0.4040
1.74174
1.37137
0.8585
0.6565
Units Reporting
Five-year frequency One-year frequency
0
50
100
150
200
0
1
2
3
4
5
6
7
8
2014 15
2013 15
2012 15
2011 15
2010 15
2005 16
2000 17
1995 19
1990 10
2.68268
2.74274
2.26226
2.79279
2.75275
0.8686
5.35535
7.37737
4.59459
Units Reporting
Five-year frequency One-year frequency
0
100
200
300
400
500
600
700
800
0.0
0.1
0.2
0.3
0.4
0.5
0.6
2014 15
2013 15
2012 15
2011 17
2010 18
2005 22
2000 32
1995 35
1990 37
0.022.4
0.022.1
0.021.9
0.021.96
0.022.0
0.2323
0.1010
0.054.6
0.5757
Five-year frequency One-year frequency
Units Reporting
0
10
20
30
40
50
60
0.0
0.3
0.6
0.9
1.2
1.5
2014 382
2013 382
2012 374
2011 415
2010 428
2005 426
2000 1995 1990
1.5 0.9 1.1 1.2 0.891.2
Units Reporting
Five-year frequency One-year frequency
0.0
0.5
1.0
1.5
2.0
2014 46
2013 46
2012 44
2011 46
2010 45
2005 37
2000 28
1995 26
1990 26
0.6060
0.6262
0.5858
0.5858
0.4949
1.52152
1.15115
1.15115
1.13113
Units Reporting
Five-year frequency One-year frequency
0
50
100
150
200
0.0
0.5
1.0
1.5
2.0
2.5
3.0
3.5
4.0
2014 383
2013 382
2012 377
2011 423
2010 436
2005 429
2000 420
1995 410
1990 373
2.1 2.12.01.8 1.681.61.42.73.7
Five-year frequency One-year frequency
Units Reporting
0
20
40
60
80
100
2014 383
2013 382
2012 377
2011 423
2010 436
2005 429
2000 420
1995 410
1990 373
86.3 87.1 86.8 87.0 87.4586.885.981.577.2
Units Reporting
Five-year frequency One-year frequency
0.0
0.2
0.4
0.6
0.8
1.0
1.2
2014 198
2013 196
2012195
2011 211
2010 217
2005 208
2000 203
1995 192
1990 169
0.170.85
0.150.74
0.140.68
0.120.62
0.130.63
One-year frequencyFive-year frequency
Stations Reporting
0.261.30
0.331.63
0.582.90
1.045.20
6.00
0.00
1.00
2.00
3.00
4.00
5.00
WANO Vision: WANO and its members will be... ...worldwide leaders in pursuing excellence in operational... ...nuclear safety for commercial nuclear power.
Results through 2014 Q4
WANO monitors six additional performance indicators: safety system performance, chemistry performance, fuel reliability, grid-related loss factor, unplanned total scrams per 7,000 hours critical and contractor industrial safety accident rate. The first three indicators are defined in a manner that reflects differences in plant-specific designs, configurations, or operational practices. As a result, data for these three indicators cannot be summarised across reactor types for inclusion in this report. Additionally, grid-related loss factor is out of plant management control. Contractor industrial safety accident rate and unplanned total scrams per 7,000 hours critical are not plotted because data has not been collected for these indicators long enough to show a significant trend over time. These indicators are available to WANO members in more detailed reports on the WANO member website.
Safety System Performance (SSPI)The safety system performance indicator monitors the availability of three important standby safety systems at each plant. Safety systems that are maintained in a high state of readiness have a high probability of being capable of mitigating off-normal events.
Chemistry Performance (CPI)The chemistry performance indicator provides an indication of progress in controlling chemical parameters to retard deterioration of key plant materials and components. These parameters are to be maintained within strict guidance developed by the industry.
Fuel Reliability (FRI)The fuel reliability indicator monitors progress in preventing defects in the metal cladding that surrounds fuel. Maintenance of fuel cladding integrity reduces radiological impact on plant operations and maintenance activities.
The WANO Performance Indicator Programme supports the exchange of operating experience information by collecting, trending and disseminating nuclear plant performance data in 12 key areas. The data is gathered for a set of quantitative indicators of plant performance. These indicators are intended principally for use as a management tool by nuclear operating organisations to monitor their own performance and progress, to set their own challenging goals for improvement, and to gain additional perspective on performance relative to that of other plants.
It is now widely recognised that a good set of overall performance indicators can provide a partial, but important and useful, measure of how well a nuclear plant is managed overall.
WANO published and distributed the first performance indicator report in April 1991. In 1993, reporting of data began for all reactor designs. Currently, more than 98% of the operating nuclear power plants report all indicators.
It is expected that the use of WANO performance indicators will encourage emulation of the best industry performance. It should also further motivate the identification and exchange of good practices in nuclear plant operations.
Notes: 1. The median values are displayed for all indicators except unplanned automatic scrams per 7,000 hours critical (UA7), where
the mean values are shown, and industrial safety accident rate, which is an overall industry value.
2. Half of the values are above and half are below the displayed median values. The mean is the arithmetical average of thevalues. The median value is normally displayed rather than the mean value because the median value is less susceptible toinfluence of outliers and is therefore more representative of overall performance.
3. Worldwide collection of data needed to calculate the forced loss rate indicator did not begin until 2001.
4. Charts are based on performance indicator results obtained 24 March 2015.
Grid-Related Loss Factor (GRLF)The grid-related loss factor is the percentage of maximum energy generation that a plant could not supply due to grid issues not under plant management control.
Unplanned Total Scrams per 7,000 Hours Critical (US7)The unplanned total scrams per 7,000 hours critical monitors the number of unplanned reactor shutdowns for approximately one year (7,000 hours) of operation. Unplanned scrams result in thermal and hydraulic transients that affect plant systems. This indicator was introduced in 2012.
Contractor Industrial Safety Accident Rate (CISA)The contractor industrial safety accident rate tracks the number of accidents among contractors that result in lost work time, restricted work, or fatalities per 200,000 work-hours (and 1,000,000 hours worked).
Our MissionTo maximise the safety and reliability of nuclear power plants worldwide by working together to assess, benchmark and improve performance through mutual support, exchange of information, and emulation of best practices.
World Association of Nuclear OperatorsWANO LondonLevel 35, 25 Canada SquareCanary WharfLondon, E14 5LQUNITED KINGDOM
www.wano.org & www.wano.info
PerformanceIndicators
W O R L D A S S O C I AT I O N O F N U C L E A R O P E R ATO R S
Cover image: Bohunice Nuclear Power Plant
2014