Embed Size (px)
Citation preview

Ups-,22/2
POLICY RESEARCH WORKING PAPER 2212
Is African Manufacturing Continued efforts to develophigh-level industrial skills in
Skill-Constrained? Sub-Saharan African countries
may be wasteful without
Howard Pack a more competitiveenvironment in the industrial
Cbri'stina Paxsonsector. But lack of such skills
may limit the benefits to the
industrial sector from future
liberalization. As a result, the
supply response to improved
incentives may be weak
The World Bank
Development Research Group
Public EconomicsOctober 1999H
Pub
lic D
iscl
osur
e A
utho
rized
Pub
lic D
iscl
osur
e A
utho
rized
Pub
lic D
iscl
osur
e A
utho
rized
Pub
lic D
iscl
osur
e A
utho
rized
POLICY RESEARCH WORKING PAPER 2212
Summary findings
Total factor productivity has been low in most of Sub- technology - local skills could contribute significantly
Saharan Africa. It is often said that the binding constraint more in raising output.on African industrial development is the inadequate The experience of other countries also suggests that assupply of technologically capable workers. And many the economy opens to flows of international knowledgecross-country studies imply that the low level of human - whether through technology transfers or throughcapital in Africa is an important source of low growth in informal transfers from purchasers of exports - theper capita income. technological capacity of local industry becomes
The results of Pack and Paxson's study do not important.necessarily conflict with this view. They indicate that in The policy implications of this analysis are clear:noncompetitive industrial sectors with little inflow of Without the prospect of a more competitivenew technology, the contribution of technological environment, continued efforts to develop high-levelabilities, however it is measured, is limited. industrial skills may be wasteful. But the absence of such
If liberalization of the economy generated greater skills may limit the benefits to the industrial sector fromcompetition, or if export growth were accelerated - future liberalization, as a result of which the supplypermitting the import of inputs embodying new response to improved incentives may be weak.
This paper - a product of Public Economics, Development Research Group - is part of a larger effort in the group toanalyze the effect of public policies on industrial productivity. Copies of the paper are available free from the World Bank,1818 H Street NW, Washington, DC 20433. Please contact Hedy Sladovich, room MC2-609, telephone 202-473-7698,fax 202-522-1154, Internet address [email protected]. Policy Research Working Papers are also posted on theWeb athttp://wblnOO18.worldbank.org/research/workpapers.nsf/policyresearch?openform. The authorsmaybe contactedat [email protected] or [email protected]. October 1999. (19 pages)
IThe Policy Research Working Paper Series dissebyinates the findings of work in progress to encourage the excharge of ideas aboutdevelopment issues. An objective of the series is to get the finidings out quickly, even if the presentations are less than fully polisbed. Thepapers carry the names of the auithors and shouild be cited accordingly. The findings, iinterpretations, and conclusions expressed in this
paper are entirely those of the authors. They do not necessarily represent the view of the World Bank, its Executive Directors, or the|countries they represent.
Produced by the Policy Research Dissemination Center
Is African Manufacturing Skill Constrained?
Howard Pack*
Christina Paxson**
The findings, interpretations, and conclusions expressed in this paper are entirely those ofthe authors. They do not necessarily represent the views of the World Bank, its ExecutiveDirectors, or the countries they represent. The paper should not be cited without thepermission of the authors. We are grateful to Tyler Biggs of the Africa TechnicalDepartment of the World Bank for making available the data upon which this paper isbased. We received helpful comments from participants at a symposium at the EindhovenTechnical University. A. Szirmai provided many helpful suggestions.
* Development Research Group at the World Bank and University of Pennsylvania.** Princeton University.


1. Introduction
In most of the Sub-Saharan African economies neither the levels of total factorproductivity (TFP), nor the growth rates of TFP in manufacturing have been high. Allstudies of cross-country performance find that the Sub-Saharan African economies are thelargest bloc of nations that have not converged on the United States. Most of theintercountry explanations have focused on easily measured aggregate variables such as theratio of investment to GDP, education levels, and in some models, proxies for politicalstability (Barro and Lee 1993 and Easterly 1993). These models have as their underlyingtheoretical framework a view that the national economy can be modeled with a set ofmultiplicative inputs-an increase in the right-hand side variables such as the investmentrate or education level will produce an increase in growth rates. However, as isincreasingly recognized, including many authors of papers on convergence, the particularspecification of the implied production function is open to question and the right-hand sidevariables may themselves be endogenous. Moreover, in the case of the African nations,close observers question whether a simple increase in investment rates will generate theimpact implied by the cross country regressions-many countries have experiencedgrowing marginal capital-output ratios over the last two decades (Husain 1993).
There are two divergent though complementary views of the lack of productivitygrowth in Sub-Saharan Africa.! The first holds that pervasive government interventionimposes large costs on individual firms and reduces incentives to become efficient (Collierand Gunning 1999). It is not only protection from foreign competition that has such effectsbut also problems stemming from bad macroeconomic policies such as highly variable realexchange rates which make long-term planning difficult for firms. A second interpretationfocuses on the paucity of technological competence as measured by the small supply of
2trained managers and engineers. This paper examines the determinants of manufacturingproductivity and the role of education and technology variables at the level of individualfirms. A major implication of our results is that, ceteris paribus, it is unlikely that anincrease in education levels will have much impact on manufacturing TFP levels. Wesuggest a more complex view of the role of education, emphasizing that in the absence oftechnology inflows, higher skills may have very low productivity.
Using the results of surveys of industrial firms in Ghana, Kenya, and Zimbabwe,we consider the connection between technological abilities and productivity in the threenations. Section 2 sets out the determinants of productivity. Section 3 provides someaggregate measures of factors that may affect productivity in the three economies inquestion. Section 4 presents empirical results for the analysis of the determinants ofproductivity in a large group of firms in the three countries. Section 5 offers aninterpretation of the results. Section 6 concludes.
l Meier and Steel (1989) contains a good selection of representative views.2 For a general discussion of the technological requirements for industrial development see Lall
(1990). Pack (1993) provides an overview of industrial development in Africa and extensive references to theliterature.
I

2. The Determinants of Productivity Levels
While economy-wide and sectoral shortages of human capital are widely assumedto limit efficient industrial development, there is little empirical evidence on whether thisis indeed the case in individual African firms. The presence of trained and experiencedmanagers and workers does not guarantee high firmn productivity for several reasons. First,individuals with formal credentials may not possess the cognitive skills necessary toimprove TFP. Second, if there is limited rivalry, firms may view investment in cost-reducing efforts as not being necessary to remain competitive. Third, an industry'sorganization such as vertical integration between manufacturers and retailers may result inlow productivity if, for example, each firm produces a large range of products, theprofitability of firms being guaranteed by protection from imported goods. Hence, thefrequently drawn policy conclusion of the need for higher levels of education and trainingbased on the assumed shortages of skilled manpower may be unwarranted.
In theory technological abilities are important for cost reduction in industrial firms,facilitating learning-by-doing. The simplest interpretation of pure learning-by-doingenvisions a manual worker tightening a bolt in forty percent less time the hundredth timeshe does it as compared to the first time. But a complete specification of "pure" learning bydoing would recognize that there is usually an ongoing reorganization of the flow of work,the design or distribution of improved machinery, and additional training. Thus, even inthe simplest case of learning-by-doing, one would expect that the presence of moreeducated or trained supervisors and production workers will facilitate realization of greaterTFP growth. However, there is little empirical support even in industrialized countriesestablishing a close relation between technological abilities and cost reduction forindustrial firms.3
By itself, the purchase of modem equipment does not guarantee that high TFP willbe realized with such machinery-many complementary firm-level actions are required.Production engineering must be mastered, the flow of intermediate inputs to the plant andspare parts must be arranged, workers must be trained, and marketing must be enhanced sothat it is not necessary to produce short production runs to order and incur excessive set upcosts. Education, vocational training, foreign training, firm-level research anddevelopment, expenditures on technology licenses, and the nationality of owners may allaffect the ability of firms to master the software of technology and are thus importantdeterminants of firm-level productivity.
The economic environment established by macro- and microeconomic policies willalso impinge on the firm and discourage or partly offset positive efforts at the firm level.Difficulty in obtaining raw and intermediate inputs of a given quality due to exchangecontrols, erratic supply of public services such as electricity, the incentive provided byimport restrictions to expand the range of products, and the general absence of incentivesto improve productivity all affect firm-level performance. For any given set of firms theimpact of the economic environment and firm-level factors jointly determine productivity.
3For studies demonstrating the interaction of education and technological change in agriculture seeWelch (1970), Rosenzweig (1995), Foster, Rosenzweig, et al. (1995), and Foster and Rosenzweig (1995).
2
Assuming that all firms within a given industry face the same economic environment, it ispossible to test whether firm technological abilities affect TFP or its mirror image, unitcosts.
There are two alternate views of the role of education and technology in theproduction function. The first views them as multiplicative inputs in a standard productionfunction. Thus, if a production function is estimated, elasticities of output with respect totechnology inputs can be calculated. A second view that we believe is more useful (Nelsonand Phelps 1966) argues that education will have its greatest impact when there is rapidtechnological change. If the basic technology (a loom used in weaving) is largelyunchanged over time, the production process becomes routine and the ability to deal withchange is not germane - high education results in only limited productivity gains. Incontrast, where technology is rapidly evolving, learning about the existence of newprocesses, learning to use them when they are deployed, and staying abreast of newdevelopments requires the adaptability provided by formal education.
The preceding can be formalized following a model of Nelson and Phelps (1966).Firms in developing countries (DCs) operate with a technology level equal to A(t) in periodt. Their peers in industrial countries (IC) operate technology T(t). The rate at which the ICtechnology is introduced into the DC depends on the level of human capital, h, and is
(1) A'(t) / A (t) = a (h) [ A) (t)
The extent to which local DC technology improves is a positive function, a'(h) > 0of the level of human capital and proportional to the magnitude of the differential betweencurrent and "best practice" technology. As the technology T(t) does not have to beinvented, the potential productivity gain from the transfer of this technology is the benefitof relative backwardness (Gerschenkron 1962). Assume that the IC technology improveseach year by p percent so that
(2) T(t) = T-e .
Given (1) and (2), the underlying differential equation implies that the potentialequilibrium path of technology of a DC firm is
(3) A(t) = [a(h) /(a(h) + (p)]TOe-
The potential level of technology realized by an DC firm at a moment in time willthus be higher: (1) the greater its ability to deal with new technologies as a result of thepresence of qualified individuals on its staff; (2) the larger the inflow of technology to thefirm in the form of new equipment, new material inputs, new knowledge obtained fromconsultants, licensors, and foreign owners. The potential level of technology characterizinga firm will evolve along (3) and depends solely its own level of h and the rate of technicalprogress in the ICs that becomes available to the DC firm. If foreign exchange shortages orarbitrary rules prohibiting some forms of technology imports reduce the inflow of newknowledge, the benefit conferred by h is reduced. This might stem, for example, from
3
regulations that limit expenditures on technology licensing payments so that a firm cannot
purchase a potentially useful technology, implying that (PF<(P where (PF represents thelower rate of technology inflow. Thus (3) can be rewritten as
(4) .(t) = [a(h) /(a(t) + pF )]Toe`.
Equation (4) underlines the fact that, at a given point in time, the level of productivity A(t)for a given firm may be weakly associated with h unless firms' ability to obtain newtechnology varies systematically with h. Unlike formulations which treat education orpurchases of knowledge as conventional inputs in the production function, (4) implies thathuman capital will have no effect on the level of output obtained with conventional inputsunless (PF>O which can only occur if new productive inputs are introduced.
Schultz (1975) argued that in addition to the ability to absorb new technology,education would be important if there were a changing sectoral structure or internalproduct mix of firms, more highly educated workers being better at reallocating factors,exploring new profitable opportunities, and securing markets. Changing sectoral structureand internal product mix in turn reflect growth in per capita income in the internal marketcombined with different Engel elasticities and changes in the net trade balance inindividual commodities. If sectors are not changing, it is likely that product mix within asector is also stable, putting little premium on the ability to cope with change.
3. Aggregate Evidence on Technology
The payoff to education depends in the above view on two measurable magnitudes:(1) the inflow of imported machinery and industrial intermediate inputs that may embodynew technology and (2) the sectoral structure of production. To measure the first Table Ishows the rate of growth of all imports of goods and services, in constant prices, for thethree African countries as well as the Republic of Korea and Malaysia, two Asian countriesthat are widely viewed as having benefited from the inflow of technology. The second ismeasured by the change in the split between light and heavy industry and the standarddeviation of the percentage change in sectoral shares of value added.4
In the period 1980-93, the three African economies exhibited a negative or veryslow growth of all imports, reflecting their inability to earn foreign exchange throughexporting and the limited inflow of concessional aid. Kenya, for example, experienced adecline in constant price imports of 0.8 percent per year over the period. As the share ofmachinery and transport equipment and other manufactured inputs in total imports wasroughly constant over the 1985-93 period, the absolute level of imports that could embodynew technology declined.5 In Ghana and Zimbabwe there were significant declines in the
4 An alternate measure is provided by Szirmai and Tinumer (1997) which measures the similarity ofthe two value added structures. Calculations using their method provide roughly similar qualitative results.
The measures described in the text and shown in Table 1 could be improved. For example,standard intemational trade data contained in the U.N. Yearbook of International Trade Statistics allows a
4

Table 1. Imports of Goods Embodying New TechnologyShare of machinery and
Growth rate of transport equipment in total Share of other manufacturedCountiy imports imports imports in total imports
1980-93 1985 1993 1985 1993
Kenya -0.8 23 25 28 29Ghana 2.7 40 26 28 31Zimbabwe 0.2 65 36 26 31Korea 11.4 34 34 23 29Malaysia 9.7 46 54 28 30
Source: World Development Report, various issues.
share of imported equipment with only slight growth of exports, thus a significant declinein the level of imported capital goods occurred. The figures also suggest that, at most, amodest increase occurred in manufactured intermediate inputs. In contrast, in Korea andMalaysia, two newly industrializing countries (NICs) in which the level of education iswidely perceived to have been an important contributor to industrial growth, the level ofimports was rising very rapidly, reflecting the growth in export earnings, and the share ofthe two technology embodying inputs was constant or increasing, implying potential forsignificant returns from the ability to effectively utilize the new technology component ofthese imports.
There was also a dramatic change in sectoral structure in the Asian NICs comparedto the sectoral stagnation of the Afirican nations. Table 2 shows the distribution ofmanufacturing value added among light and heavy manufacturing for the five countries inquestion and an index of structural change given by the standard deviation of thepercentage change between 1980 and 1990 in value added, calculated over all three digitindustrial sectors. As can be seen, both the sectoral distribution between heavy and lightand the summary standard deviation measure, show that the three African economies haveexperienced relatively little change in the structure of sectoral production, a phenomenonalso replicated at the firm level. The firms in our sample manufacture relatively simpleproducts and it is unlikely that the internal product mix of firms has changed much. Indeed,many of the items produced by the larger firms are not that different from those fabricatedin the informal sector.
disaggregated breakdown of imports that would allow more precision with respect to the both equipment andintermediate imports. However, the latest date for which these are available for the African econornies is1990, two years before the firm-level surveys were carried out. Thus we have cited the aggregate datagenerated by the World Bank.
6 The greater summary measure in Zimbabwe compared to Ghana and Kenya is largely due to theexpansion in the share of the beverage sector, a branch in which the technology employed has not changed.
5

Table 2. Sectoral Distribution of Value Added in ManufacturingGhana Kenya Zimbabwe Korea Malaysia
1980 1990 1980 1990 1980 1990 1980 1990 1980 1990
Light industry 57.8 59.9 52.7 55.2 49.3 53.3 41.5 29.6 47.8 30.8
Heavy mdustry 42.2 40.1 47.2 45.1 50.7 46.7 58.5 70.4 52.2 69.2
SDofthe% 1.58 1.25 2.05 2.18 2.98change
Source: IJNIDO (1993).
These results suggest that unless some firms were able to deviate from the overallpattern of stagnation of new inputs, it would be surprising if firms with higher technicalskills realized greater levels of productivity.
4. Empirical Results at the Firm Level
A. The data
We analyze the relationship between skills and production costs using firm-leveldata from three African countries, Kenya, Zimbabwe, and Ghana. The survey data werecollected in 1993 (for Kenya and Zimbabwe) and 1992 (for Ghana) by the RegionalProgram on Enterprise Development of the World Bank. Although the data are by nowpanel data, with up to three years of infornation for each firm, only the first year of datawas available for this study. The surveys for each country used similar questionnaires andsampling procedures. All collect information on the value of output, production costs, theskill level of the owners and managers in each firm, and each firm's involvement in foreignmarkets, such as raw material imports, exports, and foreign ownership.
The Kenyan data are drawn from a survey of 223 manufacturing firms. The originalsample consists of 162 formal sector firms drawn from the Central Bureau of Statisticsregister of firms, and 61 informal (i.e., nonregistered) firms. Four sectors are represented:food processing, textiles and garments, woodworking, and metalworking. The sample isstratified by sector and (for formal firms) by firm size. Detailed information on the surveydesign and the procedures used to compute sampling weights are in World Bank (1993b).Although the descriptive statistics presented below make use of data on all 223 firms, wehad to exclude 51 firms when estimating cost functions, because of missing or incompletedata on costs, output, capital values, and other variables used in the analysis.
In Zimbabwe, 201 firms were surveyed in the summer of 1993. The firms wereselected from two sources. Large firms, with 50 or more employees, were drawn from aFirmn Registration List provided by the Central Statistical Office. Smaller firms weredrawn from a list compiled by the Gemini Survey of small-scale firrns, conducted in 1991.(See World Bank 1994 for further details on the sample design and the sample weighting
6

procedure.) We use data on 200 finns (one firm had no sector information and wasexcluded), and lose an additional 30 firms for the estimates of cost functions due tomissing data.
The sample from Ghana consisted of 186 firms surveyed in the summer of 1992.The sample design is described in World Bank (1993c). The design of the survey appearsto have been complicated by the fact that two Censuses, an Industrial Census and aPopulation Census, yield inconsistent information on the numbers of small-scaleenterprises (World Bank 1993c, p. 28.) Because of this ambiguity, we do not use surveyweights, the number of firms in each category, in calculating the summary statistics thatfollow but the means of all firms. It is thus possible that our sample statistics may notaccurately reflect the characteristics of the population of firms in Ghana.
The fmns in the Ghanaian sample tend to be smaller than the firms in Zimbabweand Kenya. Furthermore, there is no simple definition of "formal" versus "informnal" firmsas there is for the other two countries. In what follows, we sometimes split the Ghanaiansample between "large" firms, defined as those with 10 or more employees (as opposed tomore than 50 employees for Zimbabwean formal-sector firms), and small firms. TheGhanaian data also have a larger fraction of missing values than the other two surveys. Ofthe original 186 firms, only 132 can be used to estimate cost functions. Valuation of thecapital stock of firms appears to have been a particular problem in Ghana, and so we do notinclude capital stock in the cost functions: doing so would have resulted in losing 19 morefirms. The results for Ghana should be treated with extra caution, because of the smallsample and the selection problems that may result from missing dependent variables.
B. Descriptive information on the firms
The majority of firms are engaged in producing fairly simple products. In all threecountries the modal product of firms in the food sector is breadmaking. Garments andwooden household furmiture are the modal responses for the textile and woodworkingsectors. The metal sectors in each of the three countries are somewhat more diverse,although the majority of sampled firms report metal doors, windows, gates and burglarbars as their primary products. The picture does not change much in Kenya and Zimbabwewhen sample weights are used to calculate the percentage of firms in the population (andlabor shares) in each activity.7
Most of the firms in each of the countries are sole proprietorships, partnerships, orlimited liability enterprises, and for almost all of these firms a person identified as "the
7 It should be noted that the use of sample weights together with small sample sizes can yield amisleading picture of the activities of these firms. For example, the Kenyan numbers indicate that 58.7percent of wood-sector workers are in the "miscellaneous" category that includes "carvings, campingequipment, and automobile trim." This is due to one 70-person firm that makes camping equipment, andwhich was given a sample weight 4 times the sector average. Likewise, the result that 41 percent of food andbeverage workers make animal feed and hay is due to I poultry-feed firm with 420 workers and a sampleweight 3 times the sector average.
7

owner"i was administered a survey about his education, experience, and personalbackground. Owners in each country were asked about the highest educational levelobtained, and were also asked if they had additional vocational, technical, or (for Kenyaand Ghana) professional training. In each country the majority of surveyed owners had atleast some secondary education, and one-third to one-half of these had extra training aswell. Without reliable data on the distribution of skills in the populations of each of thesecountries it is impossible to tell if owners of manufacturing firms have better-than-averageskills. Data from the Ghanaian Living Standards Measurement Study, conducted in 1988and 1989, indicate that average years of schooling among people aged 15 to 55 was sixyears (Jolliffe 1995), with a lower average for people in older age groups, so it is likelythat owners of manufacturing firms have better-than-average skills than the workingpopulation.
Owners may hire managers with skills that exceed their own, in which case theappropriate measure of skill for the firm may be that of the manager rather than the owner.Tables 3a, 3b, and 3c tabulate the education levels of "general managers" and "productionmanagers" for fimns that indicate that they have a manager of either type. The distributionof education among managers is not too dissimilar from the distribution among owners,although a higher fraction of managers have attended a university. However, this does notimply that owners hire managers who are more educated than themselves, and may reflectthe fact that it is larger firms with more educated owners that hire managers. Among firmsthat have both owners and managers present, there is a high correlation between the skilllevels of the two.8 The survey also asks about the average education levels of "managerialemployees." Tabulations of these for Kenya and Ghana are shown in Table 4 (the resultsfor Zimbabwe were miscoded and cannot be used), and these indicate that the majority ofmanagerial employees have attended secondary school, and roughly a quarter of thesampled firms with managerial employees list the average education level of theirmanagers at the university level. In the cost functions presented below we use a variety ofskill measures that reflect the education levels of both owners and managers.
Table 3a. Kenya: Distribution of Managers' EducationGeneral manager (N=1 IO) Production manager (N=58)
None 2 0.1% 1 15.2%Primary 8 33.4% 3 1.2%Secondary 47 40.2% 25 57.7%University - nontechnical 25 3.4% 5 1.4%University - technical 21 17.8% 21 23.8%Post-graduate (Kenya) 3 0.3% 1 0.3%Post-graduate (abroad) 4 4.9% 2 0.5%
Note: Percentages are calculated using survey weights based on number of firms sampled.
8 The survey does not ask whether the owner and manager are the same person, and this mightaccount for the similarity between the education of owners and managers.
8

Table 3b. Zimbabwe: Distribution of Managers' EducationGeneral manager (N=190) Production manager (N=108)
None 3 2.4% 1 0.9%Primary 27 42.4% 16 14.8%Secondary 86 47.1% 49 45.4%University - nontechnical 31 3.7% 10 9.3%University - technical 31 2.7% 27 25.0%Post-graduate (local) 2 0.1% 3 2.8%Post-graduate (abroad) 10 1.7% 2 1.9%
Note: Percentages are calculated using survey weights.
Table 3c. Ghana: Distribution of Managers' EducationGeneral manager (N=46) Production manager (N=SI)
None 4 8.5% 0 0.0%Primary 4 8.5% 3 5.9%Secondary 10 21.2% 11 21.6%University - nontechnical 7 14.9% 2 3.9%University- technical 18 38.3% 28 54.9%Post-graduate (local) 1 2.1% 1 2.0%Post-graduate (abroad) 3 6.4% 6 11.8%
Note: Percentages are calculated as means.
Table 4. Average Education of Managerial Employees (126 firms)Education level Total Vocational Technical Professional
Kenya (126 firms)None 1 0.2% 0 0.0% 0 0.0% 0 0.0%Primary 8 14.2% 0 0.0% 2 8.0% 0 0.0%Secondary 82 74.2% 7 6.4% 8 14.3% 11 1.5%University 35 11.4% 1 0.0% 0 0.0% 9 1.6%Ghana (64 fmns)
None 2 3.1% 0 0.0% 0 0.0% 0 0.0%Primary 1 1.6% 0 0.0% 0 0.0% 0 0.0%Secondary 45 70.3% 4 6.2% 8 12.5% 14 21.9%University 16 25.0% 0 0.0% 0 0.0% 2 3.1%
Note: Numbers indicate numbers of sampled firms. For Kenya, the percentages are calculated using weightsprovided by the survey. The data from Ghana are unweighted.
We have no direct measures of the rate at which different firns acquire newtechnology (i.e., the term PF in equation 4). However, it is likely that the acquisition of newtechnology from abroad is positively correlated with activities in foreign markets, andTable 5 presents information on these activities. The predominant picture is of firms thathave little involvement in international markets. The vast majority of all firms import noneof their raw materials, export none of their output, and do not have any foreign ownership.The firms were also asked about the use of foreign technology licenses and foreigntechnical assistance. In Kenya, only 9 out of 220 firms who answered these questions hadforeign licenses, and 17 out of 220 received foreign technical assistance. In Zimbabwelicenses and technical assistance were somewhat more common: 28 out of 200 firms hasforeign licenses and 26 out of 200 received technical assistance. The questions asked ofGhanaian firms were phrased differently, but also indicate little use of licenses or
9

assistance. Of the 186 firms in the sample, only 6 firms indicated that they had held at leastone foreign license during the past 10 years, 6 said they had received foreign technicalassistance in the last year, and 2 said they had used foreign consultants in the past 2 years.
Table 5. Involvement in Foreign MarketsNone 0-25% 25%-50% 50%-75% 75%-100%
KenyaPercentage of raw materials 121 32 15 25 25
Imported (76.1%) (11.4%) (3.3%) (3.3%) (5.9%)Percentage of output exported 170 29 7 4 8
(78.0%) (6.6%) (0.1%) (0.2%) (0.3%)Percentage of foreign 184 4 6 10 14
Ownership of the firm (96.5%) (0.2%) (1.7%) (0.3%) (1.3%)ZimbabwePercentage of raw materials 92 57 20 13 12
Imported (93.0%) (4.4%) (0.9%) (0.4%) (1.3%)Percentage of output exported 104 58 23 9 6
(92.2%) (4.4%) (1.1%) (1.1%) (1.3%)Percentage of foreign 155 12 7 8 15
Ownership of the firm (96.7%) (0.5%) (0.6%) (0.9%) (1.3%)GhanaPercentage of raw materials 127 12 6 11 19
Imported (72.6%) (6.9%) (3.4%) (6.3%) (10.9%)Percentage of output exported 163 11 2 1 4
(90.1%) (6.1%) (1.1%) (0.6%) (2.2%)Percentage of foreign 154 2 12 13 5
Ownership of the firm (82.8%) (1.1%) (6.5%) (7.0%) (2.7%)Note: The numbers in parentheses indicate percentage of finms. The percentages for Kenya and Zimbabweare calculated using survey weights. The percentages for Ghana are unweighted.
C. Estimates of cost functions
The data described above have been used to estimate cost functions for firms ineach of the three countries. Our primary interest is to see whether firms with more skills(as measured by the education levels of owners and/or managers) and more involvement inforeign markets have lower productions costs, given output. We start with the short-runcost function for firm i:
(5) Ci = C (pi, ki, qi /Ad),
where c is costs defined as the cost of labor, raw materials, and indirect costs such asutilities and rent, p is a vector of input prices, q is the value of output, k is the replacementvalue of the firm's capital equipment, and A is a measure of the technology level of thefirm. This form of the cost function follows from the assumption that the short-runproduction function has the fornn qi = AiQ(Mi, k), where Mi is a vector of variable inputsand Ai depends on the level of "technological" inputs such as education. The Nelson-Phelps view discussed in Section 2 implies that Ai is a function of both the skill level of thefirm (measured by hi) and also by factors that affect the firm specific rate of flow of new
10

technologies from abroad (measured by (PF), the two entering the cost functioninteractively.
We start by estimating basic cost functions that do not include any variables thatmay affect Ai. Because we have small samples of cross-sectional data, and no data on inputprices p, we employ simple specifications for the short-run cost functions. We work withthe following:
(6) ln(ci) - /3 + a, ln(qi) + aq,,[hn(qi)] 2 + zk ln(ki)
()kk[ln(kd)] 2 + aqk ln(qi)ln(ki) + s;,
where I3, is a sector-specific intercept meant to capture the effects of differences in inputprices across sectors. As discussed above, the data from Ghana contain many missingvalues for the value of capital, and so for it the terms in (6) that involve the logarithm ofcapital are excluded. Estimates of these basic cost functions are shown in Table 6. The toppanel shows estimates for formal firms (or, in the case of Ghana, firms with 10 or moreemployees), and the bottom panel shows results for the full set of firms. The estimates forthe three countries are quite similar, and are also similar for the formal and full samples. Inall specifications the sectoral dummy variables are jointly insignificant.9 The results for thesimplest specification, in which the logarithm of costs is regressed on the logarithm ofoutput and a set of sector dummies, indicate that the underlying production technologydisplays constant or slightly increasing returns to scale. Variation in output explains a highfraction of variation in costs, with R 's that exceed 0.92 for all countries. Including thelogarithm of output squared, the measures of capital, and the interaction of capital andoutput does not greatly improve the fit of the cost functions.
The cost function shown in equation (6) was modified to include variables that arelikely to affect A. As discussed above, A is meant to capture the effects of skills anddeterminants of technology inflows on costs. We begin by including measures of the skilllevel of firm's owners or, if no owner was present, the skill level of the firm's manager. ForKenya and Ghana, the education levels of owners and the average education of managerialemployees was coded in the same way, and we construct dummies that indicate whetherthe owner (or managerial employees) had no schooling, primary schooling, secondaryschooling, or university training. We also experimented with using more finely detailededucational categories that made use of the information on whether owners/employees hadreceived occupational or vocational training. These results are not reported, but wereessentially no different than the results that are discussed below. For Zimbabwe thevariable pertaining to the average education of managerial employees was miscoded, andso for firms without owners we substitute the education level of the general manager or, ifthere was no general manager, the production manager. There are only 3 firrns in
9 We also experimented with including dummy variables for the city in which frms are located, andthese were also insignificant. The results are consistent with there being neither regional nor sectoralvariation in input prices.
11
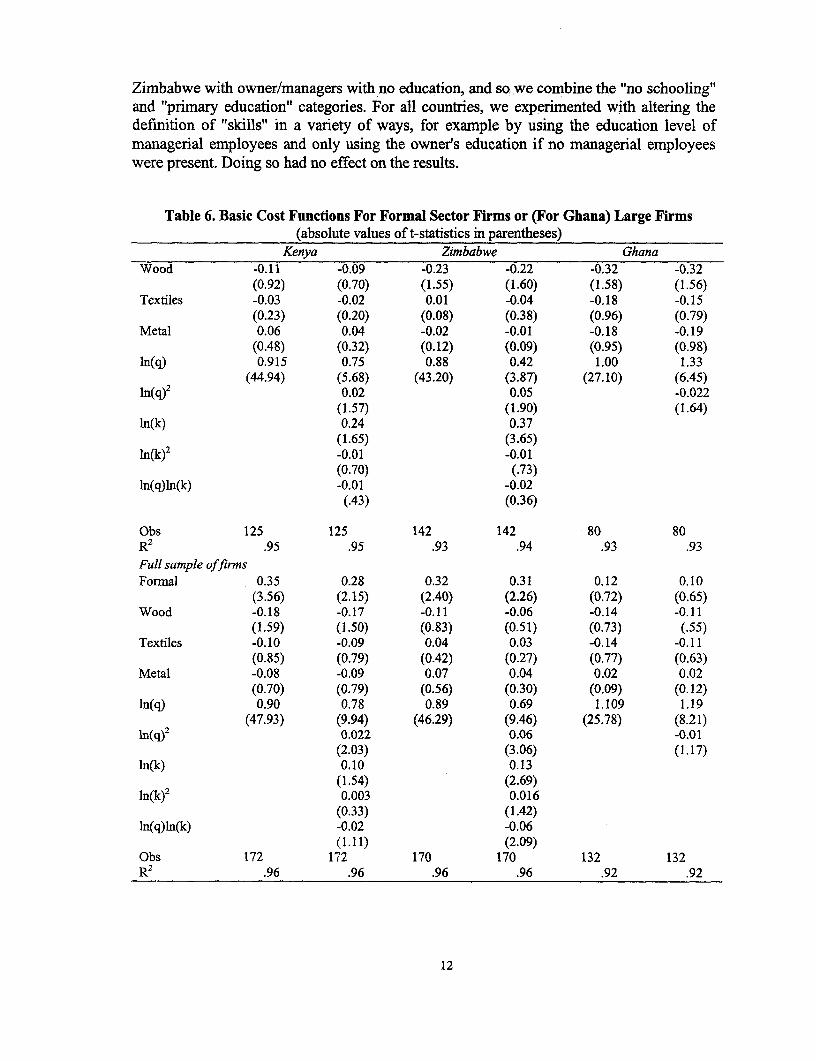
Zimbabwe with owner/managers with no education, and so we combine the "no schooling"and "primary education" categories. For all countries, we experimented with altering thedefinition of "skills" in a variety of ways, for example by using the education level ofmanagerial employees and only using the owner's education if no managerial employeeswere present. Doing so had no effect on the results.
Table 6. Basic Cost Functions For Formal Sector Firms or (For Ghana) Large Firms(absolute values of t-statistics in parentheses)
Kenya Zimbabwe GhanaWood -0.11 -0.09 -0.23 -0.22 -0.32 -0.32
(0.92) (0.70) (1.55) (1.60) (1.58) (1.56)Textiles -0.03 -0.02 0.01 -0.04 -0.18 -0.15
(0.23) (0.20) (0.08) (0.38) (0.96) (0.79)Metal 0.06 0.04 -0.02 -0.01 -0.18 -0.19
(0.48) (0.32) (0.12) (0.09) (0.95) (0.98)In(q) 0.915 0.75 0.88 0.42 1.00 1.33
(44.94) (5.68) (43.20) (3.87) (27.10) (6.45)ln(q) 2 0.02 0.05 -0.022
(1.57) (1.90) (1.64)hn(k) 0.24 0.37
(1.65) (3.65)In(k) 2 -0.01 -0.01
(0.70) (.73)In(q)ln(k) -0.01 -0.02
(.43) (0.36)
Obs 125 125 142 142 80 801(2 .95 .95 .93 .94 .93 .93Full sample offirmsFormal 0.35 0.28 0.32 0.31 0.12 0.10
(3.56) (2.15) (2.40) (2.26) (0.72) (0.65)Wood -0.18 -0.17 -0.11 -0.06 -0.14 -0.11
(1.59) (1.50) (0.83) (0.51) (0.73) (.55)Textiles -0.10 -0.09 0.04 0.03 -0.14 -0.11
(0.85) (0.79) (0.42) (0.27) (0.77) (0.63)Metal -0.08 -0.09 0.07 0.04 0.02 0.02
(0.70) (0.79) (0.56) (0.30) (0.09) (0.12)In(q) 0.90 0.78 0.89 0.69 1.109 1.19
(47.93) (9.94) (46.29) (9.46) (25.78) (8.21)In(q) 2 0.022 0.06 -0.01
(2.03) (3.06) (1.17)ln(k) 0.10 0.13
(1.54) (2.69)ln(k)2 0.003 0.016
(0.33) (1.42)ln(q)ln(k) -0.02 -0.06
(1.11) (2.09)Obs 172 172 170 170 132 1321(2 .96 .96 .96 .96 .92 .92
12

The first columns of Tables 7a, 7b and 7c show estimates of cost functions whenthe "skill" measures are included. As the coefficients on the variables shown in Table 6 arelargely unchanged, only coefficients for the skill variables are reported. The results areeasily sunmmarized. In no country are higher managerial skills associated with lower costs,given output. There is one anomalous result for formal sector firms in Ghana (Table 7c):firms with educated owners appear to have higher costs than those with no education.However, the three educational dummy variables are not jointly significant.
In the second column of the three tables we include variables that measureinvolvement in foreign markets: the percentage of raw materials imported, the percentageof output exported, and the percentage of foreign ownership. If firms with moreinvolvement in foreign markets have more access to lower-cost technology, then thesevariables should be negatively correlated with costs. However, interpreting the parameterestimates requires caution: it could be that finns whose costs are initially lower export theiroutput. This could also produce a negative correlation between exports and costs, and itwould be incorrect to interpret the results as reflecting the effects of the rate of technologytransfer on costs (Clarides, Lachs, and Tybout 1999).10 However, the results indicate thatthere is no correlation between involvement in foreign markets and costs in any of thecountries, and the hypothesis that the variables are individually and jointly insignificantcannot be rejected. The lack of a statistically significant relationship between thesevariables and costs may not be surprising given that very few of the firms have anyinvolvement in foreign markets.
If only high-skill firms are able to take advantage of new technologies from abroad,the Nelson-Phelps view, there should be a negative correlation between costs and aninteraction term between skills and the variables reflecting access to foreign markets. Thethird column of Tables 7a, 7b and 7c show estimates of cost functions when theseinteractions are included. Overall, the results provide very little support for the hypothesisthat high skills combined with access to foreign markets result in reductions of unit costs.With only one exception, the coefficients on these interactions are insignificant. Theexception is for Kenya, for which firms with university-trained owner/managers whoexport higher fractions of their output have lower costs, all else being equal. One shouldnot, however, make too much of this finding. First, there are only 17 formal sector and Iinformal sector firms with university-trained owner/managers who export any of theiroutput. Second, as discussed above, without better information on exogenous determinantsof access to export markets, it is not possible to know whether low-cost firms witheducated owners are better equipped to sell their output abroad, or whether involvement inforeign markets makes it easier for more educated owners to produce using lower-costmethods.
10 One of the benefits of panel data would be the ability to address the question of whether efficientfirms select into exports or whether exporting generates learning.
13

Table 7a. Formal Firms, Kenya(Obs=125)
Firms Sample meansOwner/manager's education:
Primary school -0.038 (0.32) -0.017 (0.15) -0.053 (0.45) 0.32Secondary school -0.062 (0.47) -0.065 (0.49) -0.009 (0.07) 0.18University -0.056 (0.47) -0.041 (0.33) 0.032 (0.23) 0.31
% raw materials imported 0.0006 (0.46) 0.0000 (0.04) 26.8%output exported -0.0034 (1.78) 0.0014 (0.59) 8.9%foreign ownership -0.0019(1.16) 0.0001 (0.04) 10.2
owner/manager education isuniversity times:%raw material imported 0.0010 (0.43) 16.5%output exported -0.0115 (3.20) 4.3%foreign ownership -0.0023 (0.72) 6.5R2 0.95 0.95 0.96
Kenya: allfirms (obs=1 72)Owner/manager's education:
Primary school -0.054 (0.56) -0.034 (0.35) -0.042 (0.42) .31Secondary school -0.005 (0.05) 0.004 (0.03) 0.033 (0.26) .15University 0.016 (0.15) 0.039 (0.34) 0.076 (0.60) .24
% raw materials imported 0.0000 (0.02) -0.0008 (0.47) 22.3%output exported -0.0026 (1.26) 0.0027 (1.09) 6.5%foreign ownership -0.0020 (1.27) -0.0021 (0.84) 8.2
owner/manager education isuniversity times:%/oraw material imnported 0.0017 (0.74) 12.4%output exported -0.0123 (3.33) 3.1%foreign ownership 0.0011 (0.32) 5.3
R 2 0.96 0.96 0.97Note: Absolute values of t-statistics in parentheses. Also included in cost functions were the logarithms ofoutput and capital, each of these terms squared, and an interaction term between output and capital.
14
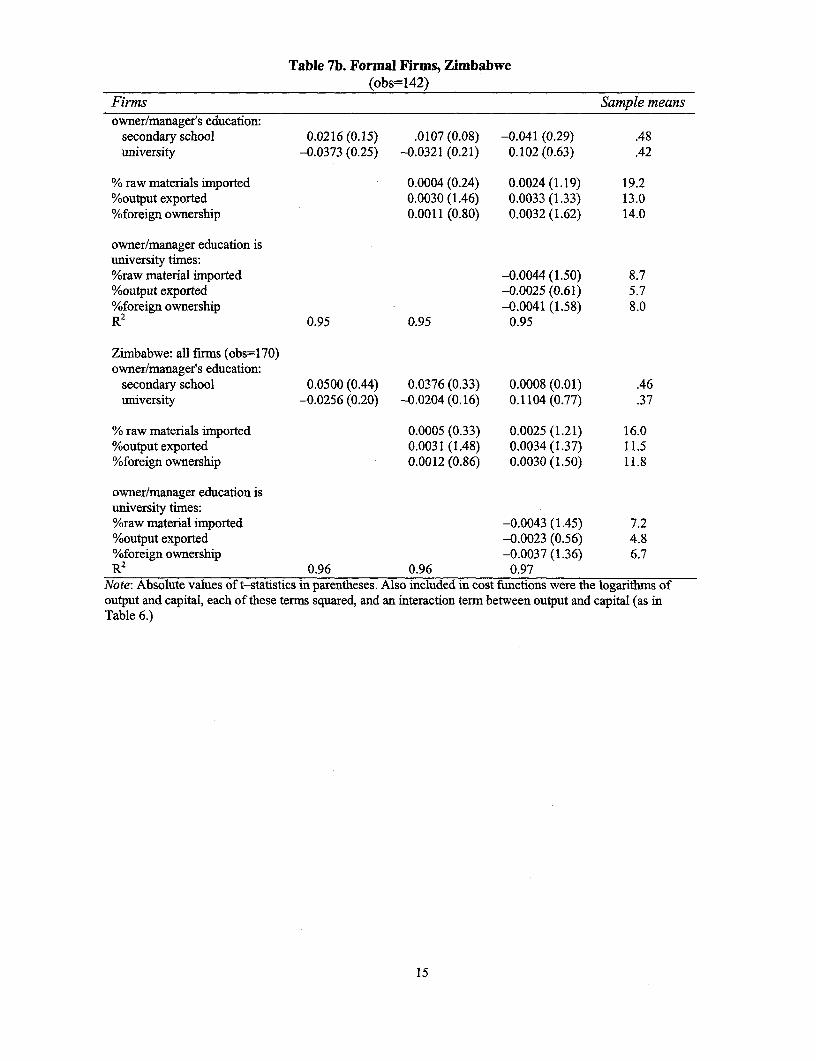
Table 7b. Formal Firms, Zimbabwe(obs=142)
Firms Sample meansowner/manager's education:
secondary school 0.0216 (0.15) .0107 (0.08) -0.041 (0.29) .48university -0.0373 (0.25) -0.0321 (0.21) 0.102 (0.63) .42
% raw materials imported 0.0004 (0.24) 0.0024 (1.19) 19.2%output exported 0.0030 (1.46) 0.0033 (1.33) 13.0%foreign ownership 0.0011 (0.80) 0.0032 (1.62) 14.0
owner/manager education isuniversity times:%raw material imported -0.0044 (1.50) 8.7%output exported -0.0025 (0.61) 5.7%foreign ownership -0.0041 (1.58) 8.0R2 0.95 0.95 0.95
Zimbabwe: all finrs (obs=170)owner/manager's education:
secondary school 0.0500 (0.44) 0.0376 (0.33) 0.0008 (0.01) .46university -0.0256 (0.20) -0.0204 (0.16) 0.1104 (0.77) .37
% raw materials imported 0.0005 (0.33) 0.0025 (1.21) 16.0%output exported 0.0031 (1.48) 0.0034 (1.37) 11.5%foreign ownership 0.0012 (0.86) 0.0030 (1.50) 11.8
owner/manager education isuniversity times:%raw material imported -0.0043 (1.45) 7.2%output exported -0.0023 (0.56) 4.8%foreign ownership -0.0037 (1.36) 6.7R2 0.96 0.96 0.97
Note: Absolute values of t-statistics in parentheses. Also included in cost functions were the logarithms ofoutput and capital, each of these terms squared, and an interaction term between output and capital (as inTable 6.)
15

Table 7c. Large Firms, Ghana(10 or more employees) (obs=80)
Firms Sample meansowner/manager's education:
primary school 0.043 (0.22) 0.038 (0.19) 0.044 (0.22) .39secondary school -0.087 (0.42) -0.091 (0.44) -0.135 (0.61) .33university 0.427 (1.71) 0.426 (1.70) 0.340 (1.22) .16
% raw materials imported -0.0006 (0.29) -0.0041 (1.29) 20.0%output exported -0.0023 (0.78) -0.0034 (0.77) 6.7%foreign ownership 0.0044 (1.36) 0.0099 (1.71) 10.6
owner/manager education isuniversity times:%raw matenal unported 0.0059 (1.40) 11.5%output exported 0.0022 (0.38) 3.7%foreign ownership -0.0070 (1.14) 6.6R' 0.93 0.93 0.94
Ghana: all fimns (obs=132)owner/manager's education:
primary school 0.389 (2.29) 0.386 (2.24) 0.389 (2.23) .45secondary school 0.216 (1.16) 0.215 (1.15) 0.190 (0.96) .27university 0.526 (2.12) 0.519 (2.07) 0.465 (1.72) .11
% raw materials imported -0.0002 (0.09) -0.0019 (0.57) 12.8%output exported -0.0027 (0.75) -0.0038 (0.72) 4.0%foreign ownership 0.0027 (0.80) 0.0045 (0.92) 7.2
owner/manager education isuniversity times:%raw material imported 0.0035 (0.75) 7.1%output exported 0.0024 (0.35) 2.3%foreign ownership -0.0037 (0.54) 4.0R2 0.92 0.92 0.92
Note: Absolute values of t-statistics in parentheses. Also included in cost finctions were the logarithm ofoutput and the logarithm of output squared (as in Table 6.)
5. Interpretation of the Results
There are a number of potential explanations for the absence of significance of thecomponents of technological ability (A) in countries in which it is generally believed that aconstraining factor is human capital and technological infrastructure. Consider thespecification that assumes the components of A are multiplicative elements in the costfunction. First, the relatively non-competitive environment may lead to limited efforts toutilize those skills that are present. Second, even where skilled managers are present orR&D takes place, these may simply be devoted to efforts to redress the productivitydepressing effects imposed by the protectionist regimes. For example, engineers mayspend their time adjusting equipment to cope with low quality intermediate inputs that arelocally available. While this may lead to higher productivity than in their absence, they aremainly redressing the productivity depressing effects of policy and the net effect of theireffort is likely to be small.
16

Surveys of firms in Africa repeatedly find that firms frequently encounterdifficulties with arbitrary foreign exchange allocations, zoning, building and licensingcodes, and uncertain quality of telecommunications and electricity. For exarnple, thesurveys discussed in this paper indicate that the availability of foreign exchange is a specialproblem among formal sector firms. In Kenya, 35.4 percent of firms indicate having "verysevere problems" regarding delays in obtaining foreign exchange, and 41.6 percent reportvery severe problems in foreign exchange availability. Of formal firms in Zimbabwe, 27percent of firms report very severe problems with delays in obtaining foreign exchange and52.1 percent report very severe problems with foreign exchange availability. Reports ofproblems with infrastructure are also common. With such a large set of governmentimposed handicaps affecting them, it would be surprising if their technological abilities,however, measured, would reveal themselves in a systematic fashion across firms. Somecompanies may use technologists to address regulations, some to correct infrastructuredeficiencies as in Nigeria (Lee et al. 1990) and others to improve productivity. Only afterliberalization are the benefits from improved technological capacity likely to bemeasurable and lead to a significant reduction in costs.
The firms in our sample have not been challenged by newer technologies where thepayoffs to domestic skills are likely to be largest. Simultaneously the failure of agriculturalproductivity to grow has limited the economy-wide growth in per capita income. Thus thechange in sectoral structure engendered by different income elasticities among industrialgoods has not had an effect. The absence of a need to alter production methods or sectoralmix has reduced the payoff to education.
Even if there were an inflow of technology and high education made its absorptionpotentially productive, the absence of a competitive environment limits these gains. Muchof the empirical testing of the role of education in adjusting to technical change has been inthe agricultural sector which is usually much more competitive than the industrial sector,particularly in developing countries (see the references in footnote 3.) In contrast, inGhana, Kenya, and Zimbabwe the survival environment is lax. Tariffs and quotas protectindustrial firms from external competition while internal rivalry is reduced by the relativelysmall number of firms producing a specified product. The shift in short-run supply curvesinduced by abnormal profits in competitive markets is not forthcoming as there are alimited number of firms capable of entering most industries. Firms possessing technicalabilities may choose not to utilize them to increase productivity or reduce costs. Theabilities of skilled personnel may be devoted to insuring the existence and exploitation ofprofit possibilities made possible by tariffs, quotas, and cheap credit.
Firm-level efforts to improve productivity are the result of an income and asubstitution effect. High levels of protection, ceteris paribus, increase the firm's profits perunit of effort. If the foregone "leisure" or easy life is a normal good, protection will tend toreduce cost saving efforts. However, higher levels of effective protection increase theopportunity cost of foregoing additional output from productivity augmenting activities.Thus, the impact of firm-level abilities on productivity in the presence of protection isambiguous. An absence of an association between firm skills, however measured, andproductivity levels among firms is not an indication that such skills do not provide the
17

potential to raise productivity. Rather, such a capacity may not be deployed in pursuit ofgreater cost reduction rather than the search for greater rents or an easier life.
6. Conclusions
The absence of a significant private payoff to technological capability may besurprising given the frequently heard statement that the binding constraint on Africanindustrial development is an insufficient supply of technologically capable manpower. Thisis also the implication of the many cross-country studies that find that an important sourceof low growth in per capita income in Africa is the low level of human capital, howevermeasured. Our results are not necessarily in conflict with this view. They should beinterpreted as indicating that in non-competitive industrial sectors with very little inflow ofnew technology, the contribution of technological abilities, however measured, is limited.If there were a liberalization of the economy that generated greater competition or if therewere an acceleration of export growth, permitting the import of new technologyembodying inputs, the contribution of local skills would become more significant in raisingoutput. The experience of other countries also suggests that as the economy becomes opento flows of international knowledge, whether through informal transfers from purchasers ofexports or through technology licenses, the technological capacity of local industrybecomes important. II
The policy implications of the empirical analysis are clear. Absent greaterprospective competition, continued efforts to develop high-level industrial skills may bewasteful. The conundrum is that their absence may limit the benefits to the industrial sectorfrom future liberalization and lead to a weak supply response to improved incentives.
ReferencesBarro, Robert J., and Jong-Wha Lee 1993 "Losers and Winners in Economic Growth." In
Proceedings of the World Bank Annual Conference on Development Economics,267-298. Washington D.C.: World Bank.
Clerides, S. K., Saul Lachs, and James R. Tybout. 1998. "Is Learning by ExportingImportant? Micro-Dynamic Evidence from Colombia, Mexico, and Morocco."Quarterly Journal of Economics 113:903-48.
Collier, Paul, and Jan Gunning. 1999. "Explaining African Economic Performance"Journal of Economic Literature 37:64- 111.
Easterly, William. 1993. "Is Africa Different? Evidence From Growth Regressions." WorldBank, Policy Research Department, Washington D.C. Processed.
Foster, Andrew D., and Mark R. Rosenzweig. 1995. "Technical Change and HumanCapital Returns and Investments: Evidence from the Green Revolution." AmericanEconomic Review 86: 931-53.
. 1995. "Learning by Doing and Leaming From Others: Human Capital andTechnical Change in Agriculture." Journal of Political Economy 103: 1176-1209.
See the East Asian Economic Miracle, Chapter 6.
18

Gerschenkron, Alexander, 1962, Economic Development in Historical Perspective,Cambridge, Harvard University Press.
Husain, Ishrat. 1993. "Comment on Barro and Wha." In Proceedings of the World BankAnnual Conference on Development Economics, 305-310. Washington D.C.: WorldBank.
Jolliffe, Dean. 1995 "Cognitive Skills, Schooling and Income: Evidence from Ghana."Processed.
Lall, Sanjaya. 1990. Building Industrial Competitiveness in Developing Countries. Paris:OECD.
Lee, Kyu Shik, and Alex Anas. 1990. "Manufacturers' response to infrastructuredeficiencies in Nigeria: Private Alternatives and Policy Options." Policy Researchand External Affairs Working Paper No. 325. World Bank, Washington, D.C.
Meier, Gerald M., and William F. Steel. 1989. Industrial Adjustment in Sub-SaharanAfrica. New York: Oxford University Press.
Nelson, Richard R., and Edmund Phelps. 1966. "Investment in Humans, TechnologicalDiffusion, and Economic Growth." American Economic Review 56 (May): 69-75.
Pack, Howard. 1987. Productivity, Technology, and Industrial Development. New York:Oxford University Press.
. 1993. "Productivity and Industrial Development in Sub-Saharan Africa." WorldDevelopment 21 (January): 1-16.
Rosenzweig, Mark R. 1995. "Why Are There Returns to Schooling? American EconomicReview, Papers and Proceedings (May).
Schultz, Theodore W. 1975. "The Value of the Ability to Deal With Disequilibria."Journal of Economic Literature 13(September):827-46.
Szirmai, A., and M. Timmer. 1999. "Comparative Performance in Manufacturing in Southand East-Asia, 1960-93." Oxford Development Studies 27.
Teitel, Simon. 1981. "Toward an Understanding of Technical Change in Semi-Industrialized Countries." In Jorge M. Katz, Technology Generation in LatinAmerican Manufacturing Industries. London: Macmillan.
United Nations Industrial Development Organization (UNIDO). 1993. Industry andDevelopment Global Report 1992/93. Vienna: UNIDO.
World Bank. 1993a. Zimbabwe: A Policy Agenda for Private Sector Development.Washington, D.C.: World Bank.
_____. 1993b. "First Report on the Kenyan Survey." Regional Programme on EnterpriseDevelopment, Africa Technical Department, Washington, D.C.
______. 1993c. "Economic Reform in the Manufacturing Sector of Ghana." AfricaTechnical Department, Washington, D.C.. 1993. East Asian Economic Miracle. Washington, D.C.: World Bank.. 1994. "First Report on the Zimbabwe Survey." Regional Programme on EnterpriseDevelopment, Africa Technical Department, Washington, D.C.
World Bank. Various years. World Development Report. Washington, D.C.: World Bank.
19


Policy Research Working Paper Series
ContactTitle Author Date for paper
WPS2187 Who Determines Mexican Trade Jean-Marie Grether September 1999 L. TabadaPolicy? Jaime de Melo 36896
WPS2188 Financial Liberalization and the Pedro Alba September 1999 R. VoCapital Account: Thailand, 1988-97 Leonardo Hernandez 33722
Daniela Klingebiel
WPS2189 Alternative Frameworks for Stijn Claessens September 1999 R. VoProviding Financial Services Daniela Klingebiel 33722
WPS2190 The Credit Channel at Work: Lessons Giovanni Ferri September 1999 K. Labriefrom the Republic of Korea's Financial Tae Soo Kang 31001Crisis
WPS2191 Can No Antitrust Policy Be Better Aaditya Mattoo September 1999 L. TabadaThan Some Antitrust Policy? 36896
WPS2192 Districts, Spillovers, and Government Reza Baqir September 1999 S. DevadasOverspending 87891
WPS2193 Children's Growth and Poverty in Michele Gragnolati September 1999 M. GragnolatiRural Guatemala 85287
WPS2194 Does Democracy Facilitate the Jean-Jacques Dethier October 1999 H. GhanemEconomic Transition? An Empirical Hafez Ghanem 85557Study of Central and Eastern Europe Edda Zoliand the Former Soviet Union
WPS2195 Aggregating Governance Indicators Daniel Kaufmann October 1999 D. BouvetAart Kraay 35818Pablo Zoido-Lobat6n
WPS2196 Governance Matters Daniel Kaufmann October 1999 D. BouvetAart Kraay 35818Pablo Zoido-Lobat6n
WPS2197 Production Sharing in East Asia: Francis Ng October 1999 L. TabadaWho Does What for Whom, and Why? Alexander Yeats 36896
WPS2198 How the Chinese System of Charges Hua Wang October 1999 H. Wangand Subsidies Affects Pollution Ming Chen 33255Control Efforts by China's TopIndustrial Polluters
WPS2199 Managing Risks of Capital Mobility Mansoor Dailami October 1999 W. Nedrow31585
WPS2200 The Role of Trust in Financial Sector Biagio Bossone October 1999 E. MekhovaDevelopment 85984

Policy Research Working Paper Series
ContactTitle Author Date for paper
WPS2201 Financial Development and Industrial Biagio Bossone October 1999 E. MekhovaCapital Accumulation 85984
WPS2202 Specialization without Regret: Michael R. Carter October 1999 M. FernandezTransfer Rights, Agricultural Yang Yao 33766Productivity, and Investment in anIndustrializing Economy
WPS2203 Market versus Administrative Michael R. Carter October 1999 M. FernandezReallocation of Agricultural Land Yang Yao 33766in a Period of Rapid Industrialization
WPS2204 Corruption under Moral Hazard Gunnar S. Eskeland October 1999 H. SladovichHenrik Thiele 37698
WPS2205 Foreign-Owned Capital and Marcelo Olarreaga October 1999 L. TabadaEndogenous Tariffs 36896
WPS2206 Household Childcare Choices and Michael M. Lokshin October 1999 P. SaderWomen's Work Behavior in Russia 33902
WPS2207 Jamaica's Food Stamp Program: Kene Ezemenari October 1999 G. PeraltaImpacts on Poverty and Welfare Kalanidhi Subbarao 37405
WPS2208 Ethnic Partition as a Solution to Nicholas Sambanis October 1999 H. SladovichEthnic War: An Empirical Critique 37698of the Theoretical Literature
WPS2209 Does Corruption Relieve Foreign Shang-Jin Wei October 1999 H. SladovichInvestors of the Burden of Taxes 37698and Capital Controls?
WPS2210 The Sliperry Slope: Explaining the Francisco H. G. Ferreira October 1999 G. Ilogonincrease in Extreme Poverty in Urban Ricardo Paes de Barros 33732Brazil, 1976-96
WPS2211 Competition Policy, Developing Bernard Hoekman October 1999 L. TabadaCountries, and the World Trade Peter Holmes 36896Organization
(1 /


![The vocabularies of Vazimba and Beosi: do they represent ... vo… · do they represent the languages of the pre-Austronesian populations of Madagascar? [DRAFT CIRCULATED FOR COMMENT]](https://img.pdfslide.net/doc/110x75/5f343f8217d7f5103034834d/the-vocabularies-of-vazimba-and-beosi-do-they-represent-vo-do-they-represent.jpg)