Embed Size (px)
Citation preview
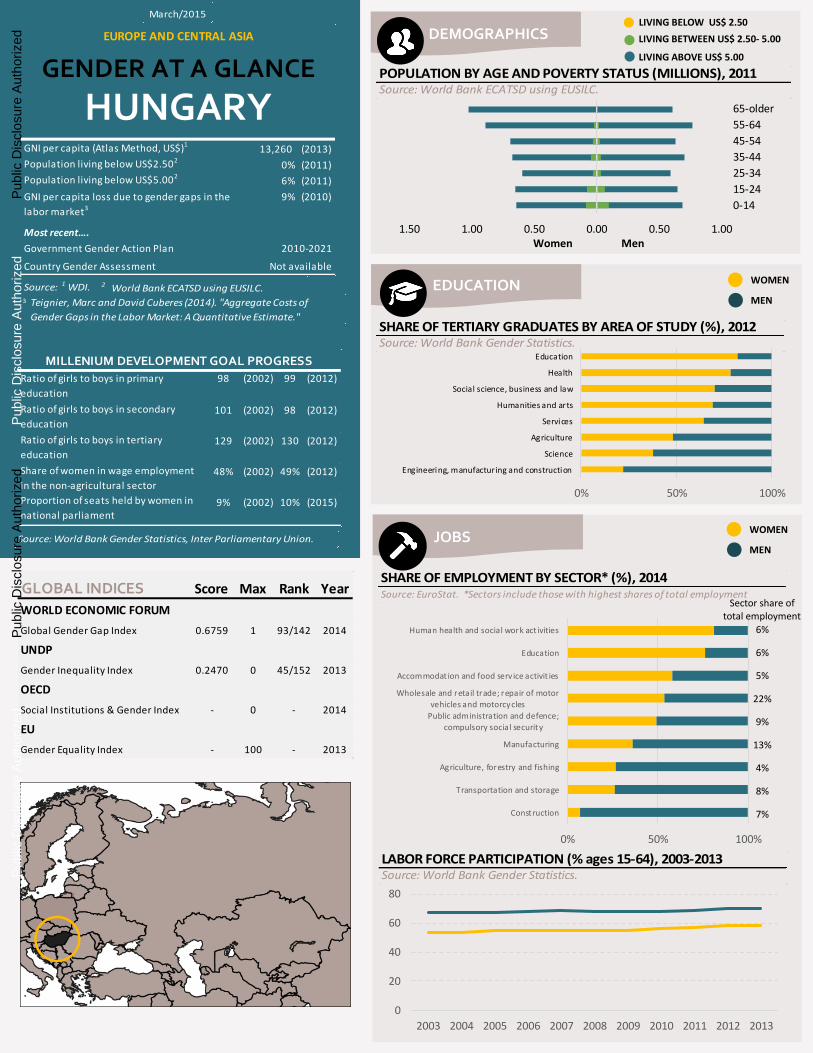
DEMOGRAPHICS
WOMEN
MEN
WOMEN
MEN
JOBS
EDUCATION
LIVING ABOVE US$ 5.00
LIVING BETWEEN US$ 2.50- 5.00
LIVING BELOW US$ 2.50
Women Men
EUROPE AND CENTRAL ASIA
GENDER AT A GLANCE
HUNGARYGNI per capita (Atlas Method, US$)1
13,260 (2013)
Population living below US$2.5020% (2011)
Population living below US$5.0026% (2011)
GNI per capita loss due to gender gaps in the 9% (2010)
labor market3
Most recent….
Government Gender Action Plan
Country Gender Assessment
2010-2021
Not available
Source: 1 WDI. 2 World Bank ECATSD using EUSILC.3 Teignier, Marc and David Cuberes (2014). "Aggregate Costs of
Gender Gaps in the Labor Market: A Quantitative Estimate."
MILLENIUM DEVELOPMENT GOAL PROGRESS
Ratio of girls to boys in primary
education
98 (2002) 99 (2012)
Ratio of girls to boys in secondary
education
101 (2002) 98 (2012)
Ratio of girls to boys in tertiary
education
129 (2002) 130 (2012)
Share of women in wage employment
in the non-agricultural sector
48% (2002) 49% (2012)
Proportion of seats held by women in
national parliament9% (2002) 10% (2015)
Source: World Bank Gender Statistics, Inter Parliamentary Union.
GLOBAL INDICES Score Max Rank Year
WORLD ECONOMIC FORUM
Global Gender Gap Index 0.6759 1 93/142 2014
UNDP
Gender Inequality Index 0.2470 0 45/152 2013
OECD
Social Institutions & Gender Index - 0 - 2014
EU
Gender Equality Index - 100 - 2013
POPULATION BY AGE AND POVERTY STATUS (MILLIONS), 2011Source: World Bank ECATSD using EUSILC.
1.50 1.00 0.50 0.00 0.50 1.00
0-14
15-24
25-34
35-44
45-54
55-64
65-older
SHARE OF TERTIARY GRADUATES BY AREA OF STUDY (%), 2012Source: World Bank Gender Statistics.
0% 50% 100%
Engineering, manufacturing and construction
Science
Agriculture
Services
Humanities and arts
Social science, business and law
Health
Education
SHARE OF EMPLOYMENT BY SECTOR* (%), 2014Source: EuroStat. *Sectors include those with highest shares of total employment
6%
6%
5%
22%
9%
13%
4%
8%
7%
0% 50% 100%
Construction
Transportation and storage
Agriculture, forestry and fishing
Manufacturing
Public administration and defence;
compulsory social security
Wholesale and retail trade; repair of motor
vehicles and motorcycles
Accommodat ion and food serv ice activit ies
Education
Human health and social work act ivities
Sector share of total employment
LABOR FORCE PARTICIPATION (% ages 15-64), 2003-2013Source: World Bank Gender Statistics.
0
20
40
60
80
2003 2004 2005 2006 2007 2008 2009 2010 2011 2012 2013
March/2015P
ublic
Dis
clos
ure
Aut
horiz
edP
ublic
Dis
clos
ure
Aut
horiz
edP
ublic
Dis
clos
ure
Aut
horiz
edP
ublic
Dis
clos
ure
Aut
horiz
ed
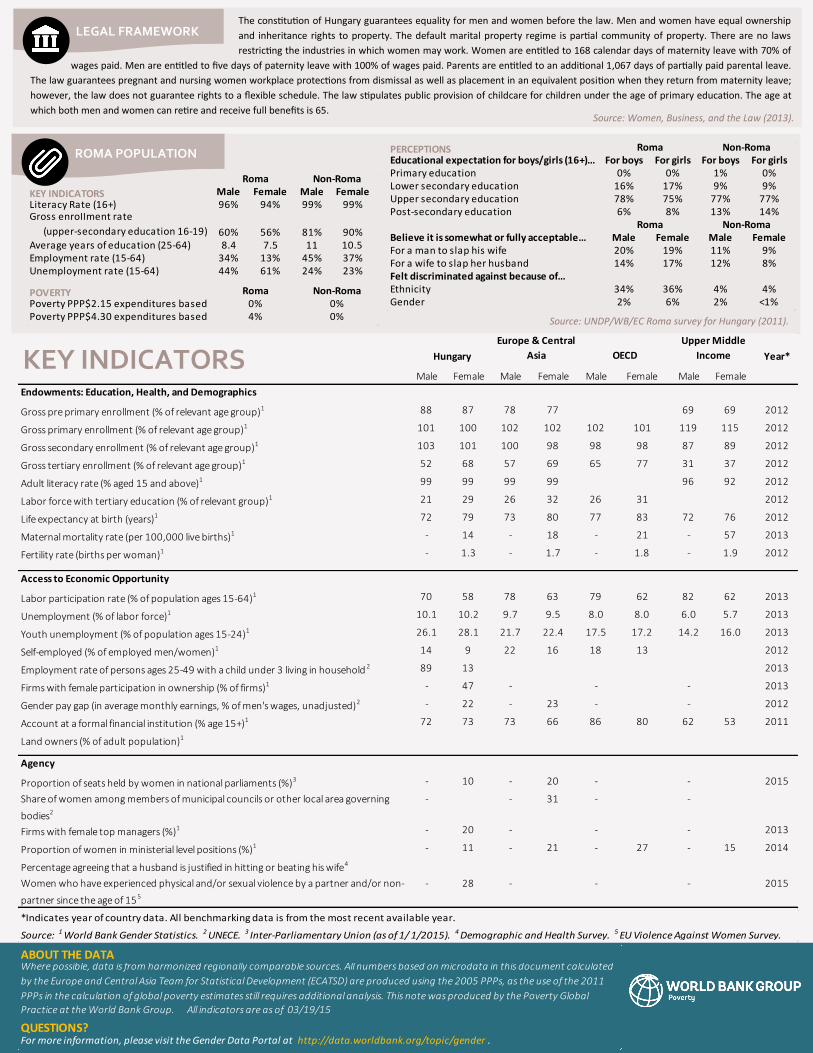
Source: Women, Business, and the Law (2013).
The constitution of Hungary guarantees equality for men and women before the law. Men and women have equal ownership
and inheritance rights to property. The default marital property regime is partial community of property. There are no laws
restricting the industries in which women may work. Women are entitled to 168 calendar days of maternity leave with 70% of
wages paid. Men are entitled to five days of paternity leave with 100% of wages paid. Parents are entitled to an additional 1,067 days of partially paid parental leave.
The law guarantees pregnant and nursing women workplace protections from dismissal as well as placement in an equivalent position when they return from maternity leave;
however, the law does not guarantee rights to a flexible schedule. The law stipulates public provision of childcare for children under the age of primary education. The age at
which both men and women can retire and receive full benefits is 65.
LEGAL FRAMEWORK
KEY INDICATORS Male Female Male FemaleLiteracy Rate (16+) 96% 94% 99% 99%Gross enrollment rate
(upper-secondary education 16-19) 60% 56% 81% 90%Average years of education (25-64) 8.4 7.5 11 10.5Employment rate (15-64) 34% 13% 45% 37%Unemployment rate (15-64) 44% 61% 24% 23%
POVERTYPoverty PPP$2.15 expenditures basedPoverty PPP$4.30 expenditures based
Roma Non-Roma
Roma Non-Roma0% 0%4% 0%
ROMA POPULATION
Source: UNDP/WB/EC Roma survey for Hungary (2011).
PERCEPTIONSEducational expectation for boys/girls (16+)… For boys For girls For boys For girlsPrimary education 0% 0% 1% 0%Lower secondary education 16% 17% 9% 9%Upper secondary education 78% 75% 77% 77%Post-secondary education 6% 8% 13% 14%
Believe it is somewhat or fully acceptable… Male Female Male FemaleFor a man to slap his wife 20% 19% 11% 9%For a wife to slap her husband 14% 17% 12% 8%Felt discriminated against because of…Ethnicity 34% 36% 4% 4%Gender 2% 6% 2% <1%
Roma Non-Roma
Roma Non-Roma
Hungary
Europe & Central
Asia OECD
Upper Middle
Income Year*
Male Female Male Female Male Female Male Female
Endowments: Education, Health, and Demographics
Gross pre primary enrollment (% of relevant age group)1 88 87 78 77 69 69 2012
Gross primary enrollment (% of relevant age group)1 101 100 102 102 102 101 119 115 2012
Gross secondary enrollment (% of relevant age group)1 103 101 100 98 98 98 87 89 2012
Gross tertiary enrollment (% of relevant age group)1 52 68 57 69 65 77 31 37 2012
Adult literacy rate (% aged 15 and above)1 99 99 99 99 96 92 2012
Labor force with tertiary education (% of relevant group)1 21 29 26 32 26 31 2012
Life expectancy at birth (years)1 72 79 73 80 77 83 72 76 2012
Maternal mortality rate (per 100,000 live births)1 - 14 - 18 - 21 - 57 2013
Fertility rate (births per woman)1 - 1.3 - 1.7 - 1.8 - 1.9 2012
Access to Economic Opportunity
Labor participation rate (% of population ages 15-64)1 70 58 78 63 79 62 82 62 2013
Unemployment (% of labor force)1 10.1 10.2 9.7 9.5 8.0 8.0 6.0 5.7 2013
Youth unemployment (% of population ages 15-24)1 26.1 28.1 21.7 22.4 17.5 17.2 14.2 16.0 2013
Self-employed (% of employed men/women)1 14 9 22 16 18 13 2012
Employment rate of persons ages 25-49 with a child under 3 living in household 2 89 13 2013
Firms with female participation in ownership (% of firms)1 - 47 - - - 2013
Gender pay gap (in average monthly earnings, % of men's wages, unadjusted)2 - 22 - 23 - - 2012
Account at a formal financial institution (% age 15+)1 72 73 73 66 86 80 62 53 2011
Land owners (% of adult population)1
Agency
Proportion of seats held by women in national parliaments (%)3 - 10 - 20 - - 2015
Share of women among members of municipal councils or other local area governing
bodies2
- - 31 - -
Firms with female top managers (%)1 - 20 - - - 2013
Proportion of women in ministerial level positions (%)1 - 11 - 21 - 27 - 15 2014
Percentage agreeing that a husband is justified in hitting or beating his wife4
Women who have experienced physical and/or sexual violence by a partner and/or non-
partner since the age of 155
- 28 - - - 2015
KEY INDICATORS
*Indicates year of country data. All benchmarking data is from the most recent available year.
Source: 1 World Bank Gender Statistics. 2 UNECE. 3 Inter-Parliamentary Union (as of 1/ 1/2015). 4 Demographic and Health Survey. 5 EU Violence Against Women Survey.
ABOUT THE DATA
Practice at the World Bank Group. All indicators are as of 03/19/15
QUESTIONS?
Where possible, data is from harmonized regionally comparable sources. All numbers based on microdata in this document calculated
by the Europe and Central Asia Team for Statistical Development (ECATSD) are produced using the 2005 PPPs, as the use of the 2011
PPPs in the calculation of global poverty estimates still requires additional analysis. This note was produced by the Poverty Global
For more information, please visit the Gender Data Portal at http://data.worldbank.org/topic/gender .