Embed Size (px)
Citation preview

Worst Case Credible Nuclear Transportation Accidents:
Analysis for Urban and Rural Nevada
Matthew Lamb and Marvin Resnikoff, Ph.D. Radioactive Waste Management Associates
And Richard Moore, P.E.
August 2001
Radioactive Waste Management Associates
526 W. 26th Street #517 New York, NY 10001

Table of Contents
Executive Summary ......................................................................................................................................... i Introduction.....................................................................................................................................................1
1. Accident Locations and Potential Radionuclide Releases...................................................................4 Accident Locations .................................................................................................................................4 Release Estimates....................................................................................................................................5 Postulated Release Fractions and Inventory............................................................................................9 Severity of the Accidents Being Considered in this Analysis ...............................................................11
2. Downwind Radioactive Particulate Concentrations..........................................................................13 3. Las Vegas Specific Accident.............................................................................................................15
Individual Dose and Surface Contamination Estimates ........................................................................15 Population Dose Estimates for Las Vegas Accidents............................................................................20 Contamination Inside Hotels: A Hypothetical Example .......................................................................25 Las Vegas Emergency Response and Evacuation.................................................................................27 Las Vegas Decontamination .................................................................................................................40 Other Factors Affecting Cleanup Cost Estimates..................................................................................47
4. Rural Truck Accident: West Wendover, Nevada................................................................................49 General Characteristics of West Wendover, Nevada ............................................................................49 Individual Dose and Surface Contamination Estimates ........................................................................49 Population Density Estimate .................................................................................................................52 Contamination Inside Hotels: A Hypothetical Example .......................................................................56
5. Rural Rail Accident: Carlin, Nevada....................................................................................................58 General Characteristics of the Carlin Tunnel Region............................................................................58 Individual Dose and Surface Contamination Estimates ........................................................................59 Population Density Estimate .................................................................................................................61 Population Dose Estimate .....................................................................................................................61 Possible Contamination of the Humboldt River....................................................................................63
Conclusions...............................................................................................................................................67 References.................................................................................................................................................71
Appendices A. Discussion of Severe Accident Release Estimates A-1
B. Category 6 Accident Contamination Charts B-1 C. Alternative Population Density Calculation C-1 D. Detailed Population Dose Calculations D-1 E. Estimation of Indoor Air Concentration E-1
Nevada Spent Fuel Transportation Severe Accident Analysis Page i
Executive Summary
If the proposed Yucca Mountain waste repository opens, a large number of irradiated fuel and high-level waste shipments will converge in Nevada. According to the Department of Energy (DOE), there could be between 23,000 and 96,000 shipments to Yucca Mountain over four decades1. Depending on a range of factors, such as the eventual transportation mode and any safety precautions that may be required, hundreds of accidents are expected nationwide. Some of these accidents could result in release of radioactive materials.
As prior reports prepared by RWMA for the State of Nevada show2, DOE has systematically underestimated the potential human health impacts from severe accidents and completely ignored their potential economic impacts. The cost of cleanup, evacuation and business loss resulting from a severe accident in a generic urban area can range from several billion to several hundred billion dollars. An accident in a rural area will have a different set of consequences, but has the potential to be as devastating as an accident in a more populated area.
Except for population density, the previous analyses were not location-specific. In contrast, this study estimates site-specific accident consequences for select urban and rural locations in the State of Nevada. These were chosen based on the locations of proposed and likely truck and rail transportation corridors en route to the geologic repository at Yucca Mountain. For the urban scenarios, representative truck and rail locations were chosen in Las Vegas, a potential crossroads for fuel traveling to the proposed facility. The rural truck accident location was chosen to be near the Utah-Nevada border along I-80, in the town of West Wendover. The chosen rural rail location is at the Carlin Tunnel along the Union Pacific and Southern Pacific railroads in western Elko County.
This study estimated the nature and amount of radioactivity that could be released from a spent fuel shipping cask in the event of a serious accident, based on industry literature. From these release estimates, we estimated the extent of contamination and the consequences to individuals and collective populations associated with this contamination. Based on extensive discussions with local emergency personnel, this report also discusses the likely response by emergency personnel to an accident of this nature. Finally, the report lays out the decontamination technologies available and comments on their cost and effectiveness. Each cask that would be shipped to Yucca Mountain contains an enormous inventory of radioactive material. Casks are not designed to withstand all credible highway and rail accidents. Even a small release in terms of the fraction of the entire inventory that is released, such as those considered in this report, can lead to major health and economic consequences. Our calculations assumed average, site-specific meteorological conditions and wind speeds. We used standard computer software, such as HOTSPOT and RISKIND, to model downwind air and surface particulate concentrations. We further assumed a severe impact would
1 U.S. Department of Energy, 1999. Draft Environmental Impact Statement for a Geologic Repository of Spent Nuclear Fuel and High-Level Radioactive Waste at Yucca Mountain, Nye County, Nevada. (DOE/EIS-0250D). pp. J-10. 2 Lamb, M and M Resnikoff, “Consequence Assessment of Severe Nuclear Transportation Accident in an Urban Environment,” Radioactive Waste Management Associates, 5 July 2000
Radioactive Waste Management Associates

Nevada Spent Fuel Transportation Severe Accident Analysis Page ii
lead to a ground level puff release of radioactive particulates. Our release estimates did not consider the accident scenario involving “fire-only” conditions, which would result in a more protracted release of material and a higher effective release height.
Near a transportation accident, this report estimates acute radiation doses due to inhalation of a passing radioactive cloud to be in the hundreds of rems close to the release location. This is a thousand times what a person receives from background radiation in a year. Thousands of people are likely to be in the downwind path. For example, this study estimated that over 138,000 persons would be affected by a severe rail accident releasing radioactive material in Las Vegas. Persons indoors would also be exposed. If ventilation systems were not shut off, radioactive particulates would settle within hotels and other buildings, contaminating rugs, furniture, beds, and causing a radiation dose to those inside. Discussions with emergency personnel in Las Vegas and Clark County clearly indicate the accident would overwhelm local response capabilities. Before local emergency responders could accurately assess the problem, the radioactive plume would have already contaminated an extensive area. Radioactive particulates settling on roads and highways are likely to be spread by traffic, possibly contaminating distant locations and extending the area of contamination past that assumed in this study. This may result in the contamination of many more people than was estimated in this report.
Given the high number of people exposed, local responders will not be able to identify, let alone effectively quarantine, contaminated people. Thus, it will be extremely difficult to stop the spread of contamination. Initial decontamination efforts will probably be limited to emergency responders and people in the closest vicinity of the accidents. Decontamination of the affected population in general will be a massive effort.
Evacuation will be difficult at best. Spontaneous evacuation by people not in the
contaminated area will probably occur in great numbers, making the targeted evacuations much more difficult to complete. At a minimum, the evacuation of highly contaminated areas would be necessary. For a rail accident, evacuation would have to be in a radius greater than one kilometer; this would represent a large number of people if the accident took place near the Las Vegas Strip.
In the case of an accident in Las Vegas, consideration would have to be given to closing
McCarren airport in order to prevent the migration of contaminated persons. Alternately, all passengers would have to be screened for contamination. This would require a huge amount of resources that could be better utilized dealing with the major issues.
The incident would overwhelm the capability of the local medical community. Blood
and urine samples of contaminated people should be taken to track the levels of contamination and exposure, but this would be very difficult given the number of contaminated and potentially contaminated individuals. Mental health resources would be overwhelmed as well.
Unless radionuclides, particularly cesium, were removed from surfaces, remaining
residents would be exposed for long time periods. Complete decontamination would be
Radioactive Waste Management Associates

Nevada Spent Fuel Transportation Severe Accident Analysis Page iii
prohibitively expensive and would also expose workers; a balance would take place between clean-up costs and long-term radiation exposures. In this report we chose the EPA’s Protective Action Guide as a criteria for decontamination; assuming that a person should not receive more than 5 rems over a 50-year period, including initial inhalation due to the passing cloud. If areas are not decontaminated, we estimate between 6,000 and 41,000 latent cancer fatalities would result from exposure to radiation resulting from the rail accident in Las Vegas, depending on the risk model. If radioactive contaminants were not remediated, there would be continuous direct gamma exposure to remaining residents. Further, this would result in a tremendous concomitant economic cost to the tourist industry. Social stigma costs are beyond the scope of this report.
Using the economic model of RADTRAN 5, evacuation and decontamination costs could
range to hundreds of billions of dollars. These potential costs greatly exceed the amount of insurance coverage held by nuclear utilities or the Department of Energy. This raises the question of how such an expensive endeavor would be financed. Government financing of clean-up would require an act of Congress, which would significantly delay remedial action.
While the population densities are obviously lower in a rural area, an accident in West
Wendover on I-80, or a rail accident near the Carlin tunnel, both in Northern Nevada, would also have serious consequences. I-80 is the main route into and out of West Wendover, as well as a major cross-country thoroughfare. An accident that spread radioactive contamination could cut off the exit and either leave cars trapped or have vehicles spread the contamination miles down the highway. This report calculates the accident consequences in West Wendover. A rail accident near the Carlin tunnel, in a canyon adjacent to the Humboldt River, would lead to contamination of the river bed and water for miles downstream and leading to accumulations in slowly moving sections of the river. Use of the river for recreation or drinking would be curtailed for years to come.
This study shows the potentially disastrous consequences of an accident leading to the
release of radioactive material from a spent fuel transportation cask. It also underscores the importance of preparation of emergency response for such an accident. Acknowledgement of the potential for disaster, even if the probabilities are not high, is important in attempting to prepare for an unprecedented spent fuel transportation campaign.
The tables below summarize the findings of this study. Table ES-1 presents a comparison of the Las Vegas accidents discussed in this study with the urban ‘maximum reasonably foreseeable’ accident scenarios listed in the DEIS for the Yucca Mountain Facility. Table ES-2 presents a comparison of the rural accidents discussed in this study with the rural ‘maximum reasonably foreseeable ‘ accident scenario listed in the DEIS for the Yucca Mountain Facility. The consequences estimated in this report are significantly higher than those estimated in the Yucca Mountain DEIS, primarily due to the assumption of a higher population density and an increased release fraction for cesium.
Radioactive Waste Management Associates

Nevada Spent Fuel Transportation Severe Accident Analysis Page iv
Table ES-1: Comparison of State of Nevada and Yucca Mountain EIS Consequence Assessments : Urban Accidents Urban Truck Accident Urban Rail Accident
State of Nevada, Cat.5a
State of Nevada, Cat.6a
YM DEIS, Cat. 5a
YM DEIS, Cat. 6a
State of Nevada, Cat.5a
State of Nevada, Cat.6a
YM DEIS, Cat. 5a
YM DEIS, Cat. 6a
Acute (24-hour) Population Dose
(person-rem)b 846 not
calculated not
calculated not
calculated 26,171 not calculated
not calculated
not calculated
Expected Latent Cancer Fatalitiesc 0.42-2.7 not
calculated not
calculated not
calculated 13-444 not calculated
not calculated
not calculated
1-year Population Dose (person-
rem)b 29,514 not
calculated not
calculated 9,400 915,968 not calculated
not calculated 61,000
Expected Latent Cancer Fatalitiesc 15-94 not
calculated not
calculated 5 458-2,931 not calculated
not calculated 31
50-year Population Dose
(person-rem)b 407,024 not
calculated not
calculated not
calculated 12,771,207 not calculated
not calculated
not calculated
Expected Latent Cancer Fatalitiesc
204-1,306
not calculated
not calculated
not calculated
6,386-40,868
not calculated
not calculated
not calculated
Dose to Maximally Exposed
Individual (rem)d
3.9 38.5 not calculated 4 22.5 224 not
calculated 26
Area contaminated to greater than 5 rem long-term
dose (km2)
11.1 192.2 not calculated
not calculated 104.7 1208.4 not
calculated not
calculated
a. Release fractions are presented in Tables 1 and 2 of this report b. The Yucca Mountain DEIS assumed an urban population based on the average densities in successive 8-kilometer rings around the 21
largest cities in the continental U.S. The State of Nevada estimated the population of the Las Vegas MSA using data from the 2000 U.S. Census, and with the methodology explained in Section 3 of this report.
c. The Expected Latent Cancer Fatalities, and the probability of increasing a latent cancer fatality, are calculated in the Yucca Mountain DEIS assuming a value of 0.0005 LCFs per person-rem exposure. The State of Nevada presents a range of latent cancer fatalities based on the value of 0.0005-0.0032 LCFs per person-rem exposure. See Section 3, under "Population Dose Estimates for Las Vegas Accidents."
d. The Maximally Exposed Individual was assumed to be located 360 meters downwind of the release in the Yucca Mountain DEIS (pp. 6-31). For comparison, the State of Nevada made the same assumption.
Radioactive Waste Management Associates

Nevada Spent Fuel Transportation Severe Accident Analysis Page v
Table ES-2: Comparison of State of Nevada and Yucca Mountain EIS Consequence Assessments : Rural Accidents
Rural Truck Accident Rural Rail Accident
State of Nevada, Cat.5a
State of Nevada, Cat.6a
YM DEIS, Cat. 5a
YM DEIS, Cat. 6a
State of Nevada, Cat.5a
State of Nevada, Cat.6a
YM DEIS, Cat. 5a
YM DEIS, Cat. 6a
Acute (24-hour) Population Dose
(person-rem)b 799 not
calculated
not calculated
not calculated 393 not
calculated not
calculated not
calculated
Expected Latent Cancer Fatalitiesc 0.4-2.6 not
calculated not
calculated not
calculated 0.2-1.3 not calculated
not calculated
not calculated
1-year Population Dose (person-
rem)b 27,886 not
calculated not
calculated 430 13,760 not calculated
not calculated
not calculated
Expected Latent Cancer Fatalitiesc 14-89 not
calculated not
calculated 0.2 7-44 not calculated
not calculated
not calculated
50-year Population Dose
(person-rem)b 388,326 not
calculated not
calculated not
calculated 191,859 not calculated
not calculated
not calculated
Expected Latent Cancer Fatalitiesc
194-1,243
not calculated
not calculated
not calculated 96-614 not
calculated not
calculated not
calculated Dose to
Maximally Exposed
Individual (rem)d
1.73 17.1 not calculated 3.9 26.9 267 not
calculated not
calculated
Area contaminated to greater than 5 rem long-term
dose (km2)
3.4 33.1 not calculated
not calculated 118.6 1202 not
calculated not
calculated
a. Release fractions are presented in Tables 1 and 2 of this report b. The Yucca Mountain DEIS assumed a rural population based on national averages for a representative rail route. The State of Nevada
estimated the rural truck population based on West Wendover, Nevada, and the rural rail population based on Elko, Nevada. See Sections 4 and 5 of this report.
c. The Expected Latent Cancer Fatalities, and the probability of increasing a latent cancer fatality, are calculated in the Yucca Mountain DEIS assuming a value of 0.0005 LCFs per person-rem exposure. The State of Nevada presents a range of latent cancer fatalities based on the value of 0.0005-0.0032 LCFs per person-rem exposure.
d. The Maximally Exposed Individual was assumed to be located 360 meters downwind of the release in the Yucca Mountain DEIS (pp. 6-31). For comparison, the State of Nevada made the same assumption.
Radioactive Waste Management Associates
Nevada Spent Fuel Transportation Severe Accident Analysis Page 1
Introduction If the proposed Yucca Mountain waste repository opens, a large number of irradiated fuel and high-level waste shipments will converge in Nevada. According to the Department of Energy (DOE), there could be between 23,000 and 96,000 shipments to Yucca Mountain over four decades3. Depending on a range of factors, such as the eventual transportation mode and any safety precautions that may be required, hundreds of accidents are expected nationwide. Some of these accidents could result in release of radioactive materials. DOE has estimated that a maximum reasonably foreseeable truck or rail accident could release enough radioactive materials to cause 4 to 31 latent cancer fatalities. DOE estimates the probability of such accidents at 1.4 to 1.9 in 10 million per year.4
RWMA has previously evaluated DOE's accident consequence estimates. As prior reports prepared for the State of Nevada show5, DOE has systematically underestimated the likely human health impacts of severe accident. Moreover, DOE has completely ignored the potential economic impacts of severe accidents. The cost of cleanup, evacuation and business loss resulting from a severe accident in a generic urban area can range from several billion to several hundred billion dollars. An accident in a rural area will have a different set of consequences, but has the potential to be as devastating as an accident in a more populated area.
Except for population density, the previous analyses were not location-specific.
Assuming average weather conditions, average population density and a selected accident severity, the health effects and economic consequences were calculated using standard computer models, such RADTRAN46 and RISKIND7 and their associated economic models. The accidents assumed in the previous analyses were the “maximum reasonably foreseeable accident scenario” for rail and truck shipments as defined by the Department of Energy (DOE) in the draft Environmental Impact Statement (EIS)8 for the proposed geologic repository at Yucca Mountain, Nevada. Our previous studies did not investigate specific accident locations or specific details about evacuation and decontamination following an accident.
This study estimates site-specific accident consequences for select urban and rural locations in the State of Nevada. These were chosen based on the locations of proposed and likely truck and rail transportation corridors en route to the geologic repository at Yucca Mountain. For the urban scenarios, representative truck and rail locations were chosen in Las Vegas, a potential crossroads for fuel traveling to the proposed facility. The rural truck accident location was chosen to be near the Utah-Nevada border along I-80, in the town of West
3 U.S. Department of Energy, 1999. Draft Environmental Impact Statement for a Geologic Repository of Spent Nuclear Fuel and High-Level Radioactive Waste at Yucca Mountain, Nye County, Nevada. (DOE/EIS-0250D). pp. J-10. 4 Ibid., pp. 6-31 to 6-33. 5 Lamb, M and M Resnikoff, “Consequence Assessment of Severe Nuclear Transportation Accident in an Urban Environment,” Radioactive Waste Management Associates, 5 July 2000 6 Neuhauser and Kanipe, 1992. User’s Guide for RADTRAN 4. SAND89-2370, Sandia National Laboratories. 7 Yuan et al, 1995. RISKIND: A Computer Program for Calculating Radiological Consequences and Health Risks from Transportation of Spent Nuclear Fuel. ANL/EAD-1. Argonne National Laboratory. 8 U.S. Department of Energy, 1999. Draft Environmental Impact Statement for a Geologic Repository of Spent Nuclear Fuel and High-Level Radioactive Waste at Yucca Mountain, Nye County, Nevada. (DOE/EIS-0250D).
Radioactive Waste Management Associates

Nevada Spent Fuel Transportation Severe Accident Analysis Page 2
Wendover. The chosen rural rail location is at the Carlin Tunnel along the Union Pacific and Southern Pacific railroads in western Elko County.
The Las Vegas urban area is an interesting choice for a location-specific accident scenario because it has very unusual, if not unique, economic and demographic characteristics. Potential highway and rail routes to Yucca Mountain traverse the downtown Las Vegas area known worldwide for its large casinos and resort hotels. High population densities are seen at each of the major hotels. A large hotel could contain as many as 10,000 guests and 2,000 employees9. Many hotels and casinos are less than one-half mile from a potential shipping route, and some hotel properties are physically adjacent to proposed routes to Yucca Mountain.
Las Vegas is one of the premiere tourist destinations in the country, attracting nearly 36 million visitors in the year 2000, filling approximately 125,000 hotel rooms10. In the event of a radioactive release, evacuation would be difficult, owing to the highly transient population, the fact that many visitors would not have access to a vehicle, and the concentration of people in a relatively small area. The total time an area remains evacuated may be lengthy while cleanup proceeds. As the center of Nevada’s most important industry, any accident resulting in the closure of large casinos, even if temporarily, will have cascading effects on the economic well-being of residents, local governments and the State.
Other aspects of Las Vegas’ unique nature make calculation of health effects very difficult. It cannot be ascertained at this point whether, for example, a large hotel downwind from a radioactive release would be able to shut off its ventilation system in time to prevent contaminated air from entering the building. If the ventilation system were shut off too late, it would have the effect of trapping radioactive material inside the hotel. On the other hand, given sufficient time to shut off the air intakes to a hotel, the immediate consequences of a release could be reduced. This report addresses these issues.
The rural areas we investigate also exhibit characteristics that could result in very severe radiological accident impacts. The evacuation routes are limited, in some cases limited to one highway. Blockage of an entire direction of evacuation due to a radioactive release would significantly inhibit migration. Water supplies may be close to highways and railroads, creating the possibility of contamination of drinking water. Emergency response capabilities are very limited, compared to urban centers. In addition, the highway and railway characteristics in rural areas may present conditions that allow greater release of radioactive materials, such as increased travel speeds, steep grades and bare rock surfaces.
In this study, specific analyses of severe, yet credible highway and rail accidents at specific locations within the State of Nevada are undertaken. Because of the uncertainty in the mode of transportation to be ultimately used, as well as the vast demographic and geographic differences among likely transportation corridors in Nevada, this study will provide separate consequence assessments for 4 accident scenarios: A severe truck accident and a severe rail accident involving the transportation of spent nuclear fuel through the metropolitan area of Las Vegas, a severe truck accident in the town of West Wendover, near the Nevada-Utah border, and a severe rail accident at the Carlin Tunnel, near the city of Carlin along the Union Pacific and Southern Pacific railroads. At the heart of this study will be an estimation of the breadth and 9 The MGM Grand Hotel has 5,034 rooms. Assuming 2 persons per room, it could contain 10,000 guests at full occupancy. According to the Las Vegas Sun (8/13/2000, ‘Casinos Compete for Job Hopping Workers, ‘ the MGM Grand has 8,000 employees. This study assumes 25% of these employees are working at any given time. 10 Las Vegas Convention and Visitors Authority 2000 Executive Summary.
Radioactive Waste Management Associates

Nevada Spent Fuel Transportation Severe Accident Analysis Page 3
depth of contamination under each scenario and an evaluation of the real ability and cost to evacuate and decontaminate the exposed areas. These evaluations will necessarily focus on different factors for the rural and urban areas.
We first must assess what is a credible accident at the specific chosen locations. In Las Vegas, population densities might be high at specific potential accident locations, but vehicle speeds may be low. That is, at certain locations, a potential accident might not be sufficiently severe to lead to a release of radioactive particulates. Or, high impact accidents may be possible at specific locations, but the population density may be low. In Section 1, we discuss the specific locations we considered for potential accidents, and the type of accidents that are credible at those locations. For each of these accidents, we discuss the radionuclide inventory that may be released. In Section 2, we discuss the downwind radioactive particulate and gas concentrations in air and surface concentrations of particulates. This information is used to estimate the potential inhalation exposures to individuals outside and within buildings, and the direct gamma dose rates due to deposited radionuclides. The information is also used to determine potential remediation alternatives and economic costs. In Section 3 we discuss the specific situation in Las Vegas for truck and train accidents. We estimate the population density in the tourist areas of Las Vegas, and the health impact to visitors outside and within hotels. We also estimate the surface concentrations inside and outside hotels and the effort and cost to decontaminate horizontal (streets, sidewalks) and vertical (side of buildings) surfaces. This section also investigates the ability to evacuate residents and visitors. In Section 4, we discuss the specific situation for truck and train accidents in rural areas of Northern Nevada.
Radioactive Waste Management Associates

Nevada Spent Fuel Transportation Severe Accident Analysis Page 4
1. Accident Locations and Potential Radionuclide Releases
Accident Locations
Together with Robert Halstead, Nevada Nuclear Waste Projects Office, we investigated potential accident locations in greater Las Vegas and in select rural areas in northern Nevada. The chosen locations provide a range of potential severe accident scenarios, from the high-density areas along the Las Vegas Strip to the relatively remote areas near the Carlin Tunnel. The decision to perform a consequence assessment for an accident occurring at a specific location was made in order to provide a hypothetical exercise with which to estimate damages and test the capacity of emergency response. Obviously, it is impossible to predict the precise location of an accident, its severity, and the meteorological conditions at the time of the accident. However, it is instructive to provide a hypothetical scenario as a representative possibility of what could happen if there is a severe accident at various points in Nevada. Because we are not suggesting that an accident will happen at the locations chosen, analysis of specific entities, such as potential indoor building contamination, is treated generically. For example, a representative hotel is modeled to estimate what the consequences could be in the event of an accident. Keeping in mind that the chosen locations are intended to be representative, and that this study is in no way predicting the location of accidents, we investigate the following scenarios:
Clark County/Las Vegas Potential Accident Locations
Truck: A. The chosen location is at the interchange of Interstates I-80 and I-15 in Las Vegas,
referred to as the “spaghetti bowl.” More specifically, the scenario will involve a truck traveling on I-15 going into the spaghetti bowl. Speeds at this location can approach 70 miles per hour, and there is the possibility of a severe crash into a bridge abutment, a fall from an elevated highway structure, and/or collision with other vehicles hauling gasoline or other hazardous materials. Wind data from the McCarran International Airport is employed to obtain an average wind direction, speed, and stability category (see Figure 1).
Rail: B. The chosen location is on a stretch of the Union Pacific rail line between Flamingo
Avenue and Spring Mountain Road. Along this stretch, the UP goes underneath I-15, and at one point is approximately 20 feet from the parking lot of a hotel. Potential accident scenarios include derailment of a runaway train and/or collision with a train hauling explosive or flammable materials. There is a petroleum pipeline running alongside the railroad tracks at this point, creating the possibility for a severe thermal environment in the event of an accident. The same meteorological data which is used in the truck accident scenario is also employed here.
Rural Counties/Potential Accident Locations
Radioactive Waste Management Associates

Nevada Spent Fuel Transportation Severe Accident Analysis Page 5
Truck: C. The chosen location of the severe rural truck accident is on I-80 near the Utah/Nevada
border, at the West Wendover exit. Due to the relatively remote nature of this location, trucks can be expected to travel at fairly high speeds, giving the possibility of a severe impact scenario. Westbound trucks have been observed traveling 55 to 65 mph at this location, and eastbound trucks have been observed traveling at 65 to 75 mph. The short distance and absence of dividers between the east- and westbound lanes creates the possibility for high-speed, head-on collisions11. Rocky outcroppings along the westbound highway wayside create the possibility of an impact collision onto a hard surface. Wind data was obtained from the Wendover Air Field in Utah, very close to the potential accident location. Because of the geography near the location (salt flats to the east and mountains to the west), the most likely wind direction is out of the east. Figure 2 presents the wind rose used to obtain average meteorological conditions for this location.
Rail:
D. The chosen location of the severe rural rail accident is on the Union Pacific and Southern Pacific lines that run near I-80 in Elko County at the entrance to the Carlin Tunnel. This accident location has been chosen because it is upwind of farming areas, a major river, and the City of Elko. An accident at this location would also likely cause the closure of I-80. Hazardous materials are routinely shipped along this route, including tanker shipments of propane to a terminal at Beowawe. In the event of a derailment involving cars containing flammable materials, the tunnel creates the possibility of a long-duration fire. Wind data was obtained from the Elko Airport in Elko, approximately 20 miles to the northeast of the proposed accident location. Figure 3 presents the wind rose used to obtain average meteorological conditions for this location.
Release Estimates
The question of how much radioactivity may be released in an accident of a given severity is a contentious one. Currently, there are no plans to physically test to destruction the transportation casks likely to be used for the transcontinental spent fuel shipping campaign to the proposed facility at Yucca Mountain. Instead, several studies have been conducted by the Nuclear Regulatory Commission or its contractors to estimate cask response to accident conditions using computer modeling. Different studies have focused on different criteria for correlating accident severity with cask damage. For example, one NRC-contracted research team correlated cask damage with strain to the inner cask wall12, while a more recent study by Sandia National Laboratory primarily focused on the bolts and seal in the lid region of the cask.13 For this study, we have elected to use the cask response estimates derived by the Modal Study
11 Personal Communication with Robert Halstead, Nevada Nuclear Waste Projects Office, 8/29/01. 12 Fischer, LE, et al, Shipping Container Response to Severe Highway and Rail Accident Conditions: Main Report (Technical Report), Lawrence Livermore National Laboratory, NUREG/CR-4829-v1-v2, February 1987. Referred to as “The Modal Study” in this report. 13 Sprung, JL et al, Reexamination of Spent Fuel Shipping Risks Estimates, Sandia National Laboratories, NUREG/CR-6672, March 2000
Radioactive Waste Management Associates

Nevada Spent Fuel Transportation Severe Accident Analysis Page 6
with certain modifications to account for information obtained since its publication. The Sandia study, referred to as NUREG/CR-6672, was not used in this report for reasons discussed below and in Appendix A, even though the focus on the bolts is considered an improvement over the Modal Study.
The more recent NRC-sanctioned cask response study, NUREG/CR-6672, contains certain flaws which result in a non-conservative estimation of container response to severe stresses. In its peer review of NUREG/CR-6672, Lawrence Livermore National Laboratory (LLNL), the researchers for the Modal Study, have raised valid criticisms regarding the modeling of the bolt and seal area of the lid which are critical to the size opening during an accident and the amount of radioactivity released. In particular, when predicting strain on the seal regions and the bolts, NUREG/CR-6672 did not explicitly model the grooved region between the cask lid and the lid well. Rather, it estimated the deformation “at a location near where the O-rings would be located.”14 Further, the modeling assumed “that the cask wall and lid are much stiffer than the closure bolts, and the opening displacements are the result of displacement discontinuities between the cask body and lid, and are not greatly affected by bolt clamping force.”15 We agree with LLNL that the model of the bolt region is overconstrained and underpredicts the size of the potential opening under stress. Underpredicting the size of the cask-to-environment leak opening has cascading effects on the estimation of releases in the event of an accident. A more detailed discussion of our criticisms of NUREG/CR-6672 appears in Appendix A.
The Modal Study release estimates were therefore used, with important modifications to account for information obtained since its publication. These modifications are discussed below, according to the three barriers that must be breached for a radioactive release to the environment to occur.
Fuel Matrix
When fuel is heated in reactors, a percentage of volatile radionuclides, such as cesium, will migrate out of the fuel matrix under the influence of temperature gradients and concentrate in the fuel-clad gap.16 This “gap cesium” inventory is directly related to the release fraction in the event of an accident because it can be released in the event of any cladding breach. In fact, virtually all of the cesium released from the fuel in the event of a spent fuel shipping accident will be this “gap cesium.” For the fuel matrix, the Modal Study assumes 0.3% of the cask inventory of cesium will be present between the cladding and the fuel pellet.17 However, for reasons discussed in Appendix A, we believe that the estimate made by Gray et al (9.9% gap cesium inventory) is on more solid experimental ground. Assuming the cesium release fraction is directly proportional to the gap inventory, we intend to increase the release fraction posited in the Modal Study by a factor of 33. For particulates and gases, other release fractions apply, as discussed below.
14 NUREG/CR-6672, pg. 5-11 15 ibid. 16 Gray and Wilson, Spent Fuel Dissolution Studies, FY1994 to 1994. Pacific Northwest Laboratories. PNL-10540, 1995. 17 The Modal Study uses the results of experiments recorded in : SAND90-2406, 1992. Sanders et al. A Method for Determining the Spent Fuel Contribution to Transport Cask Containment Requirements. Sandia National Laboratories.
Radioactive Waste Management Associates

Nevada Spent Fuel Transportation Severe Accident Analysis Page 7
In addition, the Modal Study does not adequately consider CRUD spallation in the event of an accident. In our analysis, we assume an independent estimate for this source term, using the procedure outlined in the RISKIND User’s Manual18.
Rod Cladding Breach
A rod cladding breach could be caused by an impact or internal rod pressure due to high temperature. We discuss impact and fuel temperature breaches separately.
Impact Contrary to the discussion in the Topical Safety Analysis Report for the HI-STAR transportation cask19 and physical intuition, the Modal Study assumes the rods are most susceptible to breach in an end-on impact20. Figure 8-3 in the Modal Study presents the researchers’ assumption that 3% of fuel rods break at a strain of 0.2% on the cask inner shell, that is, acceleration < 40g. 10% are assumed to break in under 2% strain (>40g), and all rods are assumed to break for the most severe category, loads >100g. The analysis presented in the Holtec Topical Safety Analysis Report, conversely, assumes that a sideways impact > 63g is sufficient to shatter the cladding. All impact accidents we consider here have a deceleration greater than 63g. Therefore, we assume that 100% of the cladding is shattered by impact under the accident conditions considered.
Burst Rupture For a burst rupture due to high temperature and internal pressure, the Modal Study assumes no breach for mid-thickness temperatures less than 650 oF, and 100% breach for temperatures greater than 650oF.21 For temperatures greater than 400 oF, fuel oxidation can occur under aerobic conditions, and UO2 oxidizes to U3O8. Oxidation releases additional amounts of cesium and creates particulates. We discuss the potential fire duration necessary to cause burst rupture below.
Cask Opening
The Modal Study assumes all radioactive material released from a fuel rod into the cask cavity is released if a leak path exists in the containment cask, and it further assumes a leak path exists for any accident with maximum strain > 0.2% or lead mid-thickness temperature > 500 oF.22 Under the accident classification scheme adopted by the Yucca Mountain draft EIS, the temperature of the mid-lead thickness of a cask must exceed 650 oF for a Category 4 accident. For a Category 5 accident, impact must produce strain > 2%. Both Category 4 and 5 accidents
18 Yuan et al. RISKIND-A Computer Program for Calculating Radiological Consequences and Health Risks from Transportation of Spent Nuclear Fuel. Argonne National Laboratories, ANL/EAD-1, 1995. 19 Topical Safety Analysis Report for the HI-STAR 100 Cask System. Holtec Report No. HI-941184, 1998. 20 Modal Study, pg. 8-7 21 Modal Study, pg. 8-10 22 Modal Study, pg. 8-12
Radioactive Waste Management Associates

Nevada Spent Fuel Transportation Severe Accident Analysis Page 8
lead to identical cesium releases, according to the Modal Study, and both event types are considered plausible in the Las Vegas area and in the chosen locations of the rural accidents.
Thermal Severity: Potential for Seal Failure
The potential thermal severity of a given accident is a strong function of the location and circumstances surrounding it. The presence of a large source of flammable material is necessary to sustain a fire, since the spent fuel casks themselves are not combustible. Collision with a rail tanker carrying flammable material, or the rupture of a petroleum or gas pipeline located near the crash site, are possible fuel sources for a long-duration fire. Of the accident locations chosen, the Las Vegas scenarios are located near potential sources of flammable material; therefore a high-temperature fire is a possibility. For the rural scenarios, the possibility that the rail could carry combustible material creates the possibility for a high-temperature, long-duration fire. The potential accident in West Wendover is less likely to be accompanied by a high-temperature fire, although this possibility cannot be ruled out. West Wendover is a major gasoline refueling site, so it is common for gasoline tankers to be near the site of the hypothetical accident. An accident could result in a fire raising the temperature of a steel-depleted uranium-steel cask above the temperatures causing seal degradation. The Modal Study considers seal degradation to begin at 500 oF. However, the seals used in current-generation casks differ from those modeled by the Modal Study. NUREG/CR-6672 presents temperature profiles for steel-DU-steel cask subjected to long-duration engulfing fires of 800oC and 1000oC23. Interpolating from this profile (1000oC fire, the flame temperature of diesel fuel), we estimate that a steel-DU-steel cask subjected to a 1000oC engulfing fire would heat to 500 oF in approximately 25 minutes (41 minutes for an 800oC fire).
The above temperature limits are not applicable to the GA-4 truck cask since the bolted closure uses a pair of ethylene propylene gaskets24. These gaskets operate properly below 400 oF. A study performed by M. Greiner of the University of Nevada calculates the time to reach 400 oF based on fire temperature and cask condition. Since the impact limiter protects the cask seal region, the duration will depend on whether the cask is intact or the impact limiter is missing. According to this study, the time for the seal area to reach 400 oF is 2 hours for an intact cask in a 1000 oC fire, and only 0.4 hrs without the impact limiter. A fire of sufficient strength and duration necessary to degrade cask seals is considered plausible in all of the scenarios examined here.
Thermal Severity: Potential for Cladding Failure
Another significant temperature criterion is the temperature required for fuel cladding to degrade. Greiner chooses 1100 oF. For an intact GA-4 truck cask, the cladding temperature would reach 1100 oF in 3 hours in a 1000 oC fire. Without a neutron shield, the time would be 0.9 hours. According to NUREG/CR-6672, a typical experimental pool fire with fuel from one tanker truck can last 60 minutes25. Thus, fires resulting in casks exceeding 1100 oF are fairly 23 NUREG/CR-6672, Table 6.6 24 Greiner, M, “Spent Nuclear Fuel Shipping Cask Performance in Severe Accident Fires: Performance Envelope Analysis, Fire Environment Modeling and Full-Scale Physical Testing,” U of Nevada, July 20, 2000. 25 NUREG/CR-6672, pg. 6-6
Radioactive Waste Management Associates

Nevada Spent Fuel Transportation Severe Accident Analysis Page 9
rare, needing a significant source of very high-burning fuel. For our analysis, we consider the possibility of a post-accident thermal environment to cause cask cladding to degrade to be small. It should be noted, however, that the proximity of petroleum and gas pipelines to the Las Vegas rail accident location suggests that this type of accident would be possible at this location.
Structural Severity
According to the Modal Study, Category 5 accidents produce greater than a 2% strain on the cask inner wall, and Category 6 accidents produce strain greater than 30%. The Modal Study estimated that a 2% strain on the cask inner wall could occur in an end-on impact with an unyielding target at a velocity of 46 mph26. For a truck cask, a 30% strain on the cask inner wall could occur in an end-on impact with an unyielding target at a velocity of 76 mph27. A 2% strain assuming a side impact with a train sill (or similar immovable object such as a bridge abutment) could occur at a speed of 20 mph28. For a rail cask, the minimum side impact speed would be 27 mph. A 30% strain due to side impact would occur at 105 mph (train) or 150 mph (truck). In our opinion, the accident speeds required to produce a 2% strain are plausible in Las Vegas and in rural counties. The category 6 accidents, requiring substantial stresses and thermal loads, were considered by the Department of Energy in its analysis of the maximum reasonably foreseeable accident scenario. For comparison, we will also provide an analysis of this type of accident.
Postulated Release Fractions and Inventory
To estimate the release fractions to be used in this study, we take the results from the Modal Study accidents corresponding to severity category 5 as used in the Yucca Mountain DEIS, correcting for the additional cesium believed to be in the fuel-cladding gap. Table 1 summarizes differences between the assumptions in this report and those made for the Yucca Mountain DEIS. Table 2 presents the release fractions used in this report, along with a comparison to those used in the Yucca Mountain DEIS. Table 3 presents the amount of material released under the various scenarios listed in Table 2.
26 Modal Study, pg. 7-5 27 ibid. 28 Modal Study, Table 6.3
Radioactive Waste Management Associates

Nevada Spent Fuel Transportation Severe Accident Analysis Page 10
Table 1: Comparison of accident scenarios used in this study with those used in the Yucca Mountain DEIS
Yucca Mountain DEIS This Study
“Maximum Reasonably Foreseeable” accident scenario based on probability
No estimate of probability
Risk and Consequence Assessments performed
Consequence Assessment only
Estimated consequences for severity category 6 truck and accidents in urban locations and a severity category 6 truck accident in a rural location
Estimated consequences for severity category 5 and 6 truck and rail accidents in urban and rural locations
26 year-cooled PWR fuel having a burnup of 39,560 MWD/MTU assumed
5 year-cooled PWR fuel having a burnup of 39,560 MWD/MTU assumed
0.3% of cesium inventory assumed in Fuel-Clad Gap
9.9% of cesium inventory assumed in Fuel-Clad gap
Meteorological conditions based on national averages
Site-specific meteorological averages used
CRUD inventory not explicitly modeled Assumes that all CRUD is released to environment in the event of a rod failure
No discussion of economic impacts Economic impacts, including cost of decontamination and evacuation, discussed
Table 2: Comparison of Various Release Fractions for Severe Spent Fuel Transportation Accidents
Release Fractions
Category 5 Category 6
Radionuclide Class
YMEIS State of Nevada* YMEIS State of Nevada*
Inert gas 3.90E-01 3.90E-01 6.30E-01 6.30E-01 Iodine 4.30E-03 4.30E-03 4.30E-02 4.30E-02 Cesium 2.00E-04 6.60E-03 2.00E-03 6.60E-02 Ruthenium 4.80E-05 4.80E-05 4.80E-04 4.80E-04 Particulates 2.00E-06 2.00E-06 2.00E-05 2.00E-05 CRUD 1.00E+00 1.00E+00 1.00E+00 1.00E+00
*For these accidents, the Cesium release fractions are increased by a factor of 33 to account for the results of Gray et al regarding gap cesium inventory.
Radioactive Waste Management Associates

Nevada Spent Fuel Transportation Severe Accident Analysis Page 11
Table 3: Release Estimates for Various Accident Severities Amount Released, Curies
Category 5 Truck Accident
Category 6 Truck Accident
Category 5 Rail Accident
Category 6 Rail Accident
Radio-nuclide Class
Truck Inventory*
(Rail Inventory)
YMEIS State of Nevada YMEIS State of
Nevada YMEIS State of Nevada YMEIS State of
Nevada
Gas 1.38E+04 (8.26E+04) 5.39E+3 5.39E+3 8.67E+3 8.67E+3 3.22E+4 3.22E+4 5.20E+4 5.20E+4
I 0.00E+00 (0.00E+00) 0.00E+0 0.00E+00 0 0 0.00E+0 0.00E+00 0 0
Cs 2.64E+05 (1.58E+06) 5.28E+1 1.74E+3 5.28E+2 1.74E+4 3.16E+2 1.05E+4 3.16E+3 1.05E+5
Ru 6.32E+04 (3.8E+05) 3.03E+0 3.03E+0 3.04E+1 3.04E+1 1.82E+1 1.82E+1 1.82E+2 1.82E+2
Part. 8.25E+05 (4.96E+06) 1.65E+0 1.65E+0 1.65E+1 1.65E+1 9.90E+0 9.90E+0 9.90E+1 9.90E+1
CRUD 8.71E+03 (5.23E+04) 5.49E+0 5.49E+0 6.09E+0 6.09E+0 1.70E+1 1.70E+1 1.80E+1 1.80E+1
*Spent Fuel Inventory Assumes 5-year cooled PWR fuel having a burnup of 40,000 MWD/MTU. Truck casks are assumed to hold 4 PWR assemblies, and rail casks are assumed to hold 24 assemblies.
It is important to note the decision to use 5-year cooled fuel for both the truck and rail accident scenarios. Currently, there are no licensed rail casks that are capable of shipping 5-year cooled fuel, and there are no casks in development to do so. However, it cannot be predicted whether such casks will be produced before fuel begins shipping to Yucca Mountain. Further, the recent issuance of a supplement to the Yucca Mountain DEIS29 implies an abandonment of its “oldest fuel first” policy, proposing either the blending of hotter and cooler commercial spent nuclear fuel assemblies, the cooling of hotter fuel within an open, vented repository, or use of above-ground storage at the repository to cool fuel. To do any of these, hotter fuel will have to be shipped to the repository compared with the assumptions in the Yucca Mountain DEIS and the “oldest fuel first policy.” This results in the need for shipment of recently-discharged assemblies.
For comparison, we used the RISKIND computer code to predict the release amounts and
acute dose estimates for the Category 5 rail accident scenario. Assuming 10-year instead of 5-year cooled fuel results in a decrease in the acute dose by approximately 30%, and a decrease in the 50-year long-term dose by approximately 20%.
Severity of the Accidents Being Considered in this Analysis
In developing a consequence assessment of specific accidents occurring at specific locations, the usual probabilistic approaches to determining the “maximum reasonably foreseeable” accident scenario are irrelevant. It is impossible to predict the exact location and severity of any
29 U.S. Department of Energy, May 2001. Supplement to the Draft Environmental Impact Statement for a Geologic Repository for the Disposal of Spent Nuclear Fuel and High-Level Radioactive Waste at Yucca Mountain, Nye County, Nevada. DOE/EIS-0250D-S.
Radioactive Waste Management Associates

Nevada Spent Fuel Transportation Severe Accident Analysis Page 12
accident, making discussions about the probability of the exact accidents described in this study moot. For example, in its draft Environmental Impact Statement for the proposed geologic repository at Yucca Mountain, the Department of Energy classified the “maximum reasonably foreseeable” accident to be the most severe accident having an annual probability of occurrence of at least 1 in 10 million per year30, this probability being based on accident rates, meteorology, and certain route characteristics (such as the frequency of time spent in an urban environment throughout the shipping campaign). While we differ with DOE’s probability analysis31, this is not an issue addressed in this report. For our analysis, we rely on the determination of whether a given accident is credible at the chosen locations. Because we cannot predict the exact conditions at the time of the hypothetical accident for each site, we have used a variety of “average” statistics, such as wind conditions and population densities. Therefore, our analysis does not assess such “worst conditions” scenarios as a severe accident in Las Vegas during the peak visitor season, opting instead to present an average population density based on yearly statistics.
For each accident scenario, we provide two separate consequence assessments: a category 5 and category 6 accident. The category 6 accident scenario is considered by the DOE to be most severe accident that could credibly happen en route to the Yucca Mountain Repository. For the specific accident locations chosen in this study, we concentrate on the category 5 accident scenarios, after judging them to be the most credible severe accidents (see our section entitled “Release Estimates,” above). Therefore, the accidents postulated in this report are not “worst-case” scenarios in the sense that one could not imagine a worse situation from happening. Rather, they are severe, yet credible, accidents, with the understanding that they are meant to be representative of the types of severe accidents that could happen in different areas of Nevada and the country.
30 YM DEIS at J-60 31 See, e.g., Nevada Agency for Nuclear Projects, February, 2000. State of Nevada Comments on the U.S. Department of Energy’s Draft Environmental Impact Statement for a Geologic Repository for the Disposal of Spent Nuclear Fuel and High-Level Radioactive Waste at Yucca Mountain, Nye County, Nevada. Part 3, Specific Comments. pp. 116-124
Radioactive Waste Management Associates

Nevada Spent Fuel Transportation Severe Accident Analysis Page 13
2. Downwind Radioactive Particulate Concentrations
Based on the release estimates made in the previous section, we next estimate the downwind air and surface concentrations of radioactive particulates and gases resulting from the hypothetical accident scenarios. In a severe truck or rail accident, radioactive particulates and gases would be released and wafted downwind. People downwind and outdoors would then inhale these particulates and receive a radiation dose. Depending on the actions taken by emergency response officials and building personnel, persons inside buildings may or may not receive a radiation dose due to inhaling particulates from the passing radiation cloud. If ventilation systems remain open during the passage of the radioactive cloud, we also calculate the inhalation doses and surface contamination within a large building or hotel. Particulates would settle on the ground, plants and surface streams. Gamma radiation emanating from the ground (groundshine) would also give rise to a radiation dose, the amount depending on the ground concentrations and the length of time a person remains in the contaminated area. In this study, we calculate the estimated air and ground deposition concentrations resulting from the release of spent nuclear fuel particulates and radioactive gas resulting from the four accident scenarios described above. From the air concentrations, we estimate the amount of radioactivity inhaled and the potential radioactive dose. From the ground concentrations, we determine the direct gamma exposure (groundshine) and discuss the nature and extent of the surface contamination.
It must be noted that the behavior of the plume following the release of radioactive material will differ depending on the presence or absence of a hot thermal environment. For our analysis, we have essentially assumed a ground-level puff release with a moderate effective release height. A high-temperature fire would raise the effective release height, thereby reducing the contamination near the accident scene but spreading it out over a larger area. A fire-only accident (without a collision) would lead to continued volatilization of cesium and a more gradual release of radioactivity than assumed in our calculations, which considered an instantaneous release.
Two computer programs, RISKIND32 and HotSpot33, were used to develop contaminant plumes for the four accident scenarios. RISKIND was developed at Argonne National Laboratories and designed to estimate the risks and consequences of spent fuel shipping accidents. HotSpot was developed at Lawrence Livermore National Laboratories and is used to estimate levels of airborne radioactivity and radioactive contamination following an accident. Both use standard Gaussian plume dispersion equations to estimate airborne concentrations and ground deposition of radionuclides. The spent nuclear fuel inventory obtained from RISKIND was used to develop the spent fuel inventory for use in both computer simulations.
HotSpot is useful because the meteorology (wind speed, stability class, and direction) can be inputted and the program will develop contaminant plumes that can then be imported into GIS software and displayed on maps of Las Vegas and northern Nevada. The meteorological conditions used were inferred from data collected from the closest available center. For the Las 32 . Yuan et al. RISKIND-A Computer Program for Calculating Radiological Consequences and Health Risks from Transportation of Spent Nuclear Fuel. Argonne National Laboratories, ANL/EAD-1, 1995. 33 “Hotspot Health Physics Code, Version 1.06.” Lawrence Livermore National Laboratory. Steven G. Homann, contact.
Radioactive Waste Management Associates

Nevada Spent Fuel Transportation Severe Accident Analysis Page 14
Vegas accident scenarios, a wind speed of 4.6 m/s, from the southwest, and moderately stable conditions were assumed. For the West Wendover accident, a wind speed of 2.6 m/s from the east, and unstable conditions were assumed. For the Carlin Tunnel accident, a wind speed of 3.6 m/s from the southwest, and moderately stable conditions were assumed.
One limitation of the calculations provided below is the decision to use a constant wind velocity and direction, which tends to limit the area that is calculated to be effected by the release. This is a limitation of the models we used in this report. A more accurate approach would be to model the wind conditions as variable with time over the course of the accident and plume dispersal. Because of the possibility of variation in wind direction, emergency response officials might initially choose to evacuate a radius around the accident scene, rather than just those downwind, to protect those nearby from shifting wind directions. This has been the general procedure in chemical accidents resulting in airborne releases34. In Figures 1, 2 and 3, wind roses are shown for Las Vegas and the two northern rural locations. The HotSpot program was used to estimate dispersion patterns and acute dose plumes. For long-term dose estimates, RISKIND was employed, since HotSpot does not provide long-term dose estimates. The acute dose estimates compare favorably between HotSpot and RISKIND, as is shown in Tables 4 and 5.
34 See, e.g. Liverman and Wilson. “The Mississauga Train Derailment and Evacuation. 10-16 November 1979.” Canadian Geographer xxv, 4, 1981. pgs. 365-375.
Radioactive Waste Management Associates
Nevada Spent Fuel Transportation Severe Accident Analysis Page 15
3. Las Vegas Specific Accident
In this section we discuss the specific situation in Las Vegas for truck and rail accidents. We first estimate the ground and air contamination resulting from the postulated accidents. Using this, we estimate individual doses to persons downwind from the accident. Next, we estimate the population density, both in the tourist and residential areas of Las Vegas, and the health impact to persons outside and within hotels. We also estimate the surface concentrations and the effort and cost to decontaminate horizontal (e.g., streets, sidewalks) and vertical (e.g., side of buildings) surfaces. This section also investigates emergency response including the ability to evacuate residents and visitors.
Individual Dose and Surface Contamination Estimates
For a severity category 5 accident, the acute dose plume diagrams for truck and rail accidents in Las Vegas are shown in Figures 4 and 5. Figures 6 and 7 present the 50-year long-term dose isopleths for the truck and rail accident, respectively, while Figures 8, 9a and 9b present the ground contamination isopleths for these accidents. Isopleths of constant dose are shown. 24-hour acute doses of 5 rems to an individual extend almost 1 km downwind for a rail accident. For an acute dose of 1 rem, the plume extends more than 2 km downwind. For a truck accident, because of the reduced inventory, the downwind distances for acute doses of 5 rem and 1 rem are 0.3 km and 0.8 km, respectively.
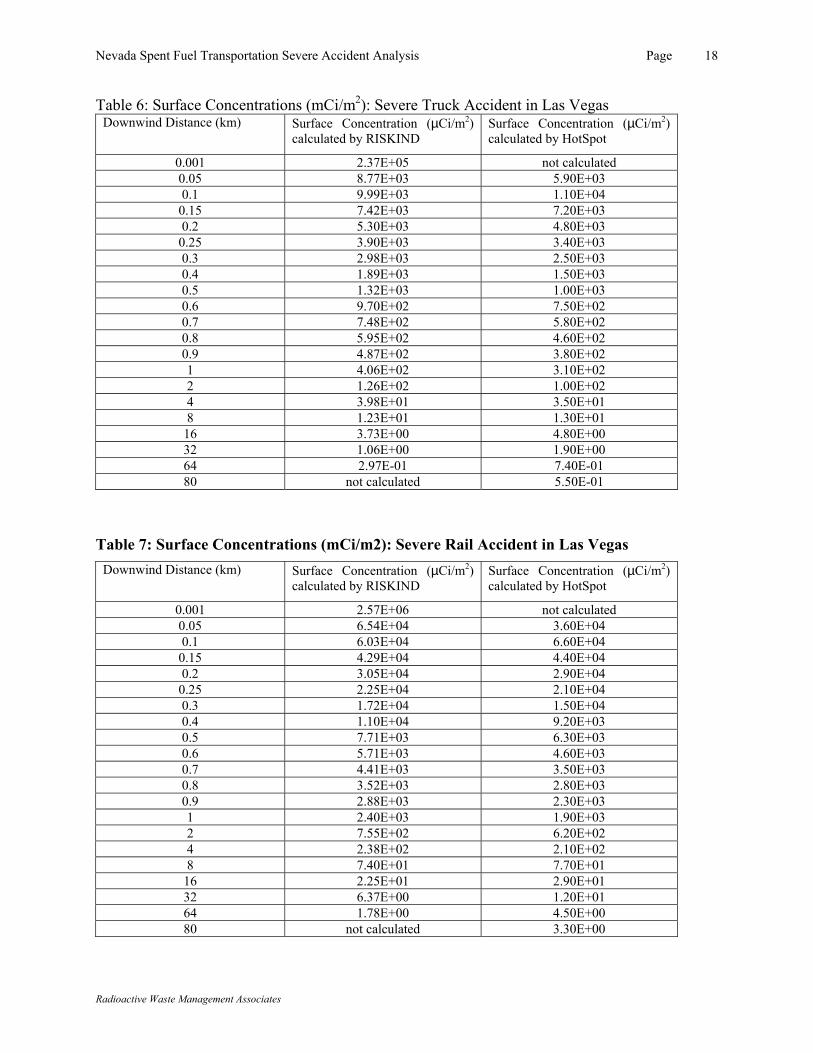
In Tables 4 and 5, individual acute 24-hour doses, along with the long-term doses, are given for downwind distances up to 80 km for truck and rail accidents in Las Vegas. In Tables 6 and 7, the downwind surface concentrations are given for truck and rail accidents, respectively. These results were used to estimate the long-term dose due to gamma radiation from deposited cesium and cobalt, assuming no cleanup. The results are also employed to determine the remediation methods. In Tables 8 and 9, the outdoor downwind air concentrations for truck and rail accidents are shown, respectively. The outdoor air concentrations are employed to determine the indoor air concentrations in hotels where visitors are concentrated. In the next section, we estimate the population density along the Strip to determine the total population dose to visitors, casino and hotel workers, and residents.
Three time periods are considered in this analysis because it is difficult to predict the sociopolitical and psychological factors that would come into play in an accident of this magnitude. As discussed below, it is highly likely that the population will be exposed to the passing radioactive cloud since this will occur within minutes of the accident. This is the acute (24-hour) dose calculated below. Whether a person is exposed to a 1-year or 50-year dose, primarily due to direct gamma due to deposited cesium and cobalt, will depend on complicated sociopolitical and economic factors that are beyond the scope of this report. If social stigma implies that future visitors will avoid Las Vegas, then the number of jobs will be reduced and employees may leave the area. Cleanup may take a year, likely longer, to reduce dose rates below the EPA’s Protective Action Guides, when evacuated residents may return. Cleanup involves a massive, expensive effort; for example, streets, sidewalks and buildings may have to
Radioactive Waste Management Associates

Nevada Spent Fuel Transportation Severe Accident Analysis Page 16
be replaced. If money, potentially up to several hundred billion dollars, is not forthcoming to pay for the cleanup, then residents could be subjected to a 50-year dose. That is, the 1-year and 50-year dose is avoidable, if funds are available. Thus, our estimates bound all likely possibilities.
In Appendix B, corresponding tables are presented for category 6 accidents.
Table 4: Individual Dose Estimates: Severe Truck Accident in Las Vegas Downwind
Distance (km) Acute (24-hour) Dose
Calculated by RISKIND*, rem
Acute (24-hour) Dose
Calculated by HotSpot, rem
1-year Long-Term Dose** Calculated By RISKIND, rem
50-year Long-Term Dose** Calculated By RISKIND, rem
0.001 3.82E+02 not calculated 1.29E+04 1.80E+05 0.05 1.41E+01 9.10E+00 4.81E+02 6.69E+03 0.1 1.62E+01 1.70E+01 5.60E+02 7.80E+03
0.15 1.21E+01 1.10E+01 4.23E+02 5.88E+03 0.2 8.69E+00 7.30E+00 3.05E+02 4.24E+03
0.25 6.43E+00 5.10E+00 2.26E+02 3.15E+03 0.3 4.95E+00 3.80E+00 1.74E+02 2.42E+03 0.4 3.19E+00 2.30E+00 1.12E+02 1.56E+03 0.5 2.23E+00 1.60E+00 7.87E+01 1.09E+03 0.6 1.67E+00 1.10E+00 5.85E+01 8.16E+02 0.7 1.29E+00 8.80E-01 4.55E+01 6.33E+02 0.8 1.03E+00 7.00E-01 3.64E+01 5.07E+02 0.9 8.50E-01 5.70E-01 3.00E+01 4.17E+02 1 7.13E-01 4.80E-01 2.51E+01 3.50E+02 2 2.32E-01 1.50E-01 8.17E+00 1.14E+02 4 7.69E-02 5.30E-02 2.71E+00 3.77E+01 8 2.56E-02 1.90E-02 9.01E-01 1.25E+01
16 8.49E-03 7.30E-03 2.99E-01 4.15E+00 32 2.73E-03 2.90E-03 9.59E-02 1.33E+00 64 8.79E-04 1.10E-03 3.08E-02 4.28E-01 80 Not calculated 8.40E-04 Not calculated Not calculated
*RISKIND Dose Calculations based on sum of contributions from Cask exposure, groundshine, inhalation, and cloudshine.
**Long Term Dose due to Groundshine, Inhalation, and Cloudshine. Ingestion of contaminated food/water not considered.
Radioactive Waste Management Associates

Nevada Spent Fuel Transportation Severe Accident Analysis Page 17
Table 5: Individual Dose Estimates: Severe Rail Accident in Las Vegas Downwind
Distance (km) Acute (24-hour) Dose
Calculated by RISKIND*, rem
Acute (24-hour) Dose
Calculated by HotSpot, rem
1-year Long-Term Dose** Calculated By RISKIND, rem
50-year Long-Term Dose** Calculated By RISKIND, rem
0.001 4.12E+03 not calculated 1.44E+05 2.01E+06 0.05 1.05E+02 5.50E+01 3.65E+03 5.10E+04 0.1 9.69E+01 1.00E+02 3.39E+03 4.73E+04
0.15 6.96E+01 6.70E+01 2.43E+03 3.39E+04 0.2 4.98E+01 4.40E+01 1.75E+03 2.43E+04
0.25 3.70E+01 3.10E+01 1.29E+03 1.80E+04 0.3 2.85E+01 2.30E+01 9.97E+02 1.39E+04 0.4 1.85E+01 1.40E+01 6.46E+02 9.02E+03 0.5 1.30E+01 9.50E+00 4.55E+02 6.35E+03 0.6 9.72E+00 7.00E+00 3.40E+02 4.74E+03 0.7 7.56E+00 5.30E+00 2.64E+02 3.69E+03 0.8 6.07E+00 4.20E+00 2.12E+02 2.96E+03 0.9 5.00E+00 3.50E+00 1.75E+02 2.44E+03 1 4.20E+00 2.90E+00 1.47E+02 2.05E+03 2 1.38E+00 9.40E-01 4.80E+01 6.70E+02 4 4.58E-01 3.20E-01 1.59E+01 2.23E+02 8 1.52E-01 1.20E-01 5.33E+00 7.44E+01
16 5.06E-02 4.40E-02 1.77E+00 2.47E+01 32 1.63E-02 1.80E-02 5.69E-01 7.95E+00 64 5.24E-03 6.80E-03 1.83E-01 2.55E+00 80 Not calculated 5.00E-03 Not calculated Not calculated
*RISKIND Dose Calculations based on sum of contributions from Cask exposure, groundshine, inhalation, and cloudshine.
**Long Term Dose due to Groundshine, Inhalation, and Cloudshine. Ingestion of contaminated food/water not considered.
Radioactive Waste Management Associates
Nevada Spent Fuel Transportation Severe Accident Analysis Page 18
Table 6: Surface Concentrations (mCi/m2): Severe Truck Accident in Las Vegas Downwind Distance (km) Surface Concentration (µCi/m2)
calculated by RISKIND Surface Concentration (µCi/m2) calculated by HotSpot
0.001 2.37E+05 not calculated 0.05 8.77E+03 5.90E+03 0.1 9.99E+03 1.10E+04
0.15 7.42E+03 7.20E+03 0.2 5.30E+03 4.80E+03
0.25 3.90E+03 3.40E+03 0.3 2.98E+03 2.50E+03 0.4 1.89E+03 1.50E+03 0.5 1.32E+03 1.00E+03 0.6 9.70E+02 7.50E+02 0.7 7.48E+02 5.80E+02 0.8 5.95E+02 4.60E+02 0.9 4.87E+02 3.80E+02 1 4.06E+02 3.10E+02 2 1.26E+02 1.00E+02 4 3.98E+01 3.50E+01 8 1.23E+01 1.30E+01
16 3.73E+00 4.80E+00 32 1.06E+00 1.90E+00 64 2.97E-01 7.40E-01 80 not calculated 5.50E-01
Table 7: Surface Concentrations (mCi/m2): Severe Rail Accident in Las Vegas Downwind Distance (km) Surface Concentration (µCi/m2)
calculated by RISKIND Surface Concentration (µCi/m2) calculated by HotSpot
0.001 2.57E+06 not calculated 0.05 6.54E+04 3.60E+04 0.1 6.03E+04 6.60E+04
0.15 4.29E+04 4.40E+04 0.2 3.05E+04 2.90E+04
0.25 2.25E+04 2.10E+04 0.3 1.72E+04 1.50E+04 0.4 1.10E+04 9.20E+03 0.5 7.71E+03 6.30E+03 0.6 5.71E+03 4.60E+03 0.7 4.41E+03 3.50E+03 0.8 3.52E+03 2.80E+03 0.9 2.88E+03 2.30E+03 1 2.40E+03 1.90E+03 2 7.55E+02 6.20E+02 4 2.38E+02 2.10E+02 8 7.40E+01 7.70E+01
16 2.25E+01 2.90E+01 32 6.37E+00 1.20E+01 64 1.78E+00 4.50E+00 80 not calculated 3.30E+00
Radioactive Waste Management Associates

Nevada Spent Fuel Transportation Severe Accident Analysis Page 19
Table 8: Time-Integrated Air Concentrations (Ci-s/m3): Severe Rail Accident in Las Vegas Downwind Distance (km) Air Concentration (Ci-s/m3)
calculated by RISKIND Air Concentration (Ci-s/m3) calculated by HotSpot
0.001 9.26E+02 not calculated 0.05 2.35E+01 1.10E+01 0.1 2.19E+01 2.10E+01
0.15 1.58E+01 1.40E+01 0.2 1.13E+01 9.30E+00
0.25 8.43E+00 6.50E+00 0.3 6.51E+00 4.80E+00 0.4 4.23E+00 3.00E+00 0.5 3.00E+00 2.00E+00 0.6 2.25E+00 1.50E+00 0.7 1.76E+00 1.20E+00 0.8 1.42E+00 9.20E-01 0.9 1.17E+00 7.60E-01 1 9.85E-01 6.40E-01 2 3.30E-01 2.10E-01 4 1.13E-01 7.40E-02 8 3.92E-02 2.80E-02
16 1.38E-02 1.10E-02 32 4.88E-03 5.00E-03 64 1.74E-03 2.20E-03 80 not calculated 1.70E-03
Table 9: Time-Integrated Air Concentrations (Ci-s/m3): Severe Truck Accident in Las Vegas
Downwind Distance (km) Air Concentration (Ci-s/m3) calculated by RISKIND
Air Concentration (Ci-s/m3) calculated by HotSpot
0.001 8.49E+01 not calculated 0.05 3.16E+00 2.10E+00 0.1 3.62E+00 3.90E+00
0.15 2.72E+00 2.60E+00 0.2 1.96E+00 1.70E+00
0.25 1.46E+00 1.20E+00 0.3 1.12E+00 9.10E-01 0.4 7.25E-01 5.60E-01 0.5 5.13E-01 3.80E-01 0.6 3.83E-01 2.80E-01 0.7 2.98E-01 2.20E-01 0.8 2.40E-01 1.70E-01 0.9 1.98E-01 1.40E-01 1 1.66E-01 1.20E-01 2 5.53E-02 3.90E-02 4 1.89E-02 1.40E-02 8 6.54E-03 5.30E-03
16 2.31E-03 2.20E-03 32 8.14E-04 9.50E-04 64 2.90E-04 4.30E-04 80 not calculated 3.30E-04
Radioactive Waste Management Associates

Nevada Spent Fuel Transportation Severe Accident Analysis Page 20
Population Dose Estimates for Las Vegas Accidents
Population Density Estimate In order to estimate the population dose due to the above accidents, it is necessary to first
estimate the population density. The population density of Las Vegas is difficult to estimate because of the high tourist population concentrated into a relatively small area, the high employee population also concentrated into this area, and the presence of a large commuting base from neighboring cities (such as Henderson and Boulder City). Further, the unique patterns of employment and visitation are different for this city than those with more typical business arrangements. In order to attain a reasonable estimate of the population density and distribution in Las Vegas, proper attention must be given to tourists, employees, and residents.
Tourist Population Estimate The primary source of information on tourist statistics was obtained from the Las Vegas Convention and Visitors Authority. According to them, 35,849,691 persons visited Las Vegas in the year 2000, for an average daily tourist population of 97,950. There are three major tourist destinations in the Las Vegas Metropolitan Statistical Area (MSA), according to the Las Vegas Convention and Visitors Authority: The Strip, the Downtown/Fremont Street area, and the Boulder Strip.
This study assumes a correlation between relative tourist population in the three areas mentioned above and gambling revenue. This method was chosen, instead of simply using data concerning the lodging patterns of tourists, in order to better estimate where tourists spend their time while visiting. Since the large majority of tourists to Las Vegas visit casinos, it was decided to create a distribution based on revenue. Regardless, this population density estimate correlates closely with one obtained using an alternative distribution method (described in Appendix C).
According to the Las Vegas Convention and Visitors Authority, the Las Vegas MSA gambling revenue is divided between the three areas mentioned above. Based on figures from the Executive Summary of tourist activity from the year 200035, the Las Vegas Strip was responsible for 79% of the gaming revenue, with Downtown contributing 11% and the Boulder Highway contributing 10%. Correlating this to tourist distribution requires the assumption that gaming revenue per capita is the same in all three regions. Given this, the following tourist distribution can be assumed:
35 See http://www.lasvegas24hours.com/gen_exsum1200.html
Radioactive Waste Management Associates

Nevada Spent Fuel Transportation Severe Accident Analysis Page 21
Table 10: Distribution of Gaming Revenue in Las Vegas Area Area 2000 Gaming
Revenue* % of Total Gaming
Revenue Estimated Daily
Tourist Population Las Vegas Strip $4,805,561,000 79.1 77,432 Downtown $673,873,000 11.1 10,858 Boulder Highway Area $599,478,000 9.9 9659
*Source: Las Vegas Convention and Visitors Authority
It is important to emphasize that the estimated daily tourist population is based on yearly averages. During holidays and major events and conventions, the tourist population can be considerably higher. Since Las Vegas has 125,000 hotel rooms, the tourist population could easily be doubled over the values given in Table 10.
Employee Population Estimate Another significant population source for the gaming areas of Las Vegas is the employee population. There were approximately 193,000 employees in the “hotels, gaming, and recreation” industry in the year 2000 in the Las Vegas MSA36. The mega-resorts of the Las Vegas Strip employ the majority of these employees. Again using the distribution of gaming revenue, we estimate the percentage of employees in each district. Of course, not all employees will be working at a given time. For this analysis, we assume that 25% of the total employee force is working at a given time (40 hour work weeks/168 hours in a week) to obtain an estimate of the number of employees “on shift.”
Table 11: Distribution of Hotel and Gaming employees in Las Vegas Area 2000 Gaming
Revenue* % of Total
Gaming Revenue Estimated
Employees: 2000 Average Number
of Employees “on-shift”
Las Vegas Strip $4,805,561,000 79.1 152,572 38,143 Downtown $673,873,000 11.1 21,395 5,349 Boulder Highway Area $599,478,000 9.9 19,033 4,758
*Source: Las Vegas Convention and Visitors Authority
Population Density Estimate for Tourist Locations Using the information given above, population density estimates were made for the three tourist locations, using the assumption that the tourists and employees make up all of the people located in these areas. The estimated area and population density for each tourist location are provided in Table 12 below.
36 Source: Las Vegas Convention and Visitors Authority
Radioactive Waste Management Associates
Nevada Spent Fuel Transportation Severe Accident Analysis Page 22
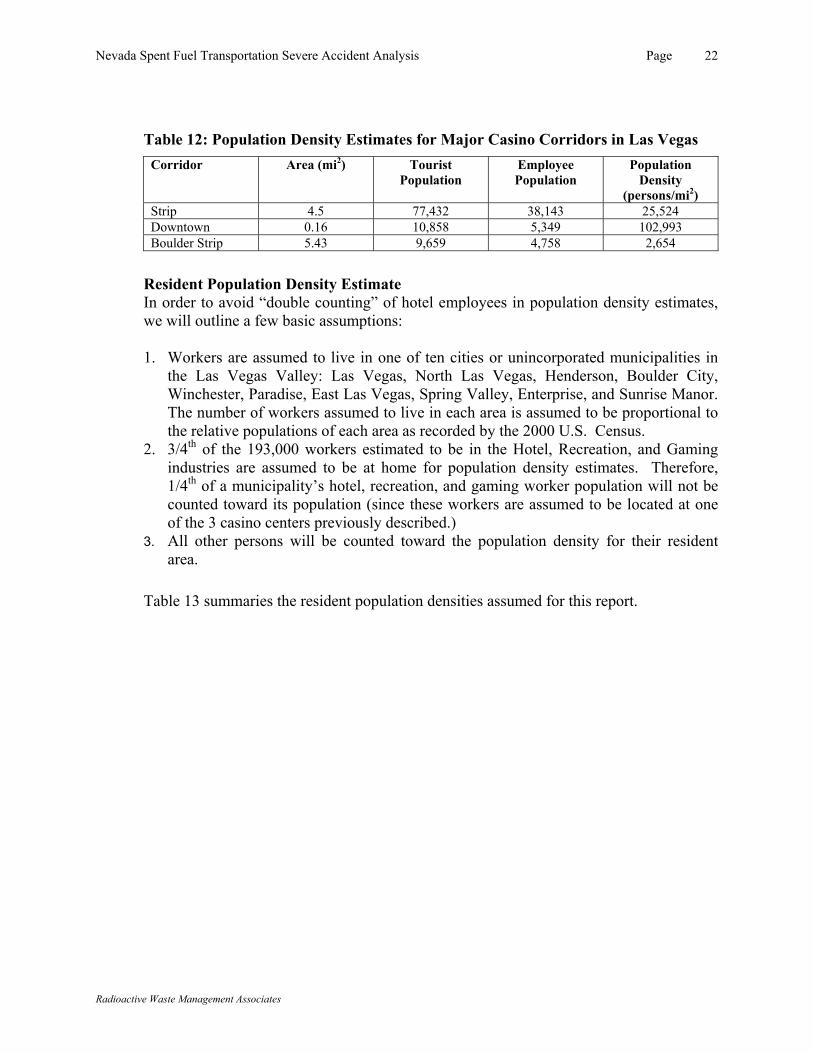
Table 12: Population Density Estimates for Major Casino Corridors in Las Vegas Corridor Area (mi2) Tourist
Population Employee Population
Population Density
(persons/mi2) Strip 4.5 77,432 38,143 25,524 Downtown 0.16 10,858 5,349 102,993 Boulder Strip 5.43 9,659 4,758 2,654
Resident Population Density Estimate In order to avoid “double counting” of hotel employees in population density estimates, we will outline a few basic assumptions:
1. Workers are assumed to live in one of ten cities or unincorporated municipalities in
the Las Vegas Valley: Las Vegas, North Las Vegas, Henderson, Boulder City, Winchester, Paradise, East Las Vegas, Spring Valley, Enterprise, and Sunrise Manor. The number of workers assumed to live in each area is assumed to be proportional to the relative populations of each area as recorded by the 2000 U.S. Census.
2. 3/4th of the 193,000 workers estimated to be in the Hotel, Recreation, and Gaming industries are assumed to be at home for population density estimates. Therefore, 1/4th of a municipality’s hotel, recreation, and gaming worker population will not be counted toward its population (since these workers are assumed to be located at one of the 3 casino centers previously described.)
3. All other persons will be counted toward the population density for their resident area.
Table 13 summaries the resident population densities assumed for this report.
Radioactive Waste Management Associates
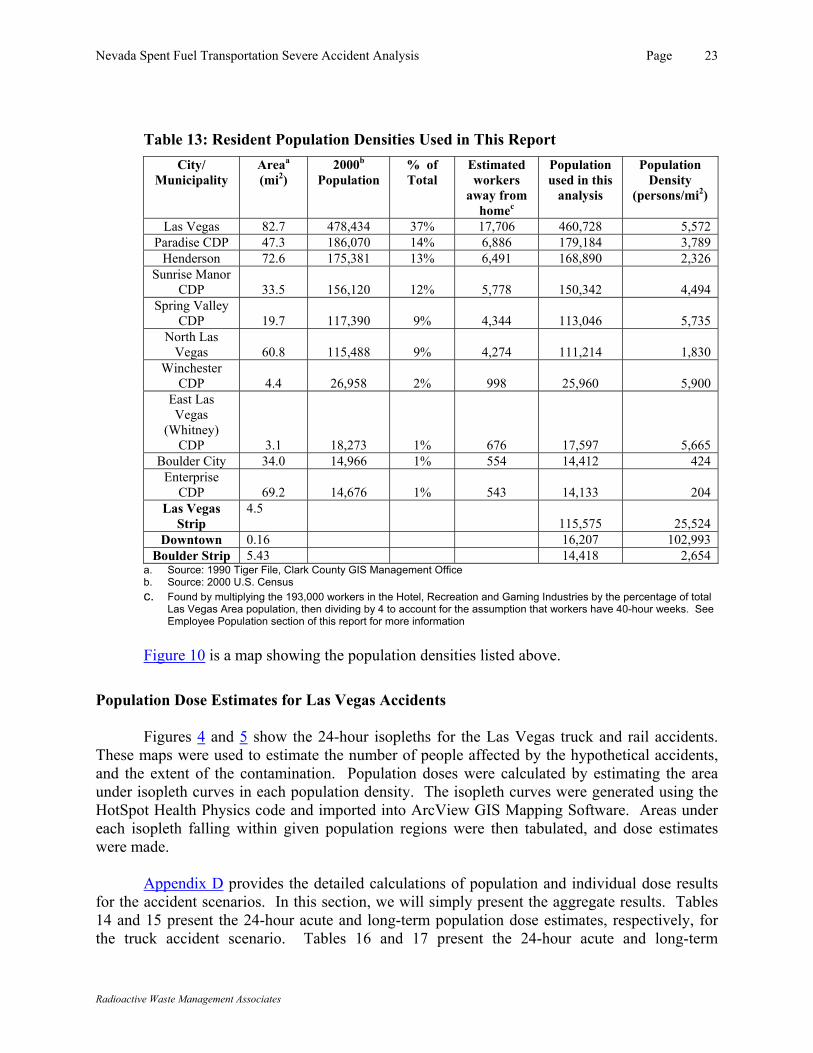
Nevada Spent Fuel Transportation Severe Accident Analysis Page 23
Table 13: Resident Population Densities Used in This Report City/
Municipality
Areaa (mi2)
2000b Population
% of Total
Estimated workers
away from homec
Population used in this
analysis
Population Density
(persons/mi2)
Las Vegas 82.7 478,434 37% 17,706 460,728 5,572 Paradise CDP 47.3 186,070 14% 6,886 179,184 3,789
Henderson 72.6 175,381 13% 6,491 168,890 2,326 Sunrise Manor
CDP 33.5 156,120 12% 5,778 150,342 4,494 Spring Valley
CDP 19.7 117,390 9% 4,344 113,046 5,735 North Las
Vegas 60.8 115,488 9% 4,274 111,214 1,830 Winchester
CDP 4.4 26,958 2% 998 25,960 5,900 East Las Vegas
(Whitney) CDP 3.1 18,273 1% 676 17,597 5,665
Boulder City 34.0 14,966 1% 554 14,412 424 Enterprise
CDP 69.2 14,676 1% 543 14,133 204 Las Vegas
Strip 4.5
115,575 25,524 Downtown 0.16 16,207 102,993
Boulder Strip 5.43 14,418 2,654 a. Source: 1990 Tiger File, Clark County GIS Management Office b. Source: 2000 U.S. Census c. Found by multiplying the 193,000 workers in the Hotel, Recreation and Gaming Industries by the percentage of total
Las Vegas Area population, then dividing by 4 to account for the assumption that workers have 40-hour weeks. See Employee Population section of this report for more information
Figure 10 is a map showing the population densities listed above.
Population Dose Estimates for Las Vegas Accidents
Figures 4 and 5 show the 24-hour isopleths for the Las Vegas truck and rail accidents. These maps were used to estimate the number of people affected by the hypothetical accidents, and the extent of the contamination. Population doses were calculated by estimating the area under isopleth curves in each population density. The isopleth curves were generated using the HotSpot Health Physics code and imported into ArcView GIS Mapping Software. Areas under each isopleth falling within given population regions were then tabulated, and dose estimates were made.
Appendix D provides the detailed calculations of population and individual dose results for the accident scenarios. In this section, we will simply present the aggregate results. Tables 14 and 15 present the 24-hour acute and long-term population dose estimates, respectively, for the truck accident scenario. Tables 16 and 17 present the 24-hour acute and long-term
Radioactive Waste Management Associates

Nevada Spent Fuel Transportation Severe Accident Analysis Page 24
population dose estimates, respectively, for the rail accident scenario. Population dose was related to risk of a latent cancer fatality using a range of correlations. The DOE employs the figure 5 x 10⁻⁴ latent cancer fatalities (LCF) per person-rem37, whereas other independent studies of Hanford nuclear workers and Japanese bomb survivors estimate 32 x 10-4 LCF per person-rem38. In the tables below we employ this range.
In Tables 15 and 17 we estimate the long-term population doses due to a truck and rail
accident in Las Vegas, respectively. The long-term population doses evaluated are for both one and 50 years, assuming no remediation measures are taken. It is important to note that even after 50 years, radioactive particulates still present a radiation hazard.
While the acute population doses are likely to be unavoidable in the event of an accident leading to an instantaneous release of radioactive materials, the extent of long-term exposure will be highly dependent on policy decisions involving cleanup of radioactive materials and possible relocation of residents from affected areas. Later in this report, we estimate the cleanup costs for accidents involving a radioactive release, which exceed $200 billion for the category 6 rail accident in Las Vegas. The point to remember is that many of the estimated long-term health effects can be reduced if the effort is made to decontaminate the affected area. In the event of an accident, there will likely be some compromise between the cost of cleanup and the health effects resulting from failure to decontaminate.
Table 14: Acute (24-hour) Dose Estimates: Truck Accident in Las Vegas Total Affected
Population Acute Population Dose
(person-rem) Expected Range of Cancer Fatalitiesa 31,794 846 0.42 – 3
a The range of latent cancer risks is 5 x 10⁻⁴ lcf/person-rem to 32 x 10-4 lcf/person-rem.
Table 15: Long-Term Population Dose Estimates: Truck Accident in Las Vegas Long-Term Population Dose (person-rem)
Total Affected
Population
1-year long term dose
(person-rem) Latent Cancer
Fatalities
50-year long term dose
(person-rem) Latent Cancer
Fatalities 31,794 29,514 15-94 407,024 204 – 1306
Table 16: Acute (24-hour) Dose Estimates: Rail Accident in Las Vegas
Total Affected Population Acute Population Dose (person-rem) Latent Cancer Fatalities
138,848 26,171 13 – 83
37 Yucca Mountain DEIS, pg. 6-7 38 Mancuso, Steward, and Kneale, 1977. “Radiation exposures of Hanford Workers Dying from Cancer and Other Causes.” Health Physics 33:369-84.
Radioactive Waste Management Associates
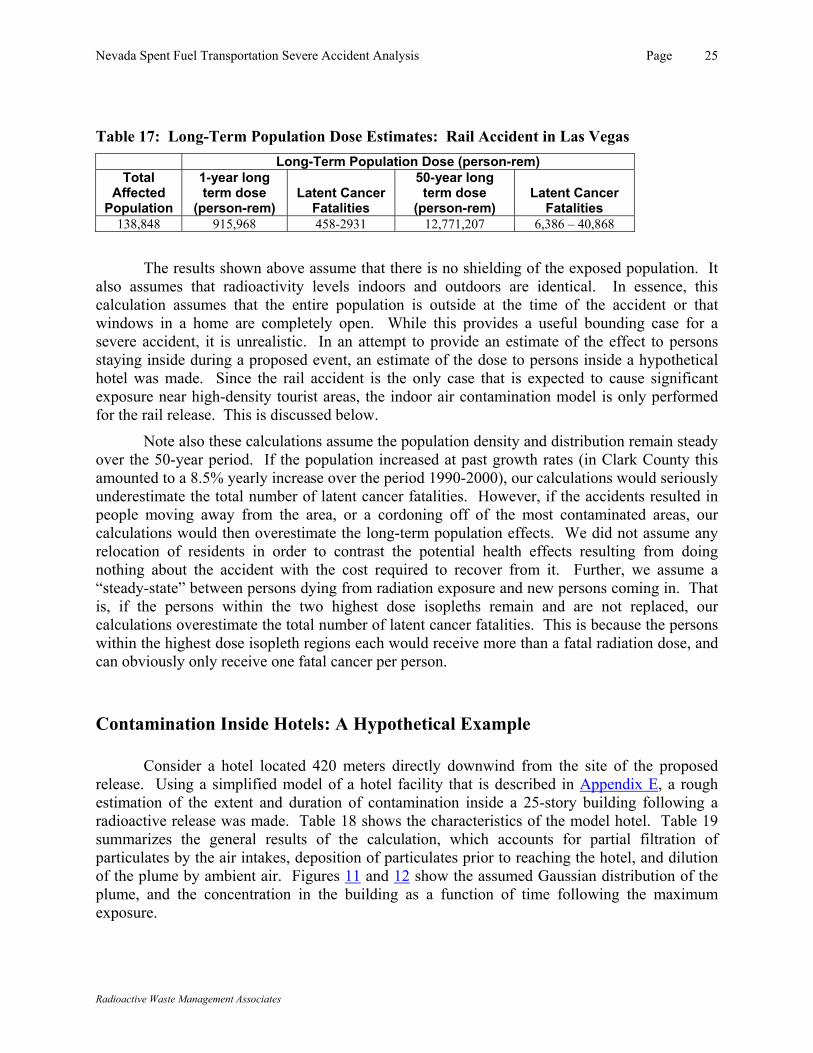
Nevada Spent Fuel Transportation Severe Accident Analysis Page 25
Table 17: Long-Term Population Dose Estimates: Rail Accident in Las Vegas Long-Term Population Dose (person-rem)
Total Affected
Population
1-year long term dose
(person-rem) Latent Cancer
Fatalities
50-year long term dose
(person-rem) Latent Cancer
Fatalities 138,848 915,968 458-2931 12,771,207 6,386 – 40,868
The results shown above assume that there is no shielding of the exposed population. It
also assumes that radioactivity levels indoors and outdoors are identical. In essence, this calculation assumes that the entire population is outside at the time of the accident or that windows in a home are completely open. While this provides a useful bounding case for a severe accident, it is unrealistic. In an attempt to provide an estimate of the effect to persons staying inside during a proposed event, an estimate of the dose to persons inside a hypothetical hotel was made. Since the rail accident is the only case that is expected to cause significant exposure near high-density tourist areas, the indoor air contamination model is only performed for the rail release. This is discussed below.
Note also these calculations assume the population density and distribution remain steady over the 50-year period. If the population increased at past growth rates (in Clark County this amounted to a 8.5% yearly increase over the period 1990-2000), our calculations would seriously underestimate the total number of latent cancer fatalities. However, if the accidents resulted in people moving away from the area, or a cordoning off of the most contaminated areas, our calculations would then overestimate the long-term population effects. We did not assume any relocation of residents in order to contrast the potential health effects resulting from doing nothing about the accident with the cost required to recover from it. Further, we assume a “steady-state” between persons dying from radiation exposure and new persons coming in. That is, if the persons within the two highest dose isopleths remain and are not replaced, our calculations overestimate the total number of latent cancer fatalities. This is because the persons within the highest dose isopleth regions each would receive more than a fatal radiation dose, and can obviously only receive one fatal cancer per person.
Contamination Inside Hotels: A Hypothetical Example Consider a hotel located 420 meters directly downwind from the site of the proposed
release. Using a simplified model of a hotel facility that is described in Appendix E, a rough estimation of the extent and duration of contamination inside a 25-story building following a radioactive release was made. Table 18 shows the characteristics of the model hotel. Table 19 summarizes the general results of the calculation, which accounts for partial filtration of particulates by the air intakes, deposition of particulates prior to reaching the hotel, and dilution of the plume by ambient air. Figures 11 and 12 show the assumed Gaussian distribution of the plume, and the concentration in the building as a function of time following the maximum exposure.
Radioactive Waste Management Associates

Nevada Spent Fuel Transportation Severe Accident Analysis Page 26
Assuming a ground level puff release from a rail cask and average Las Vegas meteorological conditions, the average time for the peak concentration of the radioactive cloud to reach the air intake of a hotel 420 meters from the accident scene is 91.3 seconds, as seen in Table 19. Assuming a Gaussian distribution, over 99% of the radioactivity in the cloud is within ±3 standard deviations of the mean. Therefore, it can be estimated that over 99% of the radioactive cloud will pass the hotel air intake in 40 seconds (6 standard deviations). We consider it unlikely that hotel managers could be informed and take decisive actions to cut off the ventilation systems in these brief time periods. If, on the other hand, a major fire were involved as part of the accident, allowing the fire to burn would lead to more gradual releases. The effective release height of the radioactive particulates would be higher so that the highest contaminant concentrations would be further downwind.
The air concentration inside the hypothetical hotel will vary with time as particulates are
deposited onto surfaces, as contaminated air leaves the building, and as fresh air enters the building. In a real situation, the hotel would experience a buildup in concentration followed by a gradual decline. These calculations are carried out in Appendix E. We find the following. The total acute inhalation dose inside and outside a hotel 420 meters from the accident scene is 2.6 rems and 14.5 rems, respectively. If radioactive contamination is not removed, we estimate a direct gamma dose rate inside and outside the same hotel to be 26.9 mrem/hr and 115.5 mrem/hr, respectively. This is presented in Table 20.
Table 18: Characteristics of Hypothetical Hotel Building for Use in Air Contamination Estimate
Characteristic Value Building Length, ft (m) 800 (243.8) Building Width, ft (m) 642 (195.7) Area/Floor, ft2 (m2) 513,600 (47,715) Number of Floors 25 Height/Floor, ft (m) 12 (3.7) Building Volume, ft3 (m3) 154,080,000 (4,363,060) Downwind Distance from accident, ft (m) 1378 (420)
Radioactive Waste Management Associates

Nevada Spent Fuel Transportation Severe Accident Analysis Page 27
Table 19: Estimated Concentration Calculation Results
Values Parameter Cs-137 Cs-134 Kr-85
X/u; average time to reach receptor
91.3 seconds 91.3 seconds 91.3 seconds
Standard deviation 5.65 seconds 5.65 seconds 5.65 seconds Conc. at plume center (Ci/m3) .071 .0258 .265 Outdoor
Concentrations Avg. plume concentration (Ci/m3) .0288 .0101 .104 Maximum Indoor Concentration (µCi/m3) 633.2 228.9 2940 Time Required to reduce concentration by 90% in Hotel (min) 10.8 10.8 46.1 Time Required to reduce concentration by 99% in Hotel (min) 21.5 21.5 92.1 Average Building Concentration over 2 hours (µCi/m3) 27.2 9.8 497.1 Average Building Concentration over 24 hours (µCi/m3) 3.3 1.2 46.0 Estimated Surface Concentration Inside Hotel (µCi/m2) 1775 642 -- Dose Rate (mrem/hr) due to exposure to contaminated ground surfaces 13.9 13.0 -- Time-Integrated Air Concentration (Ci-s/m3) .18 .06 3.53
Indoor Concentrations
Acute Inhalation Dose (rem) 1.83 0.75 0.03
Table 20: Comparison of Radiological Dose Indoors and Outdoors
Pathway Indoor Dose (or Dose Rate) Outdoor Dose (or Dose Rate)
Inhalation Dose 2.6 rem 14.5 rem
Groundshine* 26.9 mrem/hour 115.5 mrem/hour *if no cleanup
Las Vegas Emergency Response and Evacuation There is little precedent for emergency response to a severe transportation accident involving irradiated fuel leading to the release of radioactive particulates. The technical literature regarding decontamination following a major radioactive release in a transportation accident is almost non-existent.39 However, emergency response in the event of a major nuclear
39 Chanin, DI and WB Murfin, “Site Restoration: Estimation of Attributable Costs from Plutonium-Dispersal Accidents,” SAND96-0957, May, 1996.
Radioactive Waste Management Associates

Nevada Spent Fuel Transportation Severe Accident Analysis Page 28
reactor accident has been analyzed extensively, particularly for the purpose of determining liability and Price Anderson coverage. While a nuclear reactor accident could lead to far greater releases of radionuclides than transportation casks, reactors are generally sited far from population centers. A transportation accident could happen in a city center. Issues involving emergency response and evacuation are therefore critical. The best emergency preparedness is, of course, prevention. This means that shipping casks should be designed and built to withstand all credible accidents, which may be an engineering impossibility. Further, emergency response personnel should have a set procedure, proper equipment, and regular training exercises to prepare for a response to a major nuclear accident. Clark County is currently in the process of assessing what is required in the way of personnel, equipment, and training to meet the demands created by the transportation of spent nuclear fuel and high-level waste through the Las Vegas metropolitan area. Until that assessment is completed, and the identified needs are funded, it is difficult to project what additional personnel, training and equipment will be in place when shipments begin. Therefore, this assessment will be based upon the current resources within the Las Vegas valley. This is not an unreasonable assumption, since radioactive materials are currently transported through the valley.
Background The Las Vegas urban area includes the incorporated cities of Las Vegas, North Las Vegas, Henderson, and Boulder City, the unincorporated town of Paradise, and unincorporated areas of Clark County. Unlike most urban areas in the United States, the area known collectively as “Las Vegas” includes large areas of highly developed unincorporated county. For example, the Las Vegas Strip, where many of the new, major casinos are located, is an unincorporated area of Clark County. Therefore, responsibility for emergency response within the Las Vegas urban area is divided between Clark County, the City of Las Vegas, the City of North Las Vegas, and the City of Henderson. Boulder City is usually not considered an integral part of the area known collectively as “Las Vegas,” and hence, will not be discussed in detail in this section.
Fire Departments Responsibility for fire and rescue is divided between the Clark County Fire Department, the Las Vegas Fire Department, the North Las Vegas Fire Department, and the Henderson Fire Department. Each fire department has a number of fire stations located within the areas of their responsibility. Response to hazardous materials incidents is the responsibility of specialized hazardous materials response teams. Both the Clark County Fire Department and the Las Vegas Fire Department have a hazardous materials response team. Through mutual aid agreements, these teams will respond to hazardous materials incidents throughout the Las Vegas urban area.
Law Enforcement The Las Vegas Metropolitan Police Department (Metro) resulted from the merger of the Las Vegas Police Department and the Clark County Sheriff’s Office. Metro is responsible for
Radioactive Waste Management Associates

Nevada Spent Fuel Transportation Severe Accident Analysis Page 29
law enforcement in the City of Las Vegas and in the unincorporated areas of Clark County both within and outside of the Las Vegas urban area. The Cities of North Las Vegas and Henderson both maintain separate police departments with responsibility for law enforcement within their respective jurisdictions. The Nevada Highway Patrol is responsible for law enforcement on Interstate Highways and federal and state highways. Within the Las Vegas urban area, this includes Interstate 15, U.S. Highway 95, and U.S. Highway 93. The Nevada Highway Patrol is also responsible for portions of the following State Routes within the Las Vegas urban area:
State Route 604 (Las Vegas Blvd.) State Route 605 (Paradise) State Route 593 (Tropicana Ave.) State Route 160 (Blue Diamond Rd.) State Route 146 (Lake Mead Drive)
Communications The Southern Nevada Area Communications Council (SNACC) is responsible for communications equipment within Clark County and the Las Vegas urban area. The Council has recently upgraded to an 800 Mhz trunking system for communications. This system is currently operated with eight zones. Each fire department within the urban area is assigned two zones. Each zone has 16 channels. Several channels in zones for both the Clark County Fire Department and the Las Vegas Fire department are assigned to Metro and the North Las Vegas Police Department. Therefore, interagency communication between fire departments and their law enforcement agencies is good. The Nevada Highway Patrol uses a VHF “Smart Zone” communication system. Although intra-agency communication within the Patrol is good with this system, the Patrol has limited ability to communicate with the local law enforcement agencies and local fire departments. To address this problem, the SNACC hopes to install a “Command Net” bridge that will tie the VHF “Smart Zone” system together with the local 800 Mhz trunking system. Until that occurs, the Patrol usually assigns an officer to the fire department’s command post to ensure that they do have some interagency communications capability. The Las Vegas Metropolitan Police Department also operates the “Crime Alert Telecomputing (CAT) System. Through this system, Metro dispatch supervisors can send warnings to the major hotel and casino security offices via modem.
Hazardous Materials Emergency Response Plan
Response to a hazardous materials transportation accident in Clark County is governed by a Hazardous Materials Emergency Response Plan40 adopted by the Clark County Local Emergency Planning Committee. The purpose of the plan is to provide common guidelines for
40 Clark County Local Emergency Planning Committee, “Hazardous Materials Emergency Response Plan,” March 2001.
Radioactive Waste Management Associates

Nevada Spent Fuel Transportation Severe Accident Analysis Page 30
the response to a hazardous materials incident anywhere in Clark County. The plan applies to all agencies responding to a hazardous materials incident within the County. The plan covers agency duties, response, warning methods, evacuation, resource management, and follow-up. Under the plan, a lead agency is assigned for every hazardous materials incident. The lead agency manages and coordinates the response to a hazardous materials incident using the incident management system, and is responsible for the identification and procurement of the resources necessary to manage the incident. In unincorporated areas of Clark County, the Clark County Fire Department, on behalf of the County Manager and the Board of County Commissioners, is the lead agency. Within incorporated cities, the fire department for the city where the incident occurs is the lead agency. On State roads and highways, the Nevada Highway Patrol is the lead agency. The incident commander for a hazardous materials incident is always assigned from the fire department with jurisdiction over the area of the accident. Under the plan, unified incident command is required for a hazardous materials incident, and includes the law enforcement agency with jurisdiction and the fire department with jurisdiction. Response to a hazardous materials incident may be broken down into distinct phases. These include:
• Discovery • Notification of Response Agencies • Evaluation and Initiation of Action • Establishment of Control Zones • Determination of Population Effects • Evacuation (if required) • Containment • Mitigation and Recovery • Documentation and Reporting
Often these phases overlap and may continue throughout the response to the incident. For example, notification of response agencies will continue throughout the incident as more specialized response units are requested. The Hazardous Materials Response Team responding to the scene provides expertise and equipment especially for response to a hazardous materials incident. It is the responsibility of the Team officer to identify and establish a hazard zone and classify the incident according to its severity. The plan categorizes incidents according to the following three categories:
Level I • Spills, leaks, ruptures and/or fires involving hazardous materials that can be
contained, extinguished, and /or abated utilizing equipment, supplies, and resources immediately available to the local fire department
• Do not require the evacuation of citizens
Radioactive Waste Management Associates

Nevada Spent Fuel Transportation Severe Accident Analysis Page 31
Level II • Can only be identified, tested, sampled, contained, extinguished, and/or abated
utilizing the resources of a Hazardous Materials Response Team. • Require the use of chemical protective gear and specialized equipment • Require evacuation of citizens • Involve hazardous materials fires that are permitted to burn for a controlled
period of time or are allowed to consume themselves
Level III • Spills, leaks, and/or ruptures that can be contained and/or abated utilizing the
highly specialized equipment and supplies available to environmental or industrial response personnel
• Require evacuation of civilians extending across jurisdictional boundaries • Cause serious civilian injuries or deaths • Require at least two Hazardous Materials Response Teams • Require decontamination of civilians • Involve multi-agency responses
The hazardous materials response team will delineate various zones around the incident. These include the Hazard Zone (Hot Zone), the Decontamination Area/Evacuation Zone (Decon Corridor), and the Support Zone (Fire Line). The plan contains detailed procedures for conducting decontamination of responders and civilians contaminated during the incident. The primary warning method in Clark County is the Emergency Alert System, which can be activated by the Mayor, the County Emergency Management Coordinator, the County Manager, the County Commission Chair, the County Public Information Officer, or the County Special Projects Manager. Activation is through a call to the National Weather Service with the information to be transmitted and any special instructions. Secondary warning methods include sirens and loudspeakers on public safety vehicles, the Crime Alert Telecomputing System, intra-building systems in major hotels and casinos, the Travelers Information Station at McCarren Airport, media reports, and door-to-door sweeps through areas. The Plan contains procedures to develop plans for large-scale evacuations if they are required. The levels of evacuation include:
• Site Evacuation involving a small number of citizens • Intermediate Level Evacuation involving larger areas and numbers of citizens,
but normally less than 100 persons • Large-Scale Evacuation involving thousands of citizens
The plan requires that whenever an evacuation is required, it will be conducted under a specific plan developed under an Incident Management System. Detailed requirements for the evacuation plan are:
Radioactive Waste Management Associates

Nevada Spent Fuel Transportation Severe Accident Analysis Page 32
• A command structure • Need for evacuation versus in-place sheltering • Early notification of the police department • Identification of an area to be evacuated • Resources needed • Speed of evacuation, time frames • Identification of shelter sites and preparation of these sites • Estimation of the duration of the evacuation • Planning the re-entry of those evacuated • Information about hazard and evacuation presented to evacuees • Security of the area evacuated
The area to be evacuated is initially determined by the Incident Commander, and later by the Planning Section, if established.
In-place sheltering is to be considered instead of evacuation when:
• The hazardous material has a low or moderate level of health risk • The material has been released from its container and is dissipating • Leaks can be controlled rapidly and before evacuation could be completed • Exposure is expected to be short-term with a low health risk • The public can be adequately protected by sheltering
Initial Emergency Response to the Incident The following discussion of the expected actions of emergency responders is based upon the Clark County Hazardous Materials Emergency Response Plan, local agency training and guidelines, and standard guidance for response to a radiological incident.41 Although the actions during the initial phases of the incident would be fairly standard, the complexity of the incidents evaluated in this report far exceed the usual hazardous materials response requirements. Therefore, it is not possible to accurately predict how the incident would be managed. Therefore, the response actions described here are only illustrative of the complexity and magnitude of the problem that would face the emergency responders.
Discovery and Notification Truck
U.S. Nuclear Regulatory Commission Safeguards regulations require that shipments of spent nuclear fuel be escorted through urban areas such as the Las Vegas urban area. An escort vehicle would follow the truck carrying the spent nuclear fuel. The Nevada Highway Patrol would probably provide the escort. Therefore, responsible officials would likely know that the accident involved a truck carrying spent nuclear fuel occurred as soon as the accident occurred.
41 Personnel interview with Jim O’Brian, Clark County Emergency Management Agency and Marty Liebman, Las Vegas Metropolitan Police Department, July 23, 2001.
Radioactive Waste Management Associates
Nevada Spent Fuel Transportation Severe Accident Analysis Page 33
The escort would immediately notify local responders with information regarding the accident and the nature of the cargo. A hazardous materials response team would undoubtedly be dispatched immediately in addition to the normal immediate dispatch of fire suppression, rescue, ambulance, and law enforcement. The Las Vegas Fire Department hazardous materials response team would be dispatched from City Fire Station #3 located on West Washington Avenue west of the accident location. Fire and rescue would probably be dispatched from Station #1 on Casino Center Boulevard immediately west of the accident location.
In addition, since the vehicle involved in the accident would be known to be carrying spent nuclear fuel, the Radiological Health Section of the Nevada State Health Division would be notified. The Nevada Highway Patrol would also probably notify the Department of Energy immediately through the TRANSCOM system.
Rail
For rail shipments, the escorts are usually carried in a special escort car in the same train as the shipment. Given the severity of the accident described earlier in this report, it is not likely that the escorts would survive the accident without injury. Therefore, initial notification of the accident would probably come from a citizen driving near the accident scene, most likely on Interstate 15. The information from this notification would undoubtedly be limited to identifying the accident as one involving a train passing under the interstate.42
The time it takes to identify the incident as one that involves a shipment of spent nuclear fuel depends, in part, on whether the Department of Energy decides to ship by dedicated train or in general commerce. If the shipments are by dedicated train, it is more likely that the Union Pacific Railroad or the State of Nevada will recognize that the accident involves spent fuel when they are notified of the incident. If the shipments are made by general commerce, officials may realize that there is a spent fuel shipping cask on the train involved in the incident, but will not know immediately if the cask is involved in the accident, and if so, the extent of involvement.
Fire and rescue crews from Clark County Fire Station #12 would be the first units dispatched. Fire Station #12, located behind the Stardust Hotel, would be directly in the projected path of the plume, about 1,000 meters from the accident site. With an average wind speed of 4.6 m/s, the plume would reach the fire station in less than five minutes. Therefore, responders from this location would probably be contaminated as they were leaving the fire station, but would also probably not be aware of their contamination.
Evaluation and Initiation of Action Truck
42 The State may require a chase vehicle. If it were located near the accident scene, the State may be the first to give notice.
Radioactive Waste Management Associates

Nevada Spent Fuel Transportation Severe Accident Analysis Page 34
Fire crews responding to the truck accident would know that they were responding to an accident involving spent nuclear fuel. Therefore, their response would be based upon the guidelines provided in Guide 165 of the Emergency Response Guidebook43 (ERG) as follows:
Potential Hazards - Health
• Radiation presents minimal risk to transport workers, emergency response personnel, and the public during transportation accidents. Packaging durability increases as potential radiation and criticality hazards of the content increases.
• Undamaged packages are safe. Contents of damaged packages may cause higher external radiation exposure, or both external and internal radiation exposure if contents are released.
Public Safety
• Priorities for rescue, life saving, first aid, and control of fire and other hazards are higher than the priority for measuring radiation levels.
• Isolate spill or leak area immediately for at least 25 to 50 meters (80 to 160 feet) in all directions. Stay upwind. Keep unauthorized personnel away.
• Detain or isolate uninjured persons or equipment suspected to be contaminated; delay decontamination and cleanup until instructions are received from Radiation Authority.
Evacuation
• Large Spill: Consider initial downwind evacuation for at least 100 meters (330 feet).
• Fire: When a large quantity of this material is involved in a major fire, consider an initial evacuation distance of 300 meters (1000 feet) in all directions.
The first fire crews arriving on scene would approach the scene cautiously from the upwind direction. Once they arrived, the first action would be to secure the scene of the incident. Assuming the accident occurred on the westbound lane of I-15, traffic would already be blocked in that direction. Eastbound traffic would undoubtedly be slowed and likely stopped. Traffic on U.S. 95 and I-515 would also probably be slowed, but not blocked. Since they know that the accident involves a hazardous material, responding fire crews would probably request the Nevada Highway Patrol to close these highways.
Rail
Fire crews responding to the rail accident would probably not know that they were responding to an accident involving spent nuclear fuel, especially if the shipments were made via general freight. Therefore, their response would be based upon the hazards that they could identify. The most immediate hazard would be the fire involved in the incident. The source of hydrocarbons for this fire could either be a tank car in the train or a natural gas pipeline at this location. If the source is a tank car, standard procedure is to
43 2000 Emergency Response Guidebook, U.S. Department of Transportation, Research and Special Programs Administration.
Radioactive Waste Management Associates

Nevada Spent Fuel Transportation Severe Accident Analysis Page 35
let the fire continue to burn, since the fire will consume the hydrocarbons involved. Extinguishing the fire would result in the spill of liquid hydrocarbons. The fire and smoke from the fire could continue to delay identification of the spent nuclear fuel as an additional hazard involved in the incident. Allowing the fire to continue to burn would also continue to volatilize the radioactive materials contained in the cask.
The first fire crews arriving on scene would approach cautiously from the upwind direction. Once they arrived, the first action would be to secure the area. Since the fire and smoke would be creating hazardous conditions on I-15, traffic in both directions will probably be stopped. As with the truck accident scenario, fire crews would probably request the Nevada Highway Patrol to close I-15.
Once the incident has been identified as one involving spent nuclear fuel or another hazard, the Clark County Fire Department hazardous materials response team would be dispatched to the incident from Clark County Fire Station #24, located south of the accident location. Fire crews would follow the same procedures from the Emergency Response Guidebook described above.
Establishment of Control Zones Upon arrival, the hazardous materials response team will begin to establish control zones based upon the guidance given in the emergency response guidebook. Therefore, initial actions will be to isolate the area for at least 25 to 50 meters (80 to 160 feet) in all directions. As soon as the hazardous materials response team takes radiation readings with survey meters, they will realize that radioactive materials have been released. Based upon the guidance from the ERG, they will begin to consider the evacuation of persons within 300 meters (1000 feet) in all directions.
Given the large area contaminated by the plume, their initial readings will only confirm that a leak from the cask has occurred. They will not have the resources to begin to quantify the area of contamination. Through computer modeling based upon the current wind direction and speed, they will be able to begin to map out the extent of contamination. Under the best of conditions, it will probably take at least 20 minutes into the incident before the hazardous materials response team identifies that a release has occurred. It will probably be at least 45 minutes before they can begin to quantify the extent of the release. By the time the true extent of the area contaminated can be determined, the main plume of radioactive material will have passed through the area. Thus, all the people in the areas, or people who have passed through the areas shown in Figure 4 for the truck accident and in Figure 5 for the rail accident would potentially be contaminated.
Until traffic is stopped, vehicles traveling eastbound on I-15 will be passing through the most contaminated area, potentially contaminating passengers in these vehicles and spreading the contamination great distances. All of the passengers in vehicles in the blocked area of I-15 will be in the contaminated area. Vehicles traveling on local streets north and east of the accident location will also be passing through the contaminated area. Although it is not possible to estimate the number of vehicles that would pass through the
Radioactive Waste Management Associates
Nevada Spent Fuel Transportation Severe Accident Analysis Page 36
contaminated area, projected traffic counts for the year 2010 provide some perspective on the magnitude of the problem. In 2010, 24-hour traffic counts are predicted to be 243,909 for I-15 and 210,375 for U.S. 9544. Thousands of vehicles will pass through the contaminated area before the scene is secured. Passengers contaminated in these vehicles will be in addition to the 32,000 persons for the truck accident and the 140,000 persons for the rail accident estimated to be contaminated as shown in Tables 13 and 14 of this report.
Many of the major arterioles in the Las Vegas urban area cross the interstate on flyovers. In the area of the railroad accident, Flamingo and Spring Mountain both cross the interstate on flyovers and carrying significant volumes of traffic. Traffic on these roads would not be significantly impeded by the incident. Until emergency responders could close these roads, significant numbers of vehicles and their occupants would pass through the contaminated area. The incident would quickly escalate to a Level III hazardous materials incident. Clark County and the City of Las Vegas would likely declare an emergency and activate their Emergency Operations Centers. The Department of Energy would be requested to provide assistance.
One of the most pressing concerns would be to limit access to the contaminated area, and to begin to try to identify contaminated citizens. Following guidance provided by the ERG, emergency responders would initially attempt to detain potentially contaminated individuals for later decontamination. Law enforcement agencies would be requested to begin the process of controlling access to the contaminated areas. Since the true extent of the contaminated area would not be known at this point, it would be difficult to establish accurate boundaries for the controlled area.
Law enforcement agencies would be faced with the dilemma of taking a conservative approach and trying to control access to a large area. For the rail accident, Metro would probably try to control access to the area bounded by I-15 on the west, Maryland Parkway on the east, Flamingo on the south, and Charleston on the north. This is an area of about seven square miles, and would require control points at over 50 intersections just to control vehicular traffic. Given the number of streets involved, local resources would quickly be exhausted, and control over the contaminated area could not be established. People traveling into the contaminated area or through the contaminated area would continue to increase the number of people contaminated by the event.
Similarly, the ability to detain potentially contaminated individuals would quickly overwhelm local resources. It would be impossible to detain all of the people potentially contaminated. Therefore, many contaminated people would leave the area, potentially spreading the contamination throughout the urban area and beyond.
44 Personnel communication from Fred Dilger, Clark County Nuclear Waste Division, Department of Comprehensive Planning, August 8, 2001.
Radioactive Waste Management Associates
Nevada Spent Fuel Transportation Severe Accident Analysis Page 37
Determination of Population Effects As more information on the extent of the contaminated area becomes available, emergency response agencies would begin to attempt to determine the effects on the affected population. The initial protective action taken would undoubtedly be in-place sheltering. The Emergency Alert System would be used to provide the initial notification to citizens. The Crime Alert Telecomputing System would also be used to provide information to the hotel security offices. Hotels and casinos would then use intra-building systems to pass the message on to people in the hotels and casinos. Las Vegas, and particularly the area known as the “Strip,” experiences an extremely high pedestrian traffic volume. Notification of pedestrians in the area would be difficult. Warnings of this nature are made through loudspeakers on public safety vehicles. The area where the warning to shelter in-place would need to be made would be within the contaminated area. Metro officers do not carry personnel protective equipment that would adequately shield them from the potential hazards. Therefore, Metro personnel and vehicles could not be used for this purpose. Fire department vehicles and personnel would have to be used to issue warnings to people on the streets and other outdoor areas. The Crime Alert Telecomputing System could also be used to advise hotels and casinos to shut down the intake of outside air for the ventilation systems. Ironically, by the time enough information is available to issue this advise, the plume would already have passed over the hotels and casinos that would be affected. At that point it may be preferable to continue to exchange air in the buildings since the outside air would probably have a lower level of contamination than the air within the building. Normal procedures for decontaminating individuals involved in a hazardous materials incident would not be feasible. Decontamination equipment that is available would probably be adequate for decontamination of emergency response personnel and those citizens in the immediate area of the accident. Emergency response agencies would have to implement unique strategies for mass decontamination of the affected population. Also, it would not be possible to survey the thousands of people after they have been “decontaminated” to ensure that the decontamination was complete.
Evacuation Planning
Emergency managers would quickly realize that evacuation of the contaminated areas would be needed. The evacuation would undoubtedly also require evacuation of an area much larger than the area contaminated as shown in Figures 4 and 5, to protect against shifting wind conditions. Evacuation plans would have to account for evacuating non-contaminated and contaminated individuals. An evacuation plan would be developed using the guidelines from the hazardous materials emergency response plan.
Radioactive Waste Management Associates

Nevada Spent Fuel Transportation Severe Accident Analysis Page 38
Evacuation planning depends first and foremost on the unknown human factor.45 The range of response by the public to an event may be largely unknown, and is difficult to incorporate into evacuation plans. While panic may not ensue, citizens may not follow evacuation orders, either the suggested time frames for evacuation or the suggested routes. Evacuations are unlikely to be successful in high-density population areas due to limitations of emergency response systems. Selective evacuation based upon plume direction or contaminated areas also does not work. It is difficult to accurately describe the area to be evacuated so that people understand. One also cannot assume that people outside the area described for evacuation will stay in place. Therefore, evacuation planning must be designed to accommodate a much larger population than the actual “at-risk” population. Evacuation of a large number of people will stress roadway availability, potentially requiring significant additional time to complete an evacuation.46 This type of evacuation requires a substantial number of personnel and equipment for traffic control. Evacuation planning must include the adequate provision of shelters and supplies for the evacuees. A number of distinct categories of people would make up the population to be evacuated. Some of these categories are transients (tourists and business travelers), residents of the area to be evacuated, employees of business in the area to be evacuated, and other residents of Clark County who happened to be in the area at the time of the incident. People in each of these categories will exhibit different, distinct behaviors that would have to be taken into account during the planning for the evacuation. One of the single largest groups of people would be transients, made up largely of tourists and business travelers. Very little is known about the behavior of transients during an evacuation.47 The most definitive work in this area is the research conducted by Drabek. He has studied transients’ responses to evacuations required due to hurricanes and earthquakes. Virtually no research has been conducted on how transients would react to an evacuation caused by a radiological materials event. Drabek found that although the majority of transients received their initial warning from the media, they were much less likely to receive their initial warning from the media than were local residents. Transients also received the initial warning message much later than local residents. A significant number of transients first received their warning message from the staff at lodging establishments. Transients perceived the warning message as lacking in precision. Often this was reinforced by denial of the threat by the lodging staff. Because transients were unfamiliar with the area and the threat, they usually delayed confirmation efforts and the resultant evacuation. The credibility of the warning message and the clarity of the evacuation instructions are very important to the successful evacuation of transients. Transients are also much more likely than residents to evacuate as a family unit. This factor is so strong, in fact, that
45 Cutter, Susan L. “Emergency Preparedness and Planning for Nuclear Power Plant Accidents.” Applied Geography, 1984. Pgs. 235-245. 46 Hurricane Evacuation Task Force Report, State of Florida, 2000. 47 Drabek, Thomas E., Disaster Evacuation Behavior, Tourists and Other Transients, University of Colorado, 1996.
Radioactive Waste Management Associates

Nevada Spent Fuel Transportation Severe Accident Analysis Page 39
transients will frequently reenter the hazard area in attempt to locate other members of the family unit. The behavior of residents of an area during evacuations is better known. The decision to stay or evacuate, and the timing of departure varies significantly with the demographic attributes of the residents.48 Women are more likely to evacuate than men; younger people are more likely than older people. Most families with small children will evacuate. Pregnant women evacuate at a much higher rate than any other category, particularly when the cause of the evacuation is the release or potential release of a toxic chemical. Less educated evacuate at lower rates than the educated. Lower income families evacuated at a lower rate than average income families, which evacuated at a lower rate than families with above-average income. There are several important considerations in these factors for the Las Vegas urban area. Several areas potentially contaminated by these accidents are low-income areas. Las Vegas also has a growing population of retirees. Evacuation of the large number of people required under the scenarios considered here is not feasible with the local resources available. In addition, local emergency response managers would be faced with the difficult decision of whether or not to close McCarren Airport. Since it was not possible to adequately control contaminated individuals, leaving the airport open would undoubtedly spread the contamination to airplanes and other airports.
Spontaneous Evacuation The public response to the accident at the Three Mile Island Nuclear Power Plant clearly demonstrates that people will react much differently to a nuclear accident than to other disasters. In response to the incident at Three Mile Island, residents evacuated spontaneously with little official direction. Some left within hours of hearing of the event. Over 144,000 persons, or 39% of the population within 15 miles of the plant evacuated.10 Although estimates of the total number of evacuees vary, it is generally agreed that over 200,000 people evacuated the area. One of the most striking attributes of this evacuation compared to other non-nuclear evacuations is that the number of evacuees and their geographic range far exceeded expectations. Although an evacuation advisory for children and pregnant women was issued, no formal evacuation order was given. The high rate of evacuation in this event is attributed to the public’s heightened awareness and fear of radiation, and the uncertainties of an unfamiliar hazard, one that could not be seen, heard, smelled, felt, or otherwise sensed. A similar spontaneous evacuation would undoubtedly occur in response to the accidents described in this report. The attempt by people unaffected by the accident to evacuate would further complicate the situation.
Follow-up Given the inability to control the area contaminated during the initial stages of the accident, and the extremely large number of people potentially contaminated by the accident,
48 Zalinksky, W. and L.A. Kosinski. The Emergency Evacuation of Cities: A Cross-National Historical and Geographic Study. Savage Maryland, Rowman & Littlefield, 1991.
Radioactive Waste Management Associates

Nevada Spent Fuel Transportation Severe Accident Analysis Page 40
significant follow-up activities would be required. One of the more challenging tasks would be to identify people who were contaminated or potentially contaminated. Medical prophylactics (i.e. thyroid blocking agents) could be given to people most at risk. In the case of Three Mile Island, thyroid-blocking agents were in short supply.49 It is likely that this would also be the case for the Las Vegas accident scenario. Ideally, blood and urine samples should be taken from all potentially contaminated persons to determine the degree of contamination. Given the large number of people involved in this incident, such sampling would not be feasible. At Three Mile Island, the most significant health effect was on the mental health of the people living in the region. There was immediate, short-lived mental distress among the people impacted. The highest levels were noted among people living within five miles of the plant, among families with preschool children, and among teenagers. This would create a significant demand on mental health care providers.
Las Vegas Decontamination Following a severe accident leading to a release of radioactive material, attempts would
likely be made to assess the possibility of decontamination of contaminated areas. The difficulty and expense of such an operation would likely affect policy decisions concerning what to decontaminate and what to cordon off. Therefore, it is useful to estimate these factors for the Las Vegas accident scenarios described in this report.
Following evacuation and the interdiction of areas near the accident site, the next action
would likely be to define the extent of radiation contamination, most likely through an aerial survey. Cesium-134 and cesium-137, gamma emitters, would be easy to detect from a helicopter. A useful picture of contamination extent might be available in a week.50 Following this characterization, two post-accident scenarios are possible:
(a) remediation following completion of an accelerated NEPA/CERCLA process.
This could be a several year process. (b) expedited remediation of highways, airports and urban land.51
The selection of post-accident scenario would effect the duration of cleanup. Previous
estimates of the duration of decontamination following a plutonium dispersal accident were made by Chanin and Murfin52. For expedited cleanup, Chanin estimates a decontamination period of 3 months for lightly contaminated urban areas (1 month for planning, 1 month for clean-up, and 1 month for certification and resettling inhabitants). However, this estimate was based on a relatively small affected area, which is not the case in the scenarios discussed in this study.
49 Report of the President’s Commission on the Accident at Three Mile Island, Washington, D.C., October, 1979. 50 Chanin, DI and WB Murfin, “Site Restoration: Estimation of Attributable Costs from Plutonium-Dispersal Accidents,” SAND96-0957, May 1996, p. 5-3. 51 Chanin, p. 5.1. 52 Chanin and Murfin, all.
Radioactive Waste Management Associates

Nevada Spent Fuel Transportation Severe Accident Analysis Page 41
In order to make a better estimate of the costs and duration of decontamination following a severe spent fuel transportation accident, a discussion of the methodology behind the estimation of decontamination time made by Chanin and Murfin is in order. The study by Chanin and Murfin estimated the activities likely to be involved in the decontamination of an accident involving the dispersal of plutonium. Although the radioactive material studied is different than the spent fuel accidents discussed in this study, the methodology and conclusions used by Chanin and Murfin to estimate decontamination costs are directly useful. For example, the study estimates the cost of decontamination as a function of the level of cleanup required to achieve an acceptable level. The cleanup level is assigned a decontamination factor (DF) of 1, meaning that no cleanup is needed to meet the criteria. Areas contaminated to up to 5 times the cleanup level are considered to be lightly contaminated, areas with levels between 5 and 10 times the cleanup level are considered to be moderately contaminated, and areas exceeding 10 times the cleanup level are considered to be heavily contaminated. For each level (light, moderate, heavy), certain cleanup assumptions are made and a cost is estimated for both rural and urban environments. Since the costs associated with cleanup which are assumed in the Chanin and Murfin study are relatively non-specific with respect to the type of contamination, they are applicable to a spent fuel accident scenario. Therefore, we use these criteria to estimate cleanup costs. In addition, we use the estimates made by Chanin and Murfin with regard to the duration of decontamination, applying the contaminated areas estimated here to their values.
Cleanup Criteria In order to estimate the extent of contamination, an estimate of the acceptable cleanup
level is required. While the actual cleanup criteria adopted after a severe accident may ultimately be dictated by local concerns, Price-Anderson insurance and Congressional activity, the EPA’s protective action guide (PAG) states that relocation is warranted when the first year dose will exceed 2 rem. Any yearly dose after the first year should not exceed 0.5 rem, and a cumulative total of 5 rem is set as the limit for a 50-year exposure period. Note this cleanup criterion is much more lax than the current guidance for Superfund sites53. Very large areas, on the order of 10 km2 for a category 5 truck accident and 90 km2 for a category 5 rail accident would have light contamination (DF<5). Chanin and Murfin estimate that a decontamination factor of 2 could be achieved by vacuuming a carpet. DF’s of up to 10 may be achieved on wood floors or linoleum. Decontamination of furniture by a factor of 2 is also achievable, similar to carpets.
Extent and level of Contamination As seen in Table 21 below, for a category 5 and category 6 rail accident, persons within
areas of 104.7 km2 and 1208.4 km2, respectively, would incur a dose 5 rems or greater over a 50-year period, assuming no cleanup. It is unlikely that areas these large could be decontaminated in one month, the estimate made in the Chanin and Murfin study. One DOE contractor54 estimated a time period of 460 days for decontamination of a rural area. For lightly contaminated areas, for which a minimum DF of 2 would be adequate, prompt vacuuming of all 53 U.S. EPA, OSWER Directive 9200.1-33P. July, 2000. “Establishment of Cleanup Levels for CERCLA Sites with Radioactive Contamination.” 54 Sandquist, Rogers & Associates, 1985.
Radioactive Waste Management Associates

Nevada Spent Fuel Transportation Severe Accident Analysis Page 42
structural exteriors would be followed by detergent scrubbing and rinsing. For building interiors, vacuuming would be followed by shampooing for carpets and upholstery.55 Heavy contamination requires removal. The difficulties of removing fission products that bond with the substrate are discussed in Chanin and Murfin56.
Chanin and Murfin further estimate a time period of 6 months for decontaminating a moderately contaminated area, and one year for a heavily contaminated area. For the category 5 truck accident, approximately 0.8 km2 falls within the moderately contaminated area, having DF’s of 5 and 10 (25-50 rem exposure), while 8 km2 is in this decontamination range for the category 5 rail accident. For moderately contaminated areas, roofing, all landscape materials, and flooring, furniture and personal effects would be removed. Highways could first be vacuumed, followed by detergent scrubbing and rinsing.
Chanin and Murfin define a heavily contaminated area as requiring a DF greater than 10.
For the category 5 truck accident, approximately 0.6 km2 would require DF’s of greater than 10 (50 rem), while 5.7 km2 would be contaminated with a DF greater than 10 for the category 5 rail accident. For heavily contaminated areas, condemnation and acquisition would be required. As Table 21 shows, for a category 5 and category 6 rail accident, persons within areas of 5.7 km2 and 102.8 km2, respectively, would incur a dose 50 rems or greater over a 50-year period. This area necessitates a decontamination factor greater than 10, what Chanin defines as a heavily contaminated area. This is not possible with present technology.
Two alternatives to decontaminating heavily contaminated areas are to raze and rebuild
an area, or to evacuate and declare an area uninhabitable. Under the first scenario, sidewalks, streets and buildings would have to be removed. The second scenario involves the permanent quarantine of heavily contaminated areas, resulting in the relocation of hotels, casinos, places of employment, and residents. This is not without precedent. Following the explosion of a high-level waste tank on September 29, 1957, near Kyshtym, Russia, 1,100 people were immediately removed. Approximately 515 square miles of land was plowed under or removed from agricultural use. By 1978, 80 square kilometers still remained off-limits.57 The purpose of including this example is not to compare the Kyshtym situation with a hypothetical relocation of Las Vegas or any other area. Rather, it is to show that permanent quarantine of once populated areas has happened in the past due to radioactive contamination.
55 Chanin, p. E-10. 56 Chanin, p. E-12. 57 Oak Ridge web site, http://public.ornl.gov/tara/ldbiblio/external/news_topic_action.cfm?SR=61&topic=weapons
Radioactive Waste Management Associates

Nevada Spent Fuel Transportation Severe Accident Analysis Page 43
Table 21: Comparison of Cleanup Areas, Based on 50-Year Long Term Individual Dose Estimates
Decontamination Factor (50-Year Long-Term Dose) 1 (5 rem) 2 (10 rem) 5 (25 rem) 10 (50 rem) 100 (500rem)
Length (km) 47.0 28.4 14.3 8.7 1.9 Width (km) 2.8 2.00 1.23 0.83 0.22 Category 5
Rail Accident Area (km2) 104.7 44.5 13.8 5.7 0.33 Length (km) 198.4 149.8 77.8 46.6 8.6 Width (km) 7.8 5.8 3.9 2.8 0.82 Category 6
Rail Accident Area (km2) 1208.4 681.6 237.9 102.8 5.6 Length (km) 12.7 7.7 4.1 2.6 0.65 Width (km) 1.1 0.75 0.45 0.30 0.08
Category 5 Truck Accident Area (km2) 11.1 4.5 1.4 0.62 0.04
Length (km) 68.1 40.5 20.4 12.4 2.6 Width (km) 3.6 2.6 1.6 1.1 0.29
Category 6 Truck Accident Area (km2) 192.2 81.3 25.7 10.6 0.59
Concrete Decontamination Technology
In this section we review the technologies that are useful for decontaminating loose particulate contamination on cement. These technologies are listed below, along with the advantages and disadvantages of each. Table 22 presents a summary of the following discussion.
Vacuuming/Scrubbing Vacuuming and scrubbing are common household techniques that can be used for particulates on cement. The techniques are dry and therefore will not cause radioactivity to work itself deeper into concrete. A major advantage is that special training is not required. Contamination is collected in vacuum cleaner bags. One disadvantage is that vacuuming cannot remove contamination from crevices. Since the area that needs to be decontaminated has been estimated to be anywhere from on the order of 11 km2 for a category 5 truck accident to over 1200 km2 for a category 6 rail accident (see Table 21), this technique would either require a large amount of time or labor. As a first step, a street sweeper could do large-scale scrubbing, but worker exposure due to inhaled radioactive particulates or due to direct gamma would have to be minimized.
Strippable Coating A polymer mixture can be applied to a contaminated surface. The contaminated layer is then pulled off and disposed of. This technique is labor intensive and would also not remove contamination from crevices. More waste would be created than by simple vacuuming.
Steam Cleaning Steam cleaning, involving heated water under pressure, may be used to clean concrete. The technique, using hand-held wands, has relatively little training and is easy to apply.
Radioactive Waste Management Associates

Nevada Spent Fuel Transportation Severe Accident Analysis Page 44
It is labor intensive. The contaminated water must be collected and either recycled (after being decontaminated) or directly disposed of. This technique therefore produces more waste than by simple vacuuming.
Sponge Blasting For this technique, surfaces are blasted under pressure with foam-cleaning media, made of water-based urethane. When striking the surface, the sponges expand and contract, like a scrubber. This requires special equipment: feed unit, sifter unit, wash unit and evaporator unit. The sifter unit is a series of progressively finer screens to remove the loosened particulates. The unit cleans on the order of 1 square foot per minute. At this rate, approximately 227 machine-years58 would be required to remediate the category 5 truck accident to levels within the EPA’s PAG. For the category 6 rail accident, it would take nearly 25,000 machine-years using this technique. A large amount of waste would be created with this technique.
CO2 Blasting CO2 pellets are blasted at a surface, loosening the contamination. The CO2 instantly sublimates, is released, and the debris falls to the ground. While this technique requires special equipment, it is easy to use and easy to train operators. The technique is labor intensive. The noise levels are high, between 75 db and 125 db. Waste handling is similar to vacuuming.
High Pressure Water Water is pressurized up to 55,000 psi, then forced through a small nozzle at speeds up to 3,000 ft/s. The technique removes part of the concrete surface. The water must then be decontaminated, else a large quantity of water would have to be disposed of. This technique is easy to apply, but requires special equipment.
Grit Blasting This technique, also called sand blasting, uses water or air under pressure. Under dry conditions, the operator must use dust control measures. Under wet conditions, large volumes of waste, containing wastewater, abrasive and contamination, must be managed. The wastewater must be decontaminated before it is recycled. The technique is labor intensive.
Grinding Grinding involves abrading the surface with grinding wheels or tungsten-carbide surfacing disks. HEPA-filtered vacuum units would hold down the dust. One machine could remove several thousand square feet a day to a depth of ½ inch.
58 A machine year refers to the amount of cleanup a single machine can accomplish in a single year. For a job that takes 227 machine years, it could be accomplished in 1 year using 227 machines, or 227 years using one machine.
Radioactive Waste Management Associates

Nevada Spent Fuel Transportation Severe Accident Analysis Page 45
Scabbling Piston heads strike and chip away at a concrete surface. A vacuum must be incorporated in the design to hold down air concentrations. The removal rate is on the order of 30 – 40 square feet per hour. The technique is easy to use and produces no more waste than grinding. Similar to grinding, the dust would have to be held down.
Flame Scarifying Flaming and microwave scabbling involve heating the moisture in the cement, bursting the surface layer into small chips. The contaminated debris can then be collected in a vacuum system. Flame units have had a width up to 3 feet and a traverse speed of about 10 feet/minute. This technique can also be done remotely.
Radioactive Waste Management Associates

Nev
ada
Spen
t Fue
l Tra
nspo
rtatio
n Se
vere
Acc
iden
t Ana
lysi
s Pa
ge
46
Tab
le 2
2: C
ompa
riso
n of
Var
ious
Dec
onta
min
atio
n T
echn
olog
ies
Scrubbing
Vacuuming
Strippable coating
Steam cleaning
Sponge blasting
CO2 blasting
High pressure water
Grit blasting
Grinding
Scarifier
Flaming
App
licat
ion
Loos
e pa
rticu
late
con
tam
inat
ion
• •
• •
• •
o
o
oo
Bar
e an
d pa
inte
d co
ncre
te
o o
o o
• o
• •
• •
• Sm
all h
and
tool
s
oSp
ecia
l equ
ipm
ent
•
•
• A
dvan
tage
s
Easy
to a
pply
•
• •
o
oo
oo
oo
Easy
was
te h
andl
ing/
disp
osal
o
• o
oo
oEa
sy to
trai
n op
erat
ors
• •
• o
o
oo
oo
Dis
adva
ntag
es
Diff
icul
t to
rem
ove
cont
amin
atio
n fr
om c
revi
ces
xx
xx
Labo
r int
ensi
ve
xx
xxx
xx
xIn
crea
sed
volu
mes
of w
aste
un
less
recy
clin
g po
ssib
le
x
xx
LE
GE
ND
: A
PPL
ICA
TIO
NS
AD
VA
NT
AG
ES
DIS
AD
VA
NT
AG
ES
o
Mar
gina
lly e
ffec
tive
o M
argi
nally
adv
anta
geou
s
x D
isad
vant
ageo
us
• H
ighl
y ef
fect
ive
• H
ighl
y ad
vant
ageo
us
xx H
ighl
y di
sadv
anta
geou
s
Radi
oact
ive
Was
te M
anag
emen
t Ass
ocia
tes

Nevada Spent Fuel Transportation Severe Accident Analysis Page 47
The eventual cost of cleanup from a severe accident, and its duration, are affected by
many factors in addition to the physical costs of removing and disposing of contamination. For example, if a severe rail accident near the Las Vegas Strip resulted in the temporary closure of a large section of the casinos and hotels situated there, there would be costs in the form of loss of business and gaming revenue for the hotel owners, and loss of income for its employees. According to the Nevada Department of Employment, Training, and Rehabilitation, the average weekly wages for Clark County employees in the “service” sector were $623 in the 4 Quarter of 2000 . If, for example, 1/3 of the employees located on the Las Vegas Strip were unable to work for the duration of a cleanup activity, this would represent a loss of salary of $4.5 million per day .
th
59
60
The loss of gaming revenue would also be extremely significant if casinos were forced to close due to an extended decontamination process. Again, assuming that 1/3 of the Strip Casinos were forced to close their doors for the duration of a cleanup, this would represent a loss in profit to the casino of approximately $4.4 million per day . The loss of gaming revenues and salaries represents, in turn, a loss of tax income to the State of Nevada.
61
Additionally, there would be significant costs to Las Vegas residents due to lost income
and housing. For the category 5 rail accident discussed in this report, approximately 32 mi of mostly residential area was estimated to be contaminated above the levels of the EPA PAG, affecting an estimated 71,000 residents . These residents would suffer from loss of personal property, loss of property value, and potential loss of employment if their place of work were also in a contaminated area. If a large number of people were evacuated, the problem of housing these people for extended periods of time would be an enormous additional cost.
Other Factors Affecting Cleanup Cost Estimates
2
62
In addition, there are a large number of persons who would reside outside the
contaminated areas but still suffer from lost income. Many commuters would be expected to suffer from lost income if their place of business was forced to close during a decontamination procedure.
The implications of long-term evacuation and its impact on Las Vegas are beyond the scope of this report. Other reports commissioned by the State would go into these issues in much greater depth.
It is possible to make an estimate of the cleanup, decontamination, and relocation costs
associated with the spent fuel shipping accidents hypothesized in Las Vegas. To do this, we
59 http://detr.state.nv.us/lmi/data/avgwages/avg_003.htm 60 $623/week *152,272 employees on strip (Table 10) *1/3 (assumption of affected workers) *1/7(average wages per day) 61 2000 Strip Gaming Revenue/3, converted to revenue/day 62 calculated by estimating the area of residential areas contaminated by levels greater than the EPA PAG (all areas except the Las Vegas Strip, the Boulder Strip, and the Downtown/Fremont Street Area), and multiplying by the estimated population density in each area.
Radioactive Waste Management Associates

Nevada Spent Fuel Transportation Severe Accident Analysis Page 48
simply estimate the dollar/area costs estimated by Chanin and Murfin by the area of contamination for each of the three contamination areas: light, moderate, and heavy contamination. Table 23 presents these figures.
Table 23: Decontamination Cost Estimates: Severe Spent Fuel Accidents in Las Vegas Category 5 truck
accident Category 6 truck accident
Category 5 rail accident
Category 6 rail accident
Area heavily contaminated (km2)
0.68 10.6 5.7 102.8
Area moderately contaminated (km2)
0.8 15.1 8.1 135.1
Area lightly contaminated (km2)
9.7 166.5 90.9 970.5
Cost/km2, heavy contamination*
$394,604,748 $394,604,748 $394,604,748 $394,604,748
Cost/km2, moderate contamination*
$182,592,165 $182,592,165 $182,592,165 $182,592,165
Cost/km2, light contamination*
$128,263,609 $128,263,609 $128,263,609 $128,263,609
Total Cleanup Costs, Billions
$1.7 billion $28.3 billion $15.4 billion $189.7 billion
Table 23 shows that, even without considering all of the economic impacts associated
with the aftermath of a spent fuel transportation accident, the dollar figures would be devastating63.
63 Previous analyses by RWMA estimated somewhat higher costs for the cleanup of an urban area following a severe accident. In those analyses, a cleanup criteria of 0.2 µCu/m2 was used (roughly 178 mrem/yr for Cs-134, roughly 35 mrem/yr for Cs-134.
Radioactive Waste Management Associates 48

Nevada Spent Fuel Transportation Severe Accident Analysis Page 49
4. Rural Truck Accident: West Wendover, Nevada As was stated in Section 1 of this report, a representative rural truck accident location was specified to occur on Interstate 80 near the exit to West Wendover, Nevada, on the Utah-Nevada border. At this location there are several rock formations on the highway waysides, creating the possibility for a severe impact into a hard surface. The rural nature of the highway at this point also creates the possibility that trucks could be traveling at high speeds. The combination of the rocky outcroppings and the potential for high-speed travel creates the possibility of a severe impact scenario. Additionally, there is the possibility of a fire caused by a collision with gasoline tanker trucks that frequent the area.
In this section we discuss the specific situation in West Wendover for a hypothetical truck accident resulting in the release of radioactive material. After an initial overview of the demography of the region, we will discuss its average meteorological conditions, resulting in the adoption of a characteristic wind speed, direction, and stability class. Next, we estimate the ground and air contamination resulting from the postulated accident. Using this, we estimate individual doses to persons assumed to remain at fixed distances downwind from the accident. After estimating the population density of the area of West Wendover, we estimate the population dose (both short and long-term) to its residents, employees, and visitors. We end this discussion with some notes on evacuation and decontamination.
General Characteristics of West Wendover, Nevada
West Wendover, Nevada, is a border town whose growth is dependent on the gaming industry. According to the 2,000 U.S. Census, it had a population of 4,721. Currently, the city has 5 major casinos that serve as its major source of industry and employment,64 serving some 700,000 annual visitors65. The upcoming 2002 Winter Olympics in nearby Salt Lake City (90 miles to the east) have given rise to plans for further expansion of the city’s casinos.
West Wendover lies between the Great Salt Flats to the east and mountains to the west. This results in a somewhat distinctive meteorological profile, atypical for Nevada, with the predominant wind direction coming in from the east (see the wind rose for West Wendover, attached as Figure 2).
Individual Dose and Surface Contamination Estimates
Figure 13 shows the plume diagrams for a severe truck accident in West Wendover. Isopleths of constant dose are shown for the acute (24-hour exposure) dose obtained by exposure
64 Source : www.wendover.org 65 See the section on population density, below
Radioactive Waste Management Associates 49
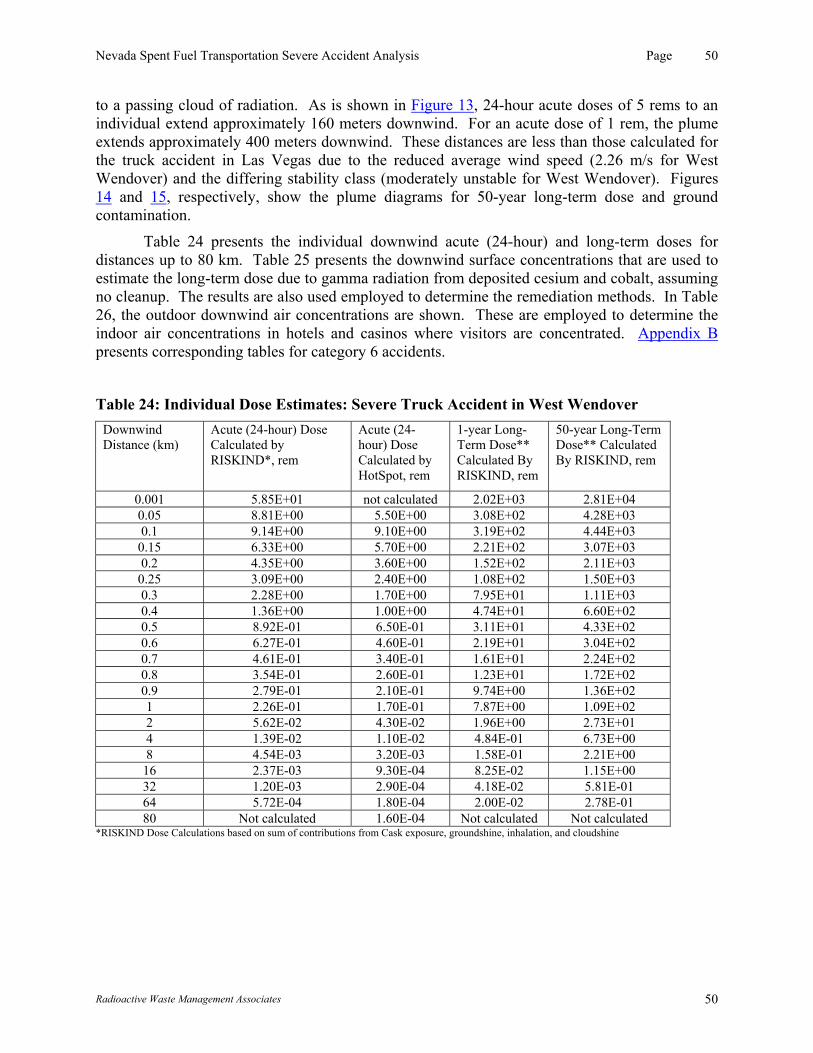
Nevada Spent Fuel Transportation Severe Accident Analysis Page 50
to a passing cloud of radiation. As is shown in Figure 13, 24-hour acute doses of 5 rems to an individual extend approximately 160 meters downwind. For an acute dose of 1 rem, the plume extends approximately 400 meters downwind. These distances are less than those calculated for the truck accident in Las Vegas due to the reduced average wind speed (2.26 m/s for West Wendover) and the differing stability class (moderately unstable for West Wendover). Figures 14 and 15, respectively, show the plume diagrams for 50-year long-term dose and ground contamination.
Table 24 presents the individual downwind acute (24-hour) and long-term doses for distances up to 80 km. Table 25 presents the downwind surface concentrations that are used to estimate the long-term dose due to gamma radiation from deposited cesium and cobalt, assuming no cleanup. The results are also used employed to determine the remediation methods. In Table 26, the outdoor downwind air concentrations are shown. These are employed to determine the indoor air concentrations in hotels and casinos where visitors are concentrated. Appendix B presents corresponding tables for category 6 accidents.
Table 24: Individual Dose Estimates: Severe Truck Accident in West Wendover Downwind Distance (km)
Acute (24-hour) Dose Calculated by RISKIND*, rem
Acute (24-hour) Dose Calculated by HotSpot, rem
1-year Long-Term Dose** Calculated By RISKIND, rem
50-year Long-Term Dose** Calculated By RISKIND, rem
0.001 5.85E+01 not calculated 2.02E+03 2.81E+04 0.05 8.81E+00 5.50E+00 3.08E+02 4.28E+03 0.1 9.14E+00 9.10E+00 3.19E+02 4.44E+03
0.15 6.33E+00 5.70E+00 2.21E+02 3.07E+03 0.2 4.35E+00 3.60E+00 1.52E+02 2.11E+03
0.25 3.09E+00 2.40E+00 1.08E+02 1.50E+03 0.3 2.28E+00 1.70E+00 7.95E+01 1.11E+03 0.4 1.36E+00 1.00E+00 4.74E+01 6.60E+02 0.5 8.92E-01 6.50E-01 3.11E+01 4.33E+02 0.6 6.27E-01 4.60E-01 2.19E+01 3.04E+02 0.7 4.61E-01 3.40E-01 1.61E+01 2.24E+02 0.8 3.54E-01 2.60E-01 1.23E+01 1.72E+02 0.9 2.79E-01 2.10E-01 9.74E+00 1.36E+02 1 2.26E-01 1.70E-01 7.87E+00 1.09E+02 2 5.62E-02 4.30E-02 1.96E+00 2.73E+01 4 1.39E-02 1.10E-02 4.84E-01 6.73E+00 8 4.54E-03 3.20E-03 1.58E-01 2.21E+00
16 2.37E-03 9.30E-04 8.25E-02 1.15E+00 32 1.20E-03 2.90E-04 4.18E-02 5.81E-01 64 5.72E-04 1.80E-04 2.00E-02 2.78E-01 80 Not calculated 1.60E-04 Not calculated Not calculated
*RISKIND Dose Calculations based on sum of contributions from Cask exposure, groundshine, inhalation, and cloudshine
Radioactive Waste Management Associates 50

Nevada Spent Fuel Transportation Severe Accident Analysis Page 51
Table 25: Surface Concentrations (mCi/m2): Severe Truck Accident in West Wendover Downwind Distance (km) Surface Concentration (µCi/m2)
calculated by RISKIND Surface Concentration (µCi/m2) calculated by HotSpot
0.001 3.61E+04 not calculated 0.05 5.48E+03 3.60E+03 0.1 5.65E+03 5.90E+03
0.15 3.88E+03 3.70E+03 0.2 2.65E+03 2.40E+03
0.25 1.87E+03 1.60E+03 0.3 1.37E+03 1.10E+03 0.4 8.10E+02 6.60E+02 0.5 5.28E+02 4.30E+02 0.6 3.68E+02 3.00E+02 0.7 2.70E+02 2.20E+02 0.8 2.07E+02 1.70E+02 0.9 1.62E+02 1.30E+02 1 1.30E+02 1.10E+02 2 3.19E+01 2.80E+01 4 7.71E+00 7.40E+00 8 2.47E+00 2.10E+00
16 1.25E+00 6.10E-01 32 6.00E-01 1.90E-01 64 2.56E-01 1.20E-01 80 not calculated 1.00E-01
Table 26: Time-Integrated Air Concentrations (Ci-s/m3): Severe Truck Accident in West Wendover
Downwind Distance (km) Air Concentration (Ci-s/m3) calculated by RISKIND
Air Concentration (Ci-s/m3) calculated by HotSpot
0.001 1.30E+01 not calculated 0.05 1.97E+00 1.30E+00 0.1 2.05E+00 2.10E+00
0.15 1.42E+00 1.40E+00 0.2 9.83E-01 8.60E-01
0.25 7.00E-01 5.90E-01 0.3 5.18E-01 4.20E-01 0.4 3.10E-01 2.40E-01 0.5 2.04E-01 1.60E-01 0.6 1.43E-01 1.10E-01 0.7 1.06E-01 8.30E-02 0.8 8.15E-02 6.40E-02 0.9 6.43E-02 5.10E-02 1 5.22E-02 4.10E-02 2 1.31E-02 1.10E-02 4 3.28E-03 2.90E-03 8 1.09E-03 8.20E-04
16 5.73E-04 2.40E-04 32 3.00E-04 7.70E-05 64 1.54E-04 4.90E-05
Radioactive Waste Management Associates 51

Nevada Spent Fuel Transportation Severe Accident Analysis Page 52
80 not calculated 4.30E-05
Population Density Estimate
In order to estimate the population dose due to the above accidents, it is necessary to first estimate the population density. West Wendover is highly dependent on its gaming industry for revenue and employment, and consequently a population density estimate must take into account the high non-resident population.
Tourist Population Estimate West Wendover is a popular destination for travelers from nearby Salt Lake City, since it is the first stop on Interstate 80 in Nevada, where gambling is legal. According to the Nevada Gaming Control Board and the Nevada Department of Employment, Training and Rehabilitation, West Wendover Casinos amassed over $127 million dollars in gaming wins between the second quarter of 2000 and the first quarter of 200166.
This study assumes a correlation between relative tourist population and gambling revenue. This method was chosen, instead of simply using data concerning the lodging patterns of tourists, in order to better estimate where tourists spend their time while visiting. This also helps to account for visitors to West Wendover who do not stay overnight, either returning home or stopping in as a break from travel. In order to estimate the number of visitors to West Wendover, a correlation between gross gaming revenue and visitor volume is needed. Since there is no readily available information on the number of visitors entering West Wendover daily, this study estimates the visitor volume by assuming that people spend approximately the same money at casinos in West Wendover as they do in Las Vegas. Data on visitor volume and gross gaming revenue in Las Vegas were obtained from the Las Vegas Convention and Visitors Authority for the years 1996-2000. From these, and average ratio of gaming win/person was estimated, as follows:
Table 27: Estimate of Average Gaming Revenue per Visitor: Las Vegas Year Visitor Volume Gross Gaming
Revenue ($) Ratio, Gaming
Revenue ($)/visitor 1996 29,636,361 4,618,674,000 156 1997 30,464,635 4,904,383,000 161 1998 30,605,128 5,003,540,000 163 1999 33,809,134 5,716,396,000 169 2000 35,849,691 6,078,912,000 170 Average 32,072,990 5,264,381,000 164
66 Nevada Gross Gaming Win, Prepared by the Research and Analysis Bureau, Nevada Department of Employment, Training, and Rehabilitation. detr.state.nv.us/lmi/data/indicators/gamewinq.htm.
Radioactive Waste Management Associates 52

Nevada Spent Fuel Transportation Severe Accident Analysis Page 53
Using the assumption that West Wendover casinos will attain an average $164 for every visitor to the area, we can estimate the tourist population to the region. This is shown in Table 28.
Table 28: Estimated Visitor Population to West Wendover: 2nd Quarter 2000 through 1st Quarter 2001
Gross Gaming Revenue ($) Estimated Tourist Population, Yearly
Estimated Tourist Population, Daily
127,152,000 776,300 2,127 As was previously stated, there are currently 5 major casinos in West Wendover. We will refer to these as Hotels A-E. We make the assumption that visitors to West Wendover will be located in one of these 5 establishments, with the relative proportions determined by the size of their casinos. The assumed visitor population in each of these hotels is given in Table 29.
Table 29: Estimated Visitors to 5 Casinos in West Wendover: 2nd Quarter 2000 through 1st Quarter 2001
Casino Casino Size (ft2)* Estimated Daily Tourist Population
A 47,358 695 B 34,624 508 C 25,538 375 D 24,880 365 E 12,500 183
Total 144,900 2127 *Source : www.gamblinganswers.com
Employee Population Estimate Another significant population source for the gambling areas of West Wendover is the employee population. The Nevada Department of Employment, Training, and Rehabilitation prepares lists of the top employers in each county, along with their estimated employee counts. Table 30 presents this data for the 5 casinos discussed above.
Table 30: Estimated Visitors to 5 Casinos in West Wendover: 2nd Quarter 2000 through 1st Quarter 2001
Casino Number of Employees (3rd Quarter 2000)*
Estimated Number of Employees “On Shift” at a
given time** A 500-599 137 B 600-699 162 C 400-499 112 D 600-699 162 E 200-299 62
Total 2300-2795 637
Radioactive Waste Management Associates 53
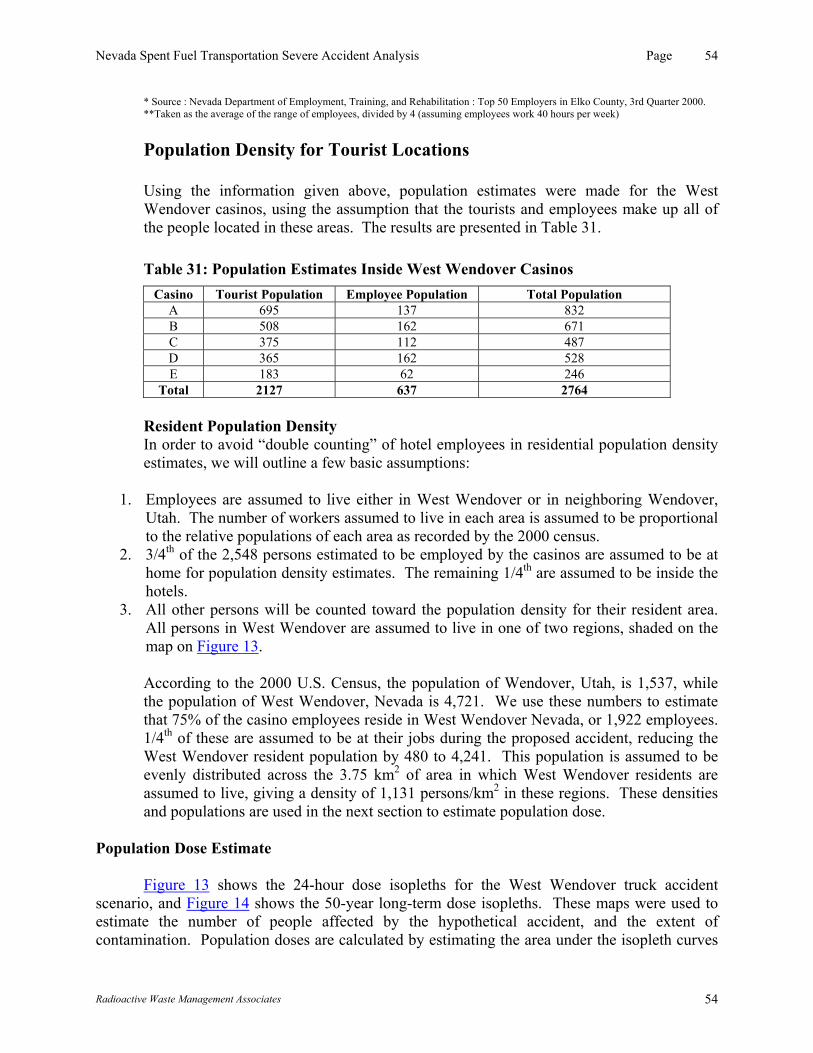
Nevada Spent Fuel Transportation Severe Accident Analysis Page 54
* Source : Nevada Department of Employment, Training, and Rehabilitation : Top 50 Employers in Elko County, 3rd Quarter 2000. **Taken as the average of the range of employees, divided by 4 (assuming employees work 40 hours per week) Population Density for Tourist Locations Using the information given above, population estimates were made for the West Wendover casinos, using the assumption that the tourists and employees make up all of the people located in these areas. The results are presented in Table 31.
Table 31: Population Estimates Inside West Wendover Casinos Casino Tourist Population Employee Population Total Population
A 695 137 832 B 508 162 671 C 375 112 487 D 365 162 528 E 183 62 246
Total 2127 637 2764 Resident Population Density In order to avoid “double counting” of hotel employees in residential population density estimates, we will outline a few basic assumptions:
1. Employees are assumed to live either in West Wendover or in neighboring Wendover,
Utah. The number of workers assumed to live in each area is assumed to be proportional to the relative populations of each area as recorded by the 2000 census.
2. 3/4th of the 2,548 persons estimated to be employed by the casinos are assumed to be at home for population density estimates. The remaining 1/4th are assumed to be inside the hotels.
3. All other persons will be counted toward the population density for their resident area. All persons in West Wendover are assumed to live in one of two regions, shaded on the map on Figure 13.
According to the 2000 U.S. Census, the population of Wendover, Utah, is 1,537, while the population of West Wendover, Nevada is 4,721. We use these numbers to estimate that 75% of the casino employees reside in West Wendover Nevada, or 1,922 employees. 1/4th of these are assumed to be at their jobs during the proposed accident, reducing the West Wendover resident population by 480 to 4,241. This population is assumed to be evenly distributed across the 3.75 km2 of area in which West Wendover residents are assumed to live, giving a density of 1,131 persons/km2 in these regions. These densities and populations are used in the next section to estimate population dose.
Population Dose Estimate
Figure 13 shows the 24-hour dose isopleths for the West Wendover truck accident scenario, and Figure 14 shows the 50-year long-term dose isopleths. These maps were used to estimate the number of people affected by the hypothetical accident, and the extent of contamination. Population doses are calculated by estimating the area under the isopleth curves
Radioactive Waste Management Associates 54

Nevada Spent Fuel Transportation Severe Accident Analysis Page 55
in each populated region. In the cases where isopleths pass over hotels and casinos, the number of affected people was estimated by taking the percentage of the building falling under the isopleth and multiplying it by the number of persons assumed to be in the building. The isopleth curves are generated using the HotSpot Health Physics code and imported into ArcView GIS software. It must be noted that these calculations assume no shielding by the buildings in the event of an accident. We have previously presented an estimate of the expected level of contamination to a hotel lying 420 meters downwind from a train accident release site: we will perform a similar calculation for this scenario.
Appendix D provides detailed calculations of population and individual dose results for a
severe truck accident scenario in West Wendover. In this section, we will simply present the aggregate results.
Table 32: Acute (24-hour) Dose Estimates: Truck Accident in West Wendover
Total Affected Population Acute Population Dose (person-rem)
Expected Range of Cancer Fatalitiesa
5,427 799 0.40-2.6 a The range of latent cancer risks is 5 x 10⁻⁴ lcf/person-rem to 32 x 10-4 lcf/person-rem.
Radioactive Waste Management Associates 55

Nevada Spent Fuel Transportation Severe Accident Analysis Page 56
Table 33: Long-Term Population Dose Estimates: Truck Accident in West Wendover Long-Term Population Dose (person-rem)
Total Affected
Population
1-year long term dose
(person-rem) Latent Cancer
Fatalities
50-year long term dose
(person-rem) Latent Cancer
Fatalities 5,427 27,886 14 -- 89 388,326 194 -- 1,243
The results shown above assume that there is no shielding of the exposed population. In
essence, this calculation assumes that the entire population is outside at the time of the accident. While this provides a useful bounding case for a severe accident, it is unrealistic. In an attempt to provide an estimate of the effect to persons staying inside during a proposed event, an estimate of the dose to persons inside a hypothetical hotel was made. A similar estimate to the one made for the rail accident in Las Vegas is made here, as is discussed below.
Contamination Inside Hotels: A Hypothetical Example
This exercise is very similar to the one performed for the Las Vegas hotel example, with the biggest difference lying in the assumed size of the hotel. Since the casinos in Wendover are significantly smaller than the mega-resorts on the Las Vegas Strip, this was taken into account.
Consider a hotel located 275 meters directly downwind from the site of the proposed
release. Using a simplified model of a hotel facility that is described in Appendix E, a rough estimation of the extent and duration of contamination inside a 4-story building following a radioactive release was made. Table 34 shows the characteristics of the model hotel. Table 35 summarizes the general results of the calculation, which accounts for partial filtration of particulates by the air intakes, deposition of particulates prior to reaching the hotel, and dilution of the plume by ambient air. Figures 16 and 17 show the assumed Gaussian distribution of the plume, and the concentration in the building as a function of time following the maximum exposure.
Assuming a ground level puff release from a truck cask, and average West Wendover
meteorological conditions, the average time for the peak concentration of the radioactive cloud to reach the air intake of a hotel 275 meters from the accident scene is 121 seconds, as seen in Table 35. Assuming a Gaussian distribution, over 99% of the radioactivity in the cloud is contained within + 3 standard deviations of the mean. Therefore, it can be estimated that over 99% of the radioactive cloud will pass the hotel air intake in 119.5 seconds (6 standard deviations). As was the case for the Las Vegas hotel calculation, we consider it unlikely that hotel managers could be informed and take decisive actions to cut off the ventilation systems in this brief amount of time. The air concentration inside the hypothetical hotel will vary with time due to deposition and dilution of the contaminated plume. In a real situation, the hotel would experience a buildup in concentration as the cloud enters the hotel and mixes with the air present, then a gradual decline as particulates are deposited onto surfaces and swept out through the exhaust. For our
Radioactive Waste Management Associates 56
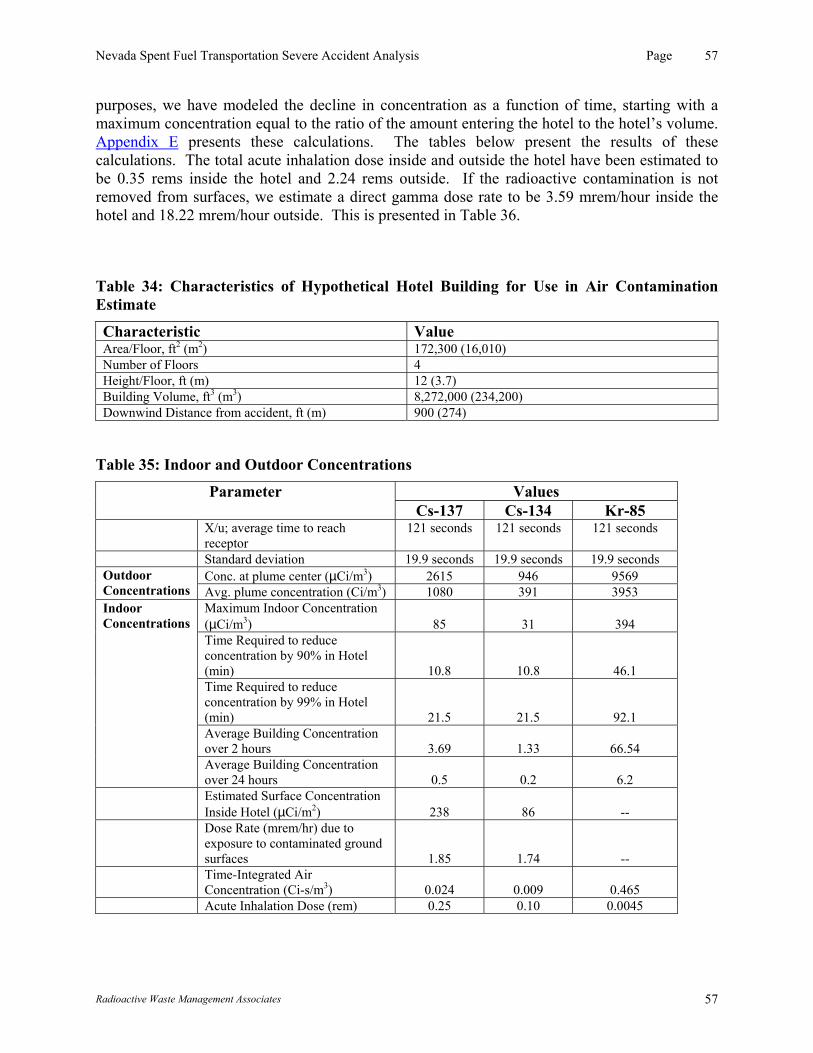
Nevada Spent Fuel Transportation Severe Accident Analysis Page 57
purposes, we have modeled the decline in concentration as a function of time, starting with a maximum concentration equal to the ratio of the amount entering the hotel to the hotel’s volume. Appendix E presents these calculations. The tables below present the results of these calculations. The total acute inhalation dose inside and outside the hotel have been estimated to be 0.35 rems inside the hotel and 2.24 rems outside. If the radioactive contamination is not removed from surfaces, we estimate a direct gamma dose rate to be 3.59 mrem/hour inside the hotel and 18.22 mrem/hour outside. This is presented in Table 36.
Table 34: Characteristics of Hypothetical Hotel Building for Use in Air Contamination Estimate
Characteristic Value Area/Floor, ft2 (m2) 172,300 (16,010) Number of Floors 4 Height/Floor, ft (m) 12 (3.7) Building Volume, ft3 (m3) 8,272,000 (234,200) Downwind Distance from accident, ft (m) 900 (274)
Table 35: Indoor and Outdoor Concentrations
Values Parameter Cs-137 Cs-134 Kr-85
X/u; average time to reach receptor
121 seconds 121 seconds 121 seconds
Standard deviation 19.9 seconds 19.9 seconds 19.9 seconds Conc. at plume center (µCi/m3) 2615 946 9569 Outdoor
Concentrations Avg. plume concentration (Ci/m3) 1080 391 3953 Maximum Indoor Concentration (µCi/m3) 85 31 394 Time Required to reduce concentration by 90% in Hotel (min) 10.8 10.8 46.1 Time Required to reduce concentration by 99% in Hotel (min) 21.5 21.5 92.1 Average Building Concentration over 2 hours 3.69 1.33 66.54
Indoor Concentrations
Average Building Concentration over 24 hours 0.5 0.2 6.2
Estimated Surface Concentration Inside Hotel (µCi/m2) 238 86 --
Dose Rate (mrem/hr) due to exposure to contaminated ground surfaces 1.85 1.74 --
Time-Integrated Air Concentration (Ci-s/m3) 0.024 0.009 0.465
Acute Inhalation Dose (rem) 0.25 0.10 0.0045
Radioactive Waste Management Associates 57
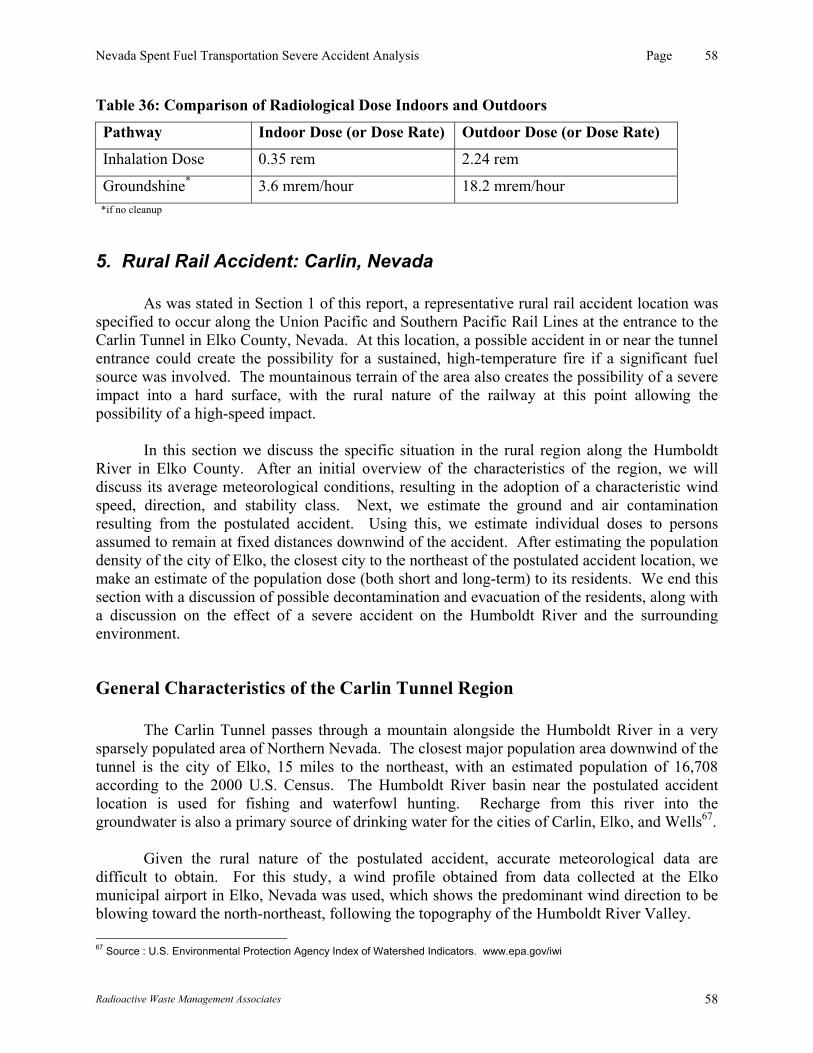
Nevada Spent Fuel Transportation Severe Accident Analysis Page 58
Table 36: Comparison of Radiological Dose Indoors and Outdoors
Pathway Indoor Dose (or Dose Rate) Outdoor Dose (or Dose Rate)
Inhalation Dose 0.35 rem 2.24 rem
Groundshine* 3.6 mrem/hour 18.2 mrem/hour *if no cleanup
5. Rural Rail Accident: Carlin, Nevada As was stated in Section 1 of this report, a representative rural rail accident location was specified to occur along the Union Pacific and Southern Pacific Rail Lines at the entrance to the Carlin Tunnel in Elko County, Nevada. At this location, a possible accident in or near the tunnel entrance could create the possibility for a sustained, high-temperature fire if a significant fuel source was involved. The mountainous terrain of the area also creates the possibility of a severe impact into a hard surface, with the rural nature of the railway at this point allowing the possibility of a high-speed impact. In this section we discuss the specific situation in the rural region along the Humboldt River in Elko County. After an initial overview of the characteristics of the region, we will discuss its average meteorological conditions, resulting in the adoption of a characteristic wind speed, direction, and stability class. Next, we estimate the ground and air contamination resulting from the postulated accident. Using this, we estimate individual doses to persons assumed to remain at fixed distances downwind of the accident. After estimating the population density of the city of Elko, the closest city to the northeast of the postulated accident location, we make an estimate of the population dose (both short and long-term) to its residents. We end this section with a discussion of possible decontamination and evacuation of the residents, along with a discussion on the effect of a severe accident on the Humboldt River and the surrounding environment.
General Characteristics of the Carlin Tunnel Region The Carlin Tunnel passes through a mountain alongside the Humboldt River in a very sparsely populated area of Northern Nevada. The closest major population area downwind of the tunnel is the city of Elko, 15 miles to the northeast, with an estimated population of 16,708 according to the 2000 U.S. Census. The Humboldt River basin near the postulated accident location is used for fishing and waterfowl hunting. Recharge from this river into the groundwater is also a primary source of drinking water for the cities of Carlin, Elko, and Wells67. Given the rural nature of the postulated accident, accurate meteorological data are difficult to obtain. For this study, a wind profile obtained from data collected at the Elko municipal airport in Elko, Nevada was used, which shows the predominant wind direction to be blowing toward the north-northeast, following the topography of the Humboldt River Valley. 67 Source : U.S. Environmental Protection Agency Index of Watershed Indicators. www.epa.gov/iwi
Radioactive Waste Management Associates 58
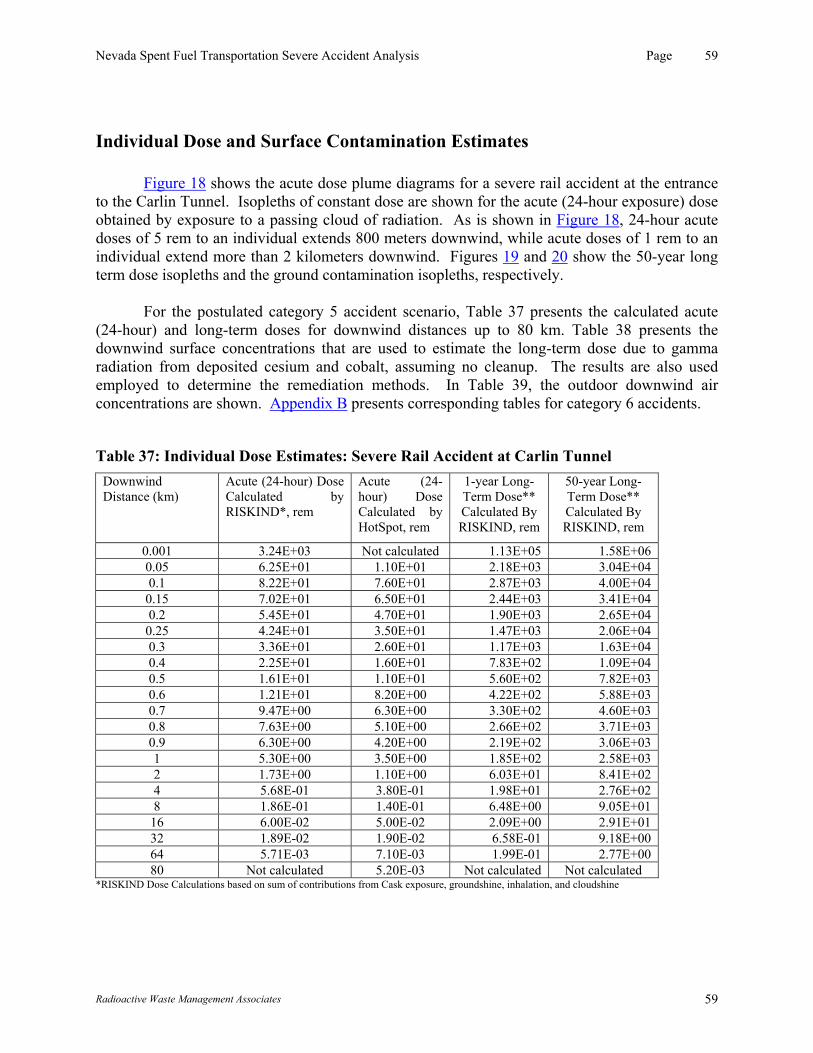
Nevada Spent Fuel Transportation Severe Accident Analysis Page 59
Individual Dose and Surface Contamination Estimates Figure 18 shows the acute dose plume diagrams for a severe rail accident at the entrance to the Carlin Tunnel. Isopleths of constant dose are shown for the acute (24-hour exposure) dose obtained by exposure to a passing cloud of radiation. As is shown in Figure 18, 24-hour acute doses of 5 rem to an individual extends 800 meters downwind, while acute doses of 1 rem to an individual extend more than 2 kilometers downwind. Figures 19 and 20 show the 50-year long term dose isopleths and the ground contamination isopleths, respectively. For the postulated category 5 accident scenario, Table 37 presents the calculated acute (24-hour) and long-term doses for downwind distances up to 80 km. Table 38 presents the downwind surface concentrations that are used to estimate the long-term dose due to gamma radiation from deposited cesium and cobalt, assuming no cleanup. The results are also used employed to determine the remediation methods. In Table 39, the outdoor downwind air concentrations are shown. Appendix B presents corresponding tables for category 6 accidents.
Table 37: Individual Dose Estimates: Severe Rail Accident at Carlin Tunnel Downwind Distance (km)
Acute (24-hour) Dose Calculated by RISKIND*, rem
Acute (24-hour) Dose Calculated by HotSpot, rem
1-year Long-Term Dose** Calculated By RISKIND, rem
50-year Long-Term Dose** Calculated By RISKIND, rem
0.001 3.24E+03 Not calculated 1.13E+05 1.58E+06 0.05 6.25E+01 1.10E+01 2.18E+03 3.04E+04 0.1 8.22E+01 7.60E+01 2.87E+03 4.00E+04
0.15 7.02E+01 6.50E+01 2.44E+03 3.41E+04 0.2 5.45E+01 4.70E+01 1.90E+03 2.65E+04
0.25 4.24E+01 3.50E+01 1.47E+03 2.06E+04 0.3 3.36E+01 2.60E+01 1.17E+03 1.63E+04 0.4 2.25E+01 1.60E+01 7.83E+02 1.09E+04 0.5 1.61E+01 1.10E+01 5.60E+02 7.82E+03 0.6 1.21E+01 8.20E+00 4.22E+02 5.88E+03 0.7 9.47E+00 6.30E+00 3.30E+02 4.60E+03 0.8 7.63E+00 5.10E+00 2.66E+02 3.71E+03 0.9 6.30E+00 4.20E+00 2.19E+02 3.06E+03 1 5.30E+00 3.50E+00 1.85E+02 2.58E+03 2 1.73E+00 1.10E+00 6.03E+01 8.41E+02 4 5.68E-01 3.80E-01 1.98E+01 2.76E+02 8 1.86E-01 1.40E-01 6.48E+00 9.05E+01
16 6.00E-02 5.00E-02 2.09E+00 2.91E+01 32 1.89E-02 1.90E-02 6.58E-01 9.18E+00 64 5.71E-03 7.10E-03 1.99E-01 2.77E+00 80 Not calculated 5.20E-03 Not calculated Not calculated
*RISKIND Dose Calculations based on sum of contributions from Cask exposure, groundshine, inhalation, and cloudshine
Radioactive Waste Management Associates 59

Nevada Spent Fuel Transportation Severe Accident Analysis Page 60
Table 38: Surface Concentrations (mCi/m2): Severe Rail Accident at Carlin Tunnel Downwind Distance (km) Surface Concentration (µCi/m2)
calculated by RISKIND Surface Concentration (µCi/m2) calculated by HotSpot
0.001 2.03E+06 not calculated 0.05 3.91E+04 7.40E+03 0.1 5.11E+04 5.00E+04
0.15 4.33E+04 4.30E+04 0.2 3.34E+04 3.10E+04
0.25 2.58E+04 2.30E+04 0.3 2.03E+04 1.70E+04 0.4 1.33E+04 1.10E+04 0.5 9.46E+03 7.40E+03 0.6 7.05E+03 5.40E+03 0.7 5.47E+03 4.20E+03 0.8 4.38E+03 3.30E+03 0.9 3.58E+03 2.70E+03 1 2.99E+03 2.30E+03 2 9.27E+02 7.30E+02 4 2.84E+02 2.50E+02 8 1.16E+02 8.90E+01
16 2.43E+01 3.30E+01 32 6.57E+00 1.30E+01 64 1.62E+00 4.70E+00 80 not calculated 3.40E+00
Table 39: Time-Integrated Air Concentrations (Ci-s/m3): Severe Rail Accident at Carlin Tunnel
Downwind Distance (km) Air Concentration (Ci-s/m3) calculated by RISKIND
Air Concentration (Ci-s/m3) calculated by HotSpot
0.001 8.24E+02 not calculated 0.05 1.59E+01 3.00E+00 0.1 2.10E+01 2.10E+01
0.15 1.79E+01 1.80E+01 0.2 1.40E+01 1.30E+01
0.25 1.09E+01 9.50E+00 0.3 8.69E+00 7.20E+00 0.4 5.84E+00 4.50E+00 0.5 4.20E+00 3.10E+00 0.6 3.19E+00 2.30E+00 0.7 2.51E+00 1.80E+00 0.8 2.03E+00 1.40E+00 0.9 1.68E+00 1.20E+00 1 1.42E+00 1.00E+00 2 4.79E-01 3.30E-01 4 1.64E-01 1.20E-01 8 6.03E-02 4.50E-02
16 2.01E-02 1.80E-02 32 7.13E-03 7.90E-03 64 2.55E-03 3.60E-03 80 not calculated 2.80E-03
Radioactive Waste Management Associates 60
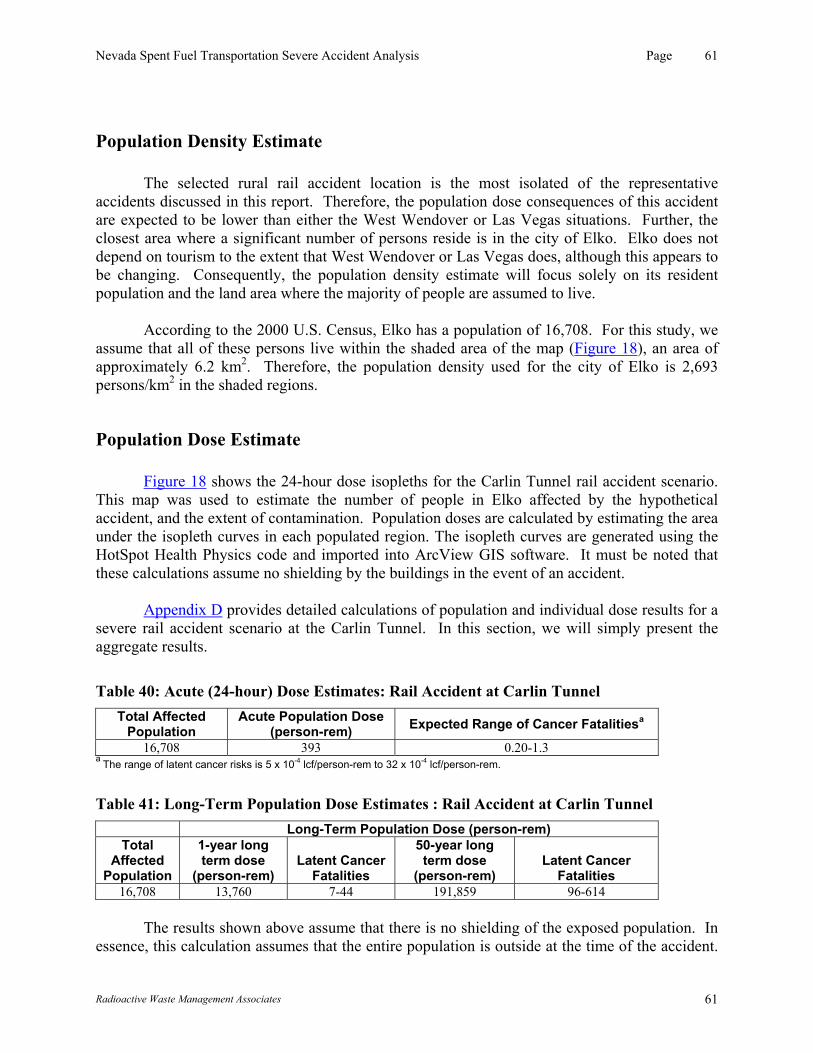
Nevada Spent Fuel Transportation Severe Accident Analysis Page 61
Population Density Estimate The selected rural rail accident location is the most isolated of the representative accidents discussed in this report. Therefore, the population dose consequences of this accident are expected to be lower than either the West Wendover or Las Vegas situations. Further, the closest area where a significant number of persons reside is in the city of Elko. Elko does not depend on tourism to the extent that West Wendover or Las Vegas does, although this appears to be changing. Consequently, the population density estimate will focus solely on its resident population and the land area where the majority of people are assumed to live. According to the 2000 U.S. Census, Elko has a population of 16,708. For this study, we assume that all of these persons live within the shaded area of the map (Figure 18), an area of approximately 6.2 km2. Therefore, the population density used for the city of Elko is 2,693 persons/km2 in the shaded regions.
Population Dose Estimate Figure 18 shows the 24-hour dose isopleths for the Carlin Tunnel rail accident scenario.
This map was used to estimate the number of people in Elko affected by the hypothetical accident, and the extent of contamination. Population doses are calculated by estimating the area under the isopleth curves in each populated region. The isopleth curves are generated using the HotSpot Health Physics code and imported into ArcView GIS software. It must be noted that these calculations assume no shielding by the buildings in the event of an accident.
Appendix D provides detailed calculations of population and individual dose results for a
severe rail accident scenario at the Carlin Tunnel. In this section, we will simply present the aggregate results.
Table 40: Acute (24-hour) Dose Estimates: Rail Accident at Carlin Tunnel Total Affected
Population Acute Population Dose
(person-rem) Expected Range of Cancer Fatalitiesa 16,708 393 0.20-1.3
a The range of latent cancer risks is 5 x 10⁻⁴ lcf/person-rem to 32 x 10-4 lcf/person-rem.
Table 41: Long-Term Population Dose Estimates : Rail Accident at Carlin Tunnel Long-Term Population Dose (person-rem)
Total Affected
Population
1-year long term dose
(person-rem) Latent Cancer
Fatalities
50-year long term dose
(person-rem) Latent Cancer
Fatalities 16,708 13,760 7-44 191,859 96-614
The results shown above assume that there is no shielding of the exposed population. In
essence, this calculation assumes that the entire population is outside at the time of the accident.
Radioactive Waste Management Associates 61

Nevada Spent Fuel Transportation Severe Accident Analysis Page 62
No calculation was made of indoor concentrations inside hypothetical buildings downwind of the proposed accident location because of the relative sparse population near the site, and the dearth of large casinos nearby.
Radioactive Waste Management Associates 62

Nevada Spent Fuel Transportation Severe Accident Analysis Page 63
Possible Contamination of the Humboldt River
Figure 20 presents the ground contamination isopleths for the hypothetical accident at the Carlin Tunnel. This isopleth was used to estimate the extent of radioactive cesium that could enter into the Humboldt River system. This section discusses the possible level of contamination and associated effects resulting from the contamination of the Humboldt River system. Cesium Partitioning in Water
In a pure water system, cesium will ionize and dissolve, forming a solution. However, it will behave radically different in a natural river system, which may contain suspended solids, sediments, clays, and other ions. The behavior of cesium in natural systems is highly variable and highly dependent on the composition of the sediments interfacing the water. Cesium is a monovalent cation with an extremely high ion exchange capacity, meaning that it will selectively sorb to negatively charged particles (such as clays), displacing those ions which are not as strongly sorbed68. In fact, the bonding energy of the cesium ion is stronger than virtually all cations commonly found in natural rivers (such as potassium or sodium), suggesting that it will tend to preferentially be removed from the liquid phase, eventually being deposited at bends in meandering rivers or spots of low flow. For river systems that do not contain significant quantities of clay materials, the amount of cesium sorbed by sediments is highly dependent on the quantity of other ions in the system69.
An equilibrium between ions in the liquid and sediment phases of a typical system is
often described by the following empirical equation, known as the Freundlich isotherm: Cs = kCd
n; where: Cs = concentration of contaminant per gram sediment Cd = concentration of contaminant per mL water k, n = empirical constants.
For contaminant equilibrium between liquid and sediments, the empirical constant n generally has a value of between 0.5 and 0.170. The use of the non-linear Freundlich isotherm suggests that cesium tends to adsorb strongly to suspended sediments, especially strongly to negatively-charged colloids. Often, the parameter n is set equal to 1 and k is then simply defined as the ratio of the concentration of the contaminant in the solid (grams of contaminant/grams of sediment) to the concentration of the contaminant in the water (grams of contaminant/liters of water). This value is often called the distribution coefficient, Kd. The National Council on Radiation Protection and Measurements (NCRP) compiled measured values of Kd for Cs-137 for a variety
68 Sayre, Guy, and Chamberlain. “Transport of Radionuclides by Streams: Uptake and Transport of Radionuclides by Stream Sediments.” U.S. Government Printing Office, 1963. 69 Chapter 3 in NCRP Report No. 76, Radiological Assessment : Predicting the Transport, Bioaccumulation, and Uptake by Man of Radionuclides Released to the Environment. National Council on Radiation Protection and Measurements, 1984. 70 Sayre, Guy, and Chamberlain, pp. A-12
Radioactive Waste Management Associates 63

Nevada Spent Fuel Transportation Severe Accident Analysis Page 64
of water systems, which were found to be in the range of 500-1500 L/mg for rivers having relatively low concentrations of clay, and up to 50,000 L/mg for high-clay rivers71.
Other measurements have corroborated these values. For example, studies of contamination at the Oak Ridge facility have suggested that over 80% of Cs-137 passing through a dam in the White Oak River are associated with suspended sediment72. Moreover, these sorption reactions occur quickly [~90% of Cs-137 is sorbed within 3 days] and are not readily reversible such that "...once these radionuclides are incorporated into bottom sediments the potential for their release through desorption is almost negligible"73. Site-specific information about the Humboldt River near the site of the hypothetical accident corroborates the hypothesis that much of the cesium deposited into the river will be adsorbed into the sediment phase, eventually being deposited. The Humboldt River is the largest river wholly contained within Nevada. The river and its basin are a closed system, meaning that the water never reaches the ocean, either leaving the system via infiltration or evaporation. The Humboldt River traverses a meandering path, winding through valleys en route to the Humboldt Sink in northwest Churchill County. Figure 21 shows a map of the Upper Humboldt River Basin, including its land use patterns, mining locations, and other pertinent information. Because the Humboldt River has its origins in the mountains of Northern Nevada, its flow rate is extremely variable, high when the mountainous snowcaps melt and low during the winter months. Figure 22 shows a graph of the mean monthly flow rates for the Humboldt. The meandering nature of the river, coupled with its variable flow rate, makes deposition of suspended material (at river bends, and in areas with low flow) more prevalent than in more straight, steady rivers. The area near the Humboldt River is characterized by Oravada soil, characterized generally as a sandy loam-type soil74. This type of soil is dominated by particles larger than typical sand granules, but smaller than the fine loam particulates. Shepperd and Thibault75 compiled partition coefficients for the liquid/soil interface, which are reproduced in Table 42 below.
Table 42: Kd (soil-water) Values for Cesium
Soil Type Kds for Cesium (L/Kg) Sand 280 Loam 4600 Clay 1900 Organic 270
It should be noted that the Kds values in Table 42 are not the same as the Kd values discussed previously, because the values listed in Table 42 are experimental values tested under laboratory 71 NCRP Report No. 76. Radiolocigal Assessment : Predicting the Transport, Bioaccumulation, and Uptkae by Man of Radionuclides Released to the Environment. National Council on Radiation Protection and Measurements, March 1984. pp. 126 72 Carrigan, Jr., P.H.; Pickering, R.J.; Tamura, T.; Forbes, R., 1967, Radioactive Materials in Bottom Sediment of Clinch River: Part A, Investigations of Radionuclides in Upper Portion of Sediment: ORNL-3721 Supplement 2A to Status Report No. 5 on Clinch River Study, 3/1967. 73 Ibid., pg. 35. 74 U.S.Department of Agriculture National Resources Conservation Service National Soil Survey Center. Online at http://www.statlab.iastate.edu/soils/photogal/statesoils/nv_soil.htm 75 Sheppard, M.I. and D.H. Thibault, 1990. “Default Soil Solid/Liquid Partition Coefficients, KDs, for Four Major Soil Types : A Compendium.” Health Physics Vol. 39, No.4. pp 471-482.
Radioactive Waste Management Associates 64

Nevada Spent Fuel Transportation Severe Accident Analysis Page 65
conditions (allowing the soil and water to come to equilibrium). A high Kd value means preferential partitioning into the soil compartment of the (assumed) 2-compartment system. The table above shows that the sandy loam soil predominant in the Humboldt River region will tend to strongly sorb cesium. From the discussion above, we have determined that, in the event of a release of cesium into the Humboldt River, the great majority will be selectively adsorbed onto the soil at the bottom of the river or the suspended sediments. Because of the meandering nature of the river and its unsteady flow conditions, most of the cesium adsorbed into suspended sediments is expected to eventually deposit, onto riverbanks at curves in the flow, or at points of low flow. These “hot spots” are of most concern from a public exposure point of view. Potential Extent of Contamination
An attempt to calculate the amount of radionuclide particulates which might enter into the Humboldt River or its tributaries after a postulated hypothetical accident is at best an approximate one. Much is unknown or variable which would be required knowledge to provide an exact answer. However, the difficulty in this estimation does not undermine the fact that the possible contamination of the Humboldt River is an important issue to discuss, at least qualitatively, in the context of a hypothetical radionuclide release. This section estimates the total source term of cesium released into the Humboldt River. After this is completed, a discussion of the possible consequences of the levels of contamination will be initiated. The extent of contamination of the Humboldt River was estimated by measuring the length of the Humboldt River and tributaries that were underneath the 10µCi/m2 ground contamination isopleth shown in Figure 20. The affected length was estimated to extend 30 kilometers downwind. It should be noted that the meandering nature of the river makes this an underestimate, since it assumes that the river is essentially a straight line. In fact, a report by the State of Nevada76 states that the actual length of the river may be double what it has been estimated, due to its tortuous path. Therefore, as an upper bound, we have also calculated the contamination to the river based on an affected length of 60 kilometers. The width of the river was assumed to be 50 feet, with the depth assumed to be 5 feet77, resulting in an estimated surface area of contamination of 0.46km2 to 0.91km2, depending on the length assumed. The next step was to estimate the extent of contamination depositing on the river surface. This was done by using the ground contamination isopleths shown in Figure 20, with the area between the 100µCi/m2 and 500 µCi/m2 isopleths being the first to impact the river. The level of contamination at different sections of the river was estimated by breaking the river into discrete sections based on the location of the isopleths, then assuming that the entire area of river contained between two isopleths was contaminated at the average value between them. This is shown in Tables 43 and 44. For simplicity, the various contaminations were then averaged into a single contamination level for the entire affected part of the river, which was used as the initial concentration for further calculations. This is shown in Table 45.
76 Humboldt River Chronology. Volume I, Part I : Overview 77 Conservative values were used whenever data was unavailable or extremely variable
Radioactive Waste Management Associates 65

Nevada Spent Fuel Transportation Severe Accident Analysis Page 66
Table 43: Estimated Contamination Levels of Humboldt River Following Hypothetical Accident, Low Estimate of Affected River Length
Ground Contamination Range µCi/m2
River length within Contamination Range km
Estimated Surface Contamination, µCi/m2
Amount Deposited, Ci
Cs-137 Deposited, Ci*
Cs-134 Deposited, Ci*
100-500 2.5 300 11.6 3.1 8.5 50-100 4.6 75 5.2 1.4 3.8 10-50 18.5 30 8.5 2.3 6.2
* The relative amounts of Cs-134 and Cs-137 were estimated by the fractional inventories of each radionuclide (Cesium in the modeled spent fuel container was approximately 26.6% Cs-134 and 73.4% Cs-137 in terms of Curies.
Table 44: Estimated Contamination Levels of Humboldt River Following Hypothetical Accident, High Estimate of Affected River Length
Ground Contamination Range µCi/m2
River length within Contamination Range km
Estimated Surface Contamination, µCi/m2
Amount Deposited, Ci
Cs-137 Deposited, Ci*
Cs-134 Deposited, Ci*
100-500 5.05 300 23.1 6.1 17.0 50-100 9.13 75 10.4 2.8 7.7 10-50 37.01 30 16.9 4.5 12.4
* The relative amounts of Cs-134 and Cs-137 were estimated by the fractional inventories of each radionuclide (Cesium in the modeled spent fuel container was approximately 26.6% Cs-134 and 73.4% Cs-137 in terms of Curies.
Table 45: Estimated Average Cesium Concentrations in Affected Length of Humboldt River Following Hypothetical Accident
Length Estimate
Total River Volume Affected (m3)
Average Initial Concentration Cs-137 in affected area (µCi/m3)
Average Initial Concentration Cs-134 in affected area (µCi/m3)
Average Initial Concentration Cs-137 in affected area (µg/L)
Average Initial Concentration Cs-134 in affected area (µg/L)
Total amount Cs-137 Deposited (mg)
Total Amount Cs-134 Deposited (mg)
Low 5.94E+05 11.29 31.15 1.3E-04 2.38E-05 77.4 14.1 High 1.19E+06 11.29 31.15 1.3E-04 2.38E-05 154.8 28.3
Table 45 shows that an estimated 91.5 to 183.1 mg of cesium could be deposited into the Humboldt River system following the postulated accident. As was previously stated, it is expected that the vast majority of this will eventually be deposited, either into the river sediments or onto riverbanks. The distribution of deposited cesium is not random: it will occur at river bends and at areas of low flow, creating hot spots. Because of this, the concentration of cesium at these locations will be significantly elevated compared to nearby concentrations that have been affected by the hypothetical accident but do not contain river-deposited cesium.
Radioactive Waste Management Associates 66

Nevada Spent Fuel Transportation Severe Accident Analysis Page 67
Conclusions
This report assessed credible highway and rail accidents involving spent fuel shipments in urban and rural areas of Nevada. The urban area considered was Las Vegas; the rural areas were in northern Nevada. We estimated the nature amount of radioactivity that could be released from a spent fuel shipping cask in the event of a serious accident, based on industry literature. From these release estimates, we estimated the extent of contamination and the consequences to individuals and collective populations associated with this contamination. Based on extensive discussions with local emergency personnel, this report also discusses the likely response by emergency personnel to an accident of this nature. Finally, the report lays out the decontamination technologies available and comments on their cost and effectiveness. Each cask that would be shipped to Yucca Mountain contains an enormous inventory of radioactive material. Casks are not designed to withstand all credible highway and rail accidents. Even a small release in terms of the fraction of the entire inventory that is released, such as those considered in this report, can lead to major health and economic consequences. For example, less than 1% of the total inventory of radioactive cesium was assumed to be released in the Las Vegas rail accident scenario where it was calculated that up to 1,300 people would develop cancer due to exposure to radiation from the accident. Our calculations assumed average meteorological conditions and wind speeds. We used standard computer software, such as HOTSPOT and RISKIND, to model downwind air and surface particulate concentrations. We further assumed a severe impact would lead to a ground level puff release of radioactive particulates. We did not assume a high temperature fire. If a fire were the cause of cask failure, it would lead to a prolonged release of radioactivity (compared with the instantaneous release assumed in this study), resulting in elevated radioactivity levels in the air for extended periods of time. A fire would also loft materials, leading to lower acute doses, but a greater distribution of radioactive particulates.
Near a transportation accident, this report estimates acute radiation doses due to inhalation of a passing radioactive cloud to be in the hundreds of rems close to the release location. This is a thousand times what a person receives from background radiation in a year. Thousands of people are likely to be in the downwind path. For example, this study estimated that over 138,000 persons would be affected by a severe rail accident releasing radioactive material in Las Vegas. Persons indoors would also be exposed. If ventilation systems were not shut off, radioactive particulates would settle within hotels and other buildings, contaminating rugs, furniture, beds, and causing a radiation dose to those inside. Discussions with emergency personnel clearly indicate the accident would overwhelm local response capabilities. Before local emergency responders could accurately assess the problem, the radioactive plume would have already contaminated an extensive area. Radioactive particulates settling on roads and highways are likely to be spread by traffic, possibly contaminating distant locations and extending the area of contamination past that assumed in this study. This may result in the contamination of many more people than was estimated in this report.
Radioactive Waste Management Associates 67

Nevada Spent Fuel Transportation Severe Accident Analysis Page 68
Given the high number of people exposed, local responders will not be able to identify,
let alone effectively quarantine, contaminated people. Thus, it will be extremely difficult to stop the spread of contamination. Initial decontamination efforts will probably be limited to emergency responders and people in the closest vicinity of the accidents. Decontamination of the affected population in general will be a massive effort.
Evacuation will be difficult at best. Spontaneous evacuation by people not in the
contaminated area will probably occur in great numbers, making the targeted evacuations much more difficult to complete. At a minimum, the evacuation of highly contaminated areas would be necessary. For a rail accident, evacuation would have to be in a radius greater than one kilometer; this would represent a large number of people if the accident took place near the Las Vegas Strip.
Consideration would have to be given to closing McCarren airport, since control of
contaminated individuals could not be achieved. Alternately, all passengers would have to be screened for contamination. This would require a huge amount of resources that could be better utilized dealing with the major issues.
The incident would overwhelm the capability of the local medical community. Blood
and urine samples of contaminated people should be taken to track the levels of contamination and exposure, but this would be very difficult given the number of contaminated and potentially contaminated individuals. Mental health resources would be overwhelmed as well.
Unless radionuclides, particularly cesium, were removed from surfaces, remaining
residents would be exposed for long time periods. Decontamination would be prohibitively expensive and would also expose workers; a balance would have to take place between clean-up costs and long-term radiation exposures. In this report we chose the EPA’s Protective Action Guide as a criteria for decontamination; assuming that a person should not receive more than 5 rems over a 50-year period, including initial inhalation due to the passing cloud. If areas are not decontaminated, we estimate between 6,000 and 41,000 latent cancer fatalities would result from exposure to radiation resulting from the rail accident in Las Vegas, depending on the risk model. If radioactive contaminants were not remediated, there would be continuous direct gamma exposure to residents remaining. Further, this would result in a tremendous concomitant economic cost to the tourist industry. Social stigma costs are beyond the scope of this report.
Using the economic model of RADTRAN 5, evacuation and decontamination costs could
range to hundreds of billions of dollars. These potential costs greatly exceed the amount of insurance coverage held by nuclear utilities or the Department of Energy. This raises the question of how such an expensive endeavor would be financed. Government financing of this would require an act of Congress, which would significantly delay remedial action.
While the population densities are obviously lower in a rural area, an accident in West
Wendover on I-80, or a rail accident near the Carlin tunnel, both in Northern Nevada, would also have serious consequences. I-80 is the main route into and out of West Wendover. An accident that spread radioactive contamination could cut off the exit and either leave cars trapped or have
Radioactive Waste Management Associates 68

Nevada Spent Fuel Transportation Severe Accident Analysis Page 69
vehicles spread the contamination miles down the highway. This report calculates the accident consequences in West Wendover. A rail accident near the Carlin tunnel, in a canyon adjacent to the Humboldt River, would lead to contamination of the river bed and water for miles downstream and leading to accumulations in slowly moving sections of the river. Use of the river for recreation or drinking would be curtailed for years to come.
This study shows the potentially disastrous consequences of an accident leading to the
release of radioactive material from a spent fuel transportation cask. It also underscores the importance of preparation of emergency response for such an accident. Acknowledgement of the potential for disaster, even if the probabilities are not high, is important in attempting to prepare for an unprecedented spent fuel transportation campaign.
The tables below summarize the findings of this study. Table 46 presents a comparison of the Las Vegas accidents discussed in this study with the urban ‘maximum reasonably foreseeable’ accident scenarios listed in the DEIS for the Yucca Mountain Facility. Table 47 presents a comparison of the rural accidents discussed in this study with the rural ‘maximum reasonably foreseeable ‘ accident scenario listed in the DEIS for the Yucca Mountain Facility. The consequences estimated in this report are significantly higher than those estimated in the Yucca Mountain DEIS, primarily due to the assumption of a higher population density and an increased release fraction for cesium.
Table 46: Comparison of State of Nevada and Yucca Mountain EIS Consequence Assessments : Urban Accidents Urban Truck Accident Urban Rail Accident
State of Nevada, Cat.5a
State of Nevada, Cat.6a
YM DEIS, Cat. 5a
YM DEIS, Cat. 6a
State of Nevada, Cat.5a
State of Nevada, Cat.6a
YM DEIS, Cat. 5a
YM DEIS, Cat. 6a
Acute (24-hour) Population Dose
(person-rem)b 846 not
calculated not
calculated not
calculated 26,171 not calculated
not calculated
not calculated
Expected Latent Cancer Fatalitiesc 0.42-2.7 not
calculated not
calculated not
calculated 13-444 not calculated
not calculated
not calculated
1-year Population Dose (person-
rem)b 29,514 not
calculated not
calculated 9,400 915,968 not calculated
not calculated 61,000
Expected Latent Cancer Fatalitiesc 15-94 not
calculated not
calculated 5 458-2,931 not calculated
not calculated 31
50-year Population Dose
(person-rem)b 407,024 not
calculated not
calculated not
calculated 12,771,207 not calculated
not calculated
not calculated
Expected Latent Cancer Fatalitiesc
204-1,306
not calculated
not calculated
not calculated
6,386-40,868
not calculated
not calculated
not calculated
Dose to Maximally Exposed
Individual (rem)d
3.9 38.5 not calculated 4 22.5 224 not
calculated 26
Area contaminated to greater than 5 rem long-term
dose (km2)
11.1 192.2 not calculated
not calculated 104.7 1208.4 not
calculated not
calculated
e. Release fractions are presented in Tables 1 and 2 of this report f. The Yucca Mountain DEIS assumed an urban population based on the average densities in successive 8-kilometer rings around the 21
largest cities in the continental U.S. The State of Nevada estimated the population of the Las Vegas MSA using data from the 2000 U.S. Census, and with the methodology explained in Section 3 of this report.
Radioactive Waste Management Associates 69
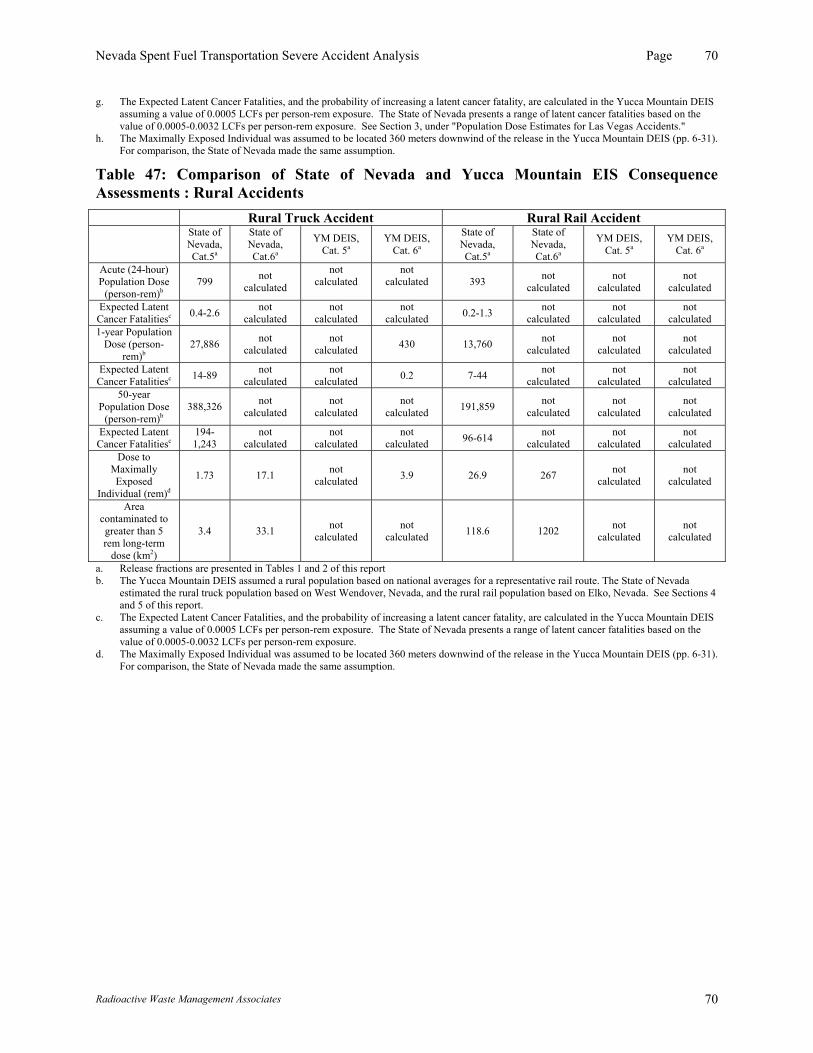
Nevada Spent Fuel Transportation Severe Accident Analysis Page 70
g. The Expected Latent Cancer Fatalities, and the probability of increasing a latent cancer fatality, are calculated in the Yucca Mountain DEIS assuming a value of 0.0005 LCFs per person-rem exposure. The State of Nevada presents a range of latent cancer fatalities based on the value of 0.0005-0.0032 LCFs per person-rem exposure. See Section 3, under "Population Dose Estimates for Las Vegas Accidents."
h. The Maximally Exposed Individual was assumed to be located 360 meters downwind of the release in the Yucca Mountain DEIS (pp. 6-31). For comparison, the State of Nevada made the same assumption.
Table 47: Comparison of State of Nevada and Yucca Mountain EIS Consequence Assessments : Rural Accidents
Rural Truck Accident Rural Rail Accident
State of Nevada, Cat.5a
State of Nevada, Cat.6a
YM DEIS, Cat. 5a
YM DEIS, Cat. 6a
State of Nevada, Cat.5a
State of Nevada, Cat.6a
YM DEIS, Cat. 5a
YM DEIS, Cat. 6a
Acute (24-hour) Population Dose
(person-rem)b 799 not
calculated
not calculated
not calculated 393 not
calculated not
calculated not
calculated
Expected Latent Cancer Fatalitiesc 0.4-2.6 not
calculated not
calculated not
calculated 0.2-1.3 not calculated
not calculated
not calculated
1-year Population Dose (person-
rem)b 27,886 not
calculated not
calculated 430 13,760 not calculated
not calculated
not calculated
Expected Latent Cancer Fatalitiesc 14-89 not
calculated not
calculated 0.2 7-44 not calculated
not calculated
not calculated
50-year Population Dose
(person-rem)b 388,326 not
calculated not
calculated not
calculated 191,859 not calculated
not calculated
not calculated
Expected Latent Cancer Fatalitiesc
194-1,243
not calculated
not calculated
not calculated 96-614 not
calculated not
calculated not
calculated Dose to
Maximally Exposed
Individual (rem)d
1.73 17.1 not calculated 3.9 26.9 267 not
calculated not
calculated
Area contaminated to greater than 5 rem long-term
dose (km2)
3.4 33.1 not calculated
not calculated 118.6 1202 not
calculated not
calculated
a. Release fractions are presented in Tables 1 and 2 of this report b. The Yucca Mountain DEIS assumed a rural population based on national averages for a representative rail route. The State of Nevada
estimated the rural truck population based on West Wendover, Nevada, and the rural rail population based on Elko, Nevada. See Sections 4 and 5 of this report.
c. The Expected Latent Cancer Fatalities, and the probability of increasing a latent cancer fatality, are calculated in the Yucca Mountain DEIS assuming a value of 0.0005 LCFs per person-rem exposure. The State of Nevada presents a range of latent cancer fatalities based on the value of 0.0005-0.0032 LCFs per person-rem exposure.
d. The Maximally Exposed Individual was assumed to be located 360 meters downwind of the release in the Yucca Mountain DEIS (pp. 6-31). For comparison, the State of Nevada made the same assumption.
Radioactive Waste Management Associates 70
Nevada Spent Fuel Transportation Severe Accident Analysis Page 71
References Carrigan, Jr., P.H.; Pickering, R.J.; Tamura, T.; Forbes, R., 1967. “Radioactive Materials in Bottom Sediment of Clinch River: Part A, Investigations of Radionuclides in Upper Portion of Sediment”: ORNL-3721 Supplement 2A to Status Report No. 5 on Clinch River Study, March 1967. Chanin, DI and WB Murfin, 1996. “Site Restoration: Estimation of Attributable Costs from Plutonium-Dispersal Accidents,” SAND96-0957.
Clark County Local Emergency Planning Committee, 2001. “Hazardous Materials Emergency Response Plan.” Cutter, Susan L, 1984. “Emergency Preparedness and Planning for Nuclear Power Plant Accidents.” Applied Geography 4, 1984. Pgs. 235-245. Drabek, Thomas E., 1996. Disaster Evacuation Behavior, Tourists and Other Transients, University of Colorado. Fischer, LE, et al, 1987. Shipping Container Response to Severe Highway and Rail Accident Conditions: Main Report (Technical Report), Lawrence Livermore National Laboratory, NUREG/CR-4829-v1,-v2, February 1987. Referred to as “The Modal Study” in this report. GLS Research, 2000. “Las Vegas Visitor Profile: Fiscal Year 2000.” Prepared for Las Vegas Convention and Visitors Authority. Gray and Wilson, 1995. Spent Fuel Dissolution Studies, FY1994 to 1994. Pacific Northwest Laboratories. PNL-10540, 1995. Greiner, M, 2000. “Spent Nuclear Fuel Shipping Cask Performance in Severe Accident Fires: Performance Envelope Analysis, Fire Environment Modeling and Full-Scale Physical Testing,” U of Nevada, July 20, 2000. Holtec Report No. HI-941184, 1998. Topical Safety Analysis Report for the HI-STAR 100 Cask System. Holtec International. “Hotspot Health Physics Code, Version 1.06.” Lawrence Livermore National Laboratory. Steven G. Homann, contact. Lamb, M and M Resnikoff, 2000. “Consequence Assessment of Severe Nuclear Transportation Accident in an Urban Environment,” Radioactive Waste Management Associates, 5 July 2000. Las Vegas Convention and Visitors Authority, 2000. 2000 Executive Summary. Liverman and Wilson, 1981. “The Mississauga Train Derailment and Evacuation. 10-16 November 1979.” Canadian Geographer xxv, 4, 1981. pgs. 365-375. Mancuso, Steward, and Kneale, 1977. “Radiation exposures of Hanford Workers Dying from Cancer and Other Causes.” Health Physics 33:369-84. National Council on Radiation Protection and Measurements, 1984. NCRP Report No. 76, Radiological Assessment : Predicting the Transport, Bioaccumulation, and Uptake by Man of Radionuclides Released to the Environment.
Radioactive Waste Management Associates

Nevada Spent Fuel Transportation Severe Accident Analysis Page 72
Neuhauser and Kanipe, 1992. User’s Guide for RADTRAN 4. SAND89-2370, Sandia National Laboratories. Nevada Agency for Nuclear Projects, 2000. State of Nevada Comments on the U.S. Department of Energy’s Draft Environmental Impact Statement for a Geologic Repository for the Disposal of Spent Nuclear Fuel and High-Level Radioactive Waste at Yucca Mountain, Nye County, Nevada. Part 3, Specific Comments. Nevada Department of Employment, Training, and Rehabilitation. “Nevada Gross Gaming Win”, Prepared by the Research and Analysis Bureau, Nevada Department of Employment, Training, and Rehabilitation. Available at: http://detr.state.nv.us/lmi/data/indicators/gamewinq.htm. Nevada Division of Water Planning, 2000. Humboldt River Chronology. Volume I, Part I : Overview Nevada Research and Analysis Bureau. “Clark County, Nevada Industrial Wage Data.” Available at: http://detr.state.nv.us/lmi/data/avgwages/avg_003.htm Sanders et al, 1992. A Method for Determining the Spent Fuel Contribution to Transport Cask Containment Requirements. Sandia National Laboratories. SAND90-2406. Sandquist et al, 1985. Exposures and Health Effects from Spent Fuel Transportation. Rogers and Associates. Sayre, Guy, and Chamberlain. “Transport of Radionuclides by Streams: Uptake and Transport of Radionuclides by Stream Sediments.” U.S. Government Printing Office, 1963. Sheppard, M.I. and D.H. Thibault, 1990. “Default Soil Solid/Liquid Partition Coefficients, KDs, for Four Major Soil Types : A Compendium.” Health Physics Vol. 39, No.4. pp 471-482. Sprung et al, 1997. “Data and Methods for the Assessment of the Risks Associated with the Maritime Transport of Radioactive Materials: Results of the SeaRAM Program, Vol. 2, Appendix IV, Cask-to-Environment Release Fractions,” SAND97-2222, Sandia National Laboratories, Albuquerque, NM, August 1997. Sprung et al, 2000. Reexamination of Spent Fuel Shipping Risks Estimates, Sandia National Laboratories, NUREG/CR-6672, March 2000. State of Florida, 2000. Hurricane Evacuation Task Force Report. Strow, David. “Casinos Compete for Job Hopping Workers.” Las Vegas Sun 8/13/2000. U.S. Department of Agriculture. National Resources Conservation Service National Soil Survey Center. Available at: http://www.statlab.iastate.edu/soils/photogal/statesoils/nv_soil.htm U.S. Department of Energy, 1999. Draft Environmental Impact Statement for a Geologic Repository of Spent Nuclear Fuel and High-Level Radioactive Waste at Yucca Mountain, Nye County, Nevada. (DOE/EIS-0250D). U.S. Department of Energy, 2001. Supplement to the Draft Environmental Impact Statement for a Geologic Repository for the Disposal of Spent Nuclear Fuel and High-Level Radioactive Waste at Yucca Mountain, Nye County, Nevada. DOE/EIS-0250D-S. U.S. Department of Transportation, Research and Special Programs Administration, 2000. 2000 Emergency Response Guidebook.
Radioactive Waste Management Associates 72

Nevada Spent Fuel Transportation Severe Accident Analysis Page 73
U.S. Environmental Protection Agency Index of Watershed Indicators. Available at: http://www.epa.gov/iwi U.S. Environmental Protection Agency, 2000. OSWER Directive 9200.1-33P. July, 2000. “Establishment of Cleanup Levels for CERCLA Sites with Radioactive Contamination.” Yuan et al, 1995. RISKIND: A Computer Program for Calculating Radiological Consequences and Health Risks from Transportation of Spent Nuclear Fuel. ANL/EAD-1. Argonne National Laboratory. Zalinksky, W. and L.A. Kosinski. The Emergency Evacuation of Cities: A Cross-National Historical and Geographic Study. Savage Maryland, Rowman & Littlefield, 1991. Report of the President’s Commission on the Accident at Three Mile Island, Washington, D.C., October, 1979.
Radioactive Waste Management Associates 73

Nevada Spent Fuel Transportation Severe Accident Analysis A- 1 -
Appendix A: Discussion of Severe Accident Release Estimates
1) Why use the Modal Study rather than the more recent NUREG/CR-6672 as the basis for your release estimates in a transportation accident?
Simply put, we disagree with much of the methodology involved in making the release estimates presented in NUREG/CR-6672, and have opted to instead consider the estimates made in the Modal Study. We will discuss some of the methodological flaws in NUREG/CR-6672 below.
NUREG/CR-6672 has taken a different approach to cask damage in an accident, focusing on the bolts and seal in the lid region of the cask. We regard this as an improvement over the previous work by Lawrence Livermore Labs (LLNL), which correlated damage with strain to the inner cask wall. Intuitively the lid region is more vulnerable; it is far more likely that bolts will stretch during impact than the cask body will bend too far. That having been said, the PRONTO model employed by Sandia Labs has not been appropriately benchmarked and applied. LLNL have raised valid criticisms regarding the model of the bolt and seal area of the lid which are critical to the size opening during an accident and the amount of radioactivity released. In particular, when predicting strain on the seal regions (and the bolts), NUREG/CR-6672 did not explicitly model the grooved region between the cask lid and the lid well. Rather, it estimated the deformation “at a location near where the O-rings would be located.” (5-11) Further, the modeling assumed “that the cask wall and lid are much stiffer than the closure bolts, and the opening displacements are the result of displacement discontinuities between the cask body and lid, and are not greatly affected by bolt clamping force.”(5-11) We agree with LLNL that the model of the bolt region is overconstrained and underpredicts the size opening. Underpredicting the size of the cask-to-environment leak opening has cascading effects on the estimation of releases in the event of an accident. For example, NUREG/CR-6672 relies on computer simulations discussed in SAND97-222278 which estimate that “for leak paths with cross-sectional areas of 4 and 100 mm2 , deposition processes largely deplete the source distribution of particles with diameters larger than 10 µm.” (NUREG/CR-6672 at 7-51). The NUREG/CR-6672 study assumes the following leak paths for a truck and rail cask, respectively, as a function of impact velocity:
78 Sprung et al, 1997. ““Data and Methods for the Assessment of the Risks Associated with the Maritime Transport of Radioactive Materials: Results of the SeaRAM Program, Vol. 2, Appendix IV, Cask-to-Environment Release Fractions,” SAND97-2222, Sandia National Laboratories, Albuquerque, NM, August 1997.
Radioactive Waste Management Associates 1
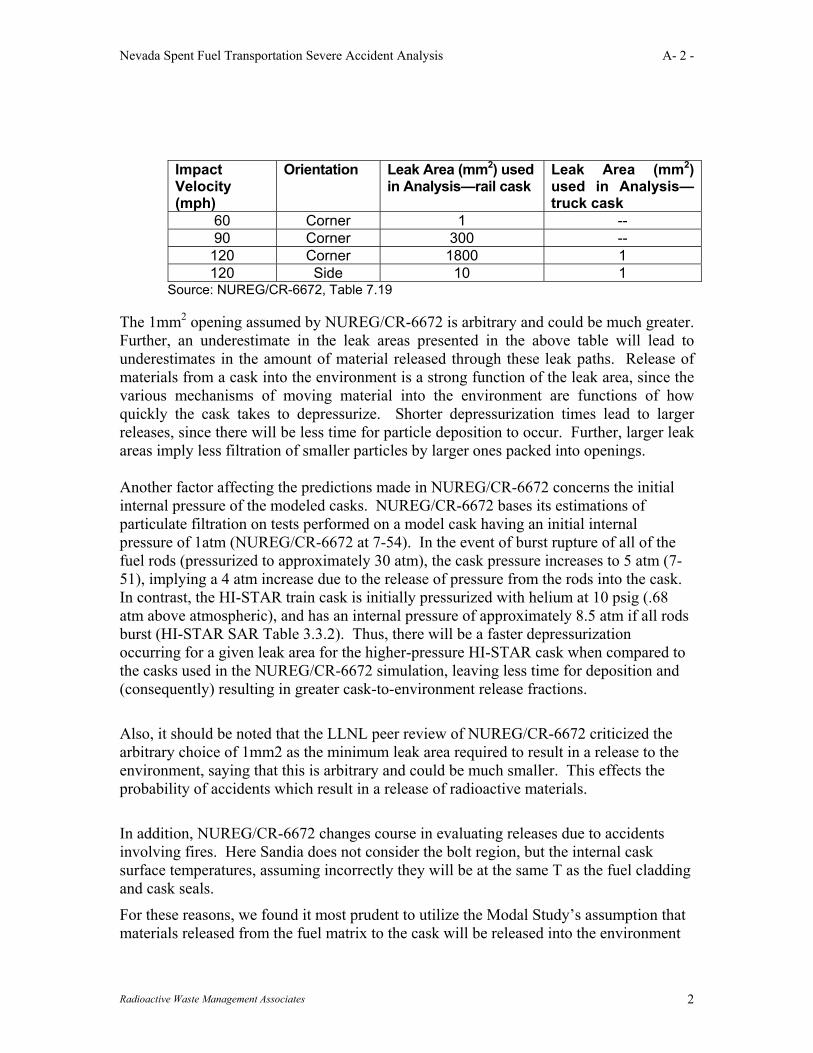
Nevada Spent Fuel Transportation Severe Accident Analysis A- 2 -
Impact Velocity (mph)
Orientation Leak Area (mm2) used in Analysis—rail cask
Leak Area (mm2) used in Analysis—truck cask
60 Corner 1 -- 90 Corner 300 --
120 Corner 1800 1 120 Side 10 1
Source: NUREG/CR-6672, Table 7.19 The 1mm2 opening assumed by NUREG/CR-6672 is arbitrary and could be much greater. Further, an underestimate in the leak areas presented in the above table will lead to underestimates in the amount of material released through these leak paths. Release of materials from a cask into the environment is a strong function of the leak area, since the various mechanisms of moving material into the environment are functions of how quickly the cask takes to depressurize. Shorter depressurization times lead to larger releases, since there will be less time for particle deposition to occur. Further, larger leak areas imply less filtration of smaller particles by larger ones packed into openings. Another factor affecting the predictions made in NUREG/CR-6672 concerns the initial internal pressure of the modeled casks. NUREG/CR-6672 bases its estimations of particulate filtration on tests performed on a model cask having an initial internal pressure of 1atm (NUREG/CR-6672 at 7-54). In the event of burst rupture of all of the fuel rods (pressurized to approximately 30 atm), the cask pressure increases to 5 atm (7-51), implying a 4 atm increase due to the release of pressure from the rods into the cask. In contrast, the HI-STAR train cask is initially pressurized with helium at 10 psig (.68 atm above atmospheric), and has an internal pressure of approximately 8.5 atm if all rods burst (HI-STAR SAR Table 3.3.2). Thus, there will be a faster depressurization occurring for a given leak area for the higher-pressure HI-STAR cask when compared to the casks used in the NUREG/CR-6672 simulation, leaving less time for deposition and (consequently) resulting in greater cask-to-environment release fractions.
Also, it should be noted that the LLNL peer review of NUREG/CR-6672 criticized the arbitrary choice of 1mm2 as the minimum leak area required to result in a release to the environment, saying that this is arbitrary and could be much smaller. This effects the probability of accidents which result in a release of radioactive materials.
In addition, NUREG/CR-6672 changes course in evaluating releases due to accidents involving fires. Here Sandia does not consider the bolt region, but the internal cask surface temperatures, assuming incorrectly they will be at the same T as the fuel cladding and cask seals.
For these reasons, we found it most prudent to utilize the Modal Study’s assumption that materials released from the fuel matrix to the cask will be released into the environment
Radioactive Waste Management Associates 2

Nevada Spent Fuel Transportation Severe Accident Analysis A- 3 -
in the event of any leak path. There are far too many uncertainties in NUREG/CR-6672’s attempt to account for particle filtration and deposition to make it a defensible estimate. Therefore, in the absence of more concrete evidence, we have chosen the Modal Study assumption that material released into the cask cavity is released into the environment in the event of any leak path.
2) The Modal Study assumes the design cask is made of shells of steel-lead-
steel, which is not the type of cask that will be used for truck (steel-uranium-steel) or train (monolithic steel). NUREG/CR-6672 seems to have it right here.
We do use the Sandia study for temperature dependence of realistic truck and train casks in an accident involving fire. These dependencies are used for probabilistic arguments, in order to consider whether a given accident having a fire of a certain duration is credible. We use results obtained in NUREG/CR-6672 to estimate the length of time required to raise the temperature of a cask subjected to an engulfing 1000oC fire. We then use these estimates to discuss the credibility of an accident involving a fire that heats the cask above certain important values, such as the temperature of cask seal degradation (350oC according to NUREG/CR-6672, 204oC according to Greiner). Neither study takes into account thermal lag, the fact that the maximum internal temperatures will peak several hours after thermal input ceases. Again, the arguments presented in this paragraph affect the probability of certain accidents occurring, but do not affect the consequence estimates we have made. The consequence estimates are based on the Modal Study release fractions, correcting for cesium and CRUD. The probabilistic arguments are used to determine what severity of accident is credible for the specific locations in Nevada, but do not affect the consequence estimates.
Further, the release estimates made in the Modal Study are not dependent on the type of cask used in the study. The amount of material released due to burst rupture is based on the results of the Lorenz experiments, which considered fuel rods without the casks. Again, the probability of accidents having given releases is affected by the choice of cask design in the Modal Study, not the consequences.
For the structural analysis, we are concerned with data which conflicts with certain assumptions and results included in NUREG/CR-6672. In particular, NUREG/CR-6672 assumes that no fuel rods will be broken at decelerations of 100g, assuming that it requires 4% strain to do this. Older studies, including the one used by Holtec for the HI-STAR SAR, assume cladding breakage at decelerations as low as 63g. The Modal Study assumes 100% fuel rod breakage for decelerations of 100g, and 10% of rods break for decelerations of 40g. This is discussed more below.
The bottom line is that there exists enough contrary evidence to make the NUREG/CR-6672 analysis not useful for impact analysis.
Radioactive Waste Management Associates 3

Nevada Spent Fuel Transportation Severe Accident Analysis A- 4 -
3) NUREG/CR-6672 appears to have much smaller releases in a severe accident than you have estimated for the same accident severity. Why?
Sandia estimates releases in an accident at least a factor of 1000 smaller than we do. There are three primary reasons. a) Sandia uses Lorenz experimental results for estimating releases from the fuel matrix to the cask cavity. We consider those experiments fatally flawed. In the Lorenz experiments, any build-up of cesium in the gap between the fuel pellet and cladding during reactor operation was lost. b) Sandia assumes a gap inventory on the order of 1% (the Modal Study assumes 0.3%), whereas we use the experimental results of Gray, 9.9% for higher burn-up fuel. c) Sandia calculates a further reduction by a factor of 10 due to plate-out and filtration of particulates through blocked passageways. Because of the greater internal pressure in higher burnup fuel, and greater pressure in the HI-STAR internal canister, particle deposition and filtration is expecting to be less of an issue. Further, the temperature of the cask walls is expected to be quite warm, leading to little plate-out.
4) Your assumption about velocities leading to accidental releases appears to be much lower than in NUREG/CR-6672. What accounts for the difference?
For an impact accident, Sandia considers an end impact to be the most serious since it is focused on the lid/seal region. But a side impact appears to do the most damage to the cask, according to the Modal Study and earlier studies commissioned by the Nuclear Regulatory Commission. A side impact into an unyielding surface such as a bridge abutment or train sill at low speeds can lead to high strain and a cask opening. Here we use the results of the Modal Study. Further, fuel assemblies are more vulnerable to a side impact than an end impact. For a Westinghouse PWR fuel assembly, decelerations at 63g would shatter the cladding, while NUREG/CR-6672 concludes that decelerations greater than 100g are needed for cladding rupture. Sandia was criticized by LLNL for an arbitrary 4% strain leading to a rod break; LLNL thought a 2% break was more appropriate. Using the 2% strain criteria would increase the severity of accidents at a given deceleration strain, but would still result in predictions less severe then the 63g assumption used by Holtec. Because of this, we consider NUREG/CR-6672 to be non-conservative, and instead opt for the Modal Study, which assumes 100% rod failure for accidents involving decelerations greater than 100g.
5) The State of Nevada has severely criticized the Modal Study in the past (see, for example, Lindsey Audin’s “Brief Critique of the Modal Study.”) NUREG/CR-6672 addresses many of the criticisms previously leveled against the Modal Study. How can the State now use this study which has been severely criticized?
The State is performing a consequence assessment of a severe, yet credible, accident scenario. Many of the criticisms leveled against the Modal Study were concerned with its estimates of the probabilities of different accident scenarios. Since our aim is not to
Radioactive Waste Management Associates 4

Nevada Spent Fuel Transportation Severe Accident Analysis A- 5 -
assign a specific probability to the accident scenario chosen for assessment, criticisms of the Modal Study’s probability assessment are not relevant to this situation.
Further, the State has modified the Modal Study’s estimate of the release of two radionuclide classifications: cesium and CRUD, since we believe they were underestimated.
6) The probability of an accident of the severity you use in your consequence assessment occurring at the precise location you have designated is miniscule. How do you justify conducting an assessment of the consequences of an accident while picking a specific location?
There are a few answers to this question. First, it is easier to be comprehensive, i.e., to estimate evacuation times, health impact and clean-up costs, when performing a consequence assessment for a specific site. Second, it is essential for areas that can expect large numbers of spent fuel casks to be transported through their boundaries (such as Las Vegas and Ely) to be adequately prepared with emergency response in the event of a severe accident.
7) In your analysis, you assume high-burnup (40,000 MWD/MTU) PWR fuel cooled for only 5 years, whereas the “average” fuel will have cooled approximately 26 years, with a burnup of 30,000 MWD/MTU (according to the YM DEIS).
We have used fuel and casks representative of what is likely to be shipped in the future. The current cooling time allowed by the Certificate of Compliance is 5 years, so that is what we used for a bounding analysis.
8) If you are not conducting a probabilistic analysis, how can you determine that your accident scenarios are “credible?”
First, we intend to present a range for each severe accident scenario, corresponding to the Yucca Mountain DEIS category 4/5 and 6 accidents. We will also present a qualitative argument to analyze whether an accident of a given severity could occur at a given site, considering traffic speed, wayside surface characteristics, and the potential for long-duration fires. We believe that the estimates that an accident has a probability of x in a million per year per mile are less instructive and less useful for emergency personnel then determining an accident’s credibility and calculating the consequences.
Radioactive Waste Management Associates 5

Nevada Spent Fuel Transportation Severe Accident Analysis B- 1 -
Appendix B: Category 6 Accident Contamination Charts Note: The Cesium release fraction is lower for the “maximum reasonably foreseeable” accident scenario than the accident scenario considered in this study. The Yucca Mountain DEIS uses the Modal Study, whereas this study modifies the Modal Study to make use of new information. In Appendix B, the “Category 6” accident results are for the modified Modal Study, with a cesium release fraction of 6.6x10⁻².
Las Vegas Category 6 Accident Results
Table B1: Individual Dose Estimates: Category 6 Truck Accident in Las Vegas Downwind Distance (km)
Acute (24-hour) Dose Calculated by RISKIND*, rem
Acute (24-hour) Dose Calculated by HotSpot, rem
1-year Long-Term Dose** Calculated By RISKIND, rem
50-year Long-Term Dose** Calculated By RISKIND, rem
0.001 3.77E+03 Not Calculated 1.28E+05 1.79E+06 0.05 1.40E+02 8.40E+01 4.76E+03 6.66E+04 0.1 1.59E+02 1.60E+02 5.55E+03 7.77E+04
0.15 1.20E+02 1.10E+02 4.19E+03 5.85E+04 0.2 8.59E+01 7.20E+01 3.02E+03 4.22E+04
0.25 6.38E+01 5.00E+01 2.24E+03 3.13E+04 0.3 4.89E+01 3.70E+01 1.73E+03 2.41E+04 0.4 3.15E+01 2.30E+01 1.11E+03 1.55E+04 0.5 2.21E+01 1.50E+01 7.80E+02 1.09E+04 0.6 1.64E+01 1.10E+01 5.80E+02 8.12E+03 0.7 1.28E+01 8.70E+00 4.51E+02 6.30E+03 0.8 1.02E+01 6.90E+00 3.61E+02 5.05E+03 0.9 8.42E+00 5.70E+00 2.97E+02 4.15E+03 1 7.05E+00 4.70E+00 2.49E+02 3.48E+03 2 2.29E+00 1.50E+00 8.10E+01 1.13E+03 4 7.61E-01 5.20E-01 2.68E+01 3.75E+02 8 2.54E-01 1.90E-01 8.93E+00 1.25E+02
16 8.40E-02 7.20E-02 2.96E+00 4.13E+01 32 2.70E-02 2.90E-02 9.50E-01 1.33E+01 64 8.70E-03 1.10E-02 3.05E-01 4.26E+00 80 Not Calculated 8.30E-03 Not Calculated Not Calculated
*RISKIND Dose Calculations based on sum of contributions from Cask exposure, groundshine, inhalation, and cloudshine
Radioactive Waste Management Associates 1

Nevada Spent Fuel Transportation Severe Accident Analysis B- 2 -
Table B2: Individual Dose Estimates: Category 6 Rail Accident in Las Vegas Downwind Distance (km)
Acute (24-hour) Dose Calculated by RISKIND*, rem
Acute (24-hour) Dose Calculated by HotSpot, rem
1-year Long-Term Dose** Calculated By RISKIND, rem
50-year Long-Term Dose** Calculated By RISKIND, rem
0.001 4.09E+04 Not Calculated 1.43E+06 2.00E+07 0.05 1.04E+03 5.40E+02 3.64E+04 5.09E+05 0.1 9.66E+02 9.80E+02 3.38E+04 4.72E+05
0.15 6.93E+02 6.50E+02 2.42E+04 3.39E+05 0.2 4.96E+02 4.30E+02 1.74E+04 2.42E+05
0.25 3.68E+02 3.00E+02 1.29E+04 1.80E+05 0.3 2.84E+02 2.20E+02 9.93E+03 1.39E+05 0.4 1.84E+02 1.40E+02 6.43E+03 9.00E+04 0.5 1.29E+02 9.30E+01 4.53E+03 6.33E+04 0.6 9.67E+01 6.80E+01 3.38E+03 4.73E+04 0.7 7.52E+01 5.20E+01 2.63E+03 3.68E+04 0.8 6.05E+01 4.10E+01 2.11E+03 2.95E+04 0.9 4.98E+01 3.40E+01 1.74E+03 2.43E+04 1 4.18E+01 2.80E+01 1.46E+03 2.04E+04 2 1.36E+01 9.10E+00 4.78E+02 6.69E+03 4 4.55E+00 3.10E+00 1.59E+02 2.22E+03 8 1.52E+00 1.10E+00 5.31E+01 7.43E+02
16 5.04E-01 4.30E-01 1.77E+01 2.46E+02 32 1.62E-01 1.70E-01 5.67E+00 7.93E+01 64 5.20E-02 6.70E-02 1.82E+00 2.54E+01 80 Not Calculated 5.00E-02 Not Calculated Not Calculated
*RISKIND Dose Calculations based on sum of contributions from Cask exposure, groundshine, inhalation, and cloudshine
Radioactive Waste Management Associates 2

Nevada Spent Fuel Transportation Severe Accident Analysis B- 3 -
Table B3: Surface Concentrations (µCi/m2): Category 6 Truck Accident in Las Vegas Downwind Distance (km) Surface Concentration (µCi/m2)
calculated by RISKIND Surface Concentration (µCi/m2) calculated by HotSpot
0.001 2.31E+06 Not Calculated 0.05 8.56E+04 5.60E+04 0.1 9.90E+04 1.10E+05
0.15 7.41E+04 7.10E+04 0.2 5.30E+04 4.70E+04
0.25 3.91E+04 3.30E+04 0.3 2.99E+04 2.50E+04 0.4 1.90E+04 1.50E+04 0.5 1.32E+04 1.00E+04 0.6 9.78E+03 7.50E+03 0.7 7.54E+03 5.70E+03 0.8 6.00E+03 4.60E+03 0.9 4.90E+03 3.70E+03 1 4.09E+03 3.10E+03 2 1.27E+03 1.00E+03 4 4.00E+02 3.40E+02 8 1.24E+02 1.30E+02
16 3.75E+01 4.80E+01 32 1.06E+01 1.90E+01 64 2.95E+00 7.40E+00 80 Not Calculated 5.50E+00
Radioactive Waste Management Associates 3

Nevada Spent Fuel Transportation Severe Accident Analysis B- 4 -
Table B4: Surface Concentrations (µCi/m2): Category 6 Rail Accident in Las Vegas Downwind Distance (km) Surface Concentration (µCi/m2)
calculated by RISKIND Surface Concentration (µCi/m2) calculated by HotSpot
0.001 2.57E+07 Not Calculated 0.05 6.54E+05 3.60E+05 0.1 6.03E+05 6.50E+05
0.15 4.29E+05 4.30E+05 0.2 3.05E+05 2.90E+05
0.25 2.25E+05 2.00E+05 0.3 1.72E+05 1.50E+05 0.4 1.10E+05 9.10E+04 0.5 7.70E+04 6.20E+04 0.6 5.70E+04 4.50E+04 0.7 4.41E+04 3.40E+04 0.8 3.52E+04 2.70E+04 0.9 2.88E+04 2.30E+04 1 2.40E+04 1.90E+04 2 7.54E+03 6.10E+03 4 2.38E+03 2.10E+03 8 7.40E+02 7.50E+02
16 2.25E+02 2.90E+02 32 6.36E+01 1.10E+02 64 1.78E+01 4.40E+01 80 Not Calculated 3.30E+01
Radioactive Waste Management Associates 4
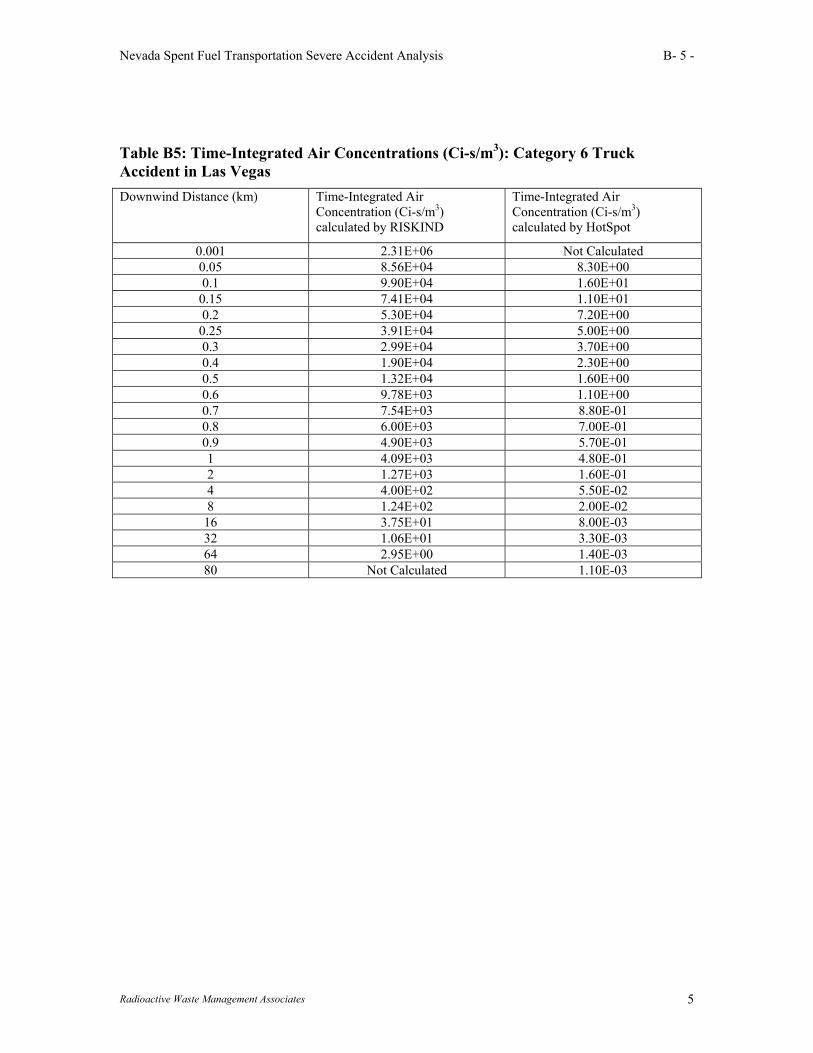
Nevada Spent Fuel Transportation Severe Accident Analysis B- 5 -
Table B5: Time-Integrated Air Concentrations (Ci-s/m3): Category 6 Truck Accident in Las Vegas Downwind Distance (km) Time-Integrated Air
Concentration (Ci-s/m3) calculated by RISKIND
Time-Integrated Air Concentration (Ci-s/m3) calculated by HotSpot
0.001 2.31E+06 Not Calculated 0.05 8.56E+04 8.30E+00 0.1 9.90E+04 1.60E+01
0.15 7.41E+04 1.10E+01 0.2 5.30E+04 7.20E+00
0.25 3.91E+04 5.00E+00 0.3 2.99E+04 3.70E+00 0.4 1.90E+04 2.30E+00 0.5 1.32E+04 1.60E+00 0.6 9.78E+03 1.10E+00 0.7 7.54E+03 8.80E-01 0.8 6.00E+03 7.00E-01 0.9 4.90E+03 5.70E-01 1 4.09E+03 4.80E-01 2 1.27E+03 1.60E-01 4 4.00E+02 5.50E-02 8 1.24E+02 2.00E-02
16 3.75E+01 8.00E-03 32 1.06E+01 3.30E-03 64 2.95E+00 1.40E-03 80 Not Calculated 1.10E-03
Radioactive Waste Management Associates 5

Nevada Spent Fuel Transportation Severe Accident Analysis B- 6 -
Table B6: Time-Integrated Air Concentrations (Ci-s/m3): Category 6 Rail Accident in Las Vegas Downwind Distance (km) Time-Integrated Air
Concentration (Ci-s/m3) calculated by RISKIND
Time-Integrated Air Concentration (Ci-s/m3) calculated by HotSpot
0.001 3.85E+03 Not Calculated 0.05 9.79E+01 5.30E+01 0.1 9.06E+01 9.80E+01
0.15 6.48E+01 6.50E+01 0.2 4.63E+01 4.30E+01
0.25 3.43E+01 3.00E+01 0.3 2.64E+01 2.20E+01 0.4 1.70E+01 1.40E+01 0.5 1.20E+01 9.40E+00 0.6 8.91E+00 6.90E+00 0.7 6.93E+00 5.30E+00 0.8 5.55E+00 4.20E+00 0.9 4.56E+00 3.50E+00 1 3.82E+00 2.90E+00 2 1.24E+00 9.40E-01 4 4.09E-01 3.30E-01 8 1.35E-01 1.20E-01
16 4.46E-02 4.80E-02 32 1.45E-02 2.00E-02 64 4.77E-03 8.50E-03 80 Not Calculated 6.50E-03
West Wendover Category 6 Truck Accident Results
Radioactive Waste Management Associates 6

Nevada Spent Fuel Transportation Severe Accident Analysis B- 7 -
Table B7: Individual Dose Estimates: Category 6 Truck Accident in West Wendover Downwind Distance (km)
Acute (24-hour) Dose Calculated by RISKIND*, rem
Acute (24-hour) Dose Calculated by HotSpot, rem
1-year Long-Term Dose** Calculated By RISKIND, rem
50-year Long-Term Dose** Calculated By RISKIND, rem
0.001 5.74E+02 Not Calculated 2.01E+04 2.80E+05 0.05 8.73E+01 5.40E+01 3.05E+03 4.26E+04 0.1 9.04E+01 9.00E+01 3.16E+03 4.42E+04
0.15 6.26E+01 5.60E+01 2.19E+03 3.06E+04 0.2 4.31E+01 3.60E+01 1.50E+03 2.10E+04
0.25 3.06E+01 2.40E+01 1.07E+03 1.49E+04 0.3 2.26E+01 1.70E+01 7.88E+02 1.10E+04 0.4 1.34E+01 1.00E+01 4.70E+02 6.57E+03 0.5 8.82E+00 6.50E+00 3.09E+02 4.31E+03 0.6 6.20E+00 4.50E+00 2.17E+02 3.03E+03 0.7 4.57E+00 3.30E+00 1.59E+02 2.23E+03 0.8 3.50E+00 2.60E+00 1.22E+02 1.71E+03 0.9 2.76E+00 2.00E+00 9.66E+01 1.35E+03 1 2.23E+00 1.70E+00 7.80E+01 1.09E+03 2 5.57E-01 4.20E-01 1.95E+01 2.72E+02 4 1.38E-01 1.10E-01 4.79E+00 6.70E+01 8 4.49E-02 3.10E-02 1.57E+00 2.20E+01
16 2.34E-02 9.20E-03 8.18E-01 1.14E+01 32 1.18E-02 2.80E-03 4.14E-01 5.78E+00 64 5.66E-03 1.80E-03 1.98E-01 2.77E+00 80 Not Calculated 1.60E-03 Not Calculated Not Calculated
*RISKIND Dose Calculations based on sum of contributions from Cask exposure, groundshine, inhalation, and cloudshine
Radioactive Waste Management Associates 7

Nevada Spent Fuel Transportation Severe Accident Analysis B- 8 -
Table B8: Surface Concentrations (µCi/m2): Category 6 Truck Accident in West Wendover Downwind Distance (km) Surface Concentration (µCi/m2)
calculated by RISKIND Surface Concentration (µCi/m2) calculated by HotSpot
0.001 3.60E+05 Not Calculated 0.05 5.46E+04 3.60E+04 0.1 5.64E+04 5.90E+04
0.15 3.87E+04 3.70E+04 0.2 2.65E+04 2.40E+04
0.25 1.87E+04 1.60E+04 0.3 1.37E+04 1.10E+04 0.4 8.09E+03 6.60E+03 0.5 5.27E+03 4.30E+03 0.6 3.67E+03 3.00E+03 0.7 2.70E+03 2.20E+03 0.8 2.06E+03 1.70E+03 0.9 1.62E+03 1.30E+03 1 1.30E+03 1.10E+03 2 3.18E+02 2.80E+02 4 7.69E+01 7.40E+01 8 2.46E+01 2.10E+01
16 1.25E+01 6.10E+00 32 5.98E+00 1.90E+00 64 2.56E+00 1.20E+00 80 Not Calculated 1.00E+00
Radioactive Waste Management Associates 8

Nevada Spent Fuel Transportation Severe Accident Analysis B- 9 -
Table B9: Time-Integrated Air Concentrations (Ci-s/m3): Category 6 Truck Accident in West Wendover Downwind Distance (km) Time-Integrated Air
Concentration (Ci-s/m3) calculated by RISKIND
Time-Integrated Air Concentration (Ci-s/m3) calculated by HotSpot
0.001 5.39E+01 Not Calculated 0.05 8.19E+00 5.40E+00 0.1 8.47E+00 8.90E+00
0.15 5.85E+00 5.60E+00 0.2 4.02E+00 3.60E+00
0.25 2.85E+00 2.40E+00 0.3 2.09E+00 1.70E+00 0.4 1.25E+00 1.00E+00 0.5 8.16E-01 6.50E-01 0.6 5.71E-01 4.60E-01 0.7 4.21E-01 3.40E-01 0.8 3.22E-01 2.60E-01 0.9 2.53E-01 2.10E-01 1 2.05E-01 1.70E-01 2 5.08E-02 4.30E-02 4 1.25E-02 1.20E-02 8 4.06E-03 3.20E-03
16 2.11E-03 9.60E-04 32 1.06E-03 3.00E-04 64 5.00E-04 1.90E-04 80 Not Calculated 1.70E-04
Radioactive Waste Management Associates 9
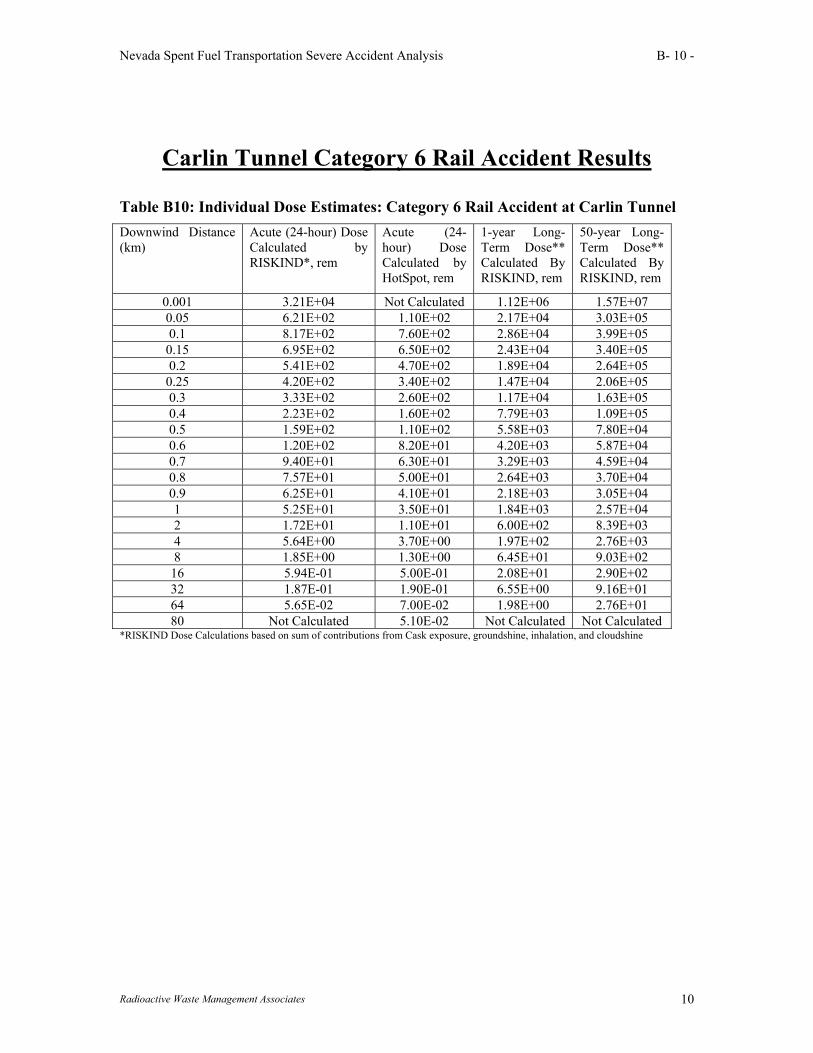
Nevada Spent Fuel Transportation Severe Accident Analysis B- 10 -
Carlin Tunnel Category 6 Rail Accident Results
Table B10: Individual Dose Estimates: Category 6 Rail Accident at Carlin Tunnel Downwind Distance (km)
Acute (24-hour) Dose Calculated by RISKIND*, rem
Acute (24-hour) Dose Calculated by HotSpot, rem
1-year Long-Term Dose** Calculated By RISKIND, rem
50-year Long-Term Dose** Calculated By RISKIND, rem
0.001 3.21E+04 Not Calculated 1.12E+06 1.57E+07 0.05 6.21E+02 1.10E+02 2.17E+04 3.03E+05 0.1 8.17E+02 7.60E+02 2.86E+04 3.99E+05
0.15 6.95E+02 6.50E+02 2.43E+04 3.40E+05 0.2 5.41E+02 4.70E+02 1.89E+04 2.64E+05
0.25 4.20E+02 3.40E+02 1.47E+04 2.06E+05 0.3 3.33E+02 2.60E+02 1.17E+04 1.63E+05 0.4 2.23E+02 1.60E+02 7.79E+03 1.09E+05 0.5 1.59E+02 1.10E+02 5.58E+03 7.80E+04 0.6 1.20E+02 8.20E+01 4.20E+03 5.87E+04 0.7 9.40E+01 6.30E+01 3.29E+03 4.59E+04 0.8 7.57E+01 5.00E+01 2.64E+03 3.70E+04 0.9 6.25E+01 4.10E+01 2.18E+03 3.05E+04 1 5.25E+01 3.50E+01 1.84E+03 2.57E+04 2 1.72E+01 1.10E+01 6.00E+02 8.39E+03 4 5.64E+00 3.70E+00 1.97E+02 2.76E+03 8 1.85E+00 1.30E+00 6.45E+01 9.03E+02
16 5.94E-01 5.00E-01 2.08E+01 2.90E+02 32 1.87E-01 1.90E-01 6.55E+00 9.16E+01 64 5.65E-02 7.00E-02 1.98E+00 2.76E+01 80 Not Calculated 5.10E-02 Not Calculated Not Calculated
*RISKIND Dose Calculations based on sum of contributions from Cask exposure, groundshine, inhalation, and cloudshine
Radioactive Waste Management Associates 10

Nevada Spent Fuel Transportation Severe Accident Analysis B- 11 -
Table B11: Surface Concentrations (µCi/m2): Category 6 Rail Accident at Carlin Tunnel Downwind Distance (km) Surface Concentration (µCi/m2)
calculated by RISKIND Surface Concentration (µCi/m2) calculated by HotSpot
0.001 2.16E+06 Not Calculated 0.05 3.28E+05 7.40E+04 0.1 3.39E+05 5.00E+05
0.15 2.33E+05 4.30E+05 0.2 1.59E+05 3.10E+05
0.25 1.12E+05 2.30E+05 0.3 8.22E+04 1.70E+05 0.4 4.86E+04 1.10E+05 0.5 3.16E+04 7.40E+04 0.6 2.20E+04 5.40E+04 0.7 1.62E+04 4.20E+04 0.8 1.24E+04 3.30E+04 0.9 9.70E+03 2.70E+04 1 7.81E+03 2.30E+04 2 1.91E+03 7.30E+03 4 4.62E+02 2.50E+03 8 1.48E+02 8.90E+02
16 7.51E+01 3.30E+02 32 3.59E+01 1.30E+02 64 1.54E+01 4.70E+01 80 Not Calculated 3.40E+01
Radioactive Waste Management Associates 11

Nevada Spent Fuel Transportation Severe Accident Analysis B- 12 -
Table B12: Time-Integrated Air Concentrations (Ci-s/m3): Category 6 Rail Accident at Carlin Tunnel Downwind Distance (km) Time-Integrated Air
Concentration (Ci-s/m3) calculated by RISKIND
Time-Integrated Air Concentration (Ci-s/m3) calculated by HotSpot
0.001 3.23E+02 Not Calculated 0.05 4.91E+01 1.10E+01 0.1 5.09E+01 7.50E+01
0.15 3.51E+01 6.50E+01 0.2 2.41E+01 4.70E+01
0.25 1.71E+01 3.40E+01 0.3 1.26E+01 2.60E+01 0.4 7.48E+00 1.60E+01 0.5 4.90E+00 1.10E+01 0.6 3.43E+00 8.30E+00 0.7 2.52E+00 6.40E+00 0.8 1.94E+00 5.10E+00 0.9 1.52E+00 4.20E+00 1 1.23E+00 3.50E+00 2 3.05E-01 1.20E+00 4 7.49E-02 4.00E-01 8 2.44E-02 1.50E-01
16 1.26E-02 5.70E-02 32 6.34E-03 2.30E-02 64 3.00E-03 9.70E-03 80 Not Calculated 7.40E-03
Radioactive Waste Management Associates 12

Worst Case Accident Analysis C- 1 -
Appendix C: Alternative Population Density Calculation The primary source of information on tourist statistics was obtained from the Las Vegas Convention and Visitors Authority. According to them, approximately 35,849,691 tourists visited Las Vegas in the year 2000, for an average daily tourist population of 97,950. There are three major tourist destinations in the Las Vegas Metropolitan Statistical Area (MSA), according to the Las Vegas Convention and Visitors Bureau: The Strip, the Downtown/Fremont Street area, and the Boulder City strip. A study produced for the Convention and Visitors Authority by GLS research was used to estimate the distribution of tourists within Las Vegas. This study79 presented the findings of personal interviews and surveys with over 3,300 persons during the fiscal year 2000. This study also estimates the distribution of lodging in the Las Vegas Area. According to the study, approximately 73% of persons interviewed stayed in the Strip Corridor, with 10% staying downtown, and 6% along the Boulder Highway (with 8% staying in other areas and 2% responding “other.”) (figure 45). These estimates are used along with the annual visitor information to obtain a distribution of tourists among the three main lodging areas of Las Vegas. Table C1 presents the average daily tourist population for the three main areas, using the distribution of lodging criteria:
Table C1: Distribution of Lodging in Las Vegas Area Average Daily Tourist Population in Las Vegas MSA: 97,950 Area Percentage of Visitors
Lodging* Estimated Daily Tourist Population
Las Vegas Strip 73 71,504 Downtown/Fremont Area 10 9,795 Boulder Highway Area 6 5,877 *note: 8% of respondents said they lodged in “outlying areas” and 2% responded “other.” Numbers may not total 100% due to roundoff error.
79 GLS Research, 2000. “Las Vegas Visitor Profile: Fiscal Year 2000.” Prepared for Las Vegas Convention and Visitors Authority.
Radioactive Waste Management Associates 1

Nevada Spent Fuel Transportation Severe Accident Analysis D- 1 -
Appendix D: Detailed Population Dose Calculations (Click Here to View Excel Spreadsheets)
Radioactive Waste Management Associates 1
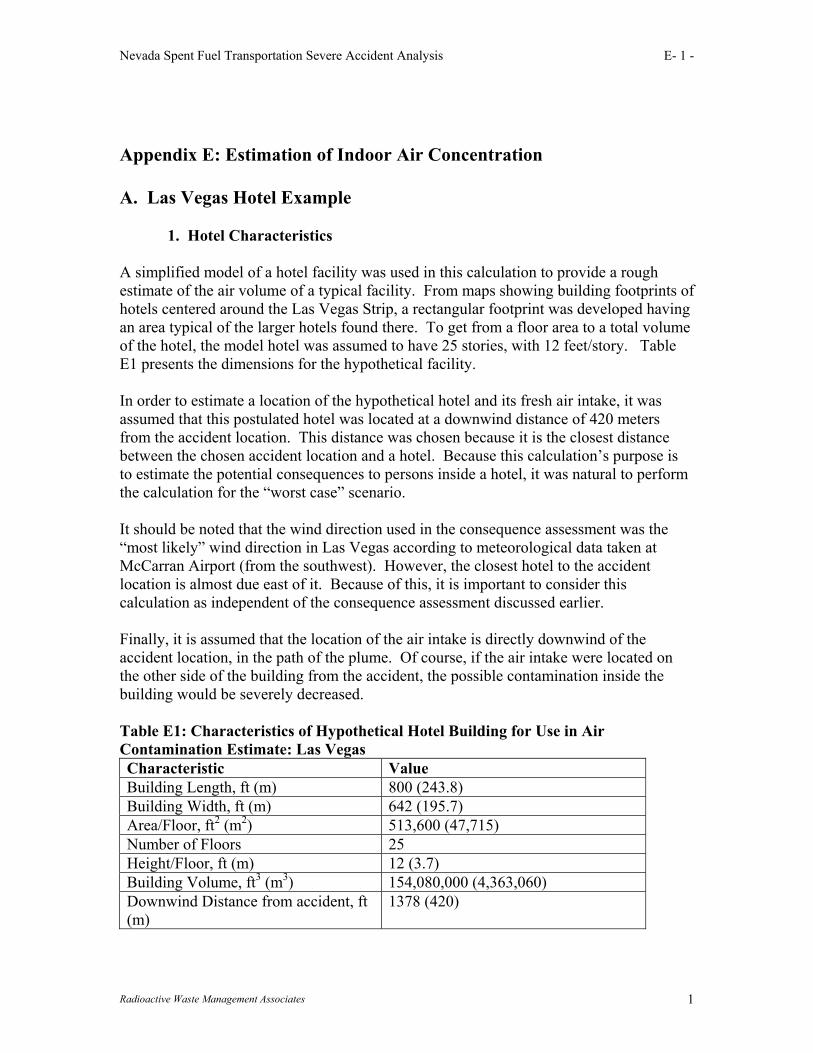
Nevada Spent Fuel Transportation Severe Accident Analysis E- 1 -
Appendix E: Estimation of Indoor Air Concentration A. Las Vegas Hotel Example
1. Hotel Characteristics A simplified model of a hotel facility was used in this calculation to provide a rough estimate of the air volume of a typical facility. From maps showing building footprints of hotels centered around the Las Vegas Strip, a rectangular footprint was developed having an area typical of the larger hotels found there. To get from a floor area to a total volume of the hotel, the model hotel was assumed to have 25 stories, with 12 feet/story. Table E1 presents the dimensions for the hypothetical facility. In order to estimate a location of the hypothetical hotel and its fresh air intake, it was assumed that this postulated hotel was located at a downwind distance of 420 meters from the accident location. This distance was chosen because it is the closest distance between the chosen accident location and a hotel. Because this calculation’s purpose is to estimate the potential consequences to persons inside a hotel, it was natural to perform the calculation for the “worst case” scenario. It should be noted that the wind direction used in the consequence assessment was the “most likely” wind direction in Las Vegas according to meteorological data taken at McCarran Airport (from the southwest). However, the closest hotel to the accident location is almost due east of it. Because of this, it is important to consider this calculation as independent of the consequence assessment discussed earlier. Finally, it is assumed that the location of the air intake is directly downwind of the accident location, in the path of the plume. Of course, if the air intake were located on the other side of the building from the accident, the possible contamination inside the building would be severely decreased. Table E1: Characteristics of Hypothetical Hotel Building for Use in Air Contamination Estimate: Las Vegas Characteristic Value Building Length, ft (m) 800 (243.8) Building Width, ft (m) 642 (195.7) Area/Floor, ft2 (m2) 513,600 (47,715) Number of Floors 25 Height/Floor, ft (m) 12 (3.7) Building Volume, ft3 (m3) 154,080,000 (4,363,060) Downwind Distance from accident, ft (m)
1378 (420)
Radioactive Waste Management Associates 1

Nevada Spent Fuel Transportation Severe Accident Analysis E- 2 -
2. Meteorological Characteristics and Plume Calculation
The general Gaussian Plume Equation for a puff release is given below.
−
−
−−=222
*5.exp*5.exp*5.exp875.7
),,0,,(yzxzyx
yHutxQHtyxCσσσσσσ
Where: Q = total amount of release (Ci), discounted by the depletion fraction at
receptor location C = concentration (Ci/m3) σx = longitudinal dispersion coefficient (m) σy = lateral dispersion coefficient (m) σz = vertical dispersion coefficient (m) x = downwind distance (m) u = longitudinal velocity in downwind direction (m/s) t = time (s) H = effective release height (m) y = crosswind direction (m)
There are a series of simplifying assumptions that are made to facilitate the calculation. First, we decide to look for concentrations only on the centerline of the plume, such that y = 0. Second, we assume a constant wind speed of 4.6m/s, stability category D. We then choose a fixed x distance of 420 meters and create a plot of concentration at x=420 meters as a function of time. Third, we calculate the concentration at ground level. The source term, Q, is discounted by the depletion fraction at 420 meters (calculated using RISKIND) to account for particle deposition. In the case of Kr-85, there is no depletion since it is a gas. Values for the dispersion coefficients were obtained from graphs correlating downwind distance, stability category, and dispersion coefficients (originally developed by Turner) contained in Air Pollution Control Engineering (1995, Nevers, Noel de. McGraw-Hill, Inc. Chapter 6). We make the assumption that σy=σx. Table E.2 presents the variables used in these calculations. Table E.2 Parameters Used in Gaussian Plume Calculation Variable Cs-137 Value Cs-134 Value Kr-85 value Q1, Ci 7322 2647 27200 σy (=σx), m 26 26 26 σz, m 18 18 18 H2, m 6.71 6.71 6.71 u, m/s 4.6 4.6 4.6 x, m 420 420 420
Radioactive Waste Management Associates 2

Nevada Spent Fuel Transportation Severe Accident Analysis E- 3 -
Using the above equation, we were able to create a Gaussian distribution with respect to time at x=420 meters for three major contaminants following a severe spent fuel rail accident: cesium-134, cesium-137, and krypton-85. The general results of these calculations are presented below, along with the normal distribution graph contained as Figure 11. Table E.3: Estimated Concentration Calculation Results:
Values Parameter Cs-137 Cs-134 Kr-85
X/u; average time to reach receptor
91.3 seconds 91.3 seconds 91.3 seconds
Standard deviation 5.65 seconds 5.65 seconds 5.65 seconds Conc. at plume center (Ci/m3) .071 .0258 .265 Avg. plume concentration (Ci/m3) .0288 .0101 .104
The average plume concentration given in Table E.3 was calculated after making the assumption that the entire plume as contained within 3 standard deviations of the plume centerline. In a normal distribution, this is approximately true: 99.14% of the area under the curve lies within 3 σ of the center. In terms of temporal distribution, this means that 99.14% of the plume passes by the receptor point within 34 seconds (6*the standard deviation).
3. Estimating the concentration of contaminants entering building In order to make an estimate of the concentration and duration of contamination entering the hypothetical building, estimates about the air intake rate, number of air changes per hour, and the percentage of intake air that is contaminated needed to be made. According to the EPA’s Indoor Air Division, 3 air changes per hour is typical of large office buildings. We will assume that the hypothetical hotel exchanges air at this rate. Using this assumption, the air intake rate is obtained by multiplying the exchange rate by the hotel volume (obtaining a rate of approximately 218,000 m3/min).
In order to estimate whether the plume will engulf the air intake during its passage (so that there is no dilution of the plume by ambient air), an approximate calculation of the surface area of the plume and air intake is made. The surface area of the plume is estimated by taking + 3 σ as the dimensions of a hypothetical box of contaminated air having a concentration equal to the average plume concentration. Dividing the total
Radioactive Waste Management Associates 3

Nevada Spent Fuel Transportation Severe Accident Analysis E- 4 -
plume inventory at 420 meters downwind by the average concentration at this point provides an estimate of the average volume of the parcel of air containing the plume. Dividing this number by the downwind distance of the plume (6*σx, or 156 meters) gives an estimate of the surface area in the z- and y- directions. This area is estimated to be approximately 1675 m2. Next, we estimate the effective surface area of the air intake duct by using a typical hotel air intake velocity of 150 m/min (from Marks Mechanical Engineer’s Handbook). The effective surface area represents the area surrounding the intake from which air is drawn, meaning that it is often much greater than the physical area of the intake. Dividing the volume flow rate by the velocity produces an effective surface area of 1450 m2. Since this is smaller than the plume surface area, it is assumed that there will be no dilution of the plume for the period of time it takes to pass the intake.
Finally, the average concentration of air entering the hotel is estimated by assuming that the intake filters 20% of particulates entering the facility. Therefore, the average concentration of the air entering the intake for the 34-second duration of the plume passage is estimated by discounting the average plume concentrations presented in Table E.3 by 20% to account for partial filtration of the particulate species (Kr-85 is not filtered). The assumed concentration of the plume entering the hotel (after being filtered) for the 34-second period of the plume passage is given in Table E.4 below. Table E.4: Hotel Intake Concentrations Concentrations In Hotel Intake After Filtration (Ci/m3) Cs-137 Cs-134 Kr-85
0.022 0.008 0.104
4. Estimating the Air Concentration of Contaminants Within Building
The air concentration inside the hypothetical hotel will vary with time as particulates are deposited onto surfaces, as contaminated air leaves the building, and as fresh air enters the building. In a real situation, the hotel would experience a buildup in concentration followed by a gradual decline. However, we have simplified this approach by first estimating the maximum air concentration which could occur in a hypothetical hotel with the constraints described below. This was done in order to provide a cap to the air concentration estimates: they will not be greater than the initial calculated air concentration. The initial concentration is assumed to be the ratio of the total amount of material (measured in curies) entering the hotel divided by the volume. After this, a mass balance on the contaminants is set up as follows (click here for a jpeg view):
Radioactive Waste Management Associates 4

Nevada Spent Fuel Transportation Severe Accident Analysis E- 5 -
[ ]( )
−+−
=
−+−=
+−=
−−=
=
=
=
=
===
=
==∴
−−=
V
ttASdvQ
CC
V
ttASdvQ
C
C
dtV
ASdvQ
CdC
CASdvQCdt
VdC
ASdv
CASdvdepm
outQinQQCoutCoutQoutm
inm
outCCdtdCV
dtairdm
depositionmoutminmdtairdm
)12(
exp12
)12(
1
2ln
Therefore,min)/(m Rate Flow Volume Q
)(m Area Surface
(m/min) velocity deposition
Assume;
passes) cloudafter enters none (assume 0
;
Area VolumeConstant Mixed, Completely a Assume
3
2
.
.
.
...
A graph is then created to show the disappearance of the contaminants as a function of time. As this graph shows, the peak concentrations for each contaminant are: 633.2 µCi/m3 Cs-137, 228.9 µCi/m3 Cs-134, and 2940 µCi/m3 Kr-85, all of which then decrease according to the above equation. Figure 12 is a graph showing this decay.
5. Estimating the Acute Inhalation Dose Within Building To estimate the acute dose due to inhalation of contaminated air within the building, the exponential concentration which is derived in the following section is integrated with respect to time, resulting in the following form:
Radioactive Waste Management Associates 5

Nevada Spent Fuel Transportation Severe Accident Analysis E- 6 -
+=
3ms-Ci
AD
o
SvQVC
Ct
The time-integrated air concentration is then multiplied by the average breathing rate of an individual (8000m3/year) and the Dose Conversion Factor for each radionuclide. The resulting dose represents the acute dose due to inhalation while inside the hypothetical building. Table E.5 presents the results of this calculation, along with a comparison of the indoor and outdoor inhalation doses at 420 meters downwind from the proposed accident location. Table E.5: Acute Inhalation Dose Estimation Within Building: Las Vegas Parameter Cs-137 Cs-134 Kr-85 Time-Integrated Air Concentration Inside Building (Ci-s/m3) 0.18 0.06 3.53 Acute Inhalation Dose (rem) Indoors 1.83 0.75 0.03 Total Acute Inhalation Dose Indoors (rem)
2.62
Total Acute Inhalation Dose Outdoors @420 meters (rem)
14.5
6. Estimating the Surface Contamination Within Building As the contaminated air passes through the hypothetical hotel, some of the particulates are deposited onto the surfaces inside the building. Figure E.1 shows the effect of deposition on the air concentrations within the building. In addition, some particulates will leave the building via an outlet flow that is assumed to equal the inlet flow. For the purposes of dose calculations and a discussion of decontamination, it is necessary to estimate the surface concentrations in the hotel after the passage of the plume. As was stated earlier, the following formula is used to express the deposition rate inside the hotel:
Radioactive Waste Management Associates 6

Nevada Spent Fuel Transportation Severe Accident Analysis E- 7 -
AD
oD
odepAD
oADodep
ADdep
ADdep
SvQVCv
mCi
mSvQVCSv
mCi
V
tASdvQ
oCSvm
CSvm
+=
=+
+=
+−
−=
−=
)/(S
m
0;)(m
infinity, to0 from t w.r.t.gintegratin
exp
C,for ngsubstituti
2
A
dep
,,dep
.
.
µ
Table E.6 presents the surface concentration results for Cesium-134 and Cesium-137. Because Krypton-85 is a gas, it is assumed that there is no deposition of this radionuclide. Table E.6 Surface Concentration Results: Inside Hotel Parameter Units Cs-137 Cs-134 mo Ci 0 0 vd m/min 0.6 0.6 SA M2 1192875 1192875 Co µCi/m3 633.2 228.9 V m3 4363060 4363060 Q m3/min 218153 218153 Total Mass Deposited Ci 2117 765 Surface Concentration µCi/m2 1775 642 Dose Rate* mrem/hr 13.9 13 *Dose Rate calculated using the Effective Dose Coefficients for exposure to a contaminated ground surface The total surface concentration deposited into the hotel is compared with the estimated concentration outside at 420 meters downwind of the hypothetical accident in Table E.6. Table E.7: Surface Concentrations (µCi/m2) at 420 meters downwind from accident Inside Hotel 2,417 Outside 10,400 B. West Wendover Hotel Example
1. Hotel Characteristics Like the Las Vegas Example, a simplified model of a hotel facility was used in this calculation to provide a rough estimate of the air volume of a typical facility in West Wendover. From aerial photographs showing building footprints of hotels in West Wendover, a footprint was developed having an area typical of the hotels found there. To
Radioactive Waste Management Associates 7

Nevada Spent Fuel Transportation Severe Accident Analysis E- 8 -
get from a floor area to a total volume of the hotel, the model hotel was assumed to have 4 stories, with 12 feet/story. Table E.8 presents the dimensions for the hypothetical facility. In order to estimate a location of the hypothetical hotel and its fresh air intake, it was assumed that this postulated hotel was located at a downwind distance of 270 meters from the accident location. This distance was chosen because it is the closest distance between the chosen accident location and a hotel. Because this calculation’s purpose is to estimate the potential consequences to persons inside a hotel, it was natural to perform the calculation for the “worst case” scenario. Finally, it is assumed that the location of the air intake is directly downwind of the accident location, in the path of the plume. Of course, if the air intake were located on the other side of the building from the accident, the possible contamination inside the building would be severely decreased. Table E8: Characteristics of Hypothetical Hotel Building for Use in Air Contamination Estimate: West Wendover Characteristic Value Area/Floor, ft2 (m2) 172,330 (16,010) Number of Floors 4 Height/Floor, ft (m) 12 (3.7) Building Volume, ft3 (m3) 8,271,849 (234,233) Downwind Distance from accident, ft (m)
898 (274)
2. Meteorological Characteristics and Plume Calculation The general Gaussian Plume Equation for a puff release is given below.
−
−
−−=222
*5.exp*5.exp*5.exp875.7
),,0,,(yzxzyx
yHutxQHtyxCσσσσσσ
Where: Q = total amount of release (Ci), discounted by the depletion fraction at
receptor location C = concentration (Ci/m3) σx = longitudinal dispersion coefficient (m) σy = lateral dispersion coefficient (m) σz = vertical dispersion coefficient (m) x = downwind distance (m)
Radioactive Waste Management Associates 8

Nevada Spent Fuel Transportation Severe Accident Analysis E- 9 -
u = longitudinal velocity in downwind direction (m/s) t = time (s) H = effective release height (m) y = crosswind direction (m)
There are a series of simplifying assumptions that are made to facilitate the calculation. First, we decide to look for concentrations only on the centerline of the plume, such that y = 0. Second, we assume a constant wind speed of 2.26m/s, stability category B. We then choose a fixed x distance of 270 meters and create a plot of concentration at x=270 meters as a function of time. Third, we calculate the concentration at ground level. The source term, Q, is discounted by the depletion fraction at 270 meters (calculated using RISKIND) to account for particle deposition. In the case of Kr-85, there is no depletion since it is a gas. Values for the dispersion coefficients were obtained from graphs correlating downwind distance, stability category, and dispersion coefficients (originally developed by Turner) contained in Air Pollution Control Engineering (1995, Nevers, Noel de. McGraw-Hill, Inc. Chapter 6). We make the assumption that σy=σx. Table E.9 presents the variables used in these calculations. Table E.9 Parameters Used in Gaussian Plume Calculation: West Wendover Variable Cs-137 Value Cs-134 Value Kr-85 value Q1, Ci 1240.7 448.8 4540.0 σy (=σx), m 45 45 45 σz, m 26 26 26 H2, m 13.5 13.5 13.5 u, m/s 2.26 2.26 2.26 x, m 273.7 273.7 273.7 Using the above equation, we were able to create a Gaussian distribution with respect to time at x=270 meters for three major contaminants following a severe spent fuel truck accident: cesium-134, cesium-137, and krypton-85. The general results of these calculations are presented below, along with the normal distribution graph contained as Figure 16. Table E.10: Estimated Concentration Calculation Results:
Values Parameter Cs-137 Cs-134 Kr-85
X/u; average time to reach receptor
121.1 seconds 121.1 seconds 121.1 seconds
Standard deviation 19.9 seconds 19.9 seconds 19.9 seconds Conc. at plume center (µCi/m3) 2615.0 945.9 9568.8
Radioactive Waste Management Associates 9

Nevada Spent Fuel Transportation Severe Accident Analysis E- 10 -
Avg. plume concentration (µCi/m3) 1080.4 390.8 3953.4
The average plume concentration given in Table E.10 was calculated after making the assumption that the entire plume as contained within 3 standard deviations of the plume centerline. In a normal distribution, this is approximately true: 99.14% of the area under the curve lies within 3 σ of the center. In terms of temporal distribution, this means that 99.14% of the plume passes by the receptor point within 34 seconds (6*the standard deviation).
3. Estimating the concentration of contaminants entering building
In order to make an estimate of the concentration and duration of contamination entering the hypothetical building, estimates about the air intake rate, number of air changes per hour, and the percentage of intake air that is contaminated needed to be made. According to the EPA’s Indoor Air Division, 3 air changes per hour is typical of large office buildings. We will assume that the hypothetical hotel exchanges air at this rate. Using this assumption, the air intake rate is obtained by multiplying the exchange rate by the hotel volume (obtaining a rate of approximately 11,700 m3/min).
In order to estimate whether the plume will engulf the air intake during its passage (so that there is no dilution of the plume by ambient air), an approximate calculation of the surface area of the plume and air intake is made. The surface area of the plume is estimated by taking + 3 σ as the dimensions of a hypothetical box of contaminated air having a concentration equal to the average plume concentration. Dividing the total plume inventory at 270 meters downwind by the average concentration at this point provides an estimate of the average volume of the parcel of air containing the plume. Dividing this number by the downwind distance of the plume (6*σx, or 270 meters) gives an estimate of the surface area in the z- and y- directions. This area is estimated to be approximately 1757 m2. Next, we estimate the effective surface area of the air intake duct by using a typical hotel air intake velocity of 150 m/min (from Marks Mechanical Engineer’s Handbook). The effective surface area represents the area surrounding the intake from which air is drawn, meaning that it is often much greater than the physical area of the intake. Dividing the volume flow rate by the velocity produces an effective surface area of 78 m2. Since this is smaller than the plume surface area, it is assumed that there will be no dilution of the plume for the period of time it takes to pass the intake.
Finally, the average concentration of air entering the hotel is estimated by assuming that the intake filters 20% of particulates entering the facility. Therefore, the average
Radioactive Waste Management Associates 10

Nevada Spent Fuel Transportation Severe Accident Analysis E- 11 -
concentration of the air entering the intake for the duration of the plume passage is estimated by discounting the average plume concentrations presented in Table E.10 by 20% to account for partial filtration of the particulate species (Kr-85 is not filtered). The assumed concentration of the plume entering the hotel (after being filtered) for the 119.5-second period of the plume passage is given in Table E.11 below. Table E.11: Hotel Intake Concentrations: West Wendover Concentrations In Hotel Intake After Filtration (µCi/m3)
Cs-137 Cs-134 Kr-85 851.0 307.8 3892.7
4. Estimating the Air Concentration of Contaminants Within Building
The determination of air concentration of contaminants within the hypothetical building follows the same formula used for the Las Vegas example. Therefore, the discussion about the assumptions and model used will not be duplicated.
A graph is then created to show the disappearance of the contaminants as a function of time. As this graph shows, the peak concentrations for each contaminant are: 85 µCi/m3 Cs-137, 31 µCi/m3 Cs-134, and 387 µCi/m3 Kr-85, all of which then decrease according to the above equation. Figure 17 is a graph showing this decay.
5. Estimating the Acute Inhalation Dose Within Building To estimate the acute dose due to inhalation of contaminated air within the building, the exponential concentration which is derived in the following section is integrated with respect to time, resulting in the following form:
+=
3ms-Ci
AD
o
SvQVC
Ct
Cs-134
The time-integrated air concentration is then multiplied by the average breathing rate of an individual (8000m3/year) and the Dose Conversion Factor for each radionuclide. The resulting dose represents the acute dose due to inhalation while inside the hypothetical building. Table E.12 presents the results of this calculation, along with a comparison of the indoor and outdoor inhalation doses at 270 meters downwind from the proposed accident location. Table E.12: Acute Inhalation Dose Estimation Within Building: West Wendover
Parameter Cs-137 Kr-85 Time-Integrated Air Concentration
Inside Building (Ci-s/m3) 0.024 0.009 0.465
Radioactive Waste Management Associates 11
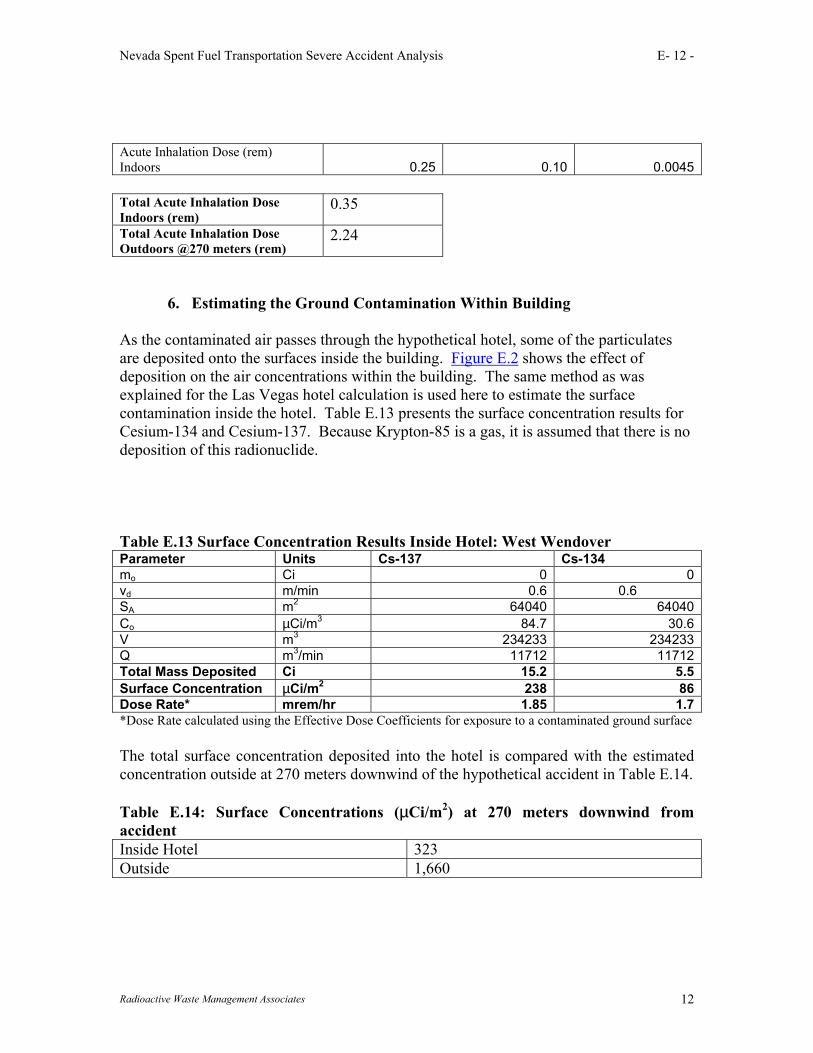
Nevada Spent Fuel Transportation Severe Accident Analysis E- 12 -
Acute Inhalation Dose (rem) Indoors 0.25 0.10 0.0045 Total Acute Inhalation Dose Indoors (rem)
0.35
Total Acute Inhalation Dose Outdoors @270 meters (rem)
2.24
6. Estimating the Ground Contamination Within Building As the contaminated air passes through the hypothetical hotel, some of the particulates are deposited onto the surfaces inside the building. Figure E.2 shows the effect of deposition on the air concentrations within the building. The same method as was explained for the Las Vegas hotel calculation is used here to estimate the surface contamination inside the hotel. Table E.13 presents the surface concentration results for Cesium-134 and Cesium-137. Because Krypton-85 is a gas, it is assumed that there is no deposition of this radionuclide. Table E.13 Surface Concentration Results Inside Hotel: West Wendover Parameter Units Cs-137 Cs-134 mo Ci 0 0 vd m/min 0.6 0.6 SA m2 64040 64040 Co µCi/m3 84.7 30.6 V m3 234233 234233 Q m3/min 11712 11712 Total Mass Deposited Ci 15.2 5.5 Surface Concentration µCi/m2 238 86 Dose Rate* mrem/hr 1.85 1.7 *Dose Rate calculated using the Effective Dose Coefficients for exposure to a contaminated ground surface The total surface concentration deposited into the hotel is compared with the estimated concentration outside at 270 meters downwind of the hypothetical accident in Table E.14. Table E.14: Surface Concentrations (µCi/m2) at 270 meters downwind from accident Inside Hotel 323 Outside 1,660
Radioactive Waste Management Associates 12

Worst Case Accident Analysis Page E-1
Radioactive Waste Management Associates 1