Embed Size (px)
Citation preview
/5082342 WP1 - Analysis of London
Interchange_MainRep_issued 050511.docx
WP1
Analyses of London Interchange Options and Markets A Report for HS2 Ltd
Notice
This report was produced by Atkins Limited for High Speed Two Limited for the specific purpose of High Speed Two Modelling Framework Development.
This report may not be used by any person other than High Speed Two Limited without High Speed Two Limited‟s express permission. In any event, Atkins accepts no liability for any costs, liabilities or losses arising as a result of the use of or reliance upon the contents of this report by any person other than High Speed Two Limited.
Document History
JOB NUMBER: 5082342 DOCUMENT REF: 5082342 WP1 - Analysis of London Interchange_MainRep_issued 050511.docx
04 Minor revisions for web publication
AR/TEM/ SM/AMH
TEM/AJC AJC AHM 05/05/2011
03 Final Draft for HS2 review with updated structure and
model versions
AR/TEM/ SM/AMH
TEM/AJC AJC AHM 10/12/2010
02 Final Draft for HS2 review with Table 7.8 correction
AR/TEM/ SM/AMH
TEM/AJC AJC AHM 22/07/2010
01 Final Draft for HS2 review AR/TEM/ SM/AMH
TEM/AJC AJC AHM 20/07/2010
Revision Purpose Description Originated Checked Reviewed Authorised Date

/5082342 WP1 - Analysis of London
Interchange_MainRep_issued 050511.docx
2
Contents
Section Page
1. Introduction 5
1.1 Background 5
1.2 Purpose of Report 5
1.3 Structure of Report 6
1.4 Presentation and Interpretation of Data 6
2. HS2 Forecasting Framework 8
2.1 PLANET Modelling Framework 8
3. Economic Appraisal 10
4. Reference Scenarios and Forecasts 11
4.1 Overview 11
4.2 Summary Reference Scenario Business Case Benefits and Revenue 15
5. Examining the Case for a HS2 Station at Old Oak Common 16
5.1 Station at Old Oak Common 16
5.2 Old Oak Common as an additional interchange to Euston (Day1C) 17
5.3 Old Oak Common as an additional interchange to Euston and Heathrow T123 (Day1C) 19
5.4 Old Oak Common as an alternative terminus to Euston 21
5.5 Sensitivity to assumptions on interchange to Crossrail at OOC (Day1C) 22
5.6 Sensitivity to improving local rail and bus connections to OOC (Day1C and Y) 23
5.7 The GWML market and the potential for optimising stopping patterns at OOC 24
5.8 Conclusions on the case for a station at OOC 25
6. The HS2 market for Heathrow and the HS2 Heathrow Options under Consideration 27
6.1 HS2 market for Heathrow 27
6.2 HS2 Heathrow Options under Consideration 27
7. Examining the Case for a HS2 “Off-Site” Heathrow station at Iver 33
7.1 Introduction 33
7.2 Iver (Through) as an additional interchange to Euston (Day 1C) 34
7.3 Iver (Through) as an additional interchange to Euston and OOC (Day 1C and Y) 37
7.4 Sensitivity to assuming “best case” highway accessibility to Iver (Day 1C and Y) 39
7.5 Relative performance of Loop and Through options for Iver 41
7.6 Conclusions on the case for a HS2 station at Iver 43
8. Examining the Case for a HS2 “on-site” Heathrow Station at T123 44
8.1 Introduction 44
8.2 T123 (Loop) as an additional interchange to Euston (Day 1C) 45
8.3 T123 (Loop) as an additional interchange to Euston and OOC (Day 1C and Y) 47
8.4 Sensitivity to assuming Airtrack has been implemented on forecasts for T123 (Loop) as an additional interchange to Euston and OOC (Day 1C and Y) 49
8.5 Relative performance of Loop and Through options for T123 51
8.6 T123 (Spur) vs T123 (Loop) (Day 1C and Y) 52
8.7 Conclusions on the case for a HS2 station at Heathrow T123 56
9. Overall Conclusions on Provision of HS2 London Interchange Stations 57

/5082342 WP1 - Analysis of London
Interchange_MainRep_issued 050511.docx
3
List of Tables
Table 4.1 – Old Oak Common (OOC) Service Assumptions and Connectivity 13
Table 4.2 – Summary of HS2 Reference Case Benefit and Revenues over 60-year Appraisal Period 15
Table 5.1 – Station Patronage, Eus+OOC vs Euston Only 17 Table 5.2 - Rail Benefits and Revenues – Eus+OOC vs Euston Only 17
Table 5.3 – Station Patronage, Eus +T123(Loop) +OOC vs Euston+T123(Loop) 20
Table 5.4 - Rail Benefits and Revenues, Eus +T123(Loop) +OOC vs Eus + T123 (Loop) 20
Table 5.5 – Station Patronage, OOC only vs Eus + OOC 21 Table 5.6 - Rail Benefits and Revenues, OOC only vs Eus + OOC 21
Table 5.7 – Station Patronage – Eus+OOC (enhanced PT connectivity) vs Euston + OOC 23
Table 5.8 - Rail Benefits and Revenues – Eus+OOC (enhanced PT connectivity) vs Euston + OOC 24
Table 6.1 - Daily Heathrow Demand for Various Station Locations 27
Table 6.2 – Iver Service Assumptions and Connectivity 29
Table 6.3 – T123 Service Assumptions and Connectivity 30
Table 7.1 – Station Patronage, Eus+Iver (Through) vs Eus+OOC vs Euston Only 34
Table 7.2 – Rail Benefits and Revenues, Eus+Iver(Through) vs Eus+OOC vs Euston Only 35
Table 7.3 – Station Patronage – Eus+ OOC+Iver vs Eus+OOC 37
Table 7.4 - Rail Benefits and Revenues – Eus+OOC+Iver (Through) vs Euston + OOC 38
Table 7.5 - Station Patronage –Euston + OOC + Iver (Through) – With and Without Enhanced Highway
Accessibility 40
Table 7.6 - Rail Benefits - Eus+OOC+Iver (Through) – With and Without Enhanced Highway Accessibility 40
Table 7.7 – Day 1C Station Patronage – Eus+OOC+Iver (Through and Loop) vs Eus+Iver(Through and
Loop) vs Euston + OOC vs Euston Only 41
Table 7.8 – Headline Benefits and Revenues – Day 1C Network 42
Table 8.1 – Station Patronage, Eus+T123 (Loop) vs Eus+OOC vs Euston Only 45
Table 8.2 – Rail Benefits and Revenues, Eus+T123 (Loop) vs Eus+OOC vs Euston Only 45
Table 8.3 – Station Patronage – Eus + OOC+T123(Loop) vs Euston + OOC 47
Table 8.4 - Rail Benefits and Revenues – Eus+OOC+T123(Loop) vs Euston + OOC 47 Table 8.5 – Station Patronage – Eus+OOC+T123 vs Eus+OOC 49
Table 8.6 - Rail Benefits and Revenues – Eus+OOC+T123 (Loop) vs Euston + OOC 50
Table 8.7 – Day 1C Station Patronage – Eus+OOC+T123 (Through and Loop) vs Eus+T123 (Through and
Loop) vs Euston+OOC vs Eus Only 51
Table 8.8 – Headline Benefits and Revenues – Day 1C Network 51
Table 8.9 – Station Patronage – Eus + OOC+T123(Loop) vs Eus + OOC+T123(Spur) vs Euston + OOC 53
Table 8.10 – Rail Benefits and Revenues, Eus+OOC+T123(Loop) vs Eus+OOC+T123(Spur) vs Euston
+OOC 53
Table 8.11 – Station Patronage – Eus + OOC+T123(Loop) vs Eus + OOC+T123(Spur) vs Euston + OOC 54
Table 8.12 – Rail Benefits and Revenues, Eus+OOC+T123(Loop) vs Eus+OOC+T123(Spur) vs
Euston+OOC 55

/5082342 WP1 - Analysis of London
Interchange_MainRep_issued 050511.docx
4
List of Figures
Figure 4.1 – Day 1C network configuration and long distance service levels (one way) 11
Figure 4.2 – Old Oak Common HS2 Station – assumed service connectivity 12
Figure 4.3 – Y network configuration and long distance service levels (one way) 14
Figure 5.1- Day 1C Station choice between OOC and Eus for HS2 trip (Manchester to London) 19
Figure 6.1 – Iver Service and Interchange Assumptions 29
Figure 6.2 – T123 CTA Service and Interchange Assumptions 30
Figure 6.3 – Geographical Representation of Station Choice with a station at Iver 32
Figure 6.4 - Geographical Representation of Station Choice with a station at T123 CTA 32
Appendices
A - Examining the Case for a HS2 Station at Old Oak Common – Supporting Analysis
B - HS2 Business Case Sensitivity to Crossrail Interchange Assumption
C - Analysis of the HS2 Business Case sensitivity to enhanced PT connectivity at Old Oak Common
D - HS2 and the Great Western Main Line (GWML) market
E - Understanding Heathrow Airport Demand
F - Examining the Case for a HS2 “off-site” Heathrow Station at Iver – Supporting Analysis
G - Sensitivity to assuming “best case” highway accessibility to Iver (Day 1C and Y)
H - Relative Performance of Iver Loop and Through Options
I - Analysis of the case for a station at T123 Heathrow – Supporting Analysis
J - Sensitivity to assuming Airtrack has been implemented of forecasts for T123 (Loop) as an additional
interchange to Euston and OOC
K - Relative Performance of Loop and Through Options for T123
L - Relative Performance of Loop and Spur Options for T123

/5082342 WP1 - Analysis of London
Interchange_MainRep_issued 050511.docx
5
1. Introduction
1.1 Background In 2009, Atkins was appointed to develop a forecasting framework for High Speed Two (HS2) to
test and appraise options for high speed rail between London and the West Midlands. The
framework was developed to take into account a wide range of issues, including impacts on
journey time and station accessibility and the value of released capacity on the West Coast Main
Line (WCML).
The main analysis of alternative options is contained in the HS2 reports published in March 2010;
this includes assessment of the case for a London Interchange station, providing interchange with
Crossrail, Great Western Main Line (GWML) services and access to Heathrow Airport.
Further to this reporting, a more detailed understanding of options was required by HS2,
considered in three distinct work packages, analysing;
WP1 – Interchange stations at Heathrow;
WP2 – Connection between HS1 and HS2; and
WP3 – An interchange station at Old Oak Common.
A number of model framework updates were also undertaken to support the above work
packages, representing a further work package (WP0). The results presented in this report
reflect the model framework and its outputs as of September 2010.
Since this work was undertaken, HS2 Ltd. have continued to further refine and update the
PLANET Long Distance Model. Adjustments include revised and updated assumptions on fares
and GDP, station accessibility, capital and operating costs, and the appraisal approach.
The analysis presented in this report is therefore based on an interim version of the model that
has not been used for any other work. This interim version of the model allowed an accurate
assessment of the comparative benefits of each option, and this has reliably informed the HS2 Ltd
option sift process. However, the absolute level of benefits forecast under options examined, and
the analysis presented in these reports is not directly comparable to either the material published
in March 2010 or the consultation material published in February 2011.
1.2 Purpose of Report This report presents detailed analysis undertaken for WP1 and WP3 to understand the demand,
economic benefits and rail revenue implications of options for a London interchange HS2 station.
This includes the examination of potential station locations at Old Oak Common, Iver and T123
and analysis investigating the sensitivity of forecasts to a number of key assumptions.
Sensitivity tests undertaken include the impact of the presence or absence of BAA‟s proposed
Airtrack scheme and assumptions on highway connectivity at Iver, PT connectivity at Old Oak
Common, Crossrail interchange and the markets using GWML both to access London and to
interchange at a HS2 station west of London for travel northwards on HS2 services.
It should be emphasised that this report does not make recommendations on the appropriateness
of providing a London interchange HS2 station as it does not capture aspects such as the cost of
providing a station, environmental and operating implications or other policy considerations that
may be material to the case.

/5082342 WP1 - Analysis of London
Interchange_MainRep_issued 050511.docx
6
1.3 Structure of Report The remainder of this report is structured as follows:
Section 2 provides a brief overview of the structure of the modelling framework;
Section 3 outlines the approach used for economic appraisal;
Section 4 presents demand, benefit and revenue forecasts for the HS2 Day 1C and Y
“reference” scenarios which form the basis for assessing the performance of the London
interchange options;
Section 5 examines the demand, economic benefit and revenue case for a HS2 station at
OOC, either as a second station to Euston or a terminus. The sensitivity of the case for its
role as second station is also assessed, considering the impact of assumptions on the quality
of Crossrail interchange and local public transport connections, along with the importance of
and scope to optimise the role of the GWML market;
Section 6 summarises the market for HS2 from Heathrow passengers and describes the two
HS2 Heathrow station options under consideration – Iver and T123;
Section 7 examines the demand, economic benefit and rail revenue case for an „off site‟ HS2
Heathrow station at Iver and its sensitivity to assumptions on highway accessibility and
specification of services as either Through or Loop;
Section 8 examines the demand, economic benefit and rail revenue case for an „on site‟ HS2
Heathrow station at T123 and its sensitivity to assumptions on the presence of the Airtrack
scheme and specification of services as either Through, Loop or Spur; and
Section 9 presents overall conclusions.
A series of appendices provide detailed supporting analysis for Sections 5 to 8.
1.4 Presentation and Interpretation of Data There are number of general items to be noted in relation to the analysis presented in the
following sections:
The use of strategic forecasting tools inevitably requires some simplification in representation
of options and presents some limitations in the level of accuracy achievable at the detailed
local level;
The findings should therefore be treated with caution as the differences between scenarios
are fairly small (typically between 5% and 10% of total benefits) and often relate to relatively
detailed local issues that, by definition, are not well captured by the strategic modelling
framework;
The small overall effects are also generally the net effect of considerably larger opposing
effects on different markets. In some cases a relatively small change in the scale of impacts
for the markets that either are losing or gaining as a result of the scenario could have a
significant impact on the overall net effect;
No revision of assumptions to optimise or refine performance of the options presented has
yet been undertaken;
Discussion often focuses on trips in one direction (for instance from the West Midlands to
London). Unless otherwise stated impacts can be considered symmetrical and would also be
relevant in the opposite direction;

/5082342 WP1 - Analysis of London
Interchange_MainRep_issued 050511.docx
7
Economic benefits are presented in terms of a present value of benefits across a 60 year
appraisal period from 2026 to 2085, presented in 2009 prices and values;
Summary tables focus on the impacts on the present value of benefits (PVB) and revenue
over the appraisal period as the key indicators of the impact of each scenario. Figures for
changes in indirect tax are also included as this provides the final piece of information
required to allow a BCR to be calculated for a scenario if details on capital and operating
costs are available. However, the impacts are minor and are not generally discussed in the
text;
Unless otherwise stated, station patronage figures are presented as one way flows inbound
to London (and potentially travelling beyond London although London is the ultimate
destination for the majority); and
The analysis of impacts on geographic markets presented is largely in terms of the
government office regions, with some more detailed analysis considering:
Central London and five areas of outer London separately; and
A „Western corridor‟ consisting of the districts and counties from the South East and
South West regions between London and the Avon area.

/5082342 WP1 - Analysis of London
Interchange_MainRep_issued 050511.docx
8
2. HS2 Forecasting Framework The HS2 forecasting framework was developed to assist in the assessment of options for a high
speed rail network across the UK and location of stations on the network.
A full description of the forecasting framework is included in the HS2 Model Development Report,
with subsequent updates detailed within the reporting for WP0. However, background information
is provided here for reference.
2.1 PLANET Modelling Framework The modelling framework uses three PLANET models to represent the interaction between long-
distance and local passenger demand and services on the rail network. Using these three models
allows more accurate representation of travel patterns at both a strategic level and a local level.
The PLANET models take into account a wide range of influences on behaviour such as journey
time, train frequency, interchange – both between modes and within modes, crowding, and
access/egress times.
In addition to this, a spreadsheet based Heathrow model has been incorporated to better
represent travel patterns to and from Heathrow for long distance passengers.
The four models pass information to each other throughout an assignment, making the process
fully integrated.
2.1.1 PLANET Long Distance (PLD)
PLANET Long Distance is derived from the PLANET Strategic model. It is a multi-modal model to
assess strategic movements via rail, air and highway.
A station choice model has been incorporated into this model in London and in Birmingham. This
station choice model takes its access/egress information from local transport models in London
and Birmingham, RAILPLAN and PRISM respectively. Further detail is provided below, as well as
within reporting for WP0.
PLD is used to model long distance journeys only. Movements entirely within the south east –
south west areas (roughly a line from the Wash to the Severn mouth) are modelled in PLANET
South and movements within the West Midlands are modelled in PLANET Midlands.
2.1.2 PLANET South (PS)
PLANET South is a tool for modelling local movements on the London and South East rail
network, stretching to South West England, as described above.
PLANET South is a morning peak rail only model and includes all local services in the south, as
well as the strategic services from the north and South Wales into London.
For HS2 modelling, demand matrices for PLANET South were adjusted to remove any demand
from zones external to the south cordon. To represent passengers on strategic services, demand
from PLD is instead loaded onto the network at cordon points as preloads on appropriate links, to
ensure that crowding levels are correctly represented.
2.1.3 PLANET Midlands (PM)
PLANET Midlands is similar to PLANET South but covers a much smaller area, as the cordon
used for this exercise is much tighter, only covering services that are local to Birmingham itself.
Therefore, the range of the model only extends out to Wolverhampton and Coventry.

/5082342 WP1 - Analysis of London
Interchange_MainRep_issued 050511.docx
9
PLANET Midlands is a rail only model with strategic demand again passed from PLD in the form
of link based pre-loads to ensure that crowding levels are correctly represented.
Travel patterns within PLANET Midlands are largely irrelevant when assessing impacts of different
London Interchange station options.
2.1.4 Role of Station Choice Model
The London station choice model (SCM) allows the London end of the journey to be analysed in
greater detail than PLD alone is capable of. To do this, detailed generalised journey times (GJTs)
across Greater London are passed to PLD from RAILPLAN, a detailed assignment model that
forecasts congested travel costs across London. At this level of detail, a choice is provided for
long distance travellers into / out of London, allowing the onwards “Local Leg” of the trip (from the
London terminus station to the ultimate destination in London) to affect the strategic station
choice.
Providing this detail allows a more robust forecast of travellers who would use each potential
station available for their trip, and therefore the SCM is an important element in understanding
whether there is a case for providing a station at Heathrow.
Further details of Local Leg modelling are set out within the reporting of WP0.
2.1.5 Heathrow Model
To assess the long distance demand to Heathrow Airport, a spreadsheet based model was
developed by Sinclair Knight Merz, based on London Airports Surface Access Model (LASAM).
Demand is calculated using a specialised set of assumptions that differ from those used in PLD,
and this demand is then substituted into the PLD matrices prior to assignment.
This model does not cover travel to Heathrow Airport from outside the main HS2 corridor and
therefore excludes Greater London and most places served by the GWML.

/5082342 WP1 - Analysis of London
Interchange_MainRep_issued 050511.docx
10
3. Economic Appraisal The economic appraisal process uses outputs from each of the three PLANET models in the
framework1 to produce a 60 year appraisal of the economic performance of each option tested
relative to a Base (or Reference) Case.
For each model; trip, time, fares and distance matrices are used to calculate the demand related
economic costs and benefits of the option tested. Following the principles of WebTAG2, the model
outputs are used in combination with standard economic parameters (such as discount rates,
values of time, real value of time growth rates and inflation rates) to produce a summary of the
economic impacts of each option tested (in terms of time savings, revenue, vehicle operating
costs and indirect tax effects), allowing options to be compared. Results are produced in terms of
present values and market prices and can be disaggregated by component of journey cost (e.g.
in-vehicle time or crowded time) and the geographical location of the origins and destinations of
trips.
1 The relevant outputs from the Heathrow model are incorporated within PLD before the appraisal process is
undertaken 2 WebTAG - the Dot‟s appraisal guidance website

/5082342 WP1 - Analysis of London
Interchange_MainRep_issued 050511.docx
11
4. Reference Scenarios and Forecasts
4.1 Overview Full details of the appraisal updates to the HS2 business case since the March 2010 report are
included as part of WP0 reporting. However, as an aid for interpretation of this analysis, this
section presents forecasts for the three HS2 scenarios used as the basis for assessing the
London interchange station options.
Day 1C network, Euston Only
Day 1C network, Euston plus Old Oak Common
Y Network, Euston plus Old Oak Common
4.1.1 Day 1C network, Euston Only
The Day 1C network assumes implementation of a new high speed line between London and
Birmingham with high speed services operating between London and the West Midlands and
“hybrid” services beyond with a particular focus on the North West. The long distance one way
service specification is presented in Figure 4.1. The service specification also assumes some
changes to the classic rail network to take advantage of the capacity released by the introduction
of the HS2 services.
Figure 4.1 – Day 1C network configuration and long distance service levels (one way)
In this scenario it is also assumed that the only London area HS2 station is the Euston terminus.
Consequently, there is no direct interchange with the GWML or Crossrail at a HS2 London area
station as would be the case with an HS2 station at Old Oak Common (OOC), described below.

/5082342 WP1 - Analysis of London
Interchange_MainRep_issued 050511.docx
12
In this scenario HS2 users to/from Euston would however benefit from not being penalised by
additional journey time for an additional stop on route.
Although this is not a scenario actively being progressed by HS2, the performance of the scheme
with only a single London HS2 interchange at Euston provides an important comparison as part of
the incremental analysis of the performance of the London interchange stations.
4.1.2 Day 1C network, Euston and Old Oak Common (OOC)
This scenario represents the current HS2 “central case”. It assumes the same Day 1C high speed
and long distance rail service specification as outlined above but that an additional London area
HS2 station is also provided at Old Oak Common (OOC). This station would provide interchange
to Crossrail services for connectivity to London and GWML services for connectivity to locations
west and south west of London. It would also provide connections to London Overground
services, Heathrow Express and London bus routes. Figure 4.2 and Table 4.1 present the
assumed service connectivity associated with Old Oak Common.
Figure 4.2 – Old Oak Common HS2 Station – assumed service connectivity

/5082342 WP1 - Analysis of London
Interchange_MainRep_issued 050511.docx
13
Table 4.1 – Old Oak Common (OOC) Service Assumptions and Connectivity
Service Old Oak Common
HS2 All HS2 service to/from London stopping with quick interchange to other lines (Day 1C 9 tph, Y Network 16 tph)
GWML All services (fast and stopping) serve OOC with quick interchange to other lines
Crossrail All services stopping (24 tph) with quick interchange to other lines
HEX All services stopping with quick interchange to other lines
London Underground N/A but walk access available to North Acton for Central line
London Overground No connection assumed, other than walk access via Willesden Junction
Bus / Coach Limited connection to local bus services
Car N/A – no railheading allowed for
The addition of OOC, when compared to a Euston only scenario, introduces the journey time
penalty of an additional stop for passengers in and out of London on HS2 and GWML services
which acts to offset improved connectivity benefits.
4.1.3 Y Network, Euston and Old Oak Common
A wider Y network HS2 scenario has also been developed and tested. This assumes
implementation of a more extensive HS2 network with dedicated HS2 routes to the East Midlands
and Leeds and strengthened onward connections northwards to Newcastle and Scotland, in
addition to improved services to the North West. The Y Network and the assumed one-way long
distance service levels specified are presented below in Figure 4.3.

/5082342 WP1 - Analysis of London
Interchange_MainRep_issued 050511.docx
14
Figure 4.3 – Y network configuration and long distance service levels (one way)
/5082342 WP1 - Analysis of London
Interchange_MainRep_issued 050511.docx
15
4.2 Summary Reference Scenario Business Case
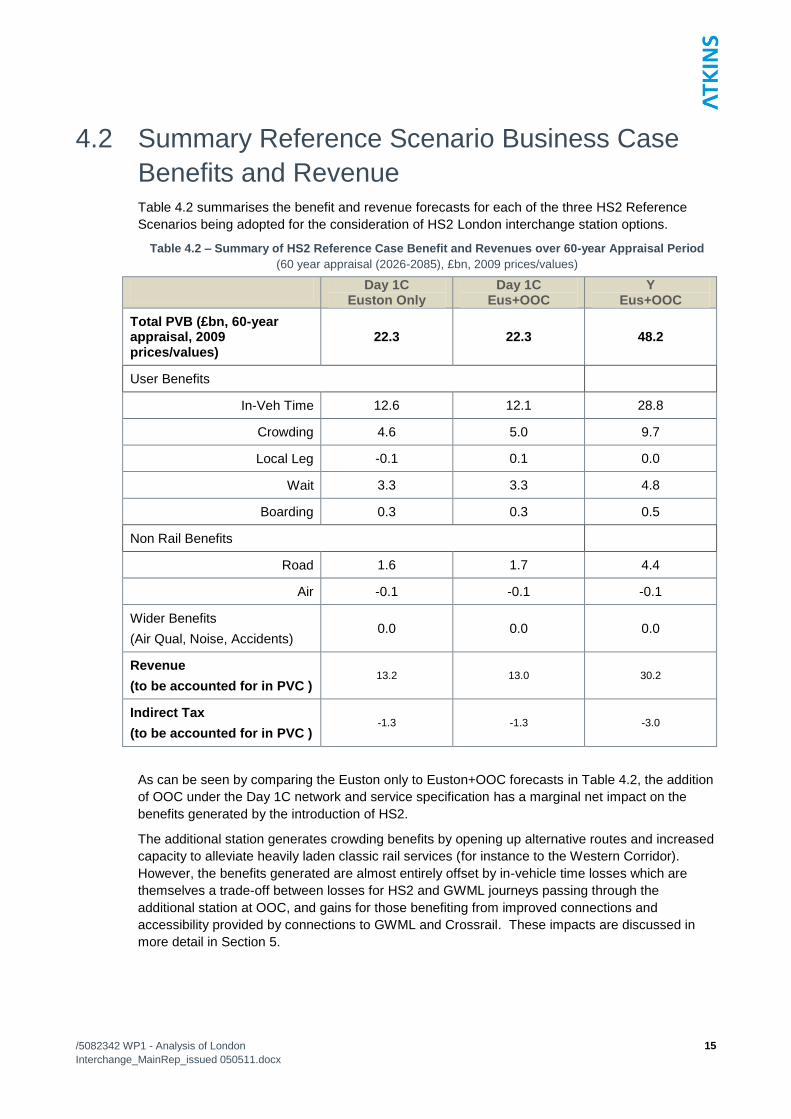
Benefits and Revenue Table 4.2 summarises the benefit and revenue forecasts for each of the three HS2 Reference
Scenarios being adopted for the consideration of HS2 London interchange station options.
Table 4.2 – Summary of HS2 Reference Case Benefit and Revenues over 60-year Appraisal Period
(60 year appraisal (2026-2085), £bn, 2009 prices/values)
Day 1C Euston Only
Day 1C Eus+OOC
Y Eus+OOC
Total PVB (£bn, 60-year appraisal, 2009 prices/values)
22.3 22.3 48.2
User Benefits
In-Veh Time 12.6 12.1 28.8
Crowding 4.6 5.0 9.7
Local Leg -0.1 0.1 0.0
Wait 3.3 3.3 4.8
Boarding 0.3 0.3 0.5
Non Rail Benefits
Road 1.6 1.7 4.4
Air -0.1 -0.1 -0.1
Wider Benefits
(Air Qual, Noise, Accidents) 0.0 0.0 0.0
Revenue
(to be accounted for in PVC ) 13.2 13.0 30.2
Indirect Tax
(to be accounted for in PVC ) -1.3 -1.3 -3.0
As can be seen by comparing the Euston only to Euston+OOC forecasts in Table 4.2, the addition
of OOC under the Day 1C network and service specification has a marginal net impact on the
benefits generated by the introduction of HS2.
The additional station generates crowding benefits by opening up alternative routes and increased
capacity to alleviate heavily laden classic rail services (for instance to the Western Corridor).
However, the benefits generated are almost entirely offset by in-vehicle time losses which are
themselves a trade-off between losses for HS2 and GWML journeys passing through the
additional station at OOC, and gains for those benefiting from improved connections and
accessibility provided by connections to GWML and Crossrail. These impacts are discussed in
more detail in Section 5.

/5082342 WP1 - Analysis of London
Interchange_MainRep_issued 050511.docx
16
5. Examining the Case for a HS2 Station at
Old Oak Common
5.1 Station at Old Oak Common Section 4.1.2 above provides an overview of the station at Old Oak Common (OOC) and its
connectivity to other transport services.
The station would provide two key potential benefits:
Provide an additional access point for London, alleviating pressure, congestion and crowding
at Euston and improving overall journey times for areas well served by the interlinking
services at the station (particularly Crossrail which has a frequency of 24tph at OOC); and
Provide an interchange point with GWML, opening up the potential market to the west of
London, allowing passengers to access HS2 without travelling into London.
However, these benefits would be at the expense of increasing in-vehicle time for HS2 trips to
Euston by 3 minutes and for trips on GWML beyond OOC by 3.5-5 minutes.
The next two sections discuss the net balance of these benefits and disbenefits when OOC is
introduced to HS2 scenarios in addition to:
Euston only; and
Euston + Heathrow T123 (Loop).
The subsequent section then considers the case for OOC as an
Alternative terminus to Euston
The three final sections assess the sensitivity of the conclusions drawn on the case for OOC to
the following key assumptions:
Quality of Crossrail interchange at OOC;
Quality of PT connectivity at OOC; and
GWML stopping patterns at the station.

/5082342 WP1 - Analysis of London
Interchange_MainRep_issued 050511.docx
17
5.2 Old Oak Common as an additional interchange
to Euston (Day1C)
5.2.1 Impact of OOC
This section presents the impact of providing a second London HS2 interchange at OOC in
comparison to a scenario where only a single London interchange is provided at Euston.
Tables 5.1 and 5.2 summarise the performance of the scenario with Euston and an OOC station
alongside the Euston only scenario for the Day 1C network. Further detail is provided in Appendix
A.
Table 5.1 – Station Patronage, Eus+OOC vs Euston Only
(Day 1C, Daily (16hr) HS2 inbound alighting passengers, 2033)
Station (% Share) Euston Only Eus+OOC
Old Oak Common 27,100 (38%)
Euston 66,700 (100%) 43,500 (62%)
Total Daily HS2 PAX Inbound to London
66,700 70,600
Table 5.2 - Rail Benefits and Revenues – Eus+OOC vs Euston Only
(Day 1C, 60 year appraisal (2026-2085), 2009 prices/values)
Benefits and Revenue Euston Only Eus+OOC Difference
PVB £22.3bn £22.3bn £0.1bn
Revenue PV
(Indirect Tax)*
£13.2bn (£-1.3bn)
£13.0bn (£-1.3bn)
£-0.3bn (£0.0bn)
*Revenue is included in the estimate of PVC for each scenario. Indirect tax effects also contribute to the PVC and are
presented, although minor, to enable a BCR to be calculated from results in table, along with capital/operating costs.
5.2.2 Comparison against Euston Only
The tables show that, when added to a Euston only scenario, the net impacts of OOC on PVB and
revenue are slight. The economic benefits of the station in terms of improved connectivity via
GWML and Crossrail are offset by the disbenefits of additional in-vehicle time (IVT) for GWML
and HS2 passengers to London.
Consequently, although the addition of the station causes a net increase in patronage (of 3,900
inbound passengers per day) and 38% of inbound passengers alight there, its net impact on
benefits is marginal. The Present Value of Benefits (PVB) is increased by only £0.1bn and the
revenue generated decreases by £0.3bn (2009 prices /values).
More detailed comparison of the Euston only and Eus+OOC scenarios by geographical market
and benefit component (shown in detail in Appendix A and Table 4.2 in the previous chapter
respectively) confirms that a number of influences contribute to the overall differences in
patronage and benefits.
In particular, the overall marginal gain in in-vehicle time savings represents the net effect of:
Losses to HS2 passengers to Euston who incur the additional in-vehicle time associated with
the additional stop;

/5082342 WP1 - Analysis of London
Interchange_MainRep_issued 050511.docx
18
Losses to GWML passengers travelling beyond OOC who incur the extra in-vehicle time
associated with the additional stop (including trips between Wales and London);
Gains to HS2 passengers to the Western corridor, able to make use of the interchange with
GWML at OOC rather than travel into London and back out;
Gains to GWML passengers to London able to interchange with Crossrail at OOC rather than
Paddington, bringing journey time savings for certain destinations;
Gains to HS2 passengers to Heathrow benefiting from the improved access provided by
OOC; and
Gains to HS2 passengers with ultimate destinations in London (particularly in the north west)
that are easily accessed from OOC, allowing them to alight at OOC rather than Euston and
save 7 minutes of in-vehicle time (sometimes at the expense of increased onward Local Leg
time to the ultimate destination).
The addition of OOC generates an overall gain in crowding benefits which largely reflects the fact
that the station provides new route options which alleviate crowding on some heavily laden classic
rail routes, in particular to/from the Western corridor (which account for 40% of the savings).
These gains are partly offset by increased crowding levels on routes from the North West and
Wales to London caused by the additional trips generated by OOC.
Net Local Leg losses occur on each of the core strategic movements into London and are the net
result of:
Benefits for some passengers travelling to/from areas that are more easily accessed via
OOC than Euston; and
Disbenefits incurred by passengers who choose to trade off a longer Local Leg time via OOC
for the in-vehicle time saving achieved by alighting at OOC rather than Euston (or Paddington
in the case of GWML passengers). These passengers should therefore experience an
offsetting in-vehicle time saving, as described above.
The net overall increase in Local Leg benefits is the result of benefits experienced on the more
local trips (those represented in PLANET South), that are able to select new route options in
response to the additional opportunities provided by OOC and therefore reduce the cost of Local
Leg journey to reach the station.
The impact of OOC in terms of choice of station for HS2 passengers across London is illustrated
in Figure 5.1. It shows a sliding scale between red and green, depicting the proportion of HS2
travellers to/from each zone that choose Euston or OOC as their final station on HS2.
It shows that OOC is the favoured station choice for a large proportion of the geographical area of
greater London, particularly locations both west and east of central London reflecting the influence
of the Crossrail connection. However, the blue boundary on the map identifies the area classified
as central London in the PLD model which accounts for over 90% of HS2 demand to London. This
highlights the fact that the areas that benefit most significantly from the station at OOC in terms of
improved accessibility are relatively insignificant in terms of total demand. The net effect of the
station on accessibility levels across London is therefore limited as reflected by the small scale of
Local Leg benefits identified for the scenario (as shown in Appendix A).
The net £0.2bn decrease in revenue caused by the introduction of OOC occurs on the GWML
services (as represented in PLANET South), reflecting the reduction in demand resulting from the
increased in-vehicle time due to the additional stop at OOC.
The net impact on revenue from strategic trips (as represented in PLD) is negligible. The majority
of the additional HS2 passengers have switched from classic rail and therefore have no impact on
revenue (as fares are assumed to be equivalent for the same trip on classic rail and HS2).

/5082342 WP1 - Analysis of London
Interchange_MainRep_issued 050511.docx
19
Although there is a small overall increase in passengers there is also a shift in balance of new
trips from higher fare routes (particularly into central London) to lower fare routes (particularly to
the Western Corridor). In Day 1C the average fare between NW and West Midlands and Western
corridor is less than 95% of the average fare between NW and West Midlands and London. The
shift in demand therefore leads to a slight reduction in average fare per new rail trip and
consequently the limited net impact on revenue despite the increase in demand.
Figure 5.1- Day 1C Station choice between OOC and Eus for HS2 trip (Manchester to London)
Euston
OOC
PLD
Central
Zone
5.3 Old Oak Common as an additional interchange
to Euston and Heathrow T123 (Day1C)
5.3.1 Overview
The above analysis suggests that, whilst introducing OOC as an additional interchange station
alongside Euston would increase HS2 demand, the net impacts on benefits and revenue are
marginal.
As outlined in Section 1, the case for a station at Heathrow is also being considered and this
raises the further question of whether the impact of introducing a station at OOC would be
different if introduced alongside stations at both Euston and Heathrow.
5.3.2 Impact of OOC
Tables 5.3 and 5.4 summarise the performance of the Eus +T123 (Loop) +OOC scenario
alongside the Eus +T123 (Loop) scenario for the Day 1C network.
PLD Central Zone accounts for c.90% of in-scope Long Distance rail demand to/from
Greater London

/5082342 WP1 - Analysis of London
Interchange_MainRep_issued 050511.docx
20
Table 5.3 – Station Patronage, Eus +T123 (Loop) +OOC vs Euston+T123(Loop)
(Day 1C, Daily (16hr) HS2 inbound alighting passengers, 2033)
Station (% Share) Eus + T123 (Loop) Eus + T123 (Loop) + OOC
Heathrow T123 3,600 (5%) 3,000 (4%)
Old Oak Common 24,700 (35%)
Euston 63,300 (95%) 41,900 (60%)
Total Daily HS2 PAX Inbound to London
66,900 69,600
Table 5.4 - Rail Benefits and Revenues, Eus +T123 (Loop) +OOC vs Eus + T123 (Loop)
(Day 1C, 60 year appraisal (2026-2085), 2009 prices/values)
Benefits and Revenue Eus + T123 (Loop) Eus + T123 (Loop) + OOC
Difference
PVB £22.1bn £21.8bn £-0.3bn
Revenue PV
(Indirect Tax)*
£13.1bn (£-1.3bn)
£12.8bn (£-1.3bn)
£-0.2bn (£0.0bn)
*Revenue is included in the estimate of PVC for each scenario. Indirect tax effects also contribute to the PVC and are
presented, although minor, to enable a BCR to be calculated from results in table, along with capital/operating costs
The tables suggest that the net impact of OOC is slightly more negative when it is considered as a
third station alongside stations at Euston and T123 than when considered as a second station to
Euston.
The addition of the station in this scenario causes a net decrease in the Present Value of Benefits
(PVB) of £0.3bn and in revenue generated of £0.2bn (2009 prices/values).
As in the previous scenario it does however, increase HS2 patronage (by 700 inbound
passengers to London per day) with 35% alighting at OOC.
The net effect shown is again a trade off between considerably larger benefits and losses for the
different groups of passengers identified in the previous section on the impact of OOC as a
second station (primarily those travelling to central London and those travelling to the Western
corridor, discussed in more detail in Appendix A).
The presence of T123 reduces the scale of the additional benefits generated by OOC because
there is some limited overlap between the passengers served by a T123 and OOC station in terms
of interchange connections to the Western corridor and access benefits to London. In other words,
a proportion of the benefits generated by the introduction of OOC, when introduced alone, are
already provided by T123, reducing the incremental benefits generated by the introduction of
OOC in addition to T123.
In contrast, the disbenefits of the additional in-vehicle time for through-passengers associated with
OOC remain largely unchanged with T123 in place. The net balance of the impacts of introducing
OOC are therefore more negative when T123 is already in place.

/5082342 WP1 - Analysis of London
Interchange_MainRep_issued 050511.docx
21
5.4 Old Oak Common as an alternative terminus to
Euston The analysis above suggests that the user and revenue benefits and disbenefits of OOC as a
second station are very closely balanced, with the benefits of interchange with GWML and access
to London via Crossrail closely balancing the time losses for those travelling through the additional
station. A related consideration is the question of the extent to which user benefits and costs
would balance if OOC was considered as the terminus for HS2, avoiding the need for the route to
continue to Euston, with associated route and station cost savings.
A sensitivity test has therefore been undertaken to assess the impact of terminating the HS2 route
at OOC (with all other service specification assumptions remaining unchanged).
Tables 5.5 and 5.6 summarise the impact of the change on demand, benefits and revenue in the
Day 1C scenario. Further detail is provided in Appendix A.
Table 5.5 – Station Patronage, OOC only vs Eus + OOC
(Day 1C, Daily (16hr) HS2 inbound alighting passengers, 2033)
Station (% Share) Eus + OOC OOC Terminus
Old Oak Common 27,100 (38%) 63,300 (100%)
Euston 43,500 (62%)
Total Daily HS2 PAX Inbound to London
70,600 63,300
Table 5.6 - Rail Benefits and Revenues, OOC only vs Eus + OOC
(Day 1C, 60 year appraisal (2026-2085), 2009 prices/values)
Benefits and Revenue Eus + OOC OOC Terminus Difference
PVB £22.3bn £18.6bn £-3.8bn
Revenue PV (Indirect Tax)*
£13.0bn (£-1.3bn)
£11.8bn (£-1.2bn)
£-1.1bn (£0.1bn)
*Revenue is included in the estimate of PVC for each scenario. Indirect tax effects also contribute to the PVC and are
presented, although minor, to enable a BCR to be calculated from results in table, along with capital/operating costs
The figures show that relative to a Day 1C Euston and OOC scenario, an OOC terminus would
reduce HS2 demand by about 7,300 inbound passengers to London per day (about 10%), PVB by
about £3.8bn (over 15%) and revenue by £1.1bn (nearly 10%).
More detailed analysis of the change in demand and benefits by geographical market and
component of benefit (presented in Appendix A) shows that the overall change is the net impact of
a number of effects including:
A switch in terminus station choice to OOC for the majority of passengers previously using
Euston – bringing in-vehicle time savings (the route is 7 minutes shorter to OOC) and Local
Leg disbenefits in travelling to the ultimate destination;
A switch in terminus station choice to Paddington and other stations, accessed via OOC for a
subset of passengers. The net impact on benefits by component for these passengers would
vary according to the route taken but could include an increase in in-vehicle time (with the
onward journey from OOC offsetting the 7 minute saving) and decrease in Local Leg time, if
Paddington or other station choices are closer to the ultimate destination than Euston;

/5082342 WP1 - Analysis of London
Interchange_MainRep_issued 050511.docx
22
A switch away from HS2 on some movements, in particular journeys from Wolverhampton
and Solihull to London. The net impacts of the switch again vary according to route but on
average include in-vehicle time losses (relative to Day 1C) as passengers revert to the slower
classic rail route but potential Local Leg benefits accrued as passengers are able to revert to
a more convenient station at the West Midlands and/or the London end of their journey (e.g.
Marylebone); and
Loss of mode switch and trip generation on some movements, particularly shorter ones for
which the increase in travel time associated with the loss of Euston represents a higher
proportion of total journey costs and therefore would have a greater influence on journey
choice.
Although the reduction in benefits caused by the change in terminus is significant, nearly 85% of
the benefits and over 90% of the revenue associated with the Day 1C scenario are retained.
These changes would need to be considered in association with cost implications of the change to
identify the overall impact on the business case for HS2.
5.5 Sensitivity to assumptions on interchange to
Crossrail at OOC (Day1C)
5.5.1 Overview
A proportion of the benefits associated with the OOC station derive from the fact that it provides a
more westerly access point for London. Over one third of HS2 passengers alight there and travel
onto their ultimate destination through connecting links, in particular Crossrail. This brings a very
modest overall Local Leg benefit with a larger benefit arising from the fact that each passenger
using OOC rather than Euston saves 7 minutes in-vehicle time. As the quality of service provided
by Crossrail is the key factor encouraging passengers to use OOC to access London, the central
case assumptions on the quality of the interchange with Crossrail are an important influence on
the value of benefits estimated.
A review of the Crossrail interchange assumptions has therefore been undertaken, alongside a
preliminary and indicative analysis of the potential HS2 business case impact of adopting a more
pessimistic representation of the quality of Crossrail-HS2 interchange available and the
associated market and route choice response.
5.5.2 Summary of Crossrail Interchange Review
The review is described in more detail in Appendix B and concluded that:
The central case representation of Crossrail and its interchange with HS2 and GWML within
the modelling framework appears reasonable given available information on likely
interchange arrangements;
As an illustration of the potential impact of more pessimistic Crossrail assumptions, an
additional Crossrail interchange penalty of 5 minutes at OOC would reduce the Day 1C PVB
by approximately £1.5 bn (2009 prices/values) if the assumed reduction in the quality of
Crossrail interchange resulted in:
all GWML passengers to London remaining on services into Paddington i.e. with no
GWML-Crossrail interchange taking place at OOC and hence no associated journey
time benefits; and
all forecast HS2- Crossrail interchangers incurring an additional 5 minutes transfer
time.
/5082342 WP1 - Analysis of London
Interchange_MainRep_issued 050511.docx
23
5.5.3 Impact on Conclusions on Case for OOC
The reduction in PVB identified above would change the net impact of a station at OOC from
being marginal to being clearly negative. It should be noted that this conclusion was based on an
offline calculation for the purposes of providing an initial indication of impact. However, it does
highlight the fact that the impact of OOC is sensitive to assumptions on London connections from
the station.
5.6 Sensitivity to improving local rail and bus
connections to OOC (Day1C and Y)
5.6.1 Overview
The Crossrail sensitivity test described above highlighted the significance of assumptions on
public transport connections at OOC. Other than Crossrail, the central case modelling assumes
that OOC has relatively poor local public transport connections, reflecting current service provision
which in turn reflects the proposed station‟s current land use as redundant railway sidings. Given
the aspiration to develop OOC as a major public transport interchange for West London, it is
important to understand the potential impact of improved local public transport connectivity.
A review of the local rail and bus connectivity assumptions for OOC in the reference case has
therefore been carried out and examined in the light of proposed TfL enhancements under
consideration for the area. This resulted in the identification of a potential enhanced OOC public
transport connectivity scenario, encompassing the introduction of new bus connections, new direct
connections and interchange to London Overground North and West London line services, and
further rail connectivity enhancements. However, the scenario represented is intended to be
indicative and does not include any optimisation, for instance to match onward connections to the
forecast patterns of destinations of HS2 passengers at OOC.
Further details of the scenario modelled are provided in Appendix C.
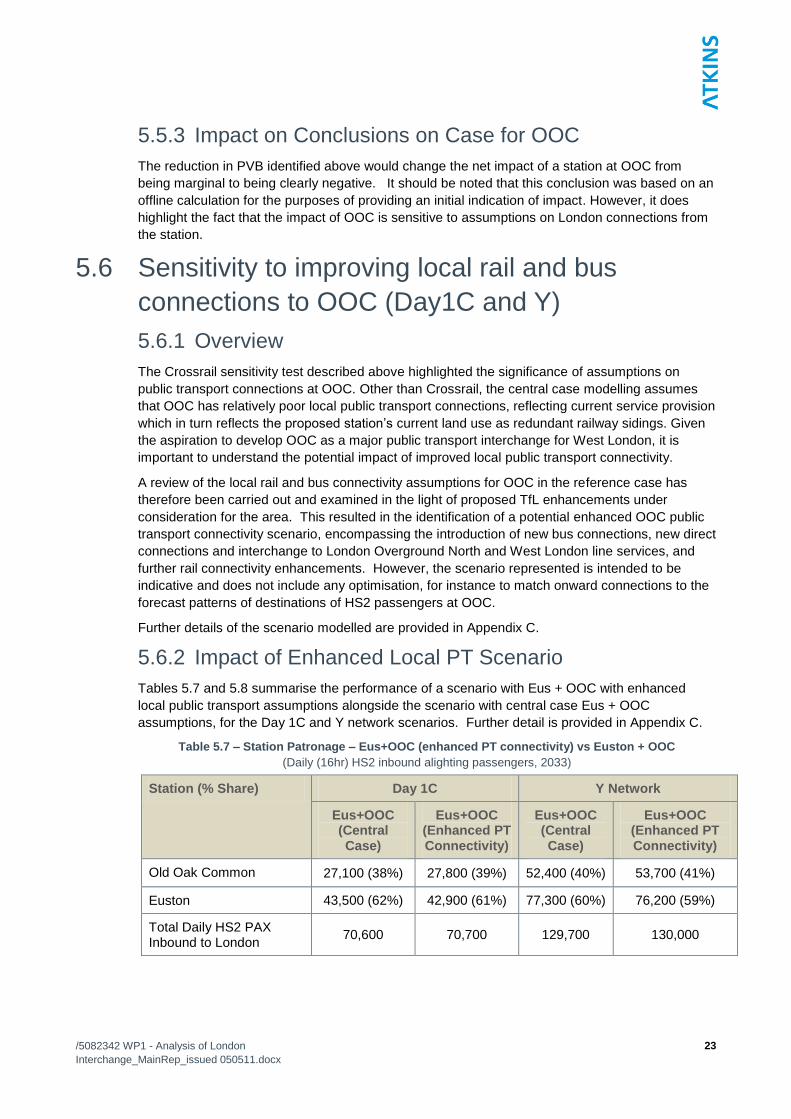
5.6.2 Impact of Enhanced Local PT Scenario
Tables 5.7 and 5.8 summarise the performance of a scenario with Eus + OOC with enhanced
local public transport assumptions alongside the scenario with central case Eus + OOC
assumptions, for the Day 1C and Y network scenarios. Further detail is provided in Appendix C.
Table 5.7 – Station Patronage – Eus+OOC (enhanced PT connectivity) vs Euston + OOC
(Daily (16hr) HS2 inbound alighting passengers, 2033)
Station (% Share) Day 1C Y Network
Eus+OOC (Central Case)
Eus+OOC (Enhanced PT Connectivity)
Eus+OOC (Central Case)
Eus+OOC (Enhanced PT Connectivity)
Old Oak Common 27,100 (38%) 27,800 (39%) 52,400 (40%) 53,700 (41%)
Euston 43,500 (62%) 42,900 (61%) 77,300 (60%) 76,200 (59%)
Total Daily HS2 PAX Inbound to London
70,600 70,700 129,700 130,000

/5082342 WP1 - Analysis of London
Interchange_MainRep_issued 050511.docx
24
Table 5.8 - Rail Benefits and Revenues – Eus+OOC (enhanced PT connectivity) vs Euston + OOC
(Day 1C and Y network, 60 year appraisal (2026-2085), 2009 prices/values)
Business Case Demand, Benefits and Revenues
Day 1C Y Network
Central Case
Enhanced PT
Connectivity
Change Central Case
Enhanced PT
Connectivity
Change
Total PVB £22.3bn £22.7bn £0.4bn £48.2bn £49.2bn £1.0bn
Revenue (Indirect Tax)*
£13.0bn (£-1.3bn)
£13.1bn (£-1.3bn)
£0.1bn (£0.0bn)
£30.2bn (£-3.0bn)
£30.2bn (£-2.9bn)
£0.0bn (£0.0bn)
*Revenue is included in the estimate of PVC for each scenario. Indirect tax effects also contribute to the PVC and are
presented, although minor, to enable a BCR to be calculated from results in table, along with capital/operating costs
In summary, the assessment shows that
Enhanced PT connectivity at Old Oak Common would generate limited additional use of
OOC for HS2 services (700 additional inbound trips to London per day in Day 1C and 1,300
in the Y network scenario). Much of this increase would result from abstraction of HS2
journeys that would otherwise have used Euston but a marginal increase in overall patronage
also occurs.
The overall impact is small and highlights the fact that the local catchment is not the key
driver of benefits associated with OOC. Instead they are driven by the connection between
HS2 and GWML for movements between the Western corridor and the North West/West
Midlands and to a lesser extent the links to Crossrail. Improving local access and
connectivity will have benefits but these are proportionately less significant in terms of market
size and value of benefit / revenue than the Western corridor and central London markets.
The test does however increase the positive net impact of OOC (from a £0.1bn increase in
PVB to £0.4bn and from £0.3bn decrease in revenue to £0.1bn increase). This is based on
an initial test specification and could be increased through optimisation of connections to
serve key destinations for HS2 passengers.
5.6.3 Impact on Conclusions on Case for OOC
Although small, the benefits of improved public transport connectivity are not insignificant and
indicate that improving connectivity should certainly be viewed positively as part of the process of
optimising the benefits of HS2, and would provide further limited enhancement to the business
case for the inclusion of a station at OOC.
5.7 The GWML market and the potential for
optimising stopping patterns at OOC
5.7.1 Overview
A third key set of assumptions affecting the scale of the impacts generated by an OOC station
relates to the impacts of the station on the GWML market. In particular, the scale of benefits
estimated depends on the scale of the GWML market that is in-scope for interchange at OOC and
the scale of disbenefits estimated is affected by the number of GWML passengers incurring
additional in-vehicle time because of the extra stop at OOC.
A review of the GWML market in-scope for HS2 has therefore been undertaken and is outlined in
Appendix D. It identifies the characteristics of the relevant journeys and makes initial suggestions

/5082342 WP1 - Analysis of London
Interchange_MainRep_issued 050511.docx
25
for areas of potential optimisation of services to minimise time penalty due to the additional stop
and to maximise benefits from the interchange.
5.7.2 Summary of GWML stopping pattern review
The key conclusions drawn from the review include the following:
There are a large number of strategic movements utilising “fast” GWML services for access
to other long distance rail services for destinations northwards that could be affected by the
potential to interchange at OOC. The sum of these movements is quite sizeable;
Passengers making these strategic journeys could be generally serviced by “fast services”
currently travelling from key areas such as Didcot, Swindon, Reading and Oxford. However,
regardless of the GWML service type used, any HS2 interchange to the west of London
would provide a clear benefit to these markets;
There is a very large London focused regional market from the Western corridor that could
potentially be affected by the introduction of OOC and the new interchange opportunities it
affords for travel into London; and
Most of these regional passengers to London would experience a benefit from an
interchange with Crossrail at OOC. However, as Crossrail already interchanges with the
GWML at Acton Main Line, there is also potential for optimising the business case by having
some GWML “stopper services” not serving OOC.
5.8 Conclusions on the case for a station at OOC The analysis throughout the previous sections leads to the following key conclusions in relation to
the case for a station at OOC:
Introducing a HS2 station at OOC brings significant benefits for some markets but these are
closely balanced by significant disbenefits for other markets;
The benefits are the result of:
- interchange with Crossrail for access to/from large parts of London;
- improved journey times for trips between the Western corridor -Midlands/NW HS2
through the provision of a GWMl/HS2 interchange; and
- provision of a GWML-Crossrail interchange for journeys to/from London.
The disbenefits are the result of In-vehicle time penalties due to the additional stop for:
- HS2 passengers to/from Euston;
- GWML passengers to/from London stations beyond OOC;
The net impact of the station is marginal if introduced as a second station alongside Euston,
causing a slight increase in PVB but reduction in revenue;
If the station is introduced as a terminus instead of Euston it generates 85% of the benefits
and 90% of the revenue generated by the Eus+OOC scenario;
The benefits generated by the station are reduced if it is considered as a third station
alongside Euston and Heathrow T123 (which overlaps to a limited extent with OOC in terms
of benefits of access to London and the Western Corridor), leading to a more clearly negative
net impact;

/5082342 WP1 - Analysis of London
Interchange_MainRep_issued 050511.docx
26
However, sensitivity tests have identified that the case for OOC is strongly influenced by
assumptions about connecting services and access from HS2 at the station, including the
quality of Crossrail service and connection to it, local public transport connections and
stopping patterns on connecting GWML services. These represent detailed modelling issues
that by definition are not represented in detail in the current strategic modelling framework
and have not been optimised in the analysis presented here; and
Further work to optimise the connections in terms of maximising the level of connectivity
within London and to the GWML market whilst minimising the impacts of additional stops on
GWML services could significantly improve the case for the station.

/5082342 WP1 - Analysis of London
Interchange_MainRep_issued 050511.docx
27
6. The HS2 market for Heathrow and the
HS2 Heathrow Options under
Consideration
6.1 HS2 market for Heathrow In the reference scenarios presented above, HS2 access for passengers to Heathrow is provided
by the HS2 station at Old Oak Common (OOC) and onward connection via Crossrail or Heathrow
Express. A station located at Heathrow Airport itself would therefore offer considerable benefits to
air passengers and would be expected to increase demand for HS2 within the air passenger
segment of the market.
However, analysis based on an adaptation of LASAM (the London Airports Surface Access
Model) suggests that Heathrow air passenger demand would only constitute a small proportion of
total HS2 demand. Table 6.1 shows that although a direct HS2 service to a station „on site‟ at a
Heathrow terminal would increase daily Heathrow demand by over 50%, it would still account for
under 3,000 daily trips. The figures also show that the Heathrow demand is insensitive to the
terminal at which the station is located. An overview of the analysis underlying the forecasts
presented is provided in Appendix E.
Table 6.1 - Daily Heathrow Demand for Various Station Locations
Daily Passengers
OOC Only
OOC + Iver
OOC+ T123
OOC+T4 OOC+T5 OOC+T6
HS2 1,700 1,800 2,800 2,700 2,800 2,700
6.2 HS2 Heathrow Options under Consideration
6.2.1 Overview
The decision to provide an HS2 interchange at Heathrow requires a thorough understanding of
many factors, from demand forecasting through to engineering constraints and environmental
impacts. For the purposes of this work, it was necessary to assume a hypothetical station location
as fully worked-up designs and their requisite assumptions were not yet available.
For this area of analysis, two Heathrow options were therefore considered, representing an on-site
location and an off-site location. In previous HS2 Heathrow option analysis, a theoretical station
“construct” at Heathrow was modelled with “ideal” direct platform access between HS2, other
Heathrow rail services and each airport terminus. This was recognised as being an unachievable
design in practice, but was adopted in order to test a “best case” scenario against the OOC option.
Whilst the analysis presented below used two sites based on more realistically deliverable design
assumptions, they still represented simplified model constructs that reflect theoretically achievable
operation and connectivity because detailed feasibility and design information was not available.
This section sets out the key assumptions about the station sites, which it is important to
understand in interpreting the responses observed from the modelling.

/5082342 WP1 - Analysis of London
Interchange_MainRep_issued 050511.docx
28
6.2.2 Station Options and Service Assumptions
Two station location options were considered in this analysis;
An off-site location at Iver, an existing station on the GWML. Access to Heathrow Airport was
forecast to be by a people mover of some description; and
An on-site location with close proximity to a theoretical Central Terminal Area (CTA) covering
terminals 1, 2 and 3 (T123). This is also a theoretical “construct”, yet notably more realistic
than the assumptions tested in the previous phases of work.
Each option is described in greater detail below.
6.2.2.1 “Through” and “Loop” alignment
In the case of both Iver and T123, the stations were considered on the basis of two HS2
alignments, “Through” and “Loop”.
In the case of the Through alignment, the station is assumed to be located on the line of the main
HS2 route and consequently any trains stopping at the station would potentially impact on times
for all other services on the line. On this basis, it is generally assumed that all HS2 services would
stop at the station. This introduces a journey time penalty to HS2 services to Euston in
comparison to the without station situation, reflecting the additional length of the route and the
need to stop at an additional station.
In the case of the Loop alignment, the station is assumed to be located on a separate section of
HS2 line, providing the opportunity for services to divert from the main HS2 alignment and then
rejoin having served the station. In this instance, there is the opportunity for HS2 services not
serving Heathrow to continue to operate as in the without station scenario. An assumption was
therefore made on the proportion of HS2 services that would serve Heathrow via the Loop (one
third) and those that would operate on the main alignment (two thirds). This resulted in fewer HS2
services to the Heathrow station but also reduced the number of HS2 services impacted by an
additional journey time for doing so.
The service assumptions adopted in each instance for each station are described below.
6.2.2.2 Iver Parkway Interchange
Iver is an existing station just outside the M25 in West London. The station is on the GWML and
is served by a range of both long distance services from Bristol and more local services from
Reading stopping on their way through to London Paddington.
Figure 6.1 below depicts the connectivity with other rail services that the station was assumed to
provide in this analysis.

/5082342 WP1 - Analysis of London
Interchange_MainRep_issued 050511.docx
29
Figure 6.1 – Iver Service and Interchange Assumptions
Iver was assumed to operate as an offsite parkway station with “ideal case” connectivity between
HS2 and Crossrail and GWML services. Whilst the station was assumed to offer highway access
to non-Greater London travellers, those accessing or egressing the station for travel from/to
Greater London were assumed to do so by public transport only. The sensitivity of the forecasts
to this assumption has been examined and is reported in Section 7.
Access from Iver to the T123 CTA at Heathrow was assumed to be via a fast people mover, with a
theoretical travel time from the station to the airport terminal of 11 minutes to which GJT
weightings were applied.
Table 6.2 sets out the detailed service connectivity assumptions for Iver under the Loop and
Through configurations.
Table 6.2 – Iver Service Assumptions and Connectivity
Service Iver (Loop) Iver (Through)
HS2 1/3 of services stopping
Adds 9 minutes to HS2 service time for serving Iver
All services stopping
Adds 7 minutes to HS2 service time for serving Iver
GWML All services stopping with quick interchange available
Adds 3.5-5 minutes to GWML service time for serving Iver
Crossrail 5 tph services stopping with quick interchange available
(compares with 24 tph at OOC)
HEX N/A
London Underground N/A
London Overground N/A
Bus / Coach Assumed to be served by local bus network
Car Parkway facilities provided and accessible by car for railheading for passengers from outside Greater London

/5082342 WP1 - Analysis of London
Interchange_MainRep_issued 050511.docx
30
It was assumed that, where Iver was considered as an additional station to OOC, all GWML
services would stop at Iver and only stopping services would stop at OOC. This meant that only
GWML stopping services would experience a journey time increase with the introduction of Iver.
6.2.2.3 T123 CTA
The on-site station location scenario assumed a theoretical “construct” at a T123 Central Terminal
Area. This new interchange station provided a theoretical direct link between HS2 services and
Terminals 1,2,3 alongside cross-platform interchange to existing rail linkages to T4 and T5,
namely Heathrow Express and the Piccadilly Line.
Figure 6.2 depicts the service connectivity assumed for the T123 CTA construct.
Figure 6.2 – T123 CTA Service and Interchange Assumptions
Table 6.3 below sets out the detailed service connectivity assumptions for the T123 CTA option
under the Loop and Through configurations.
Table 6.3 – T123 Service Assumptions and Connectivity
Service T123 (Loop) T123 (Through)
HS2 1/3 of services stopping
Adds 9 minutes to HS2 service time for serving T123
All services stopping
Adds 7 minutes to HS2 service time for serving T123
GWML N/A
Crossrail 4tph services stopping with quick interchange
(compares with 24 tph at OOC)
HEX All services stopping with quick interchange
London Underground Quick interchange available to all Piccadilly line Heathrow services
London Overground N/A
Bus / Coach Major bus and coach hub
Car Accessible by car for railheading from non-London locations

/5082342 WP1 - Analysis of London
Interchange_MainRep_issued 050511.docx
31
Connections to/from London appear better for T123 than those at Iver given the additional access
to HEX and the Piccadilly line that is not available at Iver. However, the T123 location does not
provide an interchange to/from GWML services, a market connectivity found to generate benefits
with OOC (as described in Section 5).
From Table 6.2 and 6.3 it is apparent that, although both Iver and T123 stations would provide an
interchange with Crossrail, both stations are some significant distance west of London and at
points where the Crossrail service would have reduced in frequency and split between services to
Heathrow and Maidenhead. Consequently, both Iver and T123 would be expected to be less
attractive for connection to Crossrail than OOC which is closer to Central London and connected
to a section of the route which is served by the maximum Crossrail frequency.
6.2.3 Forecasting Station Access
As set out within Section 2, the modelling framework consists of a number of network assignment
models of differing scale and focus. The strategic assignment model, PLD, provides the
backbone of forecasting and appraisal, with more detailed modelling of local travel undertaken by
supplementary models. One element is the London station choice model (SCM) which is intended
to forecast the share of strategic travellers to/from Greater London choosing alternative strategic
(or terminus) stations to access London, based upon the combination of the cost to reach each
station and the onward Local Leg cost (from the strategic station to the ultimate destination). The
Local Leg cost is represented at a detailed level using data from RAILPLAN, a detailed
assignment model that forecasts congested travel costs across London.
For each RAILPLAN zone, a proportion of people would choose Heathrow station as their point of
London access if the overall journey cost means it is beneficial to do so. This proportion is
calculated using a logit function, which compares the total generalised journey time (GJT)
(including Local Leg times) for making a given journey to/from London using each of the eight
strategic stations represented in the SCM (including Euston, OOC, Paddington and Heathrow).
RAILPLAN journey times from the strategic stations to ultimate destinations reflect all public
transport modes meaning that issues such as assumed levels of bus and coach access would
also potentially affect total GJT and therefore station choice for some London zones.
To illustrate the results of the SCM, Figures 6.3 and 6.4 show the geographical spread of station
choice forecast by the model. A sliding scale between red and green depicts the proportion of
HS2 travellers to/from that zone that choose a Heathrow station or another HS2 London access
station (i.e. mainly Old Oak Common or Euston).
The figures show that the geographic area of spread of passengers choosing a Heathrow station
would be considerably greater should the station be placed at T123 CTA, showing the effect of the
linkages to;
Heathrow Express / Connect into Central London;
Piccadilly line for connections into South West London and Central London; and
Bus services accessing Heathrow for West London locations.
However, the majority of areas for which either Heathrow station is the most attractive station
choice fall outside the PLD central zone (highlighted with the blue boundary) and consequently
have relatively limited demand associated with them.
It should also be noted that, although Iver is an existing station with public transport linkages to
the GWML and local bus services, connections are defined in the model on the basis of existing
service patterns and demand requirements, without any allowance for additional passengers
brought about by an HS2 interchange. These assumptions understate the scale of the market with
direct access to Iver, consequently understating the level of demand and benefit generated by the
station, a sensitivity test on changing the assumptions is presented in Appendix C.

/5082342 WP1 - Analysis of London
Interchange_MainRep_issued 050511.docx
32
Figure 6.3 – Geographical Representation of Station Choice with a station at Iver
Iver
OOC/Euston
PLD Central
Zone
Figure 6.4 - Geographical Representation of Station Choice with a station at T123 CTA
T123
OOC/Euston
PLD Central
Zone
/5082342 WP1 - Analysis of London
Interchange_MainRep_issued 050511.docx
33
7. Examining the Case for a HS2 “Off-Site”
Heathrow station at Iver
7.1 Introduction
7.1.1 Overview
This Section considers the case for including an HS2 „Off-Site‟ Heathrow station at Iver
As described in Section 6, two options have been considered for Iver:
A Through station at which all HS2 services call (increasing in-vehicle times to Euston by 7
minutes); and
A Loop station at Iver at which only one third of HS2 services call (increasing in-vehicle times
to Euston for affected services by 9 minutes, whilst times for the other two thirds of services
remain unchanged).
All analysis discussed in this section has been undertaken for both options. However, to simplify
the discussion, Sections 7.2 to 7.4 below focus on the Through option only as it performed better
than the Loop option in terms of PVB generated in the scenarios considered (although the impacts
on revenue were more mixed).
Section 7.5 then summarises the relative performance of the Through and Loop options across
the scenarios and the key factors underlying the consistent difference in performance between the
options. Supporting data is provided in Appendices F to H with Appendix H providing a more
detailed comparison of the results for the Through and Loop Tests.
7.1.2 Impact of Iver Station
Iver provides a connection to GWML as well as connections into London via Crossrail, as
described in Section 6. It therefore presents an additional interchange option for HS2 passengers
and introduces additional connection possibilities, particularly for GWML passengers to/from the
west of London. This in turn brings significant time savings for journeys between these areas and
the core West Midlands and North West corridor served by HS2 by enabling passengers to avoid
travelling into and out of London.
Iver can therefore be seen to perform two roles:
Providing an alternative access station,
- improving access times to areas of London (including Heathrow), alleviating the pressure
on Euston in the process; and
- benefiting from „parkway status‟ meaning that it can be accessed by both public transport
and highway, improving accessibility to HS2 from a wider area.
Opening up the market for HS2 patronage from the area to the west of London (the „Western
corridor‟) served by GWML.
However, the benefits provided by the station are achieved at the expense of additional in-vehicle
times for passengers to Euston (and OOC where relevant) for all services stopping at Heathrow.
GWML passengers to destinations beyond Iver on certain services also experience increased in-
vehicle time as a result of the additional stop made.

/5082342 WP1 - Analysis of London
Interchange_MainRep_issued 050511.docx
34
The following sections discuss the net effect of the benefits and disbenefits outlined when an Iver
station is included in HS2 scenarios with stations at:
Euston only (i.e. without OOC), or
Both Euston and OOC.
Analysis is also presented on the extent to which the conclusions drawn on the impact of an Iver
station would vary if more optimistic assumptions were made on the potential level of highway
access to Iver station than those included in the central case scenario. A summary of the relative
performance of the Through and Loop options is also outlined before a final concluding summary.
All options are considered on the basis of a Day 1C network. For the assessment of Iver in
addition to Euston only, further analysis of the impact on the Y network was not required as the
conclusions drawn from the Day 1C network were clear and would simply be replicated at a larger
scale for the Y network. However, the addition of Iver to Euston and OOC has been considered
on both the Day 1C and Y networks to assess whether the additional demand associated with the
Y network is sufficient to change the balance between the benefits and disbenefits caused by Iver.
The analysis for both networks is presented in parallel in section 7.3.
7.2 Iver (Through) as an additional interchange to
Euston (Day 1C)
7.2.1 Impact of Iver (Through)
This section presents the case for providing a second London HS2 interchange at Iver (rather than
OOC) in comparison to a scenario where only a single London station is provided at Euston for a
Day 1C network.
Tables 7.1 and 7.2 summarise the performance of the scenario with Euston and an Iver (Through)
station alongside Euston only and the central Day 1C scenario where OOC rather than Iver is the
second interchange station.
Table 7.1 – Station Patronage, Eus+Iver (Through) vs Eus+OOC vs Euston Only
(Day 1C, Daily (16hr) HS2 inbound alighting passengers, 2033)
Station (% Share) Euston Only Eus + OOC Eus+Iver (Through)
Heathrow option 17,900 (25%)
Old Oak Common 27,100 (38%)
Euston 66,700 (100%) 43,500 (62%) 52,400 (75%)
Total Daily HS2 PAX Inbound to London
66,700 70,600 70,300

/5082342 WP1 - Analysis of London
Interchange_MainRep_issued 050511.docx
35
Table 7.2 – Rail Benefits and Revenues, Eus+Iver(Through) vs Eus+OOC vs Euston Only
(Day 1C, 60 year appraisal (2026-2085), 2009 prices/values)
Benefits and Revenue
Euston Only
[A]
Eus+OOC
[B]
Eus+Iver (Through)
[C]
Difference from Eus
Only
[C-A]
Difference from
Eus+OOC
[C-B]
PVB £22.3bn £22.3bn £23.0bn £0.8bn £0.7bn
Revenue PV (Indirect Tax)*
£13.2bn (£-1.3bn)
£13.0bn (£-1.3bn)
£13.0bn (£-1.3bn)
£-0.2bn (£0.0bn)
£0.1bn (£0.0bn)
*Revenue is included in the estimate of PVC for each scenario. Indirect tax effects also contribute to the PVC and are
presented, although minor, to enable a BCR to be calculated from results in table, along with capital/operating costs
7.2.2 Comparison against Euston Only
The tables show that, when added to a Euston only scenario, Iver‟s benefits in terms of improved
connectivity via GWML and Crossrail offset the disbenefits of additional in-vehicle time for GWML
and HS2 Euston passengers, resulting in:
A net increase in patronage (of 3,600 passengers inbound to London per day), with 25% of
the total alighting at Iver; and
An increase in the Present Value of Benefits (PVB) of £0.8bn but a decrease in revenue
generated of £0.2bn (2009 prices /values).
More detailed comparison of the Euston only and Eus+Iver (Through) scenarios by geographical
market and benefit component (shown in detail in Appendix F2) confirms that the overall
differences in patronage and benefits are the net impact of the following changes;
Decreases in demand, benefit and revenue for markets to London (experiencing increased
in-vehicle time due to the extra stop, marginally offset by improved Local Leg times via
Crossrail for some passengers);
Increases in demand, benefit and revenue for travel to and from the south east
region/Western corridor (benefiting from reduced in-vehicle times due to GWML connectivity).
This includes crowding relief on the heavily loaded classic rail routes alleviated by the GWML
connection and an increase in mode-switch from car on these journeys, reflecting the fact
that Iver is assumed to be a parkway station, accessible by highway as well as PT; and
Decreases in demand on more local GWML trips (represented in PS) due to the additional
journey time associated with the additional stop at Iver. This loss contributes to the net loss in
revenue.
7.2.3 Comparison against Eus+OOC
The analysis above shows that there is a positive demand and benefit case for an additional
London interchange station at Iver compared to only providing an HS2 station at Euston, although
this is partially offset by a negative impact on revenue. Tables 7.1 and 7.2 also show that Iver
performs slightly better than OOC as a second station in terms of benefit and revenue generation,
although generating slightly less demand. In summary:
The total HS2 market is 0.5% smaller with Eus+Iver than with Eus+OOC, with 25% alighting
at Iver compared to 38% at OOC; and
Eus+Iver generates an additional £0.7bn of benefits and £0.1bn of revenue relative to
Eus+OOC (PVB 2009 prices/values).

/5082342 WP1 - Analysis of London
Interchange_MainRep_issued 050511.docx
36
Iver performs better because, like OOC, it provides connectivity to GWML but it does so at a more
westerly location. This location offers three key benefits:
It reduces the travel time for those HS2 passengers using the station to interchange to/from
GWML services;
It reduces the numbers of passengers adversely affected by the additional stop on GWML
services, both because trains become busier closer to London meaning that affected
passenger numbers are greater for an OOC stop than an Iver stop and because a number of
trains already stop at Iver in the Base case; and
It is possible to provide „parkway‟ facilities for access by highway as well as PT, which is not
the case at OOC.
These additional benefits are offset by two key disbenefits:
The route via Iver (Through) to Euston is 3 minutes longer than via OOC, penalising all those
travelling to Euston; and
Iver (Through) provides reduced connectivity within London, in particular connecting to
Crossrail at a point where onward London-bound journeys are longer and have a frequency
of 5tph rather than the 24tph at OOC. This reduces the Local Leg benefits (and associated
in-vehicle time benefits for those able to alight before Euston).
However, under the central case assumptions on onward connections within London, these
relative disbenefits are less significant than the benefits associated with a more westerly GWML
interchange.
More detailed comparison of the Eus+OOC and Eus+Iver(Through) scenarios by geographical
market and benefit component (shown in detail in Appendix F3) confirm that the overall changes
in patronage, benefits and revenue in Eus+Iver relative to Eus+OOC are the net impact of:
Decreases in benefit due to in-vehicle time losses for the key markets to central London,
reflecting the longer journey time via Iver;
Decreases for the GWML passengers to London who benefit from improved interchange to
Crossrail when OOC is in place but not with Iver;
Increases due to increased in-vehicle savings for trips to and from the Western corridor,
reflecting the fact that Iver provides a closer and quicker GWML connection than OOC for
journeys from the west; and
Increases due to the reduced numbers of GWML passengers affected by the more westerly
additional stop.
7.2.4 Summary of Euston + Iver (Through)
The addition of Iver (Through) to a Euston only scenario increases the demand and benefits
generated by HS2, although slightly reducing revenue generation. Serving the station implies
additional in-vehicle time for all journeys to Euston and some through GWML services. These
disbenefits are more than offset by the benefits provided by the station through the provision of
connections to GWML and Crossrail and parkway access.
Iver performs more strongly than OOC as a second London interchange station under current
modelling assumptions. Both stations provide connections to GWML and Crossrail and, although
Iver‟s location means that the trip to Euston is 3 minutes longer than via OOC and it connects to
less frequent Crossrail services, it also provides benefits by providing a more westerly interchange
with GWML. This improves journey times for those travelling to and from the Western corridor and
decreases the number of GWML passengers adversely affected by the additional stop as Iver is
further out on a less busy section of GWML (and a number of services already stop there in the

/5082342 WP1 - Analysis of London
Interchange_MainRep_issued 050511.docx
37
Base scenario). Iver‟s location also provides the opportunity for parkway facilities and associated
highway access.
7.3 Iver (Through) as an additional interchange to
Euston and OOC (Day 1C and Y)
7.3.1.1 Introduction
The analysis above has shown that there is a case in demand, economic and revenue terms for
an HS2 Iver station as an alternative to OOC. This section therefore examines the impact on
demand, economic benefits and revenue forecasts of providing an Iver HS2 station in addition to a
station at OOC.
It is worth noting that the following key differences in service assumptions have been applied
when including a HS2 Iver station in addition to OOC:
Increased HS2 journey times to/from Euston and OOC, reflecting the time associated with
rerouting to serve Iver;
Altered GWML service assumptions
- Stopping GWML services stop at both Iver and OOC; whereas
- Fast services stop at Iver only.
Analysis has been undertaken for both the Day 1C and Y networks to assess whether the
additional HS2 market associated with the Y network changes the balance between the costs and
benefits of the additional station at Iver in this scenario.
7.3.1.2 Impact of Iver (Through)
Tables 7.3 and 7.4 summarise the performance of a scenario with Euston, OOC and an Iver
(Through) station alongside the central scenario of Euston and OOC for the Day 1C and Y
Network scenarios.
Table 7.3 – Station Patronage – Eus+ OOC+Iver vs Eus+OOC
(Day 1C and Y Network, Daily (16hr) HS2 inbound alighting passengers, 2033)
Day 1C Y Network
Station (% Share) Eus + OOC Eus + OOC + Iver (Through)
Eus+OOC Eus+OOC+Iver (Through)
Heathrow (Iver Through)
15,900 (23%) 32,200 (25%)
Old Oak Common 27,100 (38%) 13,700 (20%) 52,400 (40%) 25,300 (20%)
Euston 43,500 (62%) 39,400 (57%) 77,300 (60%) 69,400 (55%)
Total Daily HS2 PAX Inbound to London
70,600 69,100 129,700 126,800

/5082342 WP1 - Analysis of London
Interchange_MainRep_issued 050511.docx
38
Table 7.4 - Rail Benefits and Revenues – Eus+OOC+Iver (Through) vs Euston + OOC
(Day 1C, 60 year appraisal (2026-2085), 2009 prices/values)
Day 1C Y Network
Benefits and Revenue
Eus+ OOC
Eus+OOC+Iver
(Through)
Change Eus+ OOC
Eus+OOC+Iver
(Through)
Change
PVB £22.3bn £22.0bn £-0.4bn £48.2bn £46.2bn £-1.9bn
Revenue PV (Indirect Tax)*
£13.0bn (£-1.3bn)
£12.5bn (£-1.2bn)
£-0.4bn (£0.0bn)
£30.2bn (£-3.0bn)
£28.9bn (£-2.8bn)
£-1.3bn (£0.1bn)
*Revenue is included in the estimate of PVC for each scenario. Indirect tax effects also contribute to the PVC and are
presented, although minor, to enable a BCR to be calculated from results in table, along with capital/operating costs
The tables show that, when added to a Euston+OOC scenario, Iver‟s benefits in terms of
improved connectivity via GWML and Crossrail are outweighed by the disbenefits of additional in-
vehicle time for GWML and HS2 Euston passengers.
The addition of Iver station generates:
A net decrease in patronage (of 1,500 inbound passengers to London per day in Day 1C,
2,900 in the Y scenario);
A switching of passengers between stations
- Iver abstracts some demand from Euston and a large proportion of the OOC demand,
resulting in passenger levels of about 25% at Iver;
- the combined OOC and Iver share is about 5% greater than that of OOC alone and the
share at Euston reduces accordingly, with the number of alighters at Euston reducing by
4,000 in Day 1C and 8,000 in the Y Network scenario;
A decrease in the Present Value of Benefits (PVB) of £0.4bn and in revenue generated of
£0.4bn (2009 prices /values) for Day 1C. The equivalent figures for the Y network are
decreases of £1.9bn and £1.3bn.
Iver‟s generates a net disbenefit when included in addition to Eus+OOC rather than a net benefit
(as when it is included in addition to Euston only) because the benefits generated by Iver are
reduced if OOC is already assumed to be in place. In contrast, the additional journey time for
journeys to Euston remain largely unchanged whether or not OOC station is served (although the
impacts for GWML passengers are reduced).
The benefits of Iver largely result from the connectivity provided between HS2 and GWML and
Crossrail. As OOC also provides both of these functions, when Iver is introduced in addition to
OOC the incremental benefits of the connections provided are smaller than when the station is
introduced in addition to Euston alone.
Iver does however provide some complementary functionality to the OOC Station in that it
provides greater journey time benefits for those interchanging between HS2 and GWML relative to
OOC only (which is located further east). It also provides parkway facilities. The majority of use of
Iver therefore relates to passengers using the station as a parkway or interchanging on journeys
between the Western corridor and West Midlands and North West in Day 1C and wider markets in
the Y network.
More detailed analysis of the difference in demand and benefits for a selection of key HS2
markets between Eus+OOC+Iver (Through) and Eus+OOC for Day 1C (shown in Appendix F3)
confirms that the overall change is the result of a trade off between

/5082342 WP1 - Analysis of London
Interchange_MainRep_issued 050511.docx
39
An increase in benefits on journeys between the Western corridor and the West Midlands
and North West; and
A more significant adverse impact on in-vehicle time for markets to/from Central London.
7.4 Sensitivity to assuming “best case” highway
accessibility to Iver (Day 1C and Y)
7.4.1 Overview
The analysis presented above suggests that there is not a demand, benefit or revenue case for
adding Iver station to Eus+OOC in the Day 1C or Y Network scenarios. However, it is recognised
that the assumptions underlying this central case analysis potentially understate the scope for
highway parkway access to Iver station from within London and associated benefits.
An illustrative „best case‟ for the level of demand and benefit that might be captured if more
optimistic assumptions on highway accessibility to the station from within London were made has
therefore been tested. The test undertaken was intended to give an upper range estimate of
benefits to identify whether the results produced would change the conclusions drawn from the
central case analysis that there is not a case for including an Iver station in addition to OOC.
The test is deliberately framed as a „best case‟ and provides an optimistic representation of
impacts due to a number of factors;
The representation of improved highway accessibility to Iver from greater London involves
simple assumptions with no allowance for factors such as car availability and therefore will
overstate the benefits available;
The representation of parkway access to Iver from outside greater London has not been
optimised - it is likely that the current representation, particularly the simple representations
of parking, would tend to overestimate benefits;
The representation of OOC within the test has not been optimised in a similar way to Iver. If
this was undertaken, OOC might draw some of the demand drawn to Iver in this test.
7.4.2 Impact of Improved Accessibility Assumptions
7.4.2.1 Overview
Tables 7.5 and 7.6 summarise the performance of a scenario with Euston, OOC and an Iver
(Through) station and best case highway accessibility assumptions alongside the central case
assumptions for the Day 1C and Y Network scenarios with an Iver (Through) station.
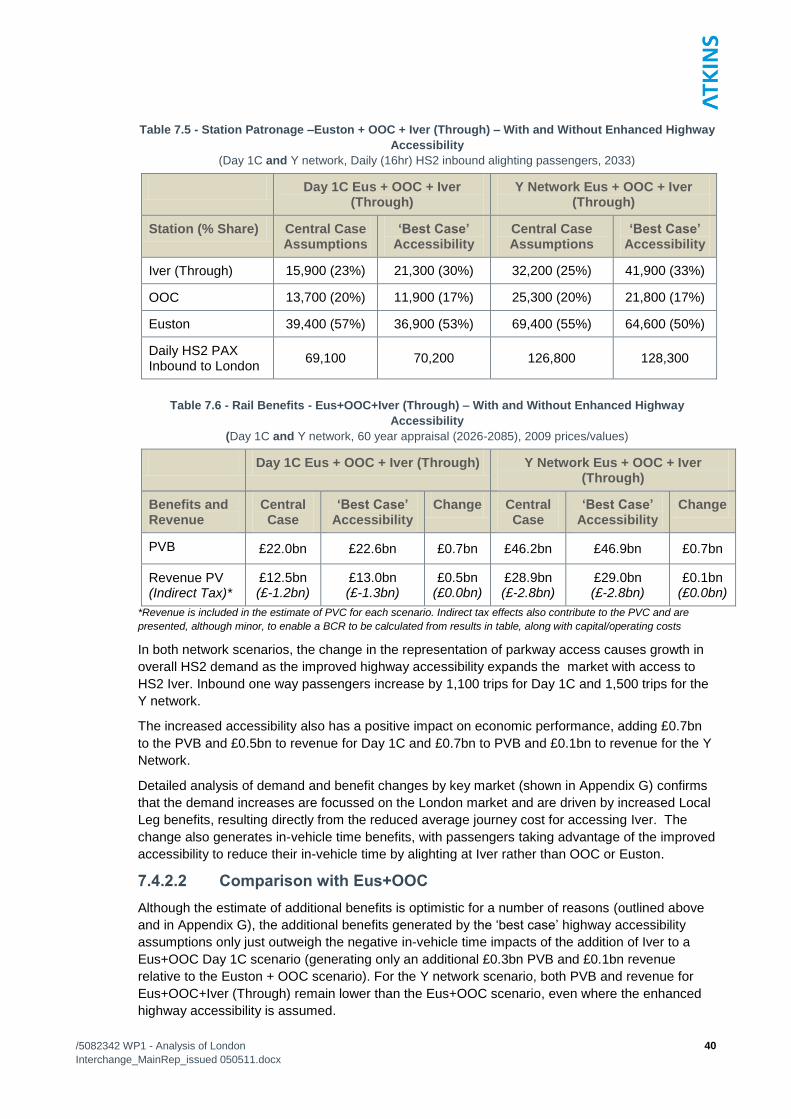
/5082342 WP1 - Analysis of London
Interchange_MainRep_issued 050511.docx
40
Table 7.5 - Station Patronage –Euston + OOC + Iver (Through) – With and Without Enhanced Highway
Accessibility
(Day 1C and Y network, Daily (16hr) HS2 inbound alighting passengers, 2033)
Day 1C Eus + OOC + Iver (Through)
Y Network Eus + OOC + Iver (Through)
Station (% Share) Central Case Assumptions
„Best Case‟ Accessibility
Central Case Assumptions
„Best Case‟ Accessibility
Iver (Through) 15,900 (23%) 21,300 (30%) 32,200 (25%) 41,900 (33%)
OOC 13,700 (20%) 11,900 (17%) 25,300 (20%) 21,800 (17%)
Euston 39,400 (57%) 36,900 (53%) 69,400 (55%) 64,600 (50%)
Daily HS2 PAX Inbound to London
69,100 70,200 126,800 128,300
Table 7.6 - Rail Benefits - Eus+OOC+Iver (Through) – With and Without Enhanced Highway
Accessibility
(Day 1C and Y network, 60 year appraisal (2026-2085), 2009 prices/values)
Day 1C Eus + OOC + Iver (Through) Y Network Eus + OOC + Iver (Through)
Benefits and Revenue
Central Case
„Best Case‟ Accessibility
Change Central Case
„Best Case‟ Accessibility
Change
PVB £22.0bn £22.6bn £0.7bn £46.2bn £46.9bn £0.7bn
Revenue PV (Indirect Tax)*
£12.5bn (£-1.2bn)
£13.0bn (£-1.3bn)
£0.5bn (£0.0bn)
£28.9bn (£-2.8bn)
£29.0bn (£-2.8bn)
£0.1bn (£0.0bn)
*Revenue is included in the estimate of PVC for each scenario. Indirect tax effects also contribute to the PVC and are
presented, although minor, to enable a BCR to be calculated from results in table, along with capital/operating costs
In both network scenarios, the change in the representation of parkway access causes growth in
overall HS2 demand as the improved highway accessibility expands the market with access to
HS2 Iver. Inbound one way passengers increase by 1,100 trips for Day 1C and 1,500 trips for the
Y network.
The increased accessibility also has a positive impact on economic performance, adding £0.7bn
to the PVB and £0.5bn to revenue for Day 1C and £0.7bn to PVB and £0.1bn to revenue for the Y
Network.
Detailed analysis of demand and benefit changes by key market (shown in Appendix G) confirms
that the demand increases are focussed on the London market and are driven by increased Local
Leg benefits, resulting directly from the reduced average journey cost for accessing Iver. The
change also generates in-vehicle time benefits, with passengers taking advantage of the improved
accessibility to reduce their in-vehicle time by alighting at Iver rather than OOC or Euston.
7.4.2.2 Comparison with Eus+OOC
Although the estimate of additional benefits is optimistic for a number of reasons (outlined above
and in Appendix G), the additional benefits generated by the „best case‟ highway accessibility
assumptions only just outweigh the negative in-vehicle time impacts of the addition of Iver to a
Eus+OOC Day 1C scenario (generating only an additional £0.3bn PVB and £0.1bn revenue
relative to the Euston + OOC scenario). For the Y network scenario, both PVB and revenue for
Eus+OOC+Iver (Through) remain lower than the Eus+OOC scenario, even where the enhanced
highway accessibility is assumed.

/5082342 WP1 - Analysis of London
Interchange_MainRep_issued 050511.docx
41
7.4.3 Impact on Conclusions on the Case for Iver
The representation of highway access is a significant issue in assessing the impact of Iver station.
However, the analysis outlined above suggests that it is unlikely that additional, currently
uncaptured benefits associated with highway access to Iver would offset the net disbenefit caused
by the station (through its impact on journey times for the core market to central London) to
provide a positive case for including an Iver station in addition to OOC. Consideration of the
capital and operating costs of implementing Iver in addition to Eus+OOC would further weaken the
case for its inclusion.
7.5 Relative performance of Loop and Through
options for Iver
7.5.1 Overview
The discussion above is based on the impact of the Iver Through option, where all HS2 services
are routed through the station, incurring a 7 minute increase in journey time to Euston and Old
Oak Common (where applicable).
The key alternative considered was the Loop option in which only a third of services are assumed
call at the station. The remaining two thirds retain the original direct route but services calling at
Heathrow experience a greater increase in journey time to London (9 minutes in total).
Tables 7.7 and 7.8 summarise the relative impact of the Iver Through and Loop options on overall
HS2 demand and station choice and economic performance when considered as an alternative or
addition to OOC station in Day 1C. Further detail is provided in Appendix H.
Table 7.7 – Day 1C Station Patronage – Eus+OOC+Iver (Through and Loop) vs Eus+Iver(Through and
Loop) vs Euston + OOC vs Euston Only
(Daily (16hr) HS2 inbound alighting passengers, 2033)
Station (% Share) Eus Only
Eus + OOC
Eus + Iver (Through)
Eus + Iver (Loop)
Eus + OOC + Iver
(Through)
Eus + OOC +
Iver (Loop)
Heathrow (Iver) 17,900 (25%)
6,700 (10%)
15,900 (23%)
4,800 (7%)
Old Oak Common 27,100 (38%)
13,700 (20%)
20,600 (30%)
Euston 66,700 (100%)
43,500 (62%)
52,400 (75%)
61,500 (90%)
39,400 (57%)
43,100 (63%)
Daily HS2 PAX Inbound to London
66,700 70,600 70,300 68,200 69,100 68,600
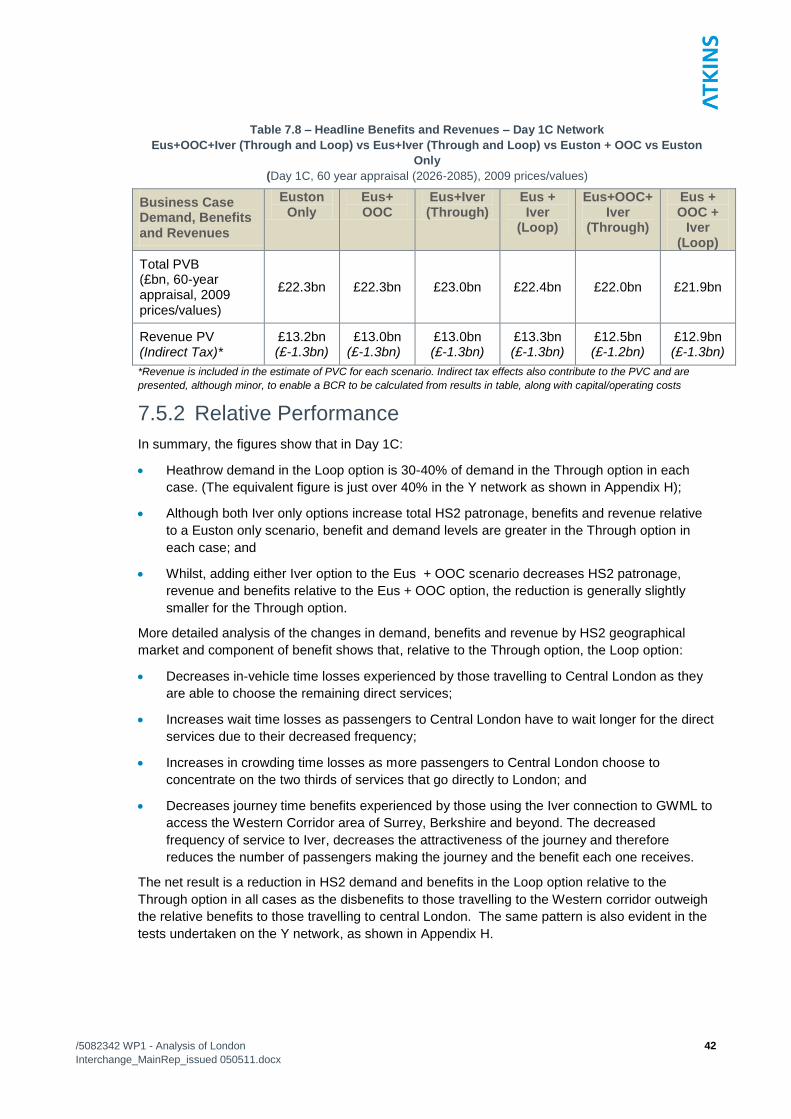
/5082342 WP1 - Analysis of London
Interchange_MainRep_issued 050511.docx
42
Table 7.8 – Headline Benefits and Revenues – Day 1C Network
Eus+OOC+Iver (Through and Loop) vs Eus+Iver (Through and Loop) vs Euston + OOC vs Euston
Only
(Day 1C, 60 year appraisal (2026-2085), 2009 prices/values)
Business Case Demand, Benefits and Revenues
Euston Only
Eus+ OOC
Eus+Iver (Through)
Eus + Iver
(Loop)
Eus+OOC+Iver
(Through)
Eus + OOC +
Iver (Loop)
Total PVB (£bn, 60-year appraisal, 2009 prices/values)
£22.3bn £22.3bn £23.0bn £22.4bn £22.0bn £21.9bn
Revenue PV (Indirect Tax)*
£13.2bn (£-1.3bn)
£13.0bn (£-1.3bn)
£13.0bn (£-1.3bn)
£13.3bn (£-1.3bn)
£12.5bn (£-1.2bn)
£12.9bn (£-1.3bn)
*Revenue is included in the estimate of PVC for each scenario. Indirect tax effects also contribute to the PVC and are
presented, although minor, to enable a BCR to be calculated from results in table, along with capital/operating costs
7.5.2 Relative Performance
In summary, the figures show that in Day 1C:
Heathrow demand in the Loop option is 30-40% of demand in the Through option in each
case. (The equivalent figure is just over 40% in the Y network as shown in Appendix H);
Although both Iver only options increase total HS2 patronage, benefits and revenue relative
to a Euston only scenario, benefit and demand levels are greater in the Through option in
each case; and
Whilst, adding either Iver option to the Eus + OOC scenario decreases HS2 patronage,
revenue and benefits relative to the Eus + OOC option, the reduction is generally slightly
smaller for the Through option.
More detailed analysis of the changes in demand, benefits and revenue by HS2 geographical
market and component of benefit shows that, relative to the Through option, the Loop option:
Decreases in-vehicle time losses experienced by those travelling to Central London as they
are able to choose the remaining direct services;
Increases wait time losses as passengers to Central London have to wait longer for the direct
services due to their decreased frequency;
Increases in crowding time losses as more passengers to Central London choose to
concentrate on the two thirds of services that go directly to London; and
Decreases journey time benefits experienced by those using the Iver connection to GWML to
access the Western Corridor area of Surrey, Berkshire and beyond. The decreased
frequency of service to Iver, decreases the attractiveness of the journey and therefore
reduces the number of passengers making the journey and the benefit each one receives.
The net result is a reduction in HS2 demand and benefits in the Loop option relative to the
Through option in all cases as the disbenefits to those travelling to the Western corridor outweigh
the relative benefits to those travelling to central London. The same pattern is also evident in the
tests undertaken on the Y network, as shown in Appendix H.

/5082342 WP1 - Analysis of London
Interchange_MainRep_issued 050511.docx
43
7.6 Conclusions on the case for a HS2 station at Iver The analysis presented above leads to the following conclusions in relation to the case for
including a Heathrow HS2 station at Iver.
Including an Iver (Through) station in a Euston only scenario generates greater PVB levels
than the Euston only scenario. The benefits associated with interchange with GWML and to a
lesser extent, Crossrail and Heathrow access offset the negative impact of additional journey
time for HS2 and GWML passengers to/from London;
Revenue levels are however reduced when Iver (Through) is included with Euston only. The
net revenue loss is driven by losses in demand on more local GWML journeys (represented
in PS), reflecting the deterrent effect of the additional in-vehicle time for trips to London
associated with the additional stop at Iver. For the strategic trips represented in PLD the net
effect on revenue is slightly positive, in line with the increase in demand;
The benefits associated with the more westerly location of the GWML interchange mean that
Iver performs better as a second London interchange than OOC;
Providing Iver (Through) in addition to Euston and OOC reduces the PVB and revenues
generated by HS2 for both the Day 1C and Y network scenarios. This reflects the fact that
OOC provides much of the functionality provided by the Iver station (in particular in terms of
connection to GWML). The benefits of a more westerly GWML-HS2 interchange and better
access to Heathrow alone are therefore not sufficient to offset the additional journey time
incurred by the core HS2 market to/from London as a result of the extra station at Iver along;
Assuming “best case” highway accessibility to Iver improves the impact of the station on the
PVB and revenue but the improvement is still insufficient to suggest that adding Iver would
improve the HS2 BCR over a Euston plus OOC scenario; and
A Through option at Iver performs better than a Loop option in terms of PVB in the scenarios
tested (although the impact on revenue is less clear) because the additional benefits of
improved GWML and Crossrail connectivity provided by the Through option outweigh the
additional disbenefit of increased in-vehicle time for passengers to and from London.

/5082342 WP1 - Analysis of London
Interchange_MainRep_issued 050511.docx
44
8. Examining the Case for a HS2 “on-site”
Heathrow Station at T123
8.1 Introduction
8.1.1 Overview
This section considers the case for including an HS2 „On-Site‟ Heathrow station at T123
Three options have been considered:
A Through station at which all HS2 services call (increasing in-vehicle times to Euston by 7
minutes);
A Loop station at which a limited number HS2 services call (increasing in-vehicle times to
Euston for affected services by 9 minutes, whilst times for the other services remain
unchanged); and
A Spur station at which a limited number of HS2 services call and terminate.
Analysis of the performance of T123 as an alternative or addition to OOC was undertaken for both
the Through and Loop options. However, to simplify the discussion, Sections 8.2 to 8.4 below
focus on the Loop option which performed most strongly in each case (generating greater PVB
and revenue levels).
Section 8.5 then summarises the relative performance of the Through and Loop options across
the scenarios, explaining the key factors underlying the difference in performance between the
scenarios. Finally Section 8.6 assesses the comparative performance of Loop and Spur options
for given service specifications. Supporting data is provided in Appendices I to L.
8.1.2 Impact of T123 Station
A station at T123 provides on site access to Heathrow as well as connections into London via
Crossrail, the Piccadilly line and bus services. The bus network also provides connections to
areas in the south east and east of England such as Slough and St Albans.
In addition to providing access for Heathrow passengers, T123 therefore provides an alternative
access to areas of London, alleviating the pressure on Euston in the process and provides some
limited expansion of the potential market in the south east and east of England accessible through
public transport connections.
However, the benefits provided by the station are achieved at the expense of additional in-vehicle
times for passengers to Euston (and OOC where relevant) for all services stopping at Heathrow.
The following sections discuss the net effect of the benefits and disbenefits described when a
T123 station is included in a scenario with stations at:
Euston only (i.e. without OOC), or
Both Euston and OOC.
Analysis is also presented on
The extent to which the conclusions drawn on the impact of a T123 station would vary if the
Airtrack scheme to access Heathrow was assumed to be in place;
The relative performance of Through and Loop options; and
The relative performance of Spur and Loop options under different specifications.

/5082342 WP1 - Analysis of London
Interchange_MainRep_issued 050511.docx
45
8.2 T123 (Loop) as an additional interchange to
Euston (Day 1C)
8.2.1 Impact of T123 (Loop)
This section presents the case for providing a second London HS2 interchange at Heathrow T123
(rather than OOC) in comparison to a scenario where only a single London station is provided at
Euston, for a Day 1C network.
Tables 8.1 and 8.2 summarise the performance of the scenario with Euston and a T123 (Loop)
station alongside Euston only and the central Day 1C scenario where OOC rather than T123 is the
second interchange station.
Table 8.1 – Station Patronage, Eus+T123 (Loop) vs Eus+OOC vs Euston Only
(Day 1C, Daily (16hr) HS2 inbound alighting passengers, 2033)
Station (% Share) Euston Only Eus + OOC Eus+T123 (Loop)
Heathrow (T123) 3,600 (5%)
Old Oak Common 27,100 (38%)
Euston 66,700 (100%) 43,500 (62%) 63,300 (95%)
Total Daily HS2 PAX Inbound to London
66,700 70,600 66,900
Table 8.2 – Rail Benefits and Revenues, Eus+T123 (Loop) vs Eus+OOC vs Euston Only
(Day 1C, 60 year appraisal (2026-2085), 2009 prices/values)
Benefits and Revenue
Euston Only
[A]
Eus+OOC
[B]
Eus+T123 (Loop)
[C]
Difference from Eus
Only
[C-A]
Difference from Eus +
OOC
[C-B]
PVB £22.3bn £22.3bn £22.1bn £-0.2bn £-0.3bn
Revenue PV (Indirect Tax)*
£13.2bn (£-1.3bn)
£13.0bn (£-1.3bn)
£13.1bn (£-1.3bn)
£-0.2bn (£0.0bn)
£0.1bn (£0.0bn)
*Revenue is included in the estimate of PVC for each scenario. Indirect tax effects also contribute to the PVC and are
presented, although minor, to enable a BCR to be calculated from results in table, along with capital/operating costs
8.2.2 Comparison against Euston Only
The tables show that, when added to a Euston only scenario, The benefits of T123 (Loop) in terms
of improved accessibility to west London and the south east are slightly outweighed by the
disbenefits of additional in-vehicle time for HS2 Euston passengers.
The addition of a Loop station at T123 leads to:
A decrease in Present Value of Benefits (PVB) of £0.2bn and in revenue generated of £0.2bn
(2009 prices/values); and

/5082342 WP1 - Analysis of London
Interchange_MainRep_issued 050511.docx
46
A very slight net increase in patronage (of 200 inbound passengers per day) with 5% of the
total alighting at T123.
More detailed comparison of the Euston only and Eus+T123 (Loop) scenarios by geographical
market and benefit component (shown in detail in Appendix I1) confirms that the overall slight
changes in patronage and benefits are the net impact of:
Decreases in demand and benefit for the markets to London and beyond (experiencing
increased in-vehicle time); and
Increases in demand and benefit for those markets to Heathrow, west London and the south
east benefiting from improved connectivity via direct access, bus services, Crossrail or the
Piccadilly line.
8.2.3 Comparison against Eus+OOC
Compared against a Euston only scenario, adding a station at T123 has a slightly negative impact
in terms of revenue and benefits. Tables 8.1 and 8.2 also show it performs slightly less well than
OOC as a second station in terms of benefit and trip generation (although slightly better in terms
of revenue generation). In summary:
38% of passengers alight at OOC (compared to 5% at T123); and
Eus+OOC generates an additional £0.3bn of benefits relative to Eus+T123 but £0.1bn less of
revenue (PVB 2009 prices/values).
OOC generates greater benefits overall as it provides interchange to GWML and provides better
connectivity to London (connecting to a higher frequency Crossrail service closer to London).
However, it also generates greater disbenefits in terms of additional journey time for all trips to
central London. The overall result of the benefits and disbenefits is a very small net benefit. The
net impact of T123 (Loop) is comprised of the balance between smaller scale benefits (more direct
access to Heathrow and onwards bus connections to the south east and east) and smaller
disbenefits (increased journey times to London for one third of trains). The net effect is slightly
more negative than that for OOC.
OOC generates slightly lower revenue levels because the station‟s benefits are particularly for
trips to/from the western corridor, reducing the proportion of new trips on the highest fare routes
into central London.
8.2.4 Summary of Euston + T123 (Loop)
The addition of T123 (Loop) to a Euston only scenario produces a decrease in benefits and
revenue generated by HS2 (alongside a very slight increase in demand). Greater accessibility to
London and the south east brings some benefit but the increased journey time for trips to central
London offsets this. The option‟s performance as a second London interchange is therefore
weaker than the alternative of OOC.

/5082342 WP1 - Analysis of London
Interchange_MainRep_issued 050511.docx
47
8.3 T123 (Loop) as an additional interchange to
Euston and OOC (Day 1C and Y)
8.3.1.1 Introduction
The analysis above has shown that there is not a case in demand or economic terms for an HS2
T123 station as an alternative to OOC (although revenue generation is slightly greater). This
section therefore examines the impact on demand, economic benefits and revenue forecasts of
providing a T123 HS2 station in addition to a station at OOC.
The analysis presented below is again for a Loop option as it performed more strongly than the
Through option in this scenario (as discussed in section 8.5).
Analysis has been undertaken for both the Day 1C and Y networks.
8.3.1.2 Impact of T123 Loop
Tables 8.3 and 8.4 summarise the performance of a scenario with Euston, OOC and a T123
(Loop) stations alongside the central scenario of Euston and OOC for the Day 1C and Y Network
scenarios.
Table 8.3 – Station Patronage – Eus + OOC+T123(Loop) vs Euston + OOC
(Day 1C and Y Network, Daily (16hr) HS2 inbound alighting passengers, 2033)
Day 1C Y Network
Station (% Share) Eus + OOC Eus + OOC + T123 (Loop)
Eus+OOC Eus + OOC + T123 (Loop)
T123 (Loop) 3,000 (4%) 6,000 (5%)
Old Oak Common 27,100 (38%) 24,700 (35%) 52,400 (40%) 47,600 (38%)
Euston 43,500 (62%) 41,900 (60%) 77,300 (60%) 72,900 (58%)
Total Daily HS2 PAX Inbound to London
70,600 69,600 129,700 126,500
Table 8.4 - Rail Benefits and Revenues – Eus+OOC+T123 (Loop) vs Euston + OOC
(Day 1C and Y Network, 60 year appraisal (2026-2085), 2009 prices/values)
Day 1C Y Network
Benefits and Revenue
Eus + OOC
Eus + OOC + T123 (Loop)
Change Eus+ OOC
Eus + OOC + T123 (Loop)
Change
PVB £22.3bn £21.8bn £-0.6bn £48.2bn £44.9bn £-3.2bn
Revenue PV (Indirect Tax)*
£13.0bn (£-1.3bn)
£12.8bn (£-1.3bn)
£-0.1bn (£0.0bn)
£30.2bn (£-3.0bn)
£28.5bn (£-2.8bn)
£-1.7bn (£0.2bn)
*Revenue is included in the estimate of PVC for each scenario. Indirect tax effects also contribute to the PVC and are
presented, although minor, to enable a BCR to be calculated from results in table, along with capital/operating costs

/5082342 WP1 - Analysis of London
Interchange_MainRep_issued 050511.docx
48
The tables show that, when added to a Euston+OOC scenario, T123‟s benefits in terms of
improved connectivity to the west of London and areas of the south east/east served by Heathrow
public transport are again outweighed by the disbenefits of additional in-vehicle time for HS2
Euston passengers.
The addition of the station generates:
A net decrease in patronage (of 1,000 inbound passengers to London per day in Day 1C,
3,200 in the Y scenario). T123 abstracts a small proportion of demand (<5%) and total OOC
+ T123 demand is only slightly greater than OOC alone; and
A decrease in the Present Value of Benefits (PVB) of £0.6bn and in revenue generated of
£0.1bn (2009 prices /values) for Day 1C. The equivalent figures for the Y network are
decreases of £3.2bn and £1.7bn.
The disbenefits of T123 outweigh its benefits more clearly when included in addition to Eus+OOC
than when included with Euston only because, whilst the additional journey time for journeys to
Euston remains largely unchanged whether or not OOC station is served, the benefits generated
by T123 are smaller if OOC is also assumed to be in place.
The benefits associated with T123 described in the previous section largely result from improved
accessibility to areas in west London and further west, through connections to Crossrail, the
Piccadilly line and bus services. OOC also provides access to many of the same areas,
particularly through Crossrail. Although the access is generally more limited, it means that when
T123 is introduced in addition to OOC, the incremental benefits of the connections provided are
smaller than when the station is introduced in addition to Euston alone.
More detailed analysis of the difference in demand, revenue and benefits for a selection of key
HS2 markets (shown in Appendix I) confirms that the net change in demand and benefits is the
result of a trade off between:
An increase in in-vehicle time and Local Leg benefits on journeys between the south
east/Western corridor and the West Midlands and North West – representing areas that are
more effectively served by the public transport connections from T123 than those from OOC;
and
A more significant adverse impact on markets to/from central London which accounts for a
greater proportion of overall benefits and is the result of additional in-vehicle time required to
serve the extra station and some minor additional crowding effects on the two-thirds of
services not serving Heathrow.
The Y network impacts follow comparable patterns (shown in Appendix I3). However, they do also
reflect the wider market served by the wider HS2 network and its connections to the classic rail
network. For instance, benefits and revenues to/from the East Midlands from/to Heathrow and the
Western corridor are evident. As in the Day 1C network, these areas of benefit and revenue
increase are outweighed by a more significant adverse impact on trips to/from central London
from the wider market served by the Y network.

/5082342 WP1 - Analysis of London
Interchange_MainRep_issued 050511.docx
49
8.4 Sensitivity to assuming Airtrack has been
implemented on forecasts for T123 (Loop) as an
additional interchange to Euston and OOC (Day
1C and Y)
8.4.1 Overview
The central case analysis above shows that there is no demand, benefit or revenue case for
introducing T123 station in addition to Euston and OOC. However, the central case does not
include the Airtrack scheme in the Base and Test Case scenarios.
The proposed Airtrack rail scheme will enhance connectivity to Heathrow (T123 rather than Iver)
from south west London, Surrey and Berkshire. Its presence would therefore increase the size of
the market with good access to HS2 at Heathrow and could potentially alter the case for including
a Heathrow station in HS2 scenarios.
This section therefore assesses the extent to which assuming the presence of the Airtrack
scheme in the Base Case and Test Case would alter the conclusions drawn in Section 8.3 on the
business case for including a station at T123 in addition to OOC. Further detail is provided in
Appendix J.
8.4.2 Impact of Airtrack
8.4.2.1 Overview
Tables 8.5 and 8.6 compare the performance of a scenario with Euston, OOC and T123 (Loop)
station with Eus+OOC (both including Airtrack) for the Day 1C and Y Network scenarios.
Table 8.5 – Station Patronage – Eus+OOC+T123 vs Eus+OOC
(Day 1C and Y Network with Airtrack, Daily (16hr) HS2 inbound alighting passengers, 2033)
Day 1C Y Network
Eus+OOC Eus + OOC + T123 (Loop)
Eus + OOC Eus + OOC + T123 (Loop)
T123 (Loop) 3,900 (6%) 9,000 (7%)
Old Oak Common 27,100 (38%) 24,500 (35%) 52,300 (40%) 46,500 (37%)
Euston 43,500 (62%) 41,500 (59%) 77,200 (60%) 71,200 (56%)
Total Daily HS2 PAX Inbound to London
70,600 69,800 129,400 126,700

/5082342 WP1 - Analysis of London
Interchange_MainRep_issued 050511.docx
50
Table 8.6 - Rail Benefits and Revenues – Eus+OOC+T123 (Loop) vs Euston + OOC
(Day 1C and Y network with Airtrack, 60 year appraisal (2026-2085), 2009 prices/values)
Day 1C Y Network
Benefits and Revenue
Eus + OOC
Eus + OOC + T123 (Loop)
Change Eus+ OOC
Eus + OOC + T123 (Loop)
Change
PVB £22.6bn £21.9bn £-0.7bn £48.1bn £45.2bn £-2.9bn
Revenue PV (Indirect Tax)*
£13.1bn (£-1.3bn)
£13.0bn (£-1.3bn)
£-0.1bn (£0.0bn)
£30.1bn (£-2.9bn)
£28.6bn (£-2.8bn)
£-1.4bn (£0.1bn)
*Revenue is included in the estimate of PVC for each scenario. Indirect tax effects also contribute to the PVC and are
presented, although minor, to enable a BCR to be calculated from results in table, along with capital/operating costs
In both scenarios the presence of Airtrack improves the impact of including a T123 HS2 station in
addition to OOC relative to the central case presented in Section 8.3 (Table 8.4). This
improvement is evident in smaller reductions relative to the Eus+OOC in:
Patronage – the number of passengers using T123 increases from 3000 to nearly 4000 with
Airtrack in Day 1C and from 6000 to 9000 in the Y network, reducing the net loss of
patronage by about 200 daily inbound passengers in each case; and
Benefits and revenue – the reduction in revenue between Eus + OOC and Eus + OOC +
T123 (Loop) is approximately £0.1 bn less in the Day 1C and Y network scenarios and PVB
reduction is £0.4bn less for the Y network and broadly similar for Day 1C .
Detailed analysis (shown in Appendix J) of demand and benefit changes between Eus+OOC and
Eus+OOC+T123 (Loop) (both with Airtrack) by key market confirm that including T123 with
Airtrack still causes large disbenefits on markets to central London due to increased in-vehicle
time caused by the additional stop. However, the offsetting benefits for markets to and from the
Western corridor/south east area are slightly larger in the scenario with Airtrack than the scenario
without (shown in Section 8.3). This reflects the additional travel time savings experienced by
passengers able to use Airtrack to access HS2 at Heathrow.
8.4.3 Impact on Conclusions on the Case for T123
Assuming that the Airtrack scheme is in place does slightly improve the impact of including T123
in addition to Eus+OOC. However, it does not change the conclusions drawn from the central
case analysis in Section 8.3 that adding the station has a negative impact on the business case
for both the Day 1C and Y network scenarios, reducing PVB and revenue (and increasing costs
although these are not addressed in this analysis).
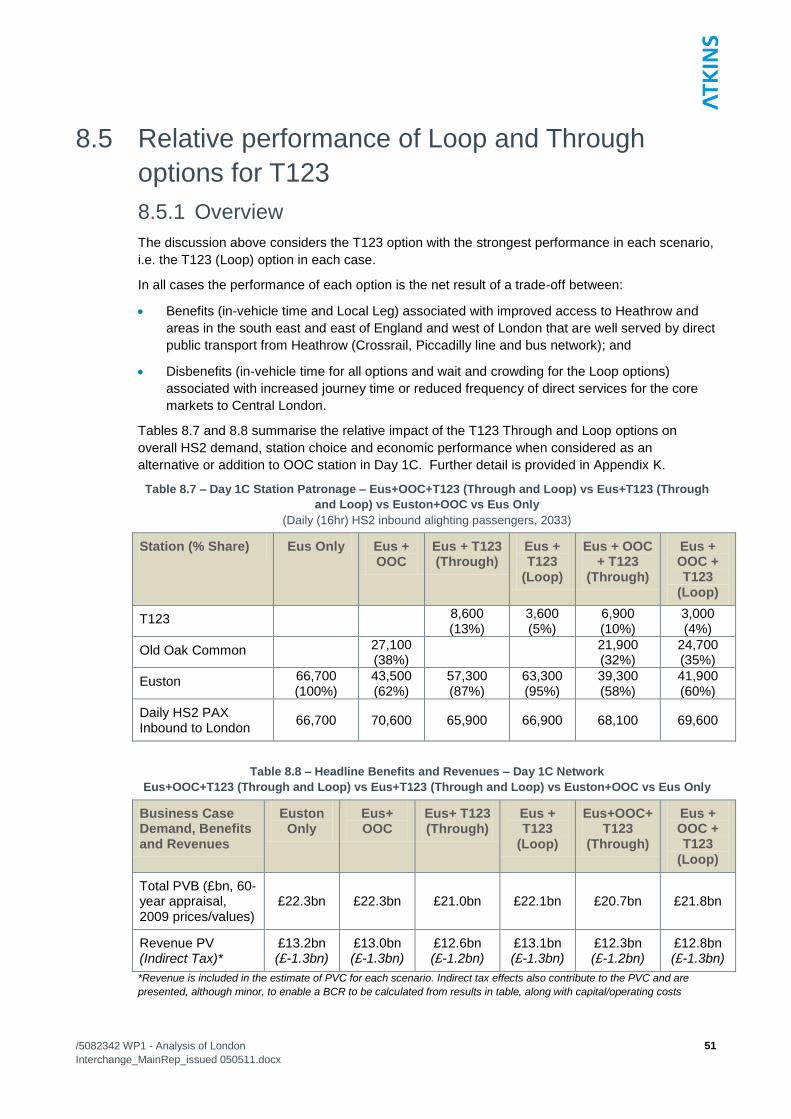
/5082342 WP1 - Analysis of London
Interchange_MainRep_issued 050511.docx
51
8.5 Relative performance of Loop and Through
options for T123
8.5.1 Overview
The discussion above considers the T123 option with the strongest performance in each scenario,
i.e. the T123 (Loop) option in each case.
In all cases the performance of each option is the net result of a trade-off between:
Benefits (in-vehicle time and Local Leg) associated with improved access to Heathrow and
areas in the south east and east of England and west of London that are well served by direct
public transport from Heathrow (Crossrail, Piccadilly line and bus network); and
Disbenefits (in-vehicle time for all options and wait and crowding for the Loop options)
associated with increased journey time or reduced frequency of direct services for the core
markets to Central London.
Tables 8.7 and 8.8 summarise the relative impact of the T123 Through and Loop options on
overall HS2 demand, station choice and economic performance when considered as an
alternative or addition to OOC station in Day 1C. Further detail is provided in Appendix K.
Table 8.7 – Day 1C Station Patronage – Eus+OOC+T123 (Through and Loop) vs Eus+T123 (Through
and Loop) vs Euston+OOC vs Eus Only
(Daily (16hr) HS2 inbound alighting passengers, 2033)
Station (% Share) Eus Only Eus + OOC
Eus + T123 (Through)
Eus + T123
(Loop)
Eus + OOC + T123
(Through)
Eus + OOC + T123
(Loop)
T123 8,600 (13%)
3,600 (5%)
6,900 (10%)
3,000 (4%)
Old Oak Common 27,100 (38%)
21,900 (32%)
24,700 (35%)
Euston 66,700 (100%)
43,500 (62%)
57,300 (87%)
63,300 (95%)
39,300 (58%)
41,900 (60%)
Daily HS2 PAX Inbound to London
66,700 70,600 65,900 66,900 68,100 69,600
Table 8.8 – Headline Benefits and Revenues – Day 1C Network
Eus+OOC+T123 (Through and Loop) vs Eus+T123 (Through and Loop) vs Euston+OOC vs Eus Only
Business Case Demand, Benefits and Revenues
Euston Only
Eus+ OOC
Eus+ T123 (Through)
Eus + T123
(Loop)
Eus+OOC+ T123
(Through)
Eus + OOC + T123
(Loop)
Total PVB (£bn, 60-year appraisal, 2009 prices/values)
£22.3bn £22.3bn £21.0bn £22.1bn £20.7bn £21.8bn
Revenue PV (Indirect Tax)*
£13.2bn (£-1.3bn)
£13.0bn (£-1.3bn)
£12.6bn (£-1.2bn)
£13.1bn (£-1.3bn)
£12.3bn (£-1.2bn)
£12.8bn (£-1.3bn)
*Revenue is included in the estimate of PVC for each scenario. Indirect tax effects also contribute to the PVC and are
presented, although minor, to enable a BCR to be calculated from results in table, along with capital/operating costs

/5082342 WP1 - Analysis of London
Interchange_MainRep_issued 050511.docx
52
8.5.2 Relative Performance
With T123 the Loop option performs better than the Through option in each case. In summary this
is because the disbenefits of the T123 options always outweigh the benefits. Therefore as the
Loop option has less overall impact than the Through option, it limits the scale of both disbenefits
and benefits and therefore reduces the size of the net disbenefits caused.
Appendix K shows that the same patterns of performance apply for Eus +OOC for the Y network
and for both the Day 1C and Y network if Airtrack is assumed to be in place, although the
presence of Airtrack does slightly reduce the differential between Through and Loop by increasing
the value of benefits of access from Heathrow.
8.6 T123 (Spur) vs T123 (Loop) (Day 1C and Y)
8.6.1 Introduction
The analysis presented above suggests that the Loop option shows the strongest performance
when including a T123 station in addition to a station at Eus and OOC. This is because the
markets that benefit from services calling at Heathrow are relatively limited and the benefits they
receive are achieved at the expense of disbenefits due to additional in-vehicle time for the large
market to central London.
The Loop option reduces the disbenefit for trips to central London (as only one-third of services
serve Heathrow) whilst retaining a proportion of the benefits of additional access at Heathrow.
Nonetheless, including an additional T123 station reduces the demand and benefits generated by
HS2.
This analysis leads to two further questions over the most effective way to provide HS2 services to
Heathrow, relating to:
The impact that reducing the number of services to Heathrow and minimising the impact on
trips to central London would have on the case for including services to T123; and
The proportion of benefits that would be accrued if Heathrow was served via a Spur rather
than a Loop with services terminating at Heathrow rather than continuing to London.
Three additional scenarios have been considered to address these issues:
A Eus+OOC+T123(Loop) test with reduced Heathrow service specification for Day 1C and Y:
- For Day 1C: 1tph which splits on route to form three trains serving ultimate destinations
of Birmingham, Liverpool and Manchester with a number of intermediate stations -
achieved without loss of train paths for the services into Central London;
- For Y Network: 2tph which each split on route to form three trains serving ultimate
destinations of Glasgow, Newcastle, Leeds, Manchester, Liverpool, Warrington and
Birmingham with a number of intermediate stations. Achieved at the expense of 1tph
from Manchester to Central London and 1tph from Birmingham.
A Eus+OOC+T123(Spur) test with identical service specification to the Loop test described
above but with trains terminating at Heathrow rather than carrying on to London; and
The Eus+OOC+T123 (Loop) test described above in Section 8.2, converted to a Spur test
(with the same service specification, i.e. one-third of services serving Heathrow) (Day 1C
only).
The results of each scenario are discussed below. However it should be noted that the differences
between scenarios (e.g. extension of a Spur scenario to become a Loop) are considerably smaller
than those between the majority of scenarios and are smaller than can be successfully modelled
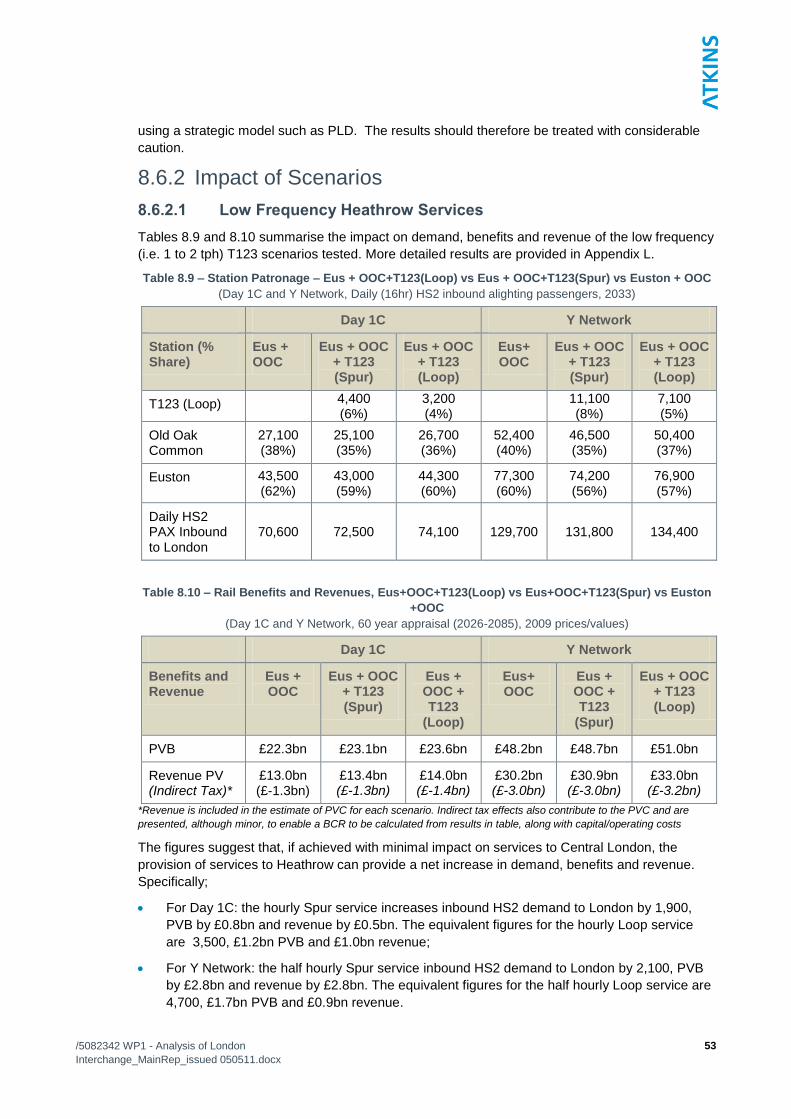
/5082342 WP1 - Analysis of London
Interchange_MainRep_issued 050511.docx
53
using a strategic model such as PLD. The results should therefore be treated with considerable
caution.
8.6.2 Impact of Scenarios
8.6.2.1 Low Frequency Heathrow Services
Tables 8.9 and 8.10 summarise the impact on demand, benefits and revenue of the low frequency
(i.e. 1 to 2 tph) T123 scenarios tested. More detailed results are provided in Appendix L.
Table 8.9 – Station Patronage – Eus + OOC+T123(Loop) vs Eus + OOC+T123(Spur) vs Euston + OOC
(Day 1C and Y Network, Daily (16hr) HS2 inbound alighting passengers, 2033)
Day 1C Y Network
Station (% Share)
Eus + OOC
Eus + OOC + T123 (Spur)
Eus + OOC + T123 (Loop)
Eus+ OOC
Eus + OOC + T123 (Spur)
Eus + OOC + T123 (Loop)
T123 (Loop) 4,400 (6%)
3,200 (4%)
11,100 (8%)
7,100 (5%)
Old Oak Common
27,100 (38%)
25,100 (35%)
26,700 (36%)
52,400 (40%)
46,500 (35%)
50,400 (37%)
Euston 43,500 (62%)
43,000 (59%)
44,300 (60%)
77,300 (60%)
74,200 (56%)
76,900 (57%)
Daily HS2 PAX Inbound to London
70,600 72,500 74,100 129,700 131,800 134,400
Table 8.10 – Rail Benefits and Revenues, Eus+OOC+T123(Loop) vs Eus+OOC+T123(Spur) vs Euston
+OOC
(Day 1C and Y Network, 60 year appraisal (2026-2085), 2009 prices/values)
Day 1C Y Network
Benefits and Revenue
Eus + OOC
Eus + OOC + T123 (Spur)
Eus + OOC + T123
(Loop)
Eus+ OOC
Eus + OOC + T123
(Spur)
Eus + OOC + T123 (Loop)
PVB £22.3bn £23.1bn £23.6bn £48.2bn £48.7bn £51.0bn
Revenue PV (Indirect Tax)*
£13.0bn (£-1.3bn)
£13.4bn (£-1.3bn)
£14.0bn (£-1.4bn)
£30.2bn (£-3.0bn)
£30.9bn (£-3.0bn)
£33.0bn (£-3.2bn)
*Revenue is included in the estimate of PVC for each scenario. Indirect tax effects also contribute to the PVC and are
presented, although minor, to enable a BCR to be calculated from results in table, along with capital/operating costs
The figures suggest that, if achieved with minimal impact on services to Central London, the
provision of services to Heathrow can provide a net increase in demand, benefits and revenue.
Specifically;
For Day 1C: the hourly Spur service increases inbound HS2 demand to London by 1,900,
PVB by £0.8bn and revenue by £0.5bn. The equivalent figures for the hourly Loop service
are 3,500, £1.2bn PVB and £1.0bn revenue;
For Y Network: the half hourly Spur service inbound HS2 demand to London by 2,100, PVB
by £2.8bn and revenue by £2.8bn. The equivalent figures for the half hourly Loop service are
4,700, £1.7bn PVB and £0.9bn revenue.

/5082342 WP1 - Analysis of London
Interchange_MainRep_issued 050511.docx
54
More detailed analysis of the change in demand by geographical market and the components of
benefit (summarised in Appendix L) suggests that the overall positive impact of the low frequency
Heathrow services is the net effect of:
In-vehicle time and Local Leg benefits for passengers to Heathrow or areas in the west of
London, south east and east of England that are well served by direct public transport
services from Heathrow (such as Slough and St Albans);
In-vehicle time, Local Leg and wait time benefits for passengers using stations that are
served by the Heathrow service and only one other HS2 service per hour, meaning that the
additional service doubles frequency and represents a considerable improvement in
provision, despite the relatively indirect route to central London. Runcorn, Wilmslow, Crewe
and Stafford fall in this category in Day 1C. The specification of the service to serve these
additional stations therefore plays an important role in generating a positive impact; and
In the Y network only, wait time and in-vehicle time losses for those passengers experiencing
a reduction in frequency in direct services to London as a result of the replaced train paths
between Birmingham and Manchester and London.
The benefits resulting from the service to Heathrow rather than London would be generated by
either the Spur or Loop configuration. The additional benefits of converting the Spur to a Loop are
therefore primarily limited to providing improved access to central London from those stations
(such as Wilmslow) for which the Heathrow train represents a second HS2 service per hour.
Passengers from stations served by the more frequent and more direct services will largely
continue to use those services whether or not the Heathrow service continues to London.
8.6.2.2 Higher Frequency Heathrow Services
Tables 8.11 and 8.12 summarise the impact in terms of demand, benefits and revenue of the
higher frequency T123 scenarios tested (i.e. one-third of services serving Heathrow, without
serving any additional stations). The Eus+OOC+T123 (Loop) scenario is the test discussed in
Section 8.3. More detailed results are presented in Appendix L.
Table 8.11 – Station Patronage – Eus + OOC+T123(Loop) vs Eus + OOC+T123(Spur) vs Euston + OOC
(Day 1C with Airtrack, Daily (16hr) HS2 inbound alighting passengers, 2033)
Benefits and Revenue Eus+OOC Eus + OOC + T123 (Spur)
Eus + OOC + T123 (Loop)
T123 4,700 (8%) 3,000 (4%)
Old Oak Common 27,100 (38%) 21,800 (36%) 24,700 (35%)
Euston 43,500 (62%) 34,700 (57%) 41,900 (60%)
Total Daily HS2 PAX Inbound to London
70,600 61,200 69,600
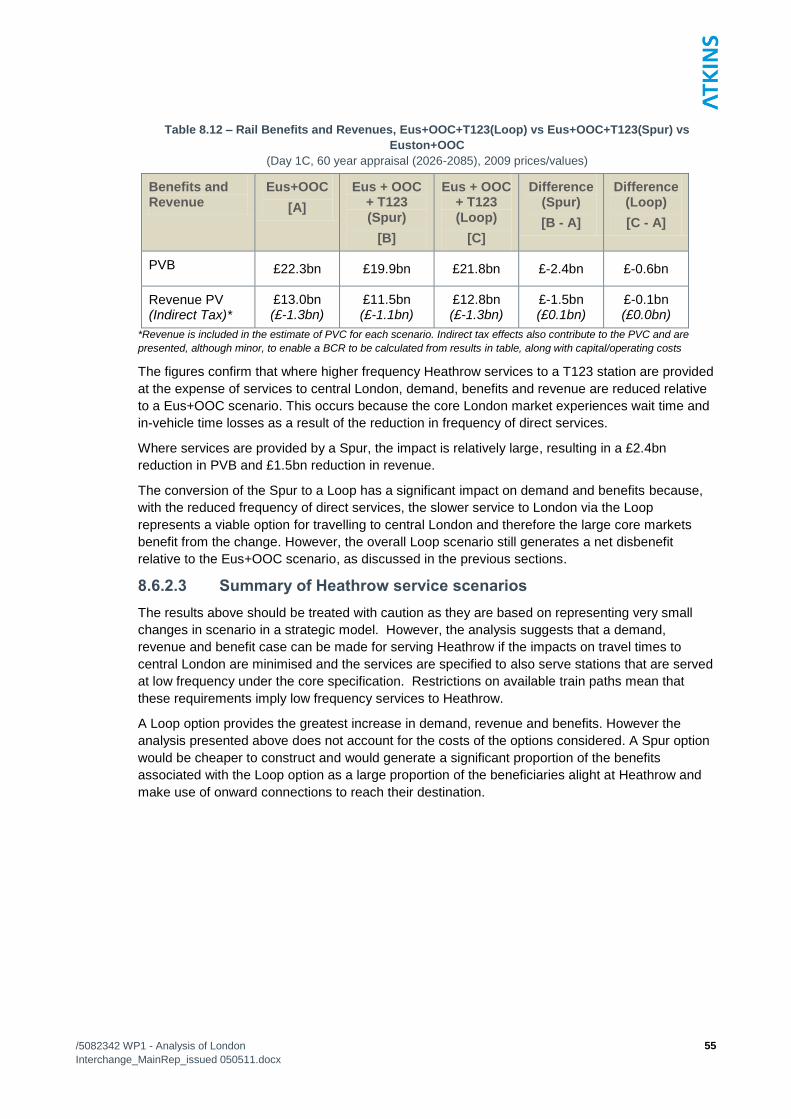
/5082342 WP1 - Analysis of London
Interchange_MainRep_issued 050511.docx
55
Table 8.12 – Rail Benefits and Revenues, Eus+OOC+T123(Loop) vs Eus+OOC+T123(Spur) vs
Euston+OOC
(Day 1C, 60 year appraisal (2026-2085), 2009 prices/values)
Benefits and Revenue
Eus+OOC
[A]
Eus + OOC + T123 (Spur)
[B]
Eus + OOC + T123 (Loop)
[C]
Difference (Spur)
[B - A]
Difference (Loop)
[C - A]
PVB £22.3bn £19.9bn £21.8bn £-2.4bn £-0.6bn
Revenue PV (Indirect Tax)*
£13.0bn (£-1.3bn)
£11.5bn (£-1.1bn)
£12.8bn (£-1.3bn)
£-1.5bn (£0.1bn)
£-0.1bn (£0.0bn)
*Revenue is included in the estimate of PVC for each scenario. Indirect tax effects also contribute to the PVC and are
presented, although minor, to enable a BCR to be calculated from results in table, along with capital/operating costs
The figures confirm that where higher frequency Heathrow services to a T123 station are provided
at the expense of services to central London, demand, benefits and revenue are reduced relative
to a Eus+OOC scenario. This occurs because the core London market experiences wait time and
in-vehicle time losses as a result of the reduction in frequency of direct services.
Where services are provided by a Spur, the impact is relatively large, resulting in a £2.4bn
reduction in PVB and £1.5bn reduction in revenue.
The conversion of the Spur to a Loop has a significant impact on demand and benefits because,
with the reduced frequency of direct services, the slower service to London via the Loop
represents a viable option for travelling to central London and therefore the large core markets
benefit from the change. However, the overall Loop scenario still generates a net disbenefit
relative to the Eus+OOC scenario, as discussed in the previous sections.
8.6.2.3 Summary of Heathrow service scenarios
The results above should be treated with caution as they are based on representing very small
changes in scenario in a strategic model. However, the analysis suggests that a demand,
revenue and benefit case can be made for serving Heathrow if the impacts on travel times to
central London are minimised and the services are specified to also serve stations that are served
at low frequency under the core specification. Restrictions on available train paths mean that
these requirements imply low frequency services to Heathrow.
A Loop option provides the greatest increase in demand, revenue and benefits. However the
analysis presented above does not account for the costs of the options considered. A Spur option
would be cheaper to construct and would generate a significant proportion of the benefits
associated with the Loop option as a large proportion of the beneficiaries alight at Heathrow and
make use of onward connections to reach their destination.

/5082342 WP1 - Analysis of London
Interchange_MainRep_issued 050511.docx
56
8.7 Conclusions on the case for a HS2 station at
Heathrow T123 The analysis presented above leads to the following conclusions on the case for a Heathrow
station at T123
Providing T123 (Loop) in addition to Euston-only results in a slight reduction in HS2 PVB and
revenue. This reflects the limited value of additional demand and benefits associated with
improved access to Crossrail, Heathrow and west London markets relative to the adverse
impact of additional journey time experienced by the significantly larger HS2 market to/from
Euston. T123 performs less well as a second interchange than OOC;
Providing T123 (Loop) in addition to Euston and OOC reduces the PVB and revenues
generated by HS2, reflecting the fact that OOC is more attractive for connection to Crossrail
and provides a GWML-HS2 interchange. Consequently the market for which using T123 is
more attractive is small, generating relatively few benefits which are offset by the disbenefit
the station causes to the much larger HS2 to/from London market;
Moving to a Y network further confirms the above conclusions, reflecting the increase in
markets and demand to/from London that would be adversely affected by introducing T123
(Loop) and the more limited scale of the markets that would benefit directly;
Assuming Airtrack is implemented marginally improves the performance of both the
Eus+OOC and Eus+OOC +T123(Loop) scenarios, but does not alter the conclusions with
respect to adding a station at T123 described above;
The Loop T123 option performs better than the Through option in each case. In summary this
is because it limits the impact of the option on the key market of journeys to central London
and therefore limits the net disbenefits caused; and
Serving T123 via a spur and an additional HS2 service, increases the overall HS2 PVB and
revenue by a small margin. However, a significant proportion of this benefit is associated with
the specification of the additional service to serve areas (such as Wilmslow) with limited HS2
service in the central case. Providing the equivalent service via T123 on a Loop instead of a
spur increases the additional benefits and revenues by 40-45%, reflecting the benefits of
linking the previously poorly served areas more directly to central London.

/5082342 WP1 - Analysis of London
Interchange_MainRep_issued 050511.docx
57
9. Overall Conclusions on Provision of HS2
London Interchange Stations The analysis presented in the previous sections on the case for including London interchange
stations in HS2 scenarios leads to the following key conclusions:
The findings should be treated with caution as the differences between scenarios are fairly
small (typically between 5% and 10% of total benefits) and often relate to relatively detailed
local issues that, by definition, are not well captured by the strategic modelling framework;
The small overall effects are also generally the net effect of considerably larger opposing
effects on different markets (i.e. larger benefits for some markets offsetting larger disbenefits
for others). In some cases a relatively small change in the scale of impacts for the markets
that either are losing or gaining as a result of the scenario could have a significant impact on
the overall net effect;
The forecasts based on the current representation of OOC and its impacts suggest that there
is not a financially positive case for the station as an addition to the Euston only scenario (or
Euston + T123 (Loop));
This is because the disbenefits of the time penalty associated with the extra station
stop at OOC for HS2 passengers to Euston and GWML passengers to Paddington
closely balance the benefits provided by the GWML and Crossrail interchange at the
station;
However, the central case representation of OOC within the PLD framework
necessarily relies on assumptions and limited data. Sensitivity tests undertaken
have confirmed that the case for the station is sensitive to the assumptions made.
Therefore there would be scope for optimisation of the representation of OOC to
improve the case for the station;
If HS2 services were to terminate at OOC rather than Euston, the current modelled
representation suggests that nearly 85% of benefits and 90% of revenues would still be
delivered for the Day 1C network;
Neither an off-site station at Iver nor on-site station at T123 to serve Heathrow would improve
the PVB and revenues generated by HS2 when compared to a Euston plus OOC scenario, if
the stations are served at the expense of direct services to London;
Although labelled as „Heathrow‟ stations, the majority of benefits (and disbenefits) generated
by both Iver and T123 are not related to travel directly to Heathrow. Instead the dominant
beneficial impact of both stations is to serve markets in the south east and east regions,
including the Western corridor. The markets served by the stations differ. Iver primarily
serves areas accessed by GWML and Crossrail whilst T123 serves areas in the south east
and east of England and west of London that are well served by bus/coach services from
Heathrow and the Piccadilly line and Crossrail;
If a HS2 station specifically to serve Heathrow is to be considered in addition to OOC, the
best off-site option at Iver (the Through option) outperforms the best on-site option at T123
(the Loop option). This is because of the coverage of the wider markets served as described
above. Unlike T123, Iver provides a GWML-HS2 interchange which provides journey time
improvements for passengers between the Western corridor and West Midlands/North West.
The equivalent benefits provided in the T123 scenario by public transport connections from
Heathrow are less significant; and

/5082342 WP1 - Analysis of London
Interchange_MainRep_issued 050511.docx
58
If an on-site location for a station at Heathrow is to be progressed, it needs to have minimal
impact on HS2 passengers travelling to/from London via Euston and OOC. A dedicated
additional HS2 service to T123 via a Spur causes a slight increase in the PV of benefits and
revenue for Day 1C and the Y Network scenarios. Extending the same service via a Loop to
enable its continuation to OOC and Euston further increases the additional benefit accrued.
However, these results in particular should be viewed as preliminary and indicative due to the
limitations associated with using a large strategic forecasting tool to determine the impact of
very small changes to the rail network and service provision (such as the differentiation
between a Loop and Spur option).