Embed Size (px)
Citation preview

Wrigley Brands
WM. WRIGLEY JR . COMPANY | 2002 ANNUAL REPORT

. . . woven into the fabric of

everyday life around the world

Financial Highlights 3
President’s Letter 4
Management’s Discussion and Analysis 14
Quarterly Data 20
Selected Financial Data 22
Report of Management and Report of Independent Auditors 24
Consolidated Statement of Earnings 25
Consolidated Balance Sheet 26
Consolidated Statement of Cash Flows 28
Consolidated Statement of Stockholders’ Equity 29
Accounting Policies and Notes toConsolidated Financial Statements 30
Elected Officers 39
Board of Directors 40
Stockholder Information 41
Corporate Facilities and Principal Associated Companies 43
Wrigley Brands 44
C O N T E N T S
Building Brands. For more than
a century, the Wrigley Company has been defined by
its brands. This iconic portfolio has brought fun, flavor
and quality to millions of consumers across the globe
for generations. Today, the personalities of Wrigley
brands have never been more vibrant. In the U.S.,
long-standing favorites including Wrigley’s Spearmint,
Doublemint and Juicy Fruit have been recreated with
longer-lasting taste and bold new packaging to ensure
that they will remain a vital part of the confectionery
landscape for generations to come. More recently
introduced Wrigley confections like Eclipse Flash
strips and Orbit Drops are delivering great benefits
and taste in forms completely new to Wrigley. These
non-gum brands help further define Wrigley as an
innovator in confections and an expert in delivering
what consumers want – whether its dental benefits,
fresh breath, throat soothing, or just great taste.

2002 2001
Net Sales $ 2,746,318 $ 2,401,419
Net Earnings $ 401,525 $ 362,986
– Per Share of Common Stock (basic and diluted) $ 1.78 $ 1.61
Dividends Paid $ 181,232 $ 167,922
– Per Share of Common Stock $ .805 $ .745
Additions to Property, Plant and Equipment $ 216,872 $ 181,760
Stockholders' Equity $ 1,522,576 $ 1,276,197
Return on Average Equity 28.7 % 30.1 %
Stockholders of Record at Close of Year 40,534 38,701
Average Shares Outstanding (000) 225,145 225,349
For additional historical financial data see page 22.
F I N A N C I A L H I G H L I G H T S
In thousands of dollars except per share amounts
3

It is during unsettled times like these that the clarity and
consistency of our vision, mission, values and strategies
are particularly important. Equally essential are the
unique talents of our team and their ability to work
together seamlessly to execute our plans in the global
marketplace. All of this enables us to stand out against
the competition and continue to build shareholder value.
There have been notable changes within the chewing
gum business and the broader confectionery industry
that will continue to impact the Wrigley Company.
Acceleration of sales growth for chewing gum in recent
years, largely due to our new product initiatives, has
attracted attention and spurred activity. New players are
entering our core business and various competitive
brands have been changing hands. Notably, Cadbury has
been adding chewing gum companies to its portfolio and
within the last year, acquired Dandy (a Danish gum
maker and our principal competitor in Russia) and
agreed to purchase Adams confectionery (our nearest
competitor in the United States).
Given the new field of play, it is more important than
ever to reiterate the commitment present at every level
of our organization to executing against our six core
strategic choices:
– Boosting our core business
– Expanding our business into new geographies and distribution channels
Two thousand and two was a very successful year for your Company, as we achieved
record levels of product shipments, sales and earnings worldwide. These gains were made
against a backdrop of economic and political uncertainty in a number of geographies as
well as a shifting competitive landscape within our industry.
T O O U R S T O C K H O L D E R S A N D T H E W O R L D W I D E W R I G L E Y T E A M :

– Diversifying close to home
– Maintaining a focus on innovation
– Delivering the highest quality at the lowest cost
– Growing and developing our people
Although all six remain critical, three played especially
significant roles in 2002 – diversification, core business
expansion and innovation – and so it is worthwhile to
discuss them in more detail and to understand their
importance for our continued success.
This past year, we executed against our strategic choice
to “diversify close to home” by pursuing a business
combination with Hershey Foods. While the Wrigley-
Hershey transaction did not take place, it is important to
share with you key considerations that speak to our
merger and acquisition philosophy and how these
principles will remain a steadfast component of our
approach to similar opportunities in the future.
Our motivation was pure and simple – it was a unique
opportunity that made good business sense on many
levels, and we had the talent and resources to fully
capitalize on it and deliver results. Our due diligence, our
offer and our plans for the integrated organization were
thorough, thoughtful, strategic, and extremely well-
executed. Our detailed analysis reinforced the tremendous
synergies, consumer growth opportunities and value
creation inherent in the envisioned combination of our
companies. Additionally, the many similarities in heritage,
culture and values, and the complementary nature of the
respective product lines, iconic brands and geographic
strengths, made this potential transaction very attractive.
As with any such bold business move, there was risk
involved; but measured risk-taking is one of the Wrigley
Company’s key values and is necessary to grow the business.
Going forward, we reaffirm our intention to pursue
confectionery acquisitions around the world, while
remaining dedicated to doing what is right for our
business and for our stakeholders. We will be driven
to create significant value, seeking a tight fit with our
core competencies, our strategic long-term plan and
our Company values and focusing on potential growth
synergies as opposed to just cost synergies.
The path to our successful future will never be set
in stone – we must remain flexible and continue to
explore multiple strategies and parallel initiatives to
give ourselves the best possibility of achieving robust,
generational growth. Were we disappointed that the
Wrigley-Hershey combination did not come together
as planned? Absolutely. Did it prevent us from making
substantial progress in 2002? Absolutely not. Even if the
right acquisition opportunity does not present itself, we
will move forward confident in the knowledge that our
core business is healthy and growing, as evidenced by the
significant organic growth generated by our internally
developed line extensions and new confectionery items.
Turning to our core business expansion, a key competi-
tive advantage for the Wrigley Company and central to
our success is our portfolio of iconic brands, trusted by
consumers around the world. Some have been around
for more than a century, while others have yet to reach
their first anniversary. Though different in form, taste
and function, they are all grounded in deep
consumer understanding and deliver quality, value
and meaningful consumer benefits. This past year saw
a significant increase in our already strong levels of
marketing investment in our brands – both new and old
– with impressive sales results.
In the U.S., three of our longest established brands –
Wrigley’s Spearmint®, Doublemint® and Juicy Fruit® – were
modified with improved formulas, updated packaging,
and new marketing campaigns intended to grab people’s
attention and satisfy the next generation of Wrigley
consumers. Change of this magnitude is often difficult,
5

and we recognize that it may be disconcerting for some
longstanding consumers; however, ensuring the vitality
of our brands requires their thoughtful evolution and
renewal – a delicate blending of past, present and future.
These initiatives – along with our support of the vigorous
growth of Orbit® and Eclipse® in the U.S., the continuing
expansion of our international Airwaves brand franchise,
and the introduction of a new product format with
X•Cite™ – all reaffirm our commitment to our first strategic
choice of “boosting the core chewing gum business.”
Finally, our focus on innovation – in our products, processes,
and systems – is providing us with essential building blocks
for future growth. In 2002, we
unveiled Eclipse Flash™ strips (fla-
vorful, dissolvable films for instant
fresh breath) and Orbit Drops™
(sugar-free lozenges). In addition
to being innovative, they also sup-
port our strategic choice to
diversify our business “close to
home.” Both of these confectionery
expansions build upon our
existing expertise in flavor, oral
and dental benefits, imaginative packaging, wide-
spread distribution, and effective advertising. These
products are still in their relative infancy, but customer
and consumer response to date has been very positive.
Our internal development initiatives continue to add to
our new product pipeline with innovative and attractive
confectionary offerings for 2003 and beyond.
All of these opportunities and accomplishments are very
exciting and bode well for Wrigley’s future, but they also
make our business more complex. Our strategic path
dictates the need for a robust technology infrastructure
in order to remain a leader in the marketplace. Over the
past year, we took some major steps forward in our
ongoing implementation of global enterprise software,
including the conversion of our operations in Western
Europe and the Americas. As of this time, over 60% of the
worldwide Wrigley organization is operating on a unified
systems platform. This could not have been achieved
without the tremendous effort and dedication of our
people across a number of functions and regions who are
single-minded in their determination to use technology
to add value to what we offer our consumers, customers
and associates.
The global integration of our operating and financial
systems makes us a more power-
ful manufacturer and an agile
partner to both our suppliers
and our customers. It will pro-
vide us with more complete,
higher quality data on a more
timely basis. We will be in a bet-
ter position to share data and
learnings with our supply chain
partners and to squeeze ineffi-
ciencies out of the system.
Easier access to consumer behavior insights will afford
us the ability to respond to their needs in even more
meaningful ways. Finally, our associates in manufactur-
ing will achieve even greater productivity thanks to infor-
mation and shared knowledge being placed at their fin-
gertips.
It is clear to me that 2002 was a milestone year for the
Wrigley Company, and I firmly believe that our team of
talented people, who bring their passion and commit-
ment to work with them everyday, deserve the credit and
our deepest gratitude for the impressive accomplish-
ments of the past twelve months. From Chicago to
Munich to Guangzhou – from the factory floor to the
6

satellite offices to the Wrigley Building – every member
of our team operates from the same foundation of ethics
and shared values, with an emphasis on treating those
with whom we interact with trust, dignity and respect.
This year has tested our mettle, and Wrigley associates
have answered the call with creativity, cooperation
and dedication.
I would also like to acknowledge the strength and
commitment of our Board of Directors. Their broad range
of experience and expertise are brought to bear on our
Company with enthusiasm and vigor. They take their
corporate governance responsibilities seriously, and
have made it their business to really know our business.
As a result, they provide valuable perspectives and keen
insights on growth opportunities and strategic direction,
while helping to preserve the Company’s values.
Our future holds many opportunities for success on a
variety of fronts, and we are committed to pursuing them
vigorously. With your continued support, we will maintain
our aggressive pace of operations and innovation to grow
and expand our business, remain top of mind with
consumers and customers, and create additional value
for all our stakeholders around the world.
Sincerely,
William Wrigley, Jr.
President and Chief Executive Officer
Wrigley Values. In our pursuit of
generational growth and prosperity for our stakeholders
the entire Wrigley organization is committed to acting
in a manner consistent with the shared values we
hold paramount:
– We treat each other with trust, dignity and respect.
– We create an environment where people from diverse
cultures and backgrounds work together effectively.
– We support and have the courage to take measured risk.
– We act with a sense of urgency without
sacrificing excellence.
– We foster a spirit of innovation in all areas of
our business.
– We strive for effective communication that results in
teamwork, shared knowledge and ideas.
– We make an extraordinary effort to attract, identify,
recruit and retain the very best person for every job.
– We pursue lifelong learning and personal development.
– We encourage individual leadership, responsibility
and accountability.
– We demand of ourselves high standards of
ethical behavior.
– We develop long-term relationships for mutual growth
and profitability.

R E G I O N A L S A L E S G R O W T HIndex Versus 1998
R E G I O N A L S A L E SAs a Percent of Total Company Sales
'98 '99 '00 '01 '02
100 102
109
121
137
Americas
8
42%

Building on the strength and success of the Eclipse brand
and its breath-freshening benefits, Eclipse Flash strips
were introduced in the U.S. in 2002 as the first non-gum
product under the Wrigley banner. In January 2003, a
new spearmint flavor was added to the Eclipse Flash
line and the Winterfresh brand was extended to include
Winterfresh Thin Ice™.
In addition to entering new confectionery categories, the
Americas continued to boost its core chewing gum business.
Doublemint, Wrigley’s Spearmint and Juicy Fruit were
improved with longer-lasting formulas and bold, new
graphics. The Orbit brand added a new spearmint offering
and continued to build distribution, sales and consumer
loyalty. At Amurol, the popular Bubble Tape brand
continued to do well in the U.S. and was modified for a
new appearance in Europe and Canada under the
Hubba Bubba brand.
Canada is also leveraging innovations with Juicy Fruit.
The brand is enjoying a surge in popularity in a sugarfree
pellet format and, this past year, new Juicy Fruit Red
added another dimension of great fruit taste.
Excellence in executing new product launches and brand
extensions has helped spur growth in the Americas region
and driven positive business results.
Wrigley’s chewing gum business in the Americas is vital and growing. In the U.S. and
Canada, new product offerings are delivering added value, while long-standing favorites
are enjoying rejuvenation. Amurol Confections continues to capture the imagination of
children, while in Latin America, Wrigley is exploring opportunities to reach consumers.
Higher shipment volumes and new products led to a 13% sales increase in the Americas region this year.
Breaking NewGround with
Wrigley Brands
9

'98 '99 '00 '01 '02
100 101 100
112
133
R E G I O N A L S A L E S G R O W T HIndex Versus 1998
R E G I O N A L S A L E SAs a Percent of Total Company Sales
EMEAI
10
43%

EMEAI is Wrigley’s largest geographic region including
Europe, the Middle East, Africa and India. Europe
represents the majority of the region, and Wrigley’s port-
folio of brands there continues to create excitement in the
confectionery category. The popular Airwaves brand
added a new Spicy Cocktail flavor this year, and the
Hubba Bubba brand expanded to include Hubba Bubba
Bubble Tape in Germany, the U.K. and France. While
these products helped boost Wrigley’s core business, new
product offerings supported diversification into other
confectionery areas. Orbit, one of the best selling gum
brands in the region, expanded to include Orbit Drops,
sugarfree lozenges available in four great flavors. The
Extra brand also evolved with the introduction of Extra
Thin Ice films, a new entry in the breath strip arena.
Also launched in 2002 was X•Cite, a new confectionery
experience with powerful mint taste. A multi-national
team worked together to create a consumer brand that
transcended geographic boundaries and then rolled the
product out across a large portion of Europe.
The expertise of country and regional teams working
together have driven increases in consumption and
expanded Wrigley’s business in target geographies.
Delivering great-tasting, high quality brands that cross borders and appeal to consumers
in approximately 100 different countries is no small challenge. The EMEAI team continues
to deliver positive results by creating brands and strategies that generate business across
the region and help to increase chewing gum consumption.
Building WrigleyBrands that
Cross Borders
The EMEAI region delivered strong volume gains and an 18% sales increase in 2002.
11

R E G I O N A L S A L E S G R O W T HIndex Versus 1998
R E G I O N A L S A L E SAs a Percent of Total Company Sales
'98 '99 '00 '01 '02
100
112
125
149
162
15%
Asia/Pacific
12

Asia’s large population and lower average chewing gum
consumption present opportunities for Wrigley. It also has
its challenges, with cultural and economic differences
across the countries that make up the region. Wrigley’s
team in Asia has increased consumption by delivering
products with tastes and benefits that meet the needs of
consumers and offering varying price points so as to
make Wrigley’s gum an affordable daily pleasure for all.
These products include Extra sugarfree gum in several
fruit flavors, and Airwaves and Cool Air brands with
vapor release formulas.
In the Pacific, consumers have enjoyed and been loyal
to Wrigley brands like P.K. for more than 80 years.
Sugarfree Extra, Wrigley’s number one brand in the region,
continues to deliver dental benefits and appeal to
consumers with its flavor variety. New products like X•Cite
and extensions of the Extra for Kids brand are creating
excitement in the chewing gum category. Keeping product
news fresh and quality high, the Pacific team has
continued to maintain a leadership position in this
important region despite aggressive competitive activity.
In both Asia and Pacific, local insights have led to
successful strategies and products that offer the right
balance of benefit, taste and value for their consumers.
Parts of Asia, like Taiwan and the Philippines, have been home to Wrigley products for
many years. Other countries in the region, particularly China, are still fairly new. The
Pacific region is one of Wrigley’s most well established international geographies. How
do you generate growth in these diverse environments? By tailoring brands to increase
consumption and Wrigley’s presence in everyday life.
This year’s sales growth of 9% in the combined Pacific and Asia regions reflects higher volume shipments, new product
contributions and growing consumption.
Tailoring WrigleyBrands to Increase
Consumption
13
M A N A G E M E N T ’ S D I S C U S S I O N A N D A N A L Y S I S O F R E S U L T S O F O P E R A T I O N S A N D F I N A N C I A L C O N D I T I O N
Dollar and share amounts in thousands except per share figures
In the first quarter 2002, the Company adopted the
accounting rules for Emerging Issues Task Force Issue
No. 00-14, “Accounting for Certain Sales Incentives” and
No. 00-25, “Vendor Income Statement Characterization of
Consideration Paid to a Reseller of the Vendors Products”
(“Issues”), as codified by Issue No. 01-09 “Accounting for
Consideration Given by a Vendor to a Customer or Reseller
of the Vendors Products.” In adopting these accounting
rules, the Company began reporting cash consideration
given in connection with certain consumer and trade sales
promotions such as coupon redemptions, in-store display
incentives, co-operative advertising and new product
introduction fees, as deductions from sales rather than
as selling, general and administrative expense. The
consumer and trade sales promotions applicable to these
Issues totaled $41,034, $28,227 and $19,592 for 2002, 2001
and 2000, respectively. Adoption of these accounting rules
had no impact on the Company’s financial position or
net earnings. The consumer and trade sales promotions
applicable to these Issues are reflected in net sales for
all periods presented in this discussion, the quarterly
and selected financial data, the financial statements
and related notes.
RESULTS OF OPERATIONS
Net Sales
Consolidated net sales for 2002 increased $344,899 or 14%
The Management’s Discussion and Analysis reviews the Company’s results of operations,
liquidity and capital resources, critical accounting policies and estimates, and certain
other matters. This discussion should be read in conjunction with the consolidated
financial statements and related notes contained in this Annual Report.
from 2001. Net sales for 2002 were favorably affected by
higher worldwide shipments and favorable product mix.
Higher worldwide shipments, including the introduction
of new products, increased net sales by 8%. New products
accounted for 22.9% of net sales in 2002. Favorable mix
from premium priced products increased net sales by 4%.
Translation of foreign currencies to a weaker U.S. dollar
increased reported net sales by approximately 2%.
Net sales for the Americas in 2002 increased 13%
compared to 2001. Favorable product mix increased net
sales 7%, due mainly to increased U.S. sales of Eclipse®
and Orbit® gum and the introduction of Eclipse® Flash
strips. Higher shipment volume in the U.S. and Canada,
as well as for Amurol Confections, increased net sales for
the Americas by 6%.
International 2002 net sales increased by 16% as a result of
growth in shipment volume, favorable product mix,
selected selling price changes and translation of foreign
sales to a weaker U.S. dollar. Unit volume increased net
sales by 8% over 2001, due primarily to growth in Russia,
China, France, the U.K., and numerous other international
markets. Net sales were also favorably impacted by new
product introductions in all regions. Favorable mix from
premium priced products both in Europe and Asia
increased International net sales by 3%, while selected
selling price changes primarily in Europe and Australia
14

contributed 1% to International net sales growth.
International net sales were increased by 4% as a result
of translation of foreign currencies, primarily in Europe, to
a weaker U.S. dollar.
Consolidated net sales for 2001 increased $275,305 or 13%
from 2000. Net sales for 2001 were favorably affected by
higher worldwide shipments, selected selling price
changes, and product mix. Higher worldwide shipments,
including the introduction of new products, increased net
sales by 10%. New products accounted for 19.6% of net
sales in 2001. Selected selling price changes increased net
sales by 3%, while favorable mix from premium priced
products increased net sales by 2%. Translation of foreign
currency sales to a stronger U.S. dollar reduced reported
net sales by approximately 2%.
Net sales for the Americas in 2001 increased 12% compared
to 2000. Higher shipment volume, primarily in the U.S.
and Latin American markets, as well as for Amurol
Confections, increased net sales for the Americas by 8%.
Favorable product mix increased net sales 3%, due mainly
to increased U.S. sales of Eclipse® and the introduction of
Orbit®. Net sales also increased 1% as a result of selected
selling price increases.
International 2001 net sales increased by 13% as a result of
growth in shipment volume, selected selling price changes
and favorable product mix, partially offset by translation of
foreign currencies to a stronger U.S. dollar. Unit volume
increased net sales by 11% over 2000, due primarily to
growth in China, Russia and numerous other international
markets. Net sales were also favorably impacted by new
product introductions across all regions. Selected selling
price changes increased International net sales by 4%,
while favorable mix from premium priced products both in
Europe and Asia contributed 2% to International net sales
growth. International net sales were reduced by 4% as a
result of translation of foreign currencies, primarily in
Europe and Australia, to a stronger U.S. dollar.
Cost of Sales and Gross Profit
In 2002, consolidated cost of sales increased $153,161, or
15% from 2001. Excluding the effect of foreign currency
translation, the cost of sales increase was approximately
14% from 2001. Higher worldwide shipments increased
cost of sales by 8%. Higher costs due to worldwide product
mix increased cost of sales by 5%. Slightly higher
worldwide product costs increased cost of sales by 1%.
Consolidated gross profit in 2002 was $1,596,103, an
increase of $191,738 or 14% from 2001. The consolidated
gross profit margin on net sales was 58.1% for 2002,
down 0.4 percentage points from the 2001 gross margin
of 58.5%, mainly due to slightly higher product costs.
In 2001, consolidated cost of sales increased $92,788,
or 10% from 2000. Excluding the effect of foreign currency
translation, the cost of sales increase was approximately
13% from 2000. Higher worldwide shipments increased
cost of sales by 10%. Higher costs due to worldwide
product mix increased cost of sales by 3%. Consolidated
gross profit in 2001 was $1,404,365, an increase of $182,517
or 15% from 2000. The consolidated gross profit margin
on net sales was 58.5% for 2001, up 1 percentage point
from the 2000 gross margin of 57.5%, mainly due to the
combination of higher selling prices, favorable product
mix and lower product costs.
Selling, General and Administrative Expenses
Consolidated 2002 selling, general and administrative
(SG&A) expenses were $1,011,029, up $120,020 or
13% from 2001. Excluding the impact of foreign
currency translation, consolidated selling, general and
administrative expenses were up 12% in 2002. Higher
brand support in the Americas, Europe and Pacific regions,
including spending behind new and improved products
increased SG&A by 5%. Higher selling and other marketing
expenses to support growth in the U.S., Russia, China and
other key markets increased SG&A by 3%. Finally, general
and administrative expenses increased SG&A by 4%.
15

The increase included higher investment in new technology
and research and development. Also contributing to the
increase were approximately $10,000 in costs connected
with the exploration of a business combination with
Hershey Foods Corporation.
Consolidated 2001 SG&A expenses increased $132,404 or
17% from 2000. Excluding the effects of foreign currency
translation, the increase was approximately 20% in
2001. Higher worldwide merchandising and consumer
promotion expenditures, including spending to support
new product launches, increased SG&A by 5%. Increases
in advertising spending, primarily in Europe and Asia,
increased SG&A by 3%. Selling and other marketing spend-
ing increases in the U.S., Russia, China, the U.K. and
other key markets increased SG&A by 5%. Finally, higher
worldwide general and administrative spending increased
SG&A by 4%.
As a percentage of consolidated net sales, SG&A expenses
were as follows:
2002 2001 2000
Advertising 13.2% 13.7% 14.5%
Merchandising & Promotion 4.8% 4.8% 3.5%
Total Brand Support 18.0% 18.5% 18.0%
Selling and Other Marketing 9.9% 10.0% 9.4%
General and Administrative 8.9% 8.6% 8.3%
36.8% 37.1% 35.7%
Investment Income
The Company earns investment income primarily from
the cash and cash equivalent and short-term investment
balances it maintains throughout the year. In 2002,
consolidated investment income decreased $9,635 from
2001. The decrease reflected lower worldwide yields in
2002 and interest income received from a U.S. tax refund
in the third quarter of 2001.
In 2001, consolidated investment income decreased $632
or 3% from 2000. The decrease was primarily due to lower
worldwide yields, partially offset by interest income from
a U.S. tax refund.
Other Expense
In 2002, other expense was $10,571, up $6,028 from 2001.
The increase in expense was driven primarily by foreign
currency transaction losses, mostly caused by a weaker
U.S. dollar.
In 2001, other expense was $4,543, an increase of $1,427
from 2000. The change was driven primarily by foreign
currency transaction losses in Europe.
Income Taxes
Income taxes in 2002 were $181,896, up $17,516 or 11%
from 2001. The result is due primarily to an increase in
pretax earnings of $56,055 or 11%. The consolidated
effective income tax rate in 2002 was 31.2%.
Income taxes in 2001 were $164,380, up $14,010 or 9% from
2000. The result is due primarily to an increase in pretax
earnings of $48,054 or 10%. The effective consolidated
income tax rate in 2001 was 31.2%.
Net Earnings
Consolidated net earnings in 2002 totaled $401,525,
up $38,539 or 11%. On a per share basis, net earnings
increased $.17 or 11% from 2001.
Consolidated net earnings in 2001 increased $34,044
or 10%. On a per share basis, net earnings increased
$.16 or 11% from 2000.
LIQUIDITY AND CAPITAL RESOURCES
Operating Cash Flow and Current Ratio
Net cash provided by operating activities in 2002 was
$374,435 compared with $390,491 in 2001 and $448,283
in 2000. The decrease from 2001 is primarily due to
pension and post-retirement plan contributions paid
which increased $75,800 from 2001 and higher working
capital requirements, mostly offset by increased earnings.
The decrease in 2001 compared to 2000 was mainly due
to higher working capital requirements as a result of
increased sales in 2001, combined with working capital
16
reductions in 2000. The Company had a current ratio
(current assets divided by current liabilities) in excess
of 2.6 to 1 at December 31, 2002 and in excess of 2.7 to 1
at December 31, 2001. The Company’s current ratio
has decreased as a result of higher pension and post-
retirement plan contributions in 2002.
Additions to Property, Plant and Equipment
Capital expenditures for 2002 were $216,872, an increase
of $35,112 from the 2001 capital expenditures of $181,760.
The increase was due primarily to spending in order to
increase worldwide manufacturing capacity, including
spending to support new product introductions and
expenditures on the Company’s global enterprise resource
planning (ERP) systems project. Capital expenditures for
2001 were $181,760, an increase of $56,692 from the 2000
capital expenditures of $125,068. The increase was due
primarily to spending in order to increase worldwide
manufacturing capacity and expenditures on the global
ERP systems project. Additions to property, plant and
equipment in 2003 are expected to be slightly lower than
2002 levels and are also planned to be funded from the
Company’s cash flow from operations.
Share Repurchases
In 2002, the Company repurchased 527 shares totaling
$27,759, including 483 shares totaling $25,504 under
the Board of Directors authorized Share Repurchase
Program and 44 shares totaling $2,255 under the
shareholder approved Management Incentive Plan (MIP).
At December 31, 2002, $89,258 remained unpurchased
under the Share Repurchase Program. In 2001, the
Company repurchased 744 shares totaling $36,432,
including repurchases under the Board of Directors
authorized Share Repurchase Program of 704 shares
totaling $34,652, net of proceeds received from the sale
of put options on Company stock. In 2001, the Company
also repurchased 40 shares totaling $1,780 under the
shareholder approved MIP.
Line of Credit
In September 2002, the Company renewed its $100 million,
unsecured, line of credit. There were no borrowings under
this line during 2002. Upon drawing on the line of credit,
the Company has the option to elect a fixed or floating
interest rate. The line of credit expires in September 2003.
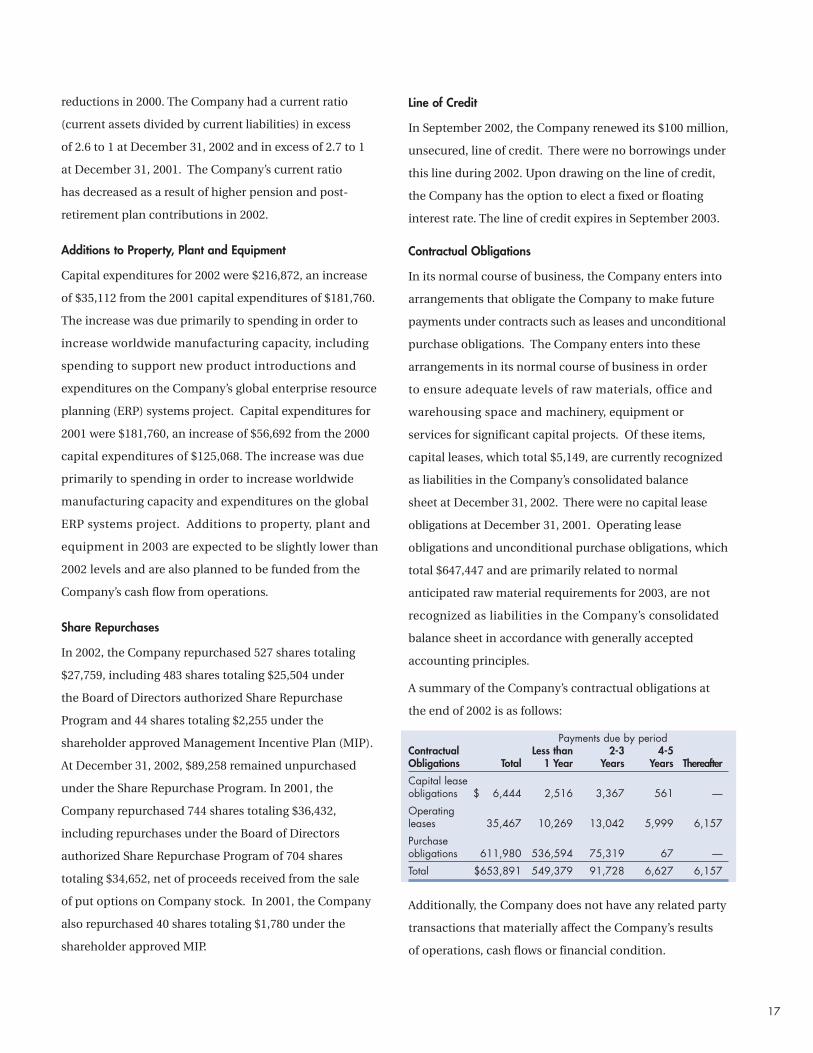
Contractual Obligations
In its normal course of business, the Company enters into
arrangements that obligate the Company to make future
payments under contracts such as leases and unconditional
purchase obligations. The Company enters into these
arrangements in its normal course of business in order
to ensure adequate levels of raw materials, office and
warehousing space and machinery, equipment or
services for significant capital projects. Of these items,
capital leases, which total $5,149, are currently recognized
as liabilities in the Company’s consolidated balance
sheet at December 31, 2002. There were no capital lease
obligations at December 31, 2001. Operating lease
obligations and unconditional purchase obligations, which
total $647,447 and are primarily related to normal
anticipated raw material requirements for 2003, are not
recognized as liabilities in the Company’s consolidated
balance sheet in accordance with generally accepted
accounting principles.
A summary of the Company’s contractual obligations at
the end of 2002 is as follows:
Payments due by periodContractual Less than 2-3 4-5Obligations Total 1 Year Years Years Thereafter
Capital lease obligations $ 6,444 2,516 3,367 561 —
Operating leases 35,467 10,269 13,042 5,999 6,157
Purchase obligations 611,980 536,594 75,319 67 —
Total $653,891 549,379 91,728 6,627 6,157
Additionally, the Company does not have any related party
transactions that materially affect the Company’s results
of operations, cash flows or financial condition.
17

OTHER MATTERS
Critical Accounting Policies and Estimates
The Company’s significant accounting policies are
discussed in the notes to the consolidated financial
statements. The application of certain of these policies
requires significant judgments or an estimation process
that can affect the results of operations, financial position
and cash flows of the Company, as well as the related
footnote disclosures. The Company bases its estimates
on historical experience and other assumptions that it
believes are reasonable. If actual amounts are ultimately
different from previous estimates, the revisions are
included in the Company’s results of operations for
the period in which the actual amounts become known.
The accounting policies and estimates with the greatest
potential to have a significant impact on the Company’s
operating results, financial position, cash flows and
footnote disclosures are as follows:
Allowance for Doubtful Accounts — In the normal course
of business, the Company extends credit to customers
that satisfy pre-defined credit criteria. An allowance for
doubtful accounts, which is reported as part of accounts
receivable, is determined through an analysis of the aging
of accounts receivable, assessments of collectibility based
on historical trends and an evaluation of current and
projected economic conditions at the balance sheet date.
Actual collections of accounts receivable could differ
from management’s estimates due to changes in future
economic or industry conditions or specific customers’
financial condition.
Valuation of Long-lived Assets — Long-lived assets,
primarily property, plant and equipment, are reviewed
for impairment as events or changes in circumstances
occur indicating that the amount of the asset reflected
in the Company’s balance sheet may not be recoverable.
An estimate of undiscounted cash flows produced by the
asset, or the appropriate group of assets, is compared to the
carrying value to determine whether impairment exists.
The estimates of future cash flows involve considerable
management judgment and are based upon assumptions
about expected future operating performance.
The actual cash flows could differ from management’s
estimates due to changes in business conditions,
operating performance, and economic conditions.
Pension and Other Post-Retirement Plan Benefits —
The Company sponsors pension and other post-retirement
plans in various forms covering substantially all employees
who meet eligibility requirements. Independent actuaries
perform the required calculation to determine pension
and other post-retirement plan expense, in accordance
with accounting principles generally accepted in the U.S.
Several statistical and other factors which attempt to
anticipate future events are used in calculating the
expense and liability related to the plans. These factors
include assumptions about the discount rate, expected
return on plan assets, rate of future employee
compensation increases and trends in healthcare costs.
In addition, the Company also uses subjective actuarial
assumptions such as withdrawal and mortality rates
to estimate these factors. The actuarial assumptions
used by the Company may differ from actual results due
to changing market and economic conditions, higher
or lower withdrawal rates or longer or shorter life spans
of participants. These differences may impact the
amount of pension and post-retirement liability and
expense recorded by the Company.
In 2003, the Company will decrease the long-term rate
of return assumption for its domestic plan assets from
9.25% to 8.75%. The company expects pension expenses
to increase by approximately $11,000 in 2003 as a result
of the change in rate of return assumption in 2003 and
a decrease in discount rates in 2002 for the domestic
and certain foreign pension plans.
Income Taxes — Deferred taxes are recognized for the
future tax effects of temporary differences between
financial and income tax reporting using tax rates in effect
for the years in which the differences are expected to
18

reverse. Federal income taxes are provided on that portion
of the income of foreign subsidiaries that is expected
to be remitted to the United States and be taxable. The
Company, along with third-party advisers, periodically
reviews assumptions and estimates of the Company’s
probable tax obligations using historical experience in tax
jurisdictions and informed judgments.
Euro Conversion
On January 1, 1999, the exchange rates of twelve countries
(Germany, France, the Netherlands, Austria, Italy, Spain,
Finland, Ireland, Belgium, Portugal, Greece and
Luxembourg) were fixed among one another and became
the currency of the euro. The currencies of the twelve
countries remained in circulation until early 2002. The
euro bills and coinage were introduced on January 1, 2002.
In conjunction with the conversion process to the euro,
the Company took steps to convert its information
technology systems to handle the new currency, prepared
for maintaining accounting, tax and other business
records in the new currency and evaluated the ability
of all significant vendors and customers to accurately
convert to the euro. The introduction and use of the
euro has not had a material effect on the Company’s
foreign operations, foreign exchange practices, or
hedging and cash management activities. Additionally,
the introduction of the euro currency did not have a
materially adverse impact on the Company’s consolidated
financial condition, cash flows or results of operations.
Market Risk
Inherent in the Company’s operations are certain risks
related to changes in foreign currency exchange rates,
interest rates, and the equity markets. Changes in these
factors could cause fluctuations in the Company’s net
earnings and cash flows. In the normal course of business,
the Company identifies these risks and mitigates their
financial impact through its corporate policies and hedging
activities. The Company’s hedging activities include the
use of derivative financial instruments. The Company
uses derivatives only where there is an underlying exposure
and does not use them for trading or speculative purposes.
The counter parties to the hedging activities are highly
rated financial institutions. Additional information
regarding the Company’s use of derivative financial
instruments is included in the notes to the consolidated
financial statements. The Company has determined that
movements in market values of financial instruments used
to mitigate identified risks are not expected to have a
material impact on future earnings, cash flows, or reported
fair values.
Forward-Looking Statements
Statements contained in this report may be considered
to be forward-looking statements. The Private Securities
Litigation Reform Act of 1995 provides a safe harbor
for forward-looking statements. The Company wishes
to ensure that such statements are accompanied by
meaningful cautionary statements to comply with the
safe harbor under the Act. The Company notes that
a variety of factors could cause actual results to differ
materially from the anticipated results or expectations
expressed in these forward-looking statements.
Important factors that may influence the operations,
performance, development and results of the Company’s
business include global and local business and economic
conditions; currency exchange and interest rates; ingredient,
labor, and other operating costs; insufficient or under-
utilization of manufacturing capacity; destruction of all
or part of manufacturing facilities; labor strikes or unrest;
political or economic instability in local markets; war or
acts of terrorism; competition and other industry trends;
retention of preferred retail space; effectiveness of marketing
campaigns or new product introductions; consumer
preferences, spending patterns, and demographic trends;
legislation and governmental regulation; and accounting
policies and practices.
We caution the reader that the list of factors may not
be exhaustive. The Company undertakes no obligation
to update any forward-looking statement, whether as a
result of new information, future events, or otherwise.
19

C O N S O L I D A T E D R E S U L T S
Net Cost of Net Net EarningsSales Sales Earnings Per Share
2002
First Quarter $ 599,026 249,399 85,332 .38
Second Quarter 708,467 286,854 109,967 .49
Third Quarter 699,511 292,341 98,464 .44
Fourth Quarter 739,314 321,621 107,762 .48
Total $ 2,746,318 1,150,215 401,525 1.78
2001
First Quarter $ 556,212 228,395 81,530 .36
Second Quarter 617,640 251,096 100,033 .44
Third Quarter 589,611 247,448 91,507 .41
Fourth Quarter 637,956 270,115 89,916 .40
Total $ 2,401,419 997,054 362,986 1.61
Q U A R T E R L Y D A T A
In thousands of dollars except per share amounts
20

M A R K E T P R I C E S
Although there is no established public trading market for the Class B Common Stock, these shares are at all times convertible into
shares of Common Stock on a one-for-one basis and are entitled to identical dividend payments.
The Common Stock of the Company is listed and traded on the New York and Chicago Stock Exchanges. The table below presents
the high and low sales prices for the two most recent years on the New York Stock Exchange.
2002 2002 2001 2001
High Low High Low
First Quarter $ 56.90 49.89 48.44 42.94
Second Quarter 58.90 52.50 49.70 44.41
Third Quarter 56.84 44.21 52.00 46.55
Fourth Quarter 56.03 49.25 53.30 48.02
D I V I D E N D S
The following table indicates the quarterly breakdown of aggregate dividends declared per share of Common Stock and Class B
Common Stock for the two most recent years. Dividends declared in a quarter are paid in the following quarter.
2002 2001
First Quarter $ .205 .190
Second Quarter .205 .190
Third Quarter .205 .190
Fourth Quarter .205 .190
Total $ .820 .760
21

2002 2001 2000 1999
O P E R A T I N G D A T A
Net Sales $ 2,746,318 2,401,419 2,126,114 2,045,227
Cost of Sales 1,150,215 997,054 904,266 904,183
Income Taxes 181,896 164,380 150,370 136,247
Earnings before cumulative effect of accounting changes in 1992* 401,525 362,986 328,942 308,183
Per Share of Common Stock (basic and diluted) 1.78 1.61 1.45 1.33
Net Earnings 401,525 362,986 328,942 308,183
Per Share of Common Stock (basic and diluted) 1.78 1.61 1.45 1.33
Dividends Paid 181,232 167,922 159,138 153,812
Per Share of Common Stock .805 .745 .701 .664
As a Percent of Net Earnings 45 % 46 % 48 % 50 %
Dividends Declared Per Share of Common Stock .820 .760 .701 .740
Average Shares Outstanding 225,145 225,349 227,037 231,722
O T H E R F I N A N C I A L D A T A
Net Property, Plant and Equipment $ 836,110 684,379 607,034 559,140
Total Assets 2,108,296 1,777,793 1,574,740 1,547,745
Working Capital 620,205 581,519 540,505 551,921
Stockholders’ Equity 1,522,576 1,276,197 1,132,897 1,138,775
Return on Average Equity 28.7 % 30.1 % 29.0 % 26.8 %
Stockholders of Record at Close of Year 40,534 38,701 37,781 38,626
Employees at Close of Year 11,250 10,800 9,800 9,300
Market Price of Stock
High 58.90 53.30 48.31 50.31
Low 44.21 42.94 29.94 33.25
*(includes amounts related to factory closure — net gain of $6,763 or $.03 per share in 1998, and net costs of $2,145 or $.01 per share and $12,990 or $.06 per share in 1997 and 1996, respectively; and nonrecurring net gain on sale of Singapore property in 1994 of $24,766 or $.11 per share)
S E L E C T E D F I N A N C I A L D A T A
In thousands of dollars and shares except per share amounts, stockholders of record and employees
22

1998 1997 1996 1995 1994 1993 1992
1,990,286 1,923,963 1,835,987 1,754,931 1,596,551 1,428,504 1,286,921
894,988 892,751 859,414 820,478 737,239 653,687 606,263
136,378 122,614 128,840 126,492 122,746 103,944 83,730
304,501 271,626 230,272 223,739 230,533 174,891 148,573
1.31 1.17 .99 .96 .99 .75 .63
304,501 271,626 230,272 223,739 230,533 174,891 141,295
1.31 1.17 .99 .96 .99 .75 .60
150,835 135,680 118,308 111,401 104,694 87,344 72,511
.650 .585 .510 .480 .450 .375 .310
50 % 50 % 51 % 50 % 45 % 50 % 51 %
.655 .595 .510 .495 .470 .375 .315
231,928 231,928 231,966 232,132 232,716 233,022 234,110
520,090 430,474 388,149 347,491 289,420 239,868 222,137
1,520,855 1,343,126 1,233,543 1,099,219 978,834 815,324 711,372
624,546 571,857 511,272 458,683 413,414 343,132 299,149
1,157,032 985,379 897,431 796,852 688,470 575,182 498,935
28.4 % 28.9 % 27.2 % 30.1 % 36.5 % 32.6 % 29.4 %
38,052 36,587 34,951 28,959 24,078 18,567 14,546
9,200 8,200 7,800 7,300 7,000 6,700 6,400
52.16 41.03 31.44 27.00 26.94 23.06 19.94
35.47 27.28 24.19 21.44 19.06 14.75 11.06
23

M A N A G E M E N T ’ S R E P O R T O N R E S P O N S I B I L I T Y F O R F I N A N C I A L R E P O R T I N G
Management of the Wm. Wrigley Jr. Company is responsible for the preparation and integrity of the financial statements
and related information presented in this Annual Report. This responsibility is carried out through a system of internal
controls to ensure that assets are safeguarded, transactions are properly authorized, and financial records are accurate.
These controls include a comprehensive internal audit program, written financial policies and procedures, appropriate
division of responsibility, and careful selection and training of personnel. Written policies include a Code of Business
Conduct prescribing that all employees maintain the highest ethical and business standards.
Ernst & Young LLP has conducted an independent audit of the financial statements, and its report appears below.
The Board of Directors exercises its control responsibility through an Audit Committee composed entirely of independent
directors. The Audit Committee meets regularly to review accounting and control matters. Both Ernst & Young LLP and
the internal auditors have direct access to the Audit Committee and periodically meet privately with them.
WM. WRIGLEY JR. COMPANY
Chicago, Illinois
January 23, 2003
R E P O R T O F I N D E P E N D E N T A U D I T O R S
To the Stockholders and Board of Directors of the Wm. Wrigley Jr. Company:
We have audited the accompanying consolidated balance sheets of the Wm. Wrigley Jr. Company and associated
companies (the “Company”) at December 31, 2002 and 2001 and the related consolidated statements of earnings,
stockholders’ equity and cash flows for each of the three years in the period ended December 31, 2002. These financial
statements are the responsibility of the Company’s management. Our responsibility is to express an opinion on these
financial statements based on our audits.
We conducted our audits in accordance with auditing standards generally accepted in the United States. Those standards
require that we plan and perform the audit to obtain reasonable assurance about whether the financial statements are free
of material misstatement. An audit includes examining, on a test basis, evidence supporting the amounts and disclosures
in the financial statements. An audit also includes assessing the accounting principles used and significant estimates made
by management, as well as evaluating the overall financial statement presentation. We believe that our audits provide a
reasonable basis for our opinion.
In our opinion, the financial statements referred to above present fairly, in all material respects, the consolidated financial
position of the Company at December 31, 2002 and 2001, and the consolidated results of their operations and their cash
flows for each of the three years in the period ended December 31, 2002, in conformity with accounting principles
generally accepted in the United States.
ERNST & YOUNG LLP
Chicago, Illinois
January 23, 2003
24

2002 2001 2000
E A R N I N G S
Net sales $ 2,746,318 2,401,419 2,126,114
Cost of sales 1,150,215 997,054 904,266
Gross profit 1,596,103 1,404,365 1,221,848
Selling, general and administrative expense 1,011,029 891,009 758,605
Operating income 585,074 513,356 463,243
Investment income 8,918 18,553 19,185
Other expense (10,571) (4,543) (3,116)
Earnings before income taxes 583,421 527,366 479,312
Income taxes 181,896 164,380 150,370
Net earnings $ 401,525 362,986 328,942
P E R S H A R E A M O U N T S
Net earnings per share of Common Stock (basic and diluted) $ 1.78 1.61 1.45
Dividends paid per share of Common Stock .805 .745 .701
See accompanying accounting policies and notes.
C O N S O L I D A T E D S T A T E M E N T O F E A R N I N G S
In thousands of dollars except per share amounts
25

2002 2001
A S S E T S
Current assets:
Cash and cash equivalents $ 279,276 307,785
Short-term investments, at amortized cost 25,621 25,450
Accounts receivable
(less allowance for doubtful accounts: 2002-$5,850; 2001-$7,712) 312,919 239,885
Inventories:
Finished goods 88,583 75,693
Raw materials and supplies 232,613 203,288
321,196 278,981
Other current assets 47,720 46,896
Deferred income taxes - current 19,560 14,846
Total current assets 1,006,292 913,843
Marketable equity securities, at fair value 19,411 25,300
Deferred charges and other assets 213,483 124,666
Deferred income taxes - noncurrent 33,000 29,605
Property, plant and equipment, at cost:
Land 48,968 39,933
Buildings and building equipment 393,780 359,109
Machinery and equipment 1,049,001 857,054
1,491,749 1,256,096
Less accumulated depreciation 655,639 571,717
Net property, plant and equipment 836,110 684,379
T O T A L A S S E T S $ 2,108,296 1,777,793
C O N S O L I D A T E D B A L A N C E S H E E T
In thousands of dollars
26

2002 2001
L I A B I L I T I E S A N D S T O C K H O L D E R S ’ E Q U I T Y
Current liabilities:
Accounts payable $ 97,705 91,397
Accrued expenses 172,137 128,264
Dividends payable 46,137 42,741
Income and other taxes payable 66,893 68,467
Deferred income taxes — current 3,215 1,455
Total current liabilities 386,087 332,324
Deferred income taxes — noncurrent 70,589 46,430
Other noncurrent liabilities 129,044 122,842
Stockholders’ equity:
Preferred Stock — no par valueAuthorized: 20,000 sharesIssued: None
Common Stock — no par value
Common StockAuthorized: 400,000 sharesIssued: 2002 - 190,898 shares; 2001 - 189,800 shares 12,719 12,646
Class B Common Stock — convertibleAuthorized: 80,000 sharesIssued and outstanding:2002 - 41,543 shares; 2001 - 42,641 shares 2,777 2,850
Additional paid-in capital 4,209 1,153
Retained earnings 1,902,990 1,684,337
Common Stock in treasury, at cost(2002 - 7,385 shares; 2001 - 7,491 shares) (297,156) (289,799)
Accumulated other comprehensive income:
Foreign currency translation adjustment (112,303) (149,310)
Gain (loss) on derivative contracts (853) 46
Unrealized holding gains on marketable equity securities 10,193 14,274
(102,963) (134,990)
Total stockholders’ equity 1,522,576 1,276,197
T O T A L L I A B I L I T I E S A N D S T O C K H O L D E R S ’ E Q U I T Y $ 2,108,296 1,777,793
See accompanying accounting policies and notes.
In thousands of dollars and shares
27

2002 2001 2000
O P E R A T I N G A C T I V I T I E S
Net earnings $ 401,525 362,986 328,942
Adjustments to reconcile net earnings to net cash provided by operating activities:
Depreciation 85,568 68,326 57,880
Loss on sales of property, plant and equipment 1,014 2,910 778
(Increase) Decrease in:Accounts receivable (55,288) (53,162) (18,483)
Inventories (31,858) (29,487) (2,812)
Other current assets 1,304 (8,079) 199
Deferred charges and other assets (78,585) (15,852) 30,408
Increase (Decrease) in:Accounts payable 756 20,537 12,988
Accrued expenses 33,416 16,360 18,015
Income and other taxes payable (3,715) 9,565 14,670
Deferred income taxes 19,082 5,570 2,546
Other noncurrent liabilities 1,216 10,817 3,152
Net cash provided by operating activities 374,435 390,491 448,283
I N V E S T I N G A C T I V I T I E S
Additions to property, plant and equipment (216,872) (181,760) (125,068)
Proceeds from property retirements 5,017 2,376 1,128
Purchases of short-term investments (41,177) (24,448) (125,728)
Maturities of short-term investments 44,858 26,835 115,007
Net cash used in investing activities (208,174) (176,997) (134,661)
F I N A N C I N G A C T I V I T I E S
Dividends paid (181,232) (167,922) (159,138)
Common Stock purchased, net (16,402) (34,173) (131,765)
Net cash used in financing activities (197,634) (202,095) (290,903)
Effect of exchange rate changes on cash and cash equivalents 2,864 (4,213) (10,506)
Net increase (decrease) in cash and cash equivalents (28,509) 7,186 12,213
Cash and cash equivalents at beginning of year 307,785 300,599 288,386
Cash and cash equivalents at end of year $ 279,276 307,785 300,599
S U P P L E M E N T A L C A S H F L O W I N F O R M A T I O N
Income taxes paid $ 173,010 146,858 136,311
Interest paid $ 1,636 1,101 749
Interest and dividends received $ 8,974 18,570 19,243
See accompanying accounting policies and notes.
C O N S O L I D A T E D S T A T E M E N T O F C A S H F L O W S
In thousands of dollars
28

Common Class B Additional Common Other Stock-Shares Common Common Paid-in Retained Stock In Comprehensive holders’
Outstanding Stock Stock Capital Earnings Treasury Income Equity
B A L A N C E D E C E M B E R 3 1 , 1 9 9 9 183,764 $ 12,481 3,015 273 1,322,137 (125,712) (73,419) 1,138,775
Net earnings 328,942 328,942
Other comprehensive income:Foreign currency translation adjustments (36,095) (36,095)
Unrealized holding loss on marketable equity securities, net of $5,166 tax (9,500) (9,500)
Total comprehensive income 283,347
Dividends to shareholders (158,532) (158,532)
Treasury share purchases (3,535) (131,765) (131,765)
Stock awards granted 67 73 999 1,072
Conversion from Class B Common to Common 1,155 77 (77) —
B A L A N C E D E C E M B E R 3 1 , 2 0 0 0 181,451 $ 12,558 2,938 346 1,492,547 (256,478) (119,014) 1,132,897
Net earnings 362,986 362,986
Other comprehensive income:Foreign currency translation adjustments (12,945) (12,945)
Unrealized holding loss on marketable equitysecurities, net of $1,655 tax (3,077) (3,077)
Gain on derivative contracts, net of $21 tax 46 46
Total comprehensive income 347,010
Dividends to shareholders (171,196) (171,196)
Treasury share purchases (744) (36,432) (36,432)
Options exercised and stock awards granted 170 807 3,111 3,918
Conversion from Class B Common to Common 1,432 88 (88) —
B A L A N C E D E C E M B E R 3 1 , 2 0 0 1 182,309 $ 12,646 2,850 1,153 1,684,337 (289,799) (134,990) 1,276,197
Net earnings 401,525 401,525
Other comprehensive income:Foreign currency translation adjustments 37,007 37,007
Unrealized holding loss on marketable equitysecurities, net of $2,150 tax (4,081) (4,081)
Loss on derivative contracts, net of $363 tax (899) (899)
Total comprehensive income 433,552
Dividends to shareholders (184,628) (184,628)
Treasury share purchases (527) (27,759) (27,759)
Options exercised and stock awards granted 633 1,676 20,402 22,078
Tax benefit related to stock options exercised 1,380 1,380
Conversion from Class B Common to Common 1,098 73 (73)
ESOP tax benefit 1,756 1,756
B A L A N C E D E C E M B E R 3 1 , 2 0 0 2 183,513 $ 12,719 2,777 4,209 1,902,990 (297,156) (102,963) 1,522,576
See accompanying accounting policies and notes.
C O N S O L I D A T E D S T A T E M E N T O F S T O C K H O L D E R S ’ E Q U I T Y
In thousands of dollars and shares
29

DESCRIPTION OF BUSINESS
The principal business of the Wm. Wrigley Jr. Company
is manufacturing and selling chewing gum and other
confectionery products worldwide. All other businesses
constitute less than 10% of combined revenues, operating
income and identifiable assets.
BASIS OF PRESENTATION
The consolidated financial statements include the accounts
of the Wm. Wrigley Jr. Company and its associated companies
(the Company). Intercompany balances and transactions
have been eliminated. Preparation of financial statements in
conformity with generally accepted accounting principles
requires management to make estimates and assumptions that
affect assets, liabilities, revenues, expenses and certain financial
statement disclosures. Actual results may vary from those
estimates. Additionally, certain amounts reported in 2000 and
2001 have been reclassified to conform to the 2002 presentation.
SUMMARY OF SIGNIFICANT ACCOUNTING POLICIES
Recently Adopted Accounting Policies
On January 1, 2002, the Company adopted the accounting
rules under Statement of Financial Accounting Standards (SFAS)
142, “Goodwill and Other Intangible Assets.” Under SFAS 142,
goodwill and intangible assets deemed to have indefinite lives
are no longer amortized but are subject to annual impairment
tests. Other intangible assets will continue to be amortized
for their useful lives. During 2002, the Company performed
the required impairment tests of goodwill and indefinite
lived intangible assets. There was no impairment recognized
as a result of these tests.
In the first quarter 2002, the Company adopted the accounting
rules for Emerging Issues Task Force Issue No. 00-14,
“Accounting for Certain Sales Incentives” and No. 00-25,
“Vendor Income Statement Characterization of Consideration
Paid to a Reseller of the Vendor’s Products” (“Issues”), as
codified by Issue No. 01-09 “Accounting for Consideration
Given by a Vendor to a Customer or Reseller of the Vendors
Products.” In adopting these accounting rules, the Company
began reporting cash consideration given in connection with
certain consumer and trade sales promotions such as coupon
redemptions, in-store display incentives, co-operative
advertising and new product introduction fees, as deductions
from sales rather than as selling, general and administrative
expense. The consumer and trade sales promotions applicable
to these Issues totaled $41,034, $28,227 and $19,592 for 2002,
2001 and 2000, respectively. The consumer and trade sales
promotions applicable to these Issues are reflected in net sales
for all periods. Adoption of the accounting rules had no
impact on the Company’s financial position or net earnings.
The Company also adopted SFAS 148, “Accounting for Stock-
Based Compensation — Transition and Disclosure” as of
December 31, 2002. This Statement amends SFAS No. 123,
“Accounting for Stock-Based Compensation,” to provide
alternative methods of transition for a voluntary change to
the fair value based method of accounting for stock-based
employee compensation. In addition, this Statement amends
the disclosure requirements of SFAS 123 to require prominent
disclosures in both annual and interim financial statements
about the method of accounting for stock-based employee
compensation and the effect of the method used on reported
results. A discussion of the Company’s accounting policy and
the required disclosures under SFAS 148 are included in the
Stock-Based Compensation accounting policy note on page 31.
Cash and Cash Equivalents
The Company considers all highly-liquid investments with
original maturity of three months or less to be cash equivalents.
Inventories
Inventories are valued at cost on a last-in, first-out (LIFO)
basis for U.S. companies and at the lower of cost (principally
first-in, first-out basis) or market for international associated
companies. Inventories totaled $321,196 and $278,981 at
December 31, 2002 and 2001, respectively, including $137,367
and $114,201, respectively, valued at cost on a LIFO basis. If
current costs had been used, such inventories would have
been $15,710 and $10,513 higher than reported at December 31,
2002 and 2001, respectively.
A C C O U N T I N G P O L I C I E S A N D N O T E S T O C O N S O L I D A T E D F I N A N C I A L S T A T E M E N T S
Dollar and share amounts in thousands except per share figures
30

Derivative Financial Instruments
The Company accounts for all derivatives in accordance with
SFAS 133, “Accounting for Derivatives and Hedging Activities”,
as amended. All derivatives are recognized on the balance
sheet at fair value. Changes in the fair value of derivatives are
recorded in earnings or other comprehensive income, based
on whether the instrument is designated as part of a hedge
transaction and, if so, the type of hedge transaction. Gains or
losses on derivative instruments reported in other comprehensive
income are reclassified to earnings in the period in which
earnings are affected by the underlying hedged item. The
ineffective portion of all hedges is recognized in earnings in
the current period.
Property, Plant and Equipment
Land, building and equipment are recorded at cost. Depreciation
is provided primarily by the straight-line method over the
estimated useful lives of the respective assets: buildings and
building equipment — 12 to 50 years; machinery and
equipment — 3 to 20 years. Expenditures for new property,
plant and equipment and improvements that substantially
extend the capacity or useful life of an asset are capitalized.
Ordinary repairs and maintenance are expensed as incurred.
When property is retired or otherwise disposed, the cost
and related depreciation are removed from the accounts and
any related gains or losses are included in net earnings.
Impairment of Long-Lived Assets
The Company reviews long-lived assets on at least an annual
basis to determine if there are indicators of impairment. When
indicators of impairment are present, the Company evaluates
the carrying value of the long-lived assets in relation to the
operating performance and future undiscounted cash flows
of the underlying assets. The Company adjusts the net book
value of the underlying assets if the sum of the expected future
cash flows is less than book value.
Foreign Currency Translation
The Company has determined that the functional currency for
each associated company, except for certain Eastern European
entities, is its local currency. As some Eastern European
entities operate in economies which are considered to be highly
inflationary, their functional currency is the U.S. dollar.
The Company translates the results of operations of its foreign
associated companies at the average exchange rates during
the respective periods. Foreign-currency denominated assets
and liabilities are translated into U.S. dollars at exchange rates
in effect at the respective balance sheet dates resulting in
foreign currency translation adjustments. Foreign currency
translation adjustments are recorded as a separate component
of Accumulated Other Comprehensive Income within
stockholder’s equity.
Revenue Recognition
Revenue from product sales is recognized when the goods are
shipped.
Distribution Costs
The Company classifies distribution costs, including shipping
and handling costs, in cost of sales.
Advertising
The Company expenses all advertising costs in the year
incurred. Advertising expense was $362,548 in 2002, $328,346
in 2001 and $308,446 in 2000.
Stock-Based Compensation
The Company applies Accounting Principles Board Opinion
(APB) No. 25, “Accounting for Stock Issued to Employees”
and related interpretations in accounting for stock-based
compensation plans. APB No. 25 requires the use of the intrinsic
value method, which measures compensation cost as the excess
of the quoted market price of the stock at the date of grant over
the amount an employee must pay to acquire the stock. The
following table illustrates the effect on net earnings and earnings
per share if the Company had applied the fair value recognition
provisions of SFAS No. 123, “Accounting for Stock-Based
Compensation” to stock-based compensation plans.
Year Ended December 31 2002 2001 2000
Net earningsAs reported $ 401,525 362,986 328,942
Add: Stock-based compensation expense included in earnings, net of tax 6,514 5,277 4,354
Deduct: Total stock-based compensation expense determined under fair value method for all awards, net of tax $ 17,933 12,626 8,223
Pro forma net earnings $ 390,106 355,637 325,073
Pro forma basic and diluted earnings per share
As reported $ 1.78 1.61 1.45
Pro forma $ 1.73 1.58 1.43
The Company’s stock-based compensation plans are discussed
further on page 34.
31

Income Taxes
Deferred taxes are recognized for the future tax effects of
temporary differences between financial and income tax reporting
using tax rates in effect for the years in which the differences are
expected to reverse. Federal income taxes are provided on the
portion of the income of foreign associated companies that is
expected to be remitted to the U.S. and be taxable.
INVESTMENTS IN DEBT AND EQUITY SECURITIES
The Company’s investments in debt securities, which typically
mature in one year or less, are held to maturity and are valued
at amortized cost, which approximates fair value. The aggregate
fair values at December 31, 2002 and December 31, 2001 were,
respectively, $24,370 and $13,206 for municipal securities,
and $1,251 and $12,244 for other debt securities. The average
yields of municipal securities held at December 31, 2002 and
December 31, 2001 were 1.85% and 3.19%, respectively.
The Company’s investments in marketable equity securities are
held for an indefinite period. Application of SFAS No. 115,
“Accounting for Certain Investments in Debt and Equity
Securities,” resulted in unrealized holding gains of $15,681 at
December 31, 2002 and $21,912 at December 31, 2001.
Unrealized holding gains, net of the related tax effect, of $10,193
and $14,274 at December 31, 2002 and 2001, respectively, are
included as components of Accumulated Other Comprehensive
Income in stockholders’ equity.
DEFERRED CHARGES AND OTHER ASSETS
Deferred charges and other assets included prepaid pension
assets of $82,200 and $13,700 and deferred compensation assets
of approximately $47,900 and $32,400 at December 31, 2002 and
2001, respectively.
ACCRUED EXPENSES
Accrued expenses at December 31, 2002 and 2001 included
$55,160 and $41,725 of payroll expenses, respectively.
LINE OF CREDIT
In September 2002, the Company renewed its $100 million,
unsecured, line of credit. There were no borrowings under this
line during 2002. Upon drawing on the line of credit, the
Company has the option to elect a fixed or floating interest rate.
The line of credit expires in September 2003.
OTHER NONCURRENT LIABILITIES
Other noncurrent liabilities at December 31, 2002, included
liabilities for approximately $70,400 of deferred compensation
and $5,600 for post-retirement benefits. At December 31, 2001,
they included liabilities for approximately $59,400 of deferred
compensation and $13,400 for post-retirement benefits.
FINANCIAL INSTRUMENTS
Derivative Financial Instruments And Hedging Activities
The Company enters into forward exchange contracts and
purchases currency options to hedge against foreign currency
exposures of forecasted purchase and sales transactions
between associated companies and purchases with outside
vendors. In addition, the Company enters into forward
exchange contracts and purchases currency options to hedge
the foreign currency exposures of forecasted future royalty
payments from, and net investments in, associated companies.
The Company generally hedges forecasted transactions over
a period of twelve months or less.
On the date a derivative contract is entered into, the Company
designates the derivative as either (1) a hedge of a recognized
asset or liability (a fair value hedge), (2) a hedge of a forecasted
transaction (a cash flow hedge), or (3) a hedge of a net
investment in a foreign operation (a net investment hedge).
The Company formally documents its hedge relationships,
including identification of the hedging instruments and the
hedged items, as well as its risk management objectives and
strategies for undertaking the hedge transaction. This process
includes linking derivatives that are designated as hedges
to specific assets, liabilities or forecasted transactions. The
Company also formally assesses both at inception and at least
quarterly thereafter, whether the derivatives that are used in
hedging transactions are highly effective in offsetting changes
in the fair value or cash flows of the hedged item. If it is
determined that a derivative ceases to be a highly effective
hedge, the Company discontinues hedge accounting.
For fair value hedges, the effective portion of the changes in
the fair value of the derivative, along with the gain or loss on
the hedged item that is attributable to the hedged risk, are
recorded in earnings. For cash flow hedges, the effective portion
of the changes in the fair value of a derivative is recorded in
Accumulated Other Comprehensive Income and reclassified
into earnings in the same period or periods during which the
32

hedged transaction affects earnings, generally within the next
twelve months. For net investment hedges, the effective portion
of the change in the fair value of derivatives used as a net
investment hedge of a foreign operation is recorded in Foreign
Currency Translation Adjustment.
The ineffective portion of the change in fair value of any
derivative designated as a hedge is immediately recognized
in earnings. Ineffectiveness recognized during 2002 and 2001
was immaterial.
At December 31, 2002, open foreign exchange contracts for a
number of currencies, primarily the Euro, British pounds and
U.S. dollars, maturing at various dates through December 2003,
had an aggregate notional amount of $304,937. The notional
amount of open foreign exchange contracts at December 31,
2001 aggregated $77,108. The fair values of open foreign
exchange contracts and currency options, as determined by bank
quotes, were a $2,328 loss recorded in current liabilities and a
$41 gain recorded in other current assets at December 31, 2002
and 2001, respectively.
Fair Value of Other Financial Instruments
The carrying amount of cash and cash equivalents, accounts
receivable, and accounts payable approximate fair value.
Marketable equity securities are carried at fair value.
COMMON STOCK
In addition to its Common Stock, the Company has Class B
Common Stock outstanding. Each share of Class B Common
Stock has ten votes, is restricted as to transfer or other
disposition, and convertible at any time into one share of
Common Stock.
Additional paid-in capital primarily represents the excess of
fair market value of Common Stock issued from treasury on
the date the shares of stock were awarded over the average
acquisition cost of the shares.
Treasury Stock may be acquired for the Company’s Management
Incentive Plan (MIP) or under the Share Repurchase Program
resolution adopted by the Board of Directors. On August 18,
1993, the Board of Directors authorized a Share Repurchase
Program to purchase up to $100,000 of shares in the open
market. On October 27, 1999, and October 25, 2000, the
Company’s Board of Directors authorized additional share
repurchases of $200,000 and $100,000, respectively.
During 2002, 2001 and 2000, the Company purchased 483
shares, 704 shares and 3,535 shares at an aggregate price of
$25,504, $34,652, and $131,765, respectively, under the Board of
Director authorizations. No shares were repurchased prior to
1999 under the 1993 authority.
In May 2001, the Company’s Board of Directors approved a
Stockholder Rights Plan. Under the Rights Plan, each holder
of Common Stock and Class B Common Stock at the close of
business on June 6, 2001, automatically received a distribution
of one Right for each share of Common Stock or Class B
Common Stock held. Each Right entitles the holder to purchase
one one-thousandth of a share of Series A Junior Participating
Preferred Stock for $250. The Rights will trade along with, and
not separately from, the shares of Common Stock and Class B
Common Stock unless they become exercisable. The Rights
become exercisable, and they will separate, become tradable,
and entitle stockholders to buy common stock if any person or
group (“Acquiring Person”) becomes the beneficial owner of, or
announces a tender or exchange offer for, 15% or more of the
Company’s Common Stock. In such event, all Rights, except for
those held by the Acquiring Person, become Rights to purchase
$500 worth of Common Stock for $250, unless redeemed by the
Board of Directors. In case of a subsequent merger or other
acquisition of the Company after the Rights become exercisable,
holders of Rights other than the Acquiring Person may purchase
shares of the acquiring entity at a 50% discount. The Rights will
expire on June 6, 2011, unless redeemed earlier, or renewed by
the Company’s Board of Directors.
At December 31, 2002, there were authorized 20 million shares
of preferred stock with no par value, of which 1 million Series A
Junior Participating Preferred shares were reserved for issuance
upon exercise of the Rights.
33

34
STOCK-BASED COMPENSATION PLANS
On March 5, 1997, stockholders approved the Company’s MIP,
as amended by the stockholders on March 5, 2002. The MIP
was designed to provide key employees the opportunity to
participate in the long-term growth and profitability of the
Company through cash and equity-based incentives.
The MIP authorizes the granting of up to 20,000 shares of the
Company’s new or reissued Common Stock. In accordance
with the MIP, shares of Wrigley stock or deferral share units
may be granted under the Wrigley Stock Option program or
awarded under the Long-Term Stock Grant and Stock Award
programs. Deferral share units are also awarded to non-employee
directors. Options outstanding have been granted at prices
which are equal to the fair market value of the stock on the date
of grant. In general, options vest over a four-year period and
expire ten years from the date of grant.
The status of the Company’s Stock Option program is
summarized as follows:
Weighted-Number of Average
Shares Exercise Price
Outstanding at December 31, 1999 1,078,000 $ 43.01
Granted 1,657,000 37.53
Exercised — —
Cancelled (36,000) 40.27
Outstanding at December 31, 2000 2,699,000 $ 39.68
Granted 2,063,700 48.20
Exercised (59,250) 38.99
Cancelled (56,750) 41.67
Outstanding at December 31, 2001 4,646,700 $ 43.45
Granted 2,005,000 57.01
Exercised (316,425) 40.99
Cancelled (58,950) 48.77
Outstanding at December 31, 2002 6,276,325 $ 47.85
The following table summarizes key information about stock options at December 31, 2002:
OUTSTANDING STOCK OPT IONS EXERCISABLE STOCK OPT IONS
Weighted-Average Weighted- Weighted-Range of Remaining Average AverageExercise Prices Shares Contractual Life Exercise Price Shares Exercise Price
$32.03 40,000 7.3 32.03 40,000 32.03
$36.81 - 43.78 2,248,875 7.1 39.74 1,328,188 40.24
$45.28 - 51.22 2,059,450 8.5 48.23 528,180 48.04
$52.55 - 58.14 1,928,000 9.4 57.24 — —
As the exercise price equaled the fair market value on the date
of grant, no compensation expense has been recognized for
the Wrigley Stock Option program. The impact to net earnings
and earnings per share had compensation expense for the
Company’s stock-based compensation plans been determined
based on fair value, consistent with SFAS No. 123, is reflected in
the Summary of Significant Accounting Policies note on page 31.
In determining compensation expense under SFAS No. 123, the
fair value of each option on the date of grant is estimated using
the Black-Scholes option-pricing model. The weighted average
fair value of each option granted using the model was $15.61,
$13.98, and $11.59 in 2002, 2001 and 2000, respectively.
The table below summarizes the key assumptions used to
calculate the fair value:
Interest Dividend Expected ExpectedRate Yield Volatility Life
2002 4.86% 1.44% 22.3% 6 years
2001 5.85% 1.56% 23.8% 6 years
2000 4.75% 1.60% 24.6% 6 years
The fair value of other stock-based compensation plans
calculated in accordance with SFAS No. 123 was not significantly
different from the amounts reported under APB No. 25.
Deferred income taxes reflect the net tax effects of temporary
differences between the carrying amounts of assets and
liabilities for financial reporting purposes and the amounts
used for income tax purposes.
Components of net deferred tax balances are as follows:
2002 2001
Accrued Compensation, Pensionand Post-retirement Benefits $ 15,493 26,419
Depreciation (28,888) (21,898)
Unrealized Holding Gains (5,488) (7,638)
All Other -- Net (2,361) (317)
Net Deferred Tax Liability $ (21,244) (3,434)
Balance sheet classifications of deferred taxes are as follows:
2002 2001
Deferred Tax Asset
Current $ 19,560 14,846
Noncurrent 33,000 29,605
Deferred Tax Liability
Current (3,215) (1,455)
Noncurrent (70,589) (46,430)
Net Deferred Tax Liability $ (21,244) (3,434)
Applicable U.S. income and foreign withholding taxes have
not been provided on approximately $631,920 of undistributed
earnings of international associated companies at December 31,
2002. These earnings are considered to be permanently invested
and, under the tax laws, are not subject to such taxes until
distributed as dividends. Tax on such potential distributions
would be substantially offset by foreign tax credits. If the earnings
were not considered permanently invested, approximately
$99,879 of deferred income taxes would be provided.
INCOME TAXES
Income taxes are based on pre-tax earnings which are
distributed geographically as follows:
2002 2001 2000
Domestic $ 161,646 130,140 139,086
Foreign 421,775 397,226 340,226
$ 583,421 527,366 479,312
Reconciliation of the provision for income taxes computed at
the U.S. Federal statutory rate of 35% for 2002, 2001, and 2000 to
the reported provision for income taxes is as follows:
2002 2001 2000
Provision at U.S.FederalStatutory Rate $ 204,197 184,578 167,759
State Taxes -- Net 4,922 4,401 5,351
Foreign Tax Rates (27,045) (23,832) (19,546)
Tax Credits(principally foreign) (2,438) (1,400) (1,675)
Other -- Net 2,260 633 (1,519)
$ 181,896 164,380 150,370
The components of the provision for income taxes for 2002,
2001, and 2000 are:
Current Deferred Total
2002
Federal $ 21,401 16,113 37,514
Foreign 135,901 908 136,809
State 6,786 787 7,573
$ 164,088 17,808 181,896
2001
Federal $ 30,142 2,384 32,526
Foreign 121,137 2,704 123,841
State 6,770 1,243 8,013
$ 158,049 6,331 164,380
2000
Federal $ 30,704 961 31,665
Foreign 109,184 2,170 111,354
State 7,954 (603) 7,351
$ 147,842 2,528 150,370
35

The funded status of the defined benefit plans and post-retirement benefit plans were as follows:
Defined Benefit Plans Post-Retirement Benefit Plans
2002 2001 2002 2001
Change in Benefit Obligation
Benefit Obligation at Beginning of Year $ 385,500 342,000 $ 33,600 27,100
Service Cost 13,600 11,300 1,400 1,000
Interest Cost 27,200 25,000 2,600 2,100
Plan Participants’ Contributions 400 300 — —
Actuarial Loss 18,100 28,100 6,300 5,600
Foreign Currency Exchange 8,900 (2,900) — —
Other (200) 300 — —
Benefits Paid (18,800) (18,600) (2,400) (2,200)
Benefit Obligation at End of Year $ 434,700 385,500 $ 41,500 33,600
Change in Plan Assets
Fair Value at Beginning of Year $ 343,600 370,900 $ 13,700 13,000
Actual Return on Plan Assets (30,400) (13,000) (3,000) (1,900)
Employer Contribution 77,700 8,100 11,000 4,800
Plan Participants’ Contributions 400 — — —
Foreign Currency Exchange 8,300 (3,600) — —
Other (400) (200) — —
Benefits Paid (18,800) (18,600) (2,400) (2,200)
Fair Value at End of Year $ 380,400 343,600 $ 19,300 13,700
Funded (Underfunded) Status of the Plan $ (54,300) (41,900) $ (22,200) (19,900)
Unrecognized Net Actuarial Loss 127,900 47,200 16,600 6,500
Unrecognized Prior Service Costs 5,100 5,500 — —
Unrecognized Transition Asset (2,800) (3,400) — —
Prepaid (Accrued) Benefit Cost $ 75,900 7,400 $ (5,600) (13,400)
PENSION AND OTHER POST-RETIREMENT PLANS
The Company maintains non-contributory defined benefit
pension plans covering substantially all of its employees in
the U.S. and at certain international associated companies.
Retirement benefits are a function of years of service and
the level of compensation generally for the highest three
consecutive salary years occurring within ten years prior to
an employee’s retirement date depending on the plan. The
Company’s policy is to fund within ERISA or other statutory
limits to provide benefits earned to date and expected to
be earned in the future.
To the extent that an individual’s annual pension benefit under
the plan exceeds the limitations imposed by the Internal
Revenue Code of 1986, as amended, and the regulations
thereunder, such excess benefits may be paid from the
Company’s non-qualified, unfunded, noncontributory
supplemental retirement plan.
Domestic plan assets consist primarily of marketable equity
and fixed income securities. Plan assets for international
associated companies consist primarily of marketable
equity and fixed income securities, and contracts with
insurance companies.
In addition, the Company maintains certain post-retirement
plans which provide limited health care benefits on a
contributory basis and life insurance benefits in the U.S. and
at certain international associated companies. The cost
of these post-retirement benefits is provided during the
employee’s active working career.
36

A 10% annual rate of increase in the per capita cost of
covered post-retirement benefits was assumed for 2003. The
rate was assumed to decrease gradually to 5% for 2008
and remain at that level thereafter.
Increasing or decreasing the health care trend rates by one
percentage point in each year would have the following effect:
1% INCREASE 1% DECREASE
Effect on Post-retirementBenefit Obligation 3,200 (2,800)
Effect on Total of Service andInterest Cost Components 400 (400)
In addition to the defined benefit plans and post-retirement
benefit plans described above, the Company also sponsors
defined contribution plans within the U.S. and at certain
international associated companies. The plans cover full time
employees and provide for contributions between 3% and 5%
of salary. The Company’s expense for the defined contribution
plans totaled $5,694, $4,852, and $4,535 in 2002, 2001, and
2000, respectively.
Additionally, on January 1, 2002, the Company formed an
Employee Stock Ownership Plan (ESOP) within the defined
The following table provides amounts recognized in the balance sheet as of December 31:
Defined Benefit Plans Post-Retirement Benefit Plans
2002 2001 2002 2001
Prepaid Benefit Cost $ 82,200 13,700 $ — —
Accrued Benefit Liability (6,300) (6,300) (5,600) (13,400)
Net Amount Recognized $ 75,900 7,400 $ (5,600) (13,400)
The Company’s qualified plans have plan assets in excess of the accumulated benefit obligation. The Company’s non-qualified,
unfunded, noncontributory supplemental retirement plan has a projected benefit obligation of $6,000 and $5,800 and an accumulated
benefit obligation of $5,200 and $5,500 at December 31, 2002 and 2001, respectively.
The components of net pension and net periodic post-retirement benefit costs are as follows:
Defined Benefit Plans Post-Retirement Benefit Plans
2002 2001 2000 2002 2001 2000
Service Cost $ 13,600 11,300 11,100 $ 1,400 1,000 900
Interest Cost 27,200 25,000 24,200 2,600 2,100 2,000
Expected Return on Plan Assets (29,600) (31,700) (33,200) (1,200) (1,100) (1,200)
Amortization of Unrecognized Transition Assets (700) (900) (900) — — —
Prior Service Costs Recognized 600 1,700 1,700 — — —
Recognized Net Actuarial Loss/(Gain) 700 — (1,900) 400 (200) (200)
Other Pension Plans 4,700 3,600 4,000 — — —
Net Periodic Benefit Cost $ 16,500 9,000 5,000 $ 3,200 1,800 1,500
Assumptions at the end of the year for the Company’s defined benefit and post-retirement benefit plans are as follows:
Defined Benefit Plans Post-Retirement Benefit Plans
2002 2001 2000 2002 2001 2000
Discount Rate
Domestic 6.75% 7.25% 7.75% 6.75% 7.25% 7.75%
Foreign 5.50-6.75% 6.00-6.75% 6.00-7.25% 6.75% 7.25% 7.75%
Long-term Rates of Return on Plan Assets
Domestic 9.25% 9.25% 9.25% 9.25% 9.00% 9.00%
Foreign 6.50-7.50% 6.50-7.50% 6.50-7.50% — — —
Rates of Increase in Compensation Levels
Domestic 4.25% 4.75% 4.75% — — —
Foreign 3.00-4.00% 3.00-4.00% 3.00-4.00% — — —
37

contribution plan for U.S. based employees. The primary
purpose of the ESOP is to acquire and hold Wrigley shares
credited to Wrigley Savings Plan participants’ accounts as a
result of employee contributions and Company matching
program contributions. Company matching program
contributions may be in the form of cash, treasury shares or
authorized, unissued shares. The ESOP is a non-leveraged plan
and all shares held are allocated to plan participants. Dividends
on Company shares held by the ESOP are charged to retained
earnings. The number of shares held by the ESOP at
December 31, 2002, including those shares transferred at the
formation of the ESOP, totaled 5,419. The formation of the
ESOP had no effect on the Company’s net earnings or earnings
per share.
SEGMENT INFORMATION
Management organizes the Company’s chewing gum and other
confectionery business based on geographic regions.
Information by geographic region at December 31, 2002, 2001,
and 2000 and for the years then ended is as follows:
Net Sales 2002 2001 2000
Americas, principally U.S. $ 1,131,703 1,001,074 895,299
EMEAI,principally Europe 1,191,347 1,006,680 902,169
Asia 321,914 297,263 241,892
Pacific 83,110 75,201 71,363
All Other 18,244 21,201 15,391
Net Sales $ 2,746,318 2,401,419 2,126,114
“All Other” net sales consist primarily of sales of gumbase and
sales for Wrigley Healthcare.
Operating Income 2002 2001 2000
Americas, principally U.S. $ 281,999 261,177 220,850
EMEAI,principally Europe 346,189 304,343 249,384
Asia 89,211 77,453 68,165
Pacific 21,602 24,324 22,453
All Other (153,927) (153,941) (97,609)
Total Operating Income $ 585,074 513,356 463,243
“All Other” operating income includes corporate expenses
such as costs related to research and development, information
systems and certain administrative functions and operating
results for Wrigley Healthcare. In 2002, “All Other” operating
income also includes certain costs connected with the
exploration of a business combination with Hershey Foods
Corporation.
Assets 2002 2001 2000
Americas, principally U.S. $ 878,232 700,692 547,954
EMEAI,principally Europe 774,700 667,578 623,656
Asia 199,847 178,780 154,009
Pacific 49,039 39,920 42,612
All Other 61,966 74,497 81,450
Assets Used in OperatingActivities 1,963,784 1,661,467 1,449,681
Corporate 144,512 116,326 125,059
Total Assets $ 2,108,296 1,777,793 1,574,740
Assets are categorized based upon the geographic segment
where they reside. Assets in “Corporate” consist principally of
short-term investments and marketable equity securities which
are held by the corporate office, as well as certain fixed assets.
Depreciation Expense 2002 2001 2000
Americas, principally U.S. $ 21,933 18,778 14,337
EMEAI,principally Europe 36,563 30,341 26,912
Asia 9,305 7,658 6,661
Pacific 1,695 1,167 1,149
All Other 2,630 2,487 1,874
Depreciation Expense Related to Operating Activities 72,126 60,431 50,933
Corporate 13,442 7,895 6,947
Total Depreciation Expense $ 85,568 68,326 57,880
Depreciation expense is categorized consistently with the
geographic region where the asset resides.
Capital Expenditures 2002 2001 2000
Americas, principally U.S. $ 68,991 94,808 41,688
EMEAI,principally Europe 74,098 56,340 39,762
Asia 17,108 16,266 11,635
Pacific 5,078 6,392 2,768
All Other 4,721 4,407 1,252
Capital Expenditures forOperating Activities 169,996 178,213 97,105
Corporate 49,802 5,703 28,942
Gross Capital Expenditures 219,798 183,916 126,047
Intersegment AssetTransfers (2,926) (2,156) (979)
Net Capital Expenditures $ 216,872 181,760 125,068
Capital expenditures are categorized based upon the geographic
segment where the expenditure occurred. Intersegment asset
transfers are primarily due to sales between production facilities
worldwide. Asset sales are typically transferred at net book value.
38

39
William Wrigley, Jr.
President andChief Executive Officer
Peter R. Hempstead
Senior Vice President — International
Surinder Kumar
Chief Innovation Officer
Gary E. McCullough
Senior Vice President — Americas
Dushan Petrovich
Senior Vice President —People, Learning and Development
Darrell R. Splithoff
Senior Vice President — Supply Chain & Corporate Development
Ronald V. Waters
Senior Vice President and Chief Financial Officer
Donald E. Balster
Vice President — Worldwide Manufacturing
Vincent C. Bonica
Vice President — Organizational Development
Reuben Gamoran
Vice President and Controller
Donagh Herlihy
Vice President and Chief Information Officer
Shaun Kim
Vice President — Worldwide Engineering
Howard Malovany
Vice President, Secretary and General Counsel
Patrick D. Mitchell
Vice President — Procurement
Kathryn E. Olson
Vice President — U.S. Consumer Marketing
Jon Orving
Vice President — International and Managing Director — North Region
Stefan Pfander
Vice President — International and Managing Director — EMEAI
Wm. M. Piet
Vice President — Corporate Affairs
Alan J. Schneider
Vice President and Treasurer
Ralph P. Scozzafava
Vice President — General Manager — U.S.
Michael F. Wong
Vice President — International and Managing Director — Asia
A. Rory Finlay
Senior Director — Global Branding
Philip C. Johnson
Senior Director — Benefits & Compensation
Daniela Zaluda
Senior Director
E L E C T E D O F F I C E R S

40
COMMITTEES OF THE
BOARD OF DIRECTORS
Audit
Richard K. Smucker
Chairman
Howard B. Bernick
Melinda R. Rich
Alex Shumate
Compensation
Thomas A. Knowlton
Chairman
Howard B. Bernick
Steven B. Sample
Alex Shumate
Corporate Governance
Penny Pritzker
Chairman
Melinda R. Rich
Steven B. Sample
B O A R D O F D I R E C T O R S
WILLIAM WRIGLEY, JR.Director of the Company since 1988Joined the Wm. Wrigley Jr. Company in 1985President & Chief Executive Officer since 1999Senior Vice President (1999)Vice President (1991-98)
JOHN F. BARDDirector of the Company since 1999Executive Vice President, Wm. Wrigley Jr. Company (1999-2000)Senior Vice President, Wm. Wrigley Jr. Company (1991-99)Director, Weight Watchers International, since 2002
HOWARD B. BERNICKDirector of the Company since 2001Joined Alberto-Culver Company in 1977President and Chief Executive Officer since 1994, and Director since 1986
THOMAS A. KNOWLTONDirector of the Company since 1996Dean-Faculty of Business, Ryerson University, since 2000Executive Vice President, Kellogg Company (1992-98)President, Kellogg North America (1994-98)
PENNY PRITZKERDirector of the Company since 1994Chairman, Classic Residence by Hyatt, since 1987President, Pritzker Realty Group L.P., since 1991Director, Hyatt Corporation, since 1999Director, Hyatt International Corporation, since 1999
MELINDA R. RICHDirector of the Company since 1999Joined Rich Products Corp. in 1986, its Executive Vice President of Innovation since 1997 and Director since 1998President, Rich Entertainment Group, since 1994Director, M & T Bank Corp. (Buffalo, NY), since 1994
STEVEN B. SAMPLEDirector of the Company since 1997President, University of Southern California, since 1991President, State University of New York, Buffalo (1982-91)Director, Unova, Inc., since 1997Director, AMCAP Fund, Inc., since 2000Director, American Mutual Fund, Inc., since 2000Director, Advanced Bionics Corporation, since 2000
ALEX SHUMATEDirector of the Company since 1998Joined law firm of Squire, Sanders & Dempsey in 1988 and Managing Partner of its Columbus, Ohio Office since 1991Director, The Limited, Inc., since 1996Director, Nationwide Financial Services, Inc., since 2002
RICHARD K. SMUCKERDirector of the Company since 1988Joined The J. M. Smucker Company in 1972, its President since 1987, Director since 1975, and Co-CEO since 2001Director, Sherwin-Williams Company, since 1991
Left to right:Thomas A. Knowlton, Howard B.Bernick,
Penny Pritzker, William Wrigley, Jr.,Melinda R. Rich, Richard K. Smucker,
John F. Bard, Alex Shumate,Steven B. Sample.

41
STOCKHOLDER INQUIRIES
Any inquiries about your Wrigley stockholdings should
be directed to:
Stockholder RelationsWm. Wrigley Jr. Company410 North Michigan AvenueChicago, IL 606111-800-874-0474
You can access your Wrigley stock account information
via the Internet at the following address —
gateway.equiserve.com.
Additional information about the Wrigley Company can
be found on the Internet at www.wrigley.com.
CAPITAL STOCK
Common Stock of the Wm. Wrigley Jr. Company (WWY)
is traded on the New York and Chicago Stock Exchanges.
Class B Common Stock, issued to stockholders of record
on April 4, 1986, has restricted transferability and is not
traded on the New York Stock Exchange. It is at all times
convertible, on a share-for-share basis, into Common
Stock and once converted is freely transferable and publicly
traded. Class B Common Stock also has the same rights
as Common Stock with respect to cash dividends and
treatment upon liquidation.
DIVIDENDS
Regular quarterly dividends are paid on or about the
first business day of February, May, August, and November
with the record date for each payment falling on or about
the 15th of the prior month.
DIRECT DIVIDEND DEPOSIT SERVICE
The Direct Dividend Deposit Service allows stockholders
to receive cash dividends through electronic deposits into
their checking or savings account.
DIVIDEND REINVESTMENT PLAN
The Dividend Reinvestment Plan (DRP) is open to all
stockholders of record. The DRP is administered by
EquiServe Trust Company, N.A. and uses cash dividends
on both Common Stock and Class B Common Stock, along
with voluntary cash contributions, to purchase additional
shares of Common Stock. Cash contributions can be made
monthly for a minimum of $50 and a maximum of $5,000.
All shares purchased through the DRP are retained
in a DRP account, so there are no certificates that could
be lost, misplaced, or stolen. Additionally, once a DRP
account is established, a participant can deposit any
Wrigley stock certificates held outside the DRP into the
account for safekeeping.
Just under 30,000 or 74% of the Company’s stockholders
of record currently participate in the DRP. A brochure
fully describing the DRP and its enrollment procedure
is available upon request.
CONSOLIDATION OF MULTIPLE ACCOUNTS
To avoid receiving duplicate mailings, stockholders
with more than one Wrigley account may want to
consolidate their shares. For more information, please
contact the Company.
ELECTRONIC RECEIPT OF PROXY MATERIALS
AND PROXY VOTING
If you are a stockholder who would like to receive your
copies of the annual report and proxy statement via the
Internet in the future, you need to complete an online
consent form.
Stockholders of record can go directly to the EquiServe
form at — www.econsent.com/wwy — or link to the
form through the Wrigley web site.
S T O C K H O L D E R I N F O R M A T I O N

42
“Street name” stockholders, holding their shares in a bank
or brokerage account, should go to the Wrigley web site —
www.wrigley.com — and complete the form they find under
Stockholder Services in the Investor Information section.
STOCK CERTIFICATES
For security and tax purposes, stockholders should keep
a record of all of their stock certificates. The record should
be kept in a separate place from the certificates themselves
and should contain the following information for each
certificate: exact registration, number of shares, certificate
number, date of certificate and the original cost of the
shares. If a stock certificate is lost or stolen, notification
should be sent to the Company immediately. The transfer
agent has two requirements to be met before a new
certificate will be issued — a completed affidavit and
payment for an indemnity bond based on the current
market value of the lost or stolen stock. The replacement
of a certificate will take about seven to ten days. Even if
a certificate is lost or stolen, the stockholder will continue
to receive dividends on those shares while the new
certificate is being issued.
A transfer or reregistration of stock is required when
the shares are sold or when there is any change in name
or ownership of the stock. To be accepted for transfer or
reregistration, the stockholder’s signature on the certificate
or stock power must receive a Medallion Signature Guarantee
by a qualified financial institution that participates in the
Medallion Guarantee program. A verification by a notary
public is not sufficient. Anytime a certificate is mailed, it
should be sent registered mail, return receipt requested.
TRANSFER AGENT AND REGISTRAR
EquiServe Trust Company, N.A.P. O. Box 43069Providence, RI 02940-3069Inside the U.S. — 1-800-446-2617Outside the U.S. — +1-781-575-2723TDD/TTY for hearing impaired — 1-800-952-9245Internet: www.equiserve.com
COMPANY PUBLICATIONS
The Company’s 2002 annual report to the Securities
and Exchange Commission on Form 10-K is expected
to be available on or about February 23, 2003.
Requests for this publication should be addressed to
Stockholder Relations at the main office of the Company.
It is also available for review at our Internet home page
(www.wrigley.com).
43
CORPORATE HEADQUARTERS
Wrigley Building410 North Michigan AvenueChicago, Illinois 60611
PRINCIPAL ASSOCIATED COMPANIES
DomesticWrigley Manufacturing Company, LLC
Chicago, Illinois 60609*Gainesville, Georgia 30542*Phoenix, Arizona 85004*
Amurol Confections Company*Yorkville, Illinois 60560
Four-Ten CorporationChicago, Illinois 60611
Wrigley Sales CompanyChicago, Illinois 60611
L.A. Dreyfus Company*Edison, New Jersey 08820
Northwestern Flavors, LLC*West Chicago, Illinois 60185
InternationalThe Wrigley Company Pty. Limited*Sydney, Australia
Wrigley Austria Ges.m.b.H.Salzburg, Austria
Wrigley Bulgaria EOODSofia, Bulgaria
Wrigley Canada*Don Mills, Ontario, Canada
Wrigley Chewing Gum Company Ltd.*Guangzhou, Guangdong,Peoples Republic of China
Wrigley Croatia d.o.o.Zagreb, Croatia
Wrigley s.r.o.Prague, Czech Republic
The Wrigley Company Limited*Plymouth, England, U.K.
Oy Wrigley Scandinavia AbTurku, Finland
Wrigley France S.N.C.*Biesheim, France
Wrigley G.m.b.H.Munich, Germany
Wrigley B.V.Bussum, Holland
The Wrigley Company (H.K.) LimitedHong Kong
Wrigley Hungaria, Kft.Budapest, Hungary
Wrigley India Private Limited*Bangalore, Karnataka, India
Wrigley Israel Ltd.Herzeliya-Pituach, Israel
Wrigley & Company Ltd., JapanTokyo, Japan
The Wrigley Company (East Africa) Limited*Nairobi, Kenya
The Wrigley Company (Malaysia) Sdn. Bhd.Kuala Lumpur, Malaysia
The Wrigley Company (N.Z.) LimitedAuckland, New Zealand
Wrigley Scandinavia ASOslo, Norway
The Wrigley Company (P.N.G.) Ltd.Port Moresby, Papua New Guinea
Wrigley Philippines, Inc.*Antipolo City, Philippines
Wrigley Poland Sp. zo.o.*Poznan, Poland
Wrigley Romania Produse Zaharoase SRLBucharest, Romania
OOO Wrigley Moscow, RussiaSt. Petersburg, Russia*
Wrigley Slovakia s.r.o.Banska Bystrica, Slovakia
Wrigley d.o.o.Ljubljana, Slovenia
Wrigley Co., S.A. Santa Cruz de TenerifeCanary Islands, Spain
Wrigley Scandinavia ABStockholm, Sweden
Wrigley Taiwan Limited*Taipei, Taiwan, R.O.C.
Wrigley UkraineKiev, Ukraine TzoV
Wrigley Middle East, FZCODubai, United Arab Emirates
*Denotes production facility
C O R P O R A T E F A C I L I T I E S A N D P R I N C I P A L A S S O C I A T E D C O M P A N I E S

44
The Wrigley Company markets chewing gum, bubble gum, and confectionery products around the world.
DOMESTIC BRANDS
Big Red Juicy Fruit
Doublemint Orbit
Eclipse Orbit White
Eclipse Flash Winterfresh
Extra Winterfresh Thin Ice
Freedent Wrigley’s Spearmint
INTERNATIONAL BRANDS
Airwaves Extra White
Alpine Freedent
Arrowmint Freedent for Kids
Big Boy Freedent White
Big G Hubba Bubba
Big Red Ice White
Cool Air Juicy Fruit
Cool Crunch Orbit
Doublemint Orbit Drops
Dulce 16 Orbit for Kids
Eclipse Orbit White
Excel P.K.
Extra Winterfresh
Extra Thin Ice Wrigley’s Spearmint
Extra for Kids X-Cite
Amurol Confections Co., a wholly owned subsidiary of the Wrigley Company, makes a wide range of youth-oriented andadult gum and confectionery products, which are marketed in the U.S. and internationally.
AMUROL BRANDS
Big League Chew Bubble Tape Hubba Bubba Sweet Roll
Blasters Bug City Santa’s Coal
Bubble Beeper Cluckers Squeeze Pop
Bubble Cane Dragon Fire Velamints
Bubble Jug Everest Fresh Sqeezed
The brands listed above are trademarks either owned by the Wm. Wrigley Jr. Company or Amurol Confections Co.,or used under license from the trademark owner.


Wm. Wrigley Jr. Company
Wrigley Building410 North Michigan Avenue
Chicago, Illinois 60611