Embed Size (px)
Citation preview
Efficacy Research Report | WISC-V 1
WISC -VEfficacy Research ReportApril 2018
Efficacy Research Report | WISC-V
Contents
03 Introduction
05 Product summary
07 Assessment quality indicators
08 Foundational research
09 Product research
Efficacy Research Report | WISC-V 03
Introduction
In 2013, Pearson made a commitment to efficacy: to identify the outcomes that matter most to students and educators, and to have a greater impact on improving those outcomes. Our aspiration was to put the learner at the heart of the Pearson strategy; our goal was to help more learners, learn more.
A critical part of Pearson’s portfolio is its Assessment business, which is really a services business supporting our customer requests by designing, building, administering, scoring, and reporting on test-taker performance in many different contexts (ranging from K-12 classrooms to the workplace) and for different purposes (ranging from supporting classroom instruction through ongoing progress monitoring to certifying fitness for employment in a given occupation). The people who take these tests are learners on a journey, similar to students who use our courseware products in the classroom to fulfill course requirements. In this case, however, the test is serving a slightly different function along this journey than would one of our digital courseware products. Taking a test is not a learning experience in and of itself, but rather, the scores and diagnostic information from these assessments may be used by instructors and others to make decisions about a learner’s progress along their journey. Therefore, a measure of efficacy for assessments is not whether taking the test leads directly to higher achievement or passing the course, but whether the scores and other diagnostic information provide an accurate snapshot of what the learner knows and can do. In other words, the efficacy of an assessment is its fitness for a given purpose.
The fitness of an assessment for a given purpose, in turn, is defined by three primary qualities or attributes of test scores and their use: validity, reliability, and fairness. The Standards for Educational and Psychological Testing (AERA, APA, NCME, 2014) have defined these attributes as follows:
— Validity is “the degree to which evidence and theory support the interpretations of test scores for proposed uses of tests“ (p. 11). Validity requires evidence that test scores can be interpreted as they are intended and can be appropriately used for a specific, defined purpose.
— Reliability is “the consistency of scores across replications of a testing procedure” (p. 33). Reliability requires evidence of the consistency of scores over time, across multiple forms of the assessment, and/or over multiple scorers.
— Fairness suggests that “scores have the same meaning for all individuals in the intended population” (p. 50). Fairness requires evidence that when assessments are administered as intended, items are not systematically biased against any particular group of test -takers and students are not hindered in demonstrating their skills by irrelevant barriers in the test administration procedures.
Given the longstanding role of the Joint Committee Standards as a source of guidance on best practices in the development and evaluation of tests and the role these standards play in the legal defensibility of assessment, Pearson has adopted these three attributes as the Assessment Quality Indicators on which we publicly report evidence underlying our assessment products. Each attribute is associated with a range of evidence types that are more or less relevant in a given context depending on the test’s particular purpose and intended uses. For example, there are five commonly-accepted types of validity evidence that can be woven together to formulate an argument that a particular test can be interpreted as intended and used in a particular way, including evidence about how the assessment content was developed and how scores on the assessment relate to scores on other measures of the same kinds of knowledge and skills (AERA, APA, NCME, 2014). Similarly, there are different indices of reliability that can be provided, depending on the purpose and implementation of the test - when and how often it is administered, how it is scored, and how scores are reported. Such indices might include the average inter-item correlation or correlations between scores from different forms of the assessment, or across different times when the assessment is administered. Finally, fairness can also be supported by different types of evidence, including the results of analyses that specifically attempt to isolate items that appear to function differently for people in different subgroups (e.g., males versus females) and results from analyses of item content by specially formulated expert committees whose purpose is to identify potentially biasing content.
Efficacy Research Report | WISC-V 04
Pearson’s assessment products are designed, built, and maintained over time by teams of subject matter experts and Ph.D. level research scientists trained in the science of assessment. These teams regularly (in some cases, annually) carry out studies to collect the kinds of validity, reliability, and fairness evidence described above, in accordance with the Joint Committee Standards. This evidence is typically consolidated and published in a technical manual or technical report that is updated with each new revision of the test. For that reason, much of the research we summarize on our assessment products has been completed internally and in many cases, we refer the interested reader to the technical manuals for full details of the research studies and associated evidence.
Special thanksWe want to thank all the customers, test takers, research institutions and organizations we have collaborated with to date. If you are interested in partnering with us on future efficacy research, have feedback or suggestions for how we can improve, or want to discuss your approach to using or researching our assessments, we would love to hear from you at [email protected].
Kate EdwardsSenior Vice President, Efficacy and Research, PearsonApril 3 2018
Efficacy Research Report | WISC-V 05
Product summary
The Wechsler Intelligence Test for Children — Fifth Edition (WISC -V) is a comprehensive intellectual ability assessment for children. The WISC -V was developed over the course of five years by an expert team including doctoral -level scientists and clinicians and an advisory panel, who provided expert advice about intellectual ability testing, clinical utility, specific learning disabilities, and child neuropsychology. It is used to assess for intellectual disability, intellectual giftedness, and specific learning disabilities; and is frequently part of a battery to examine cognitive functioning in Attention Deficit Hyperactivity Disorder (ADHD) and Autism Spectrum Disorder (ASD).
Primary Index Scores include:
— Verbal Comprehension Index (VCI)— Visual Spatial Index (VSI)— Working Memory Index (WMI)— Fluid Reasoning Index (FRI)— Processing Speed Index (PSI)
Ancillary Index Scores include:
— Verbal (Expanded Crystallized) Index (VECI)— Expanded Fluid Index (EFI) — Quantitative Reasoning Index (QRI)— Auditory Working Memory Index (AWMI)— Nonverbal Index (NVI)— General Ability Index (GAI)— Cognitive Proficiency Index (CPI)
Complementary Index Scales include:
— Naming Speed Index (NSI)— Symbol Translation Index (STI)— Storage and Retrieval Index (SRI)
The WISC is a cognitive ability measure known across the world. The WISC -V is currently published in the US, Canada, Australia and Spain, with future publications planned in the United Kingdom, France, Germany, Netherlands and Scandinavia.
The WISC -V was developed for use with children between the ages of 6 and 16, and is used to obtain a comprehensive assessment of general intellectual functioning in the context of various types of evaluations, including (but not limited to):
— Identifying students in school with specific learning disabilities and qualification for services— Identifying children with intellectual disability or giftedness— Evaluating cognitive processing strengths and weaknesses— Assessing the impact of brain injuries
The WISC has been revised frequently over the last seven decades to incorporate advances in the field of intellectual assessment, to update norms that reflect population changes, to update item content to reflect changes in culture and technology, and to meet the practical and clinical needs of contemporary society.
Efficacy Research Report | WISC-V 06
The original WISC adapted subtests of the Wechsler-Bellevue Intelligence Scale (Wechsler, 1939) for use with children. It provided a Verbal IQ (VIQ), Performance IQ (PIQ), and Full Scale IQ (FSIQ).
The WISC–Revised (WISC- R) retained all 12 subtests from the first edition, shifted the age range, and continued to offer a VIQ, PIQ, and FSIQ.
The WISC–Third Edition (WISC- III) retained all of the subtests from the WISC-R, and introduced a new subtest. The WISC–III introduced four new index scores that represented more narrow domains of cognitive function: the Verbal Comprehension Index, the Perceptual Organization Index, the Freedom from Distractibility Index, and the Processing Speed Index. It continued to offer a VIQ, PIQ, and FSIQ.
The WISC–Fourth Edition (WISC- IV) dropped three subtests that appeared on the WISC-III. Ten of the subtests were retained with revised item content and scoring procedures. Five new subtests were developed. The traditional VIQ and PIQ scores were eliminated, and the FSIQ was retained. Several process scores, which provided more detailed information about certain aspects of WISC -V performance, also were included.
The revision goals for the WISC-V were generally to consider advances in structural models of intelligence, cognitive neuroscience, neurodevelopmental research, psychometrics, and contemporary practical clinical demands. The latter included revising instructions and item phrasing to enhance comprehension of the task demands; simplifying scoring criteria, shortening testing time; improving psychometric properties in norming methods; improving floors and ceilings; increasing significance level options for critical values; improving the measure of visual spatial processing, fluid reasoning, and working memory; adding a variety of new composite scores to provide more clinical information; and adding measures of cognitive processes that are sensitive to learning problems. These considerations collectively refine the entire battery.
Complete details on test administration, scoring, and interpretation can be found in the WISC -V administration manual and in Flanagan and Alfonso (2017); Kaufman, Raiford, and Coalson (2016); and Weiss, Saklofske, Holdnack, and Prifitera (2016).
Efficacy Research Report | WISC-V 07
Assessment quality indicators
We define efficacy in assessment by three primary assessment quality criteria - validity, reliability, and fairness, as they apply to the main purpose of the assessment. The purpose of the WISC-V is to assess children’s general intellectual ability in order to make identification, placement, and resource allocation decisions. The three assessment quality criteria discussed here are the extent to which the assessment allows test users to make sound interpretations of children’s intellectual functioning (validity), the consistency and accuracy of scores (reliability), and fairness of the assessments (AERA, APA, & NCME, 2014).
Assessment quality indicator 1: Test scores can be interpreted as measures of intelligence in children and can be used for identification, placement, and resource allocation (validity). A key WISC -V goal is to enable test users to make sound interpretations about examinee ability and to support identification or placement decisions by providing measures that accurately capture general intellectual ability, as well as profiles of relative strengths and weaknesses across different aspects or domains of cognitive ability.
Assessment quality indicator 2: Test scores are consistent over time and/or over multiple raters (reliability).Another important goal of the WISC -V is to minimize errors in judgment and decision making by providing scores that are consistent over different testing occasions and raters.
Assessment quality indicator 3: Test scores can be interpreted the same way for test- takers of different subgroups (fairness).The WISC -V also strives to provide scores that can be interpreted in the same way for all test -takers, regardless of gender or race/ethnicity. Fairness implies that when the assessments are administered as intended, items are not systematically biased against any particular group of test -takers and students are not hindered in demonstrating their skills by irrelevant barriers in the test administration procedures.
Efficacy Research Report | WISC-V 08
Foundational research
Overview of foundational researchContemporary intelligence research supports the presence of a general underlying global intelligence factor, supported by several sub abilities within specific domains, such as verbal ability (Gottfredson & Saklofske, 2009; Johnson, Bouchard, Krueger, McGue, & Gottesman, 2004). The design of the original Wechsler Intelligence Test was consistent with this view, positing an underlying global intelligence factor, with subtests focused on specific aspects of cognitive abilities, including verbal comprehension, abstract reasoning, visual spatial processing, quantitative reasoning, memory, and processing speed. Despite periodic revisions to the particular mix of subtests with each new edition of the Wechsler tests, this general approach of modeling intelligence using a hierarchical structure persists. Moreover, some of the original subtests (e.g., Block Design and Vocabulary) continue to appear in modified form on other published intelligence measures, confirming their continued relevance to intelligence theory today. Several of the new subtests of the WISC -V are based on subtests appearing on either the Wechsler Adult Intelligence Scale (WAIS) or the Wechsler Preschool and Primary Scale of Intelligence (WPPSI) that have already been well -researched. Finally, in line with recent advances in intelligence theory, updates to the latest version include new measures of visual spatial ability, fluid reasoning, and working memory; separate visual spatial and fluid reasoning composites; and improvements of the measure of verbal comprehension and processing speed.
Efficacy Research Report | WISC-V 09
Product research
The WISC-V team carried out studies to collect the kinds of validity, reliability, and fairness evidence described above, in accordance with the Joint Committee Standards (AERA, APA, NCME, 2014). This evidence has been consolidated and published in a technical manual, which is updated with each new revision of the test. For that reason, much of the research we summarize in the following section has been completed internally. We encourage test users who are interested in the full details of our internal research studies and associated evidence to consult the official technical manual, which is available to qualified users with appropriate credentials.
We have also included in the summary a few external studies that offered empirical evidence directly related to the validity, reliability, or fairness of the WISC-V. To identify those studies, the lead research scientist on the WISC-V team monitored any published studies on the WISC-V through a Google alert. Any studies identified through this alert were screened for relevance. Those deemed relevant were included in the summary.
Overview of product researchThe WISC product (in all its iterations) is one of the most -researched assessment products that exists. In fact, there are more than 70 years of research on the WISC.
As the WISC -V is in the market longer, more data on this most current edition will become available. Many external researchers request access to the WISC data to independently verify and conduct their own studies on factor structure and many other questions. They also independently collect and publish large special group studies to validate the use of the test in their frequently tested populations. In addition to a variety of published studies, there is ongoing research to extend the norms for intellectually gifted test -takers.
Research studiesItem pilot, tryout, and standardization study
Study citation Wechsler, D. (2014). WISC -V: Technical and Interpretive Manual. Bloomington, MN: Pearson.
Research study contributors
NA
Type of study Item pilot, tryout and standardization study
Sample size Three Mini -Pilots: N=17, 5, and 20
Three Pilots: N=431, 397, and 120
National Tryout: N=356 in each of 9 different age groups
Standardization Study: N=2,200 children in 11 different age groups
Description of sample
Three Mini -Pilots: Demographic data on the participants was not reported.
Three Pilots: Demographic data on the participants was not reported.
National Tryout: Participants were sampled using a stratified sampling procedure to account for representation across key demographic characteristics (sex, race/ethnicity, parent education level, and geographic region). Within each of nine different age groupings, the sample was similar to the US population according to 2012 census data.
Standardization Study: Participants came from a nationally representative sample. Participants in each of 11 age groups were closely matched to 2012 US census data on race/ethnicity, parent education level and geographic region, and were balanced with respect to gender.
Assessment quality indicator measured
Test scores can be interpreted as measures of intelligence in children and can be used for identification, placement, and resource allocation (validity)
Efficacy Research Report | WISC-V 10
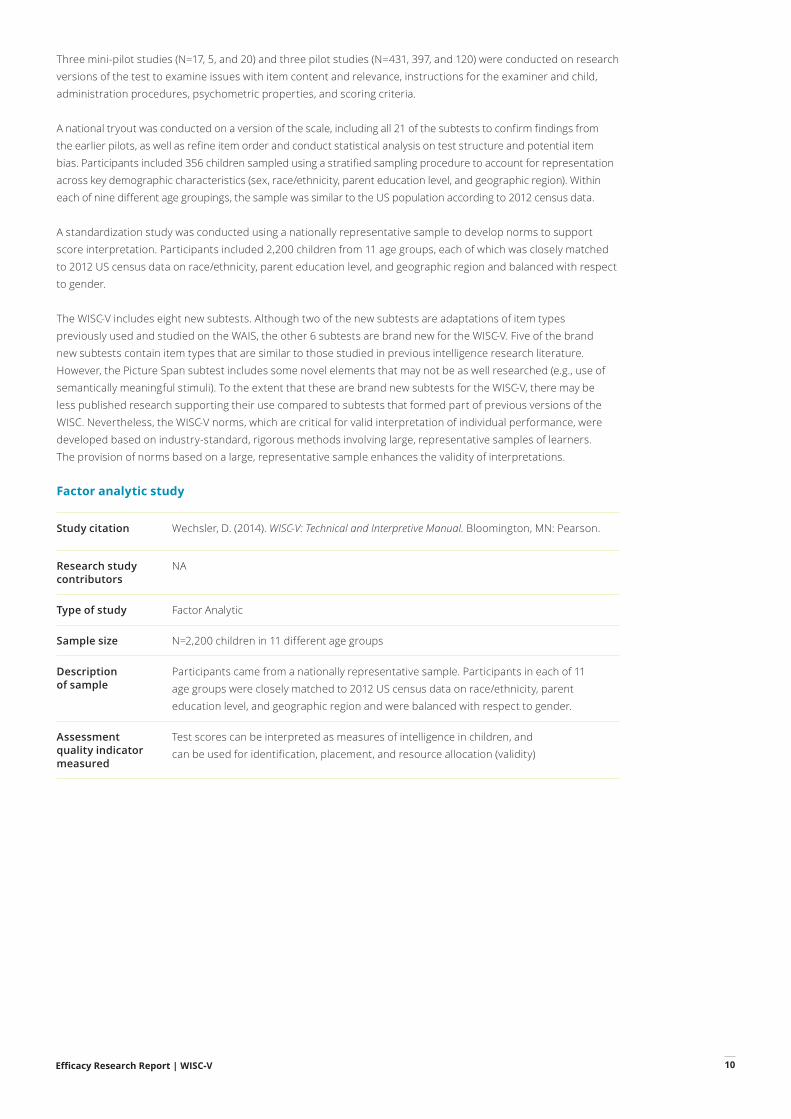
Three mini- pilot studies (N=17, 5, and 20) and three pilot studies (N=431, 397, and 120) were conducted on research versions of the test to examine issues with item content and relevance, instructions for the examiner and child, administration procedures, psychometric properties, and scoring criteria.
A national tryout was conducted on a version of the scale, including all 21 of the subtests to confirm findings from the earlier pilots, as well as refine item order and conduct statistical analysis on test structure and potential item bias. Participants included 356 children sampled using a stratified sampling procedure to account for representation across key demographic characteristics (sex, race/ethnicity, parent education level, and geographic region). Within each of nine different age groupings, the sample was similar to the US population according to 2012 census data.
A standardization study was conducted using a nationally representative sample to develop norms to support score interpretation. Participants included 2,200 children from 11 age groups, each of which was closely matched to 2012 US census data on race/ethnicity, parent education level, and geographic region and balanced with respect to gender.
The WISC -V includes eight new subtests. Although two of the new subtests are adaptations of item types previously used and studied on the WAIS, the other 6 subtests are brand new for the WISC -V. Five of the brand new subtests contain item types that are similar to those studied in previous intelligence research literature. However, the Picture Span subtest includes some novel elements that may not be as well researched (e.g., use of semantically meaningful stimuli). To the extent that these are brand new subtests for the WISC -V, there may be less published research supporting their use compared to subtests that formed part of previous versions of the WISC. Nevertheless, the WISC-V norms, which are critical for valid interpretation of individual performance, were developed based on industry-standard, rigorous methods involving large, representative samples of learners. The provision of norms based on a large, representative sample enhances the validity of interpretations.
Factor analytic study
Study citation Wechsler, D. (2014). WISC -V: Technical and Interpretive Manual. Bloomington, MN: Pearson.
Research study contributors
NA
Type of study Factor Analytic
Sample size N=2,200 children in 11 different age groups
Description of sample
Participants came from a nationally representative sample. Participants in each of 11 age groups were closely matched to 2012 US census data on race/ethnicity, parent education level, and geographic region and were balanced with respect to gender.
Assessment quality indicator measured
Test scores can be interpreted as measures of intelligence in children, and can be used for identification, placement, and resource allocation (validity)
Efficacy Research Report | WISC-V 11
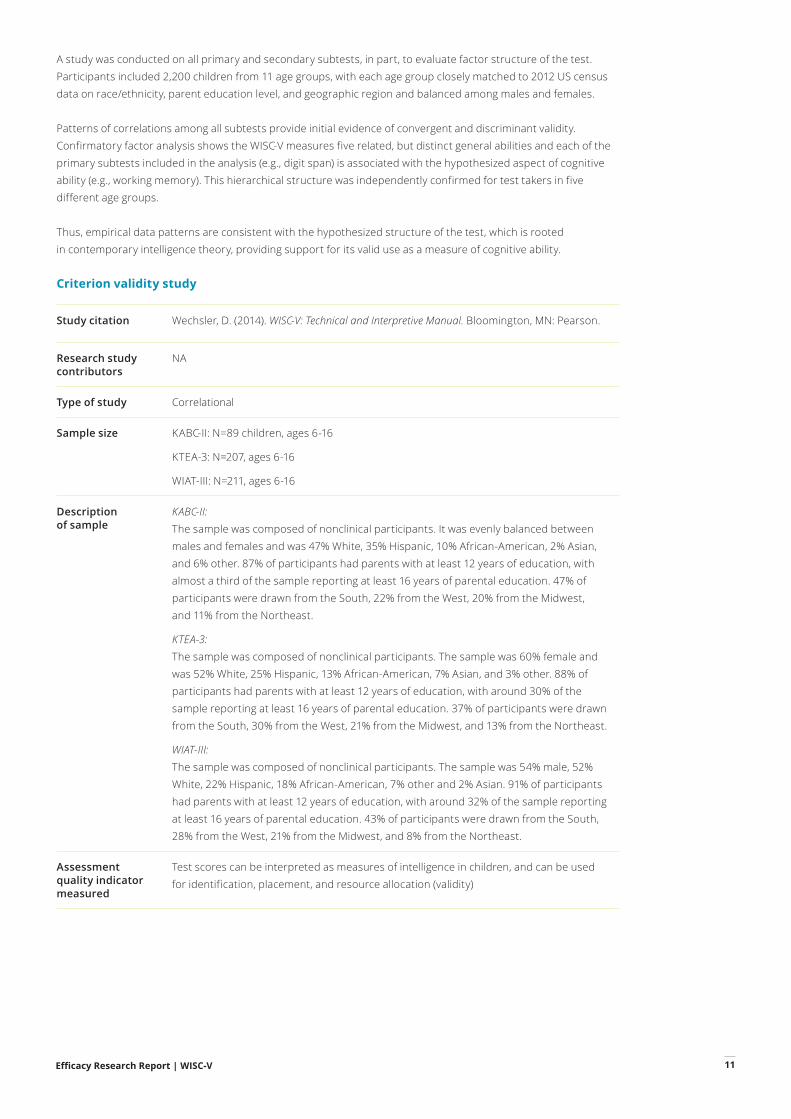
A study was conducted on all primary and secondary subtests, in part, to evaluate factor structure of the test. Participants included 2,200 children from 11 age groups, with each age group closely matched to 2012 US census data on race/ethnicity, parent education level, and geographic region and balanced among males and females.
Patterns of correlations among all subtests provide initial evidence of convergent and discriminant validity. Confirmatory factor analysis shows the WISC -V measures five related, but distinct general abilities and each of the primary subtests included in the analysis (e.g., digit span) is associated with the hypothesized aspect of cognitive ability (e.g., working memory). This hierarchical structure was independently confirmed for test takers in five different age groups.
Thus, empirical data patterns are consistent with the hypothesized structure of the test, which is rooted in contemporary intelligence theory, providing support for its valid use as a measure of cognitive ability.
Criterion validity study
Study citation Wechsler, D. (2014). WISC -V: Technical and Interpretive Manual. Bloomington, MN: Pearson.
Research study contributors
NA
Type of study Correlational
Sample size KABC- II: N=89 children, ages 6- 16
KTEA- 3: N=207, ages 6- 16
WIAT -III: N=211, ages 6- 16
Description of sample
KABC- II: The sample was composed of nonclinical participants. It was evenly balanced between males and females and was 47% White, 35% Hispanic, 10% African -American, 2% Asian, and 6% other. 87% of participants had parents with at least 12 years of education, with almost a third of the sample reporting at least 16 years of parental education. 47% of participants were drawn from the South, 22% from the West, 20% from the Midwest, and 11% from the Northeast.
KTEA- 3: The sample was composed of nonclinical participants. The sample was 60% female and was 52% White, 25% Hispanic, 13% African -American, 7% Asian, and 3% other. 88% of participants had parents with at least 12 years of education, with around 30% of the sample reporting at least 16 years of parental education. 37% of participants were drawn from the South, 30% from the West, 21% from the Midwest, and 13% from the Northeast.
WIAT- III: The sample was composed of nonclinical participants. The sample was 54% male, 52% White, 22% Hispanic, 18% African- American, 7% other and 2% Asian. 91% of participants had parents with at least 12 years of education, with around 32% of the sample reporting at least 16 years of parental education. 43% of participants were drawn from the South, 28% from the West, 21% from the Midwest, and 8% from the Northeast.
Assessment quality indicator measured
Test scores can be interpreted as measures of intelligence in children, and can be used for identification, placement, and resource allocation (validity)
Efficacy Research Report | WISC-V 12
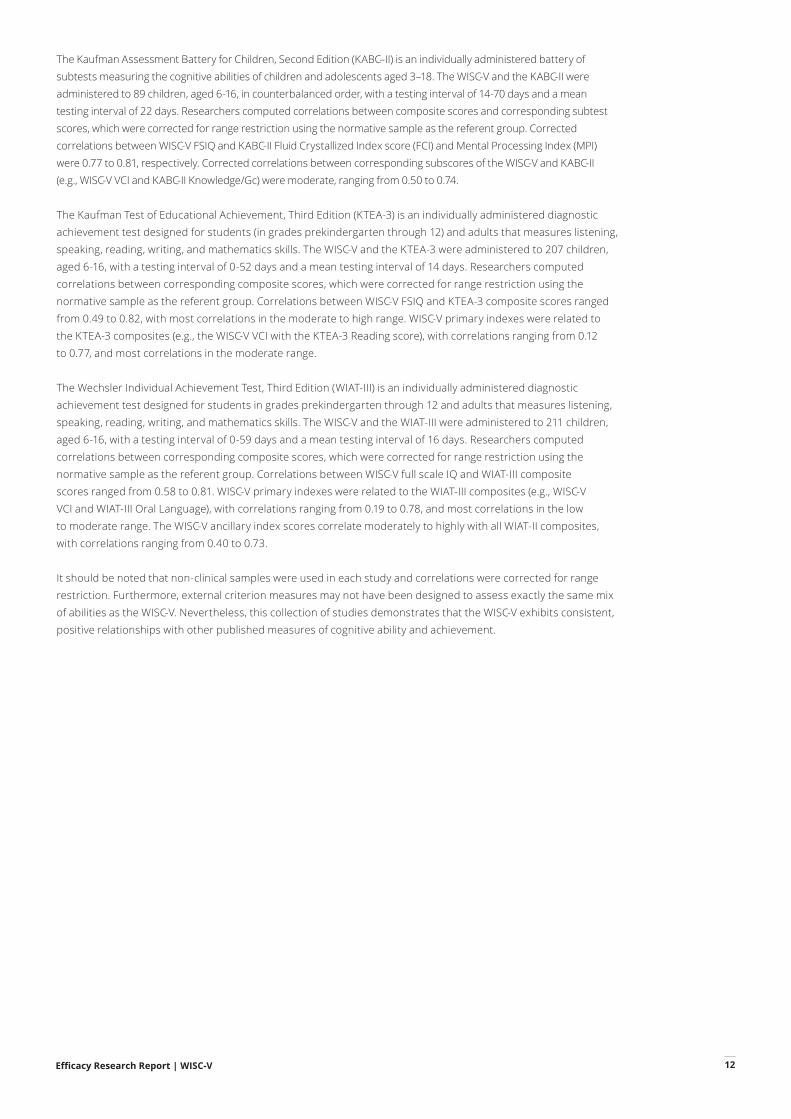
The Kaufman Assessment Battery for Children, Second Edition (KABC–II) is an individually administered battery of subtests measuring the cognitive abilities of children and adolescents aged 3–18. The WISC-V and the KABC-II were administered to 89 children, aged 6-16, in counterbalanced order, with a testing interval of 14-70 days and a mean testing interval of 22 days. Researchers computed correlations between composite scores and corresponding subtest scores, which were corrected for range restriction using the normative sample as the referent group. Corrected correlations between WISC -V FSIQ and KABC- II Fluid Crystallized Index score (FCI) and Mental Processing Index (MPI) were 0.77 to 0.81, respectively. Corrected correlations between corresponding subscores of the WISC -V and KABC- II (e.g., WISC -V VCI and KABC- II Knowledge/Gc) were moderate, ranging from 0.50 to 0.74.
The Kaufman Test of Educational Achievement, Third Edition (KTEA-3) is an individually administered diagnostic achievement test designed for students (in grades prekindergarten through 12) and adults that measures listening, speaking, reading, writing, and mathematics skills. The WISC-V and the KTEA-3 were administered to 207 children, aged 6-16, with a testing interval of 0-52 days and a mean testing interval of 14 days. Researchers computed correlations between corresponding composite scores, which were corrected for range restriction using the normative sample as the referent group. Correlations between WISC -V FSIQ and KTEA- 3 composite scores ranged from 0.49 to 0.82, with most correlations in the moderate to high range. WISC -V primary indexes were related to the KTEA- 3 composites (e.g., the WISC -V VCI with the KTEA -3 Reading score), with correlations ranging from 0.12 to 0.77, and most correlations in the moderate range.
The Wechsler Individual Achievement Test, Third Edition (WIAT- III) is an individually administered diagnostic achievement test designed for students in grades prekindergarten through 12 and adults that measures listening, speaking, reading, writing, and mathematics skills. The WISC-V and the WIAT-III were administered to 211 children, aged 6-16, with a testing interval of 0-59 days and a mean testing interval of 16 days. Researchers computed correlations between corresponding composite scores, which were corrected for range restriction using the normative sample as the referent group. Correlations between WISC -V full scale IQ and WIAT- III composite scores ranged from 0.58 to 0.81. WISC -V primary indexes were related to the WIAT- III composites (e.g., WISC -V VCI and WIAT- III Oral Language), with correlations ranging from 0.19 to 0.78, and most correlations in the low to moderate range. The WISC-V ancillary index scores correlate moderately to highly with all WIAT-II composites, with correlations ranging from 0.40 to 0.73.
It should be noted that non -clinical samples were used in each study and correlations were corrected for range restriction. Furthermore, external criterion measures may not have been designed to assess exactly the same mix of abilities as the WISC -V. Nevertheless, this collection of studies demonstrates that the WISC-V exhibits consistent, positive relationships with other published measures of cognitive ability and achievement.
Efficacy Research Report | WISC-V 13
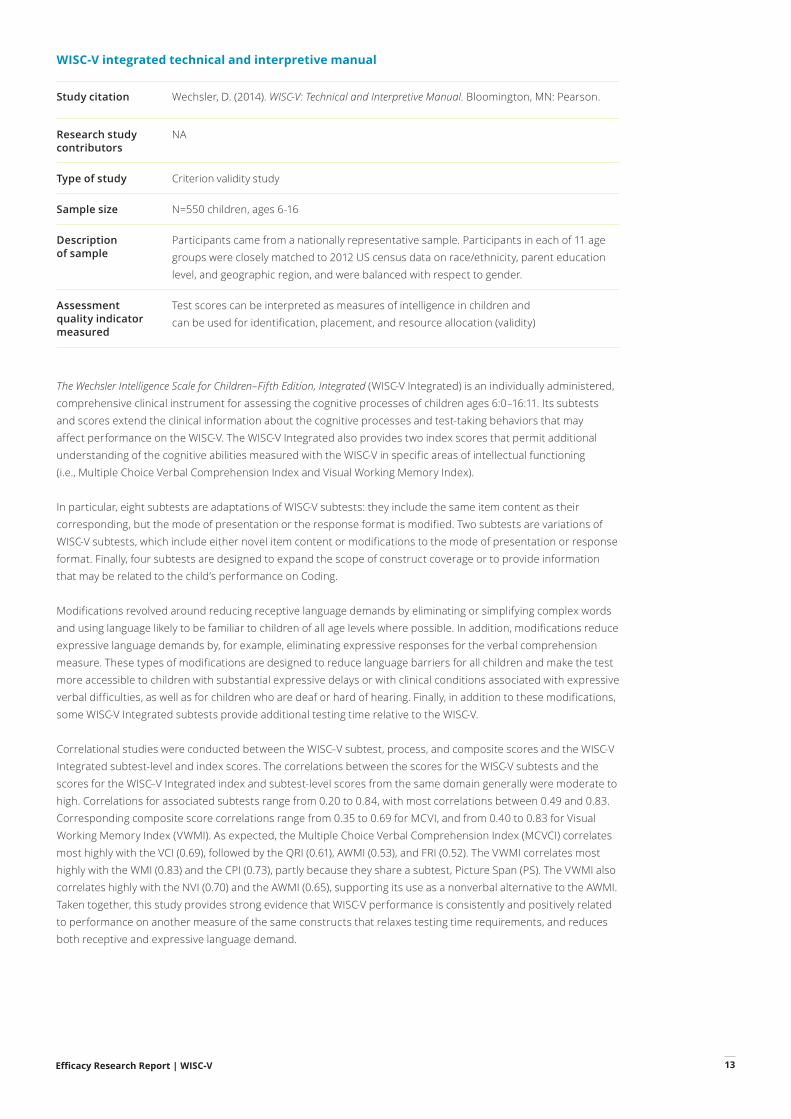
The Wechsler Intelligence Scale for Children–Fifth Edition, Integrated (WISC-V Integrated) is an individually administered, comprehensive clinical instrument for assessing the cognitive processes of children ages 6:0–16:11. Its subtests and scores extend the clinical information about the cognitive processes and test-taking behaviors that may affect performance on the WISC-V. The WISC-V Integrated also provides two index scores that permit additional understanding of the cognitive abilities measured with the WISC-V in specific areas of intellectual functioning (i.e., Multiple Choice Verbal Comprehension Index and Visual Working Memory Index).
In particular, eight subtests are adaptations of WISC-V subtests: they include the same item content as their corresponding, but the mode of presentation or the response format is modified. Two subtests are variations of WISC-V subtests, which include either novel item content or modifications to the mode of presentation or response format. Finally, four subtests are designed to expand the scope of construct coverage or to provide information that may be related to the child’s performance on Coding.
Modifications revolved around reducing receptive language demands by eliminating or simplifying complex words and using language likely to be familiar to children of all age levels where possible. In addition, modifications reduce expressive language demands by, for example, eliminating expressive responses for the verbal comprehension measure. These types of modifications are designed to reduce language barriers for all children and make the test more accessible to children with substantial expressive delays or with clinical conditions associated with expressive verbal difficulties, as well as for children who are deaf or hard of hearing. Finally, in addition to these modifications, some WISC-V Integrated subtests provide additional testing time relative to the WISC-V.
Correlational studies were conducted between the WISC–V subtest, process, and composite scores and the WISC-V Integrated subtest-level and index scores. The correlations between the scores for the WISC-V subtests and the scores for the WISC–V Integrated index and subtest-level scores from the same domain generally were moderate to high. Correlations for associated subtests range from 0.20 to 0.84, with most correlations between 0.49 and 0.83. Corresponding composite score correlations range from 0.35 to 0.69 for MCVI, and from 0.40 to 0.83 for Visual Working Memory Index (VWMI). As expected, the Multiple Choice Verbal Comprehension Index (MCVCI) correlates most highly with the VCI (0.69), followed by the QRI (0.61), AWMI (0.53), and FRI (0.52). The VWMI correlates most highly with the WMI (0.83) and the CPI (0.73), partly because they share a subtest, Picture Span (PS). The VWMI also correlates highly with the NVI (0.70) and the AWMI (0.65), supporting its use as a nonverbal alternative to the AWMI. Taken together, this study provides strong evidence that WISC-V performance is consistently and positively related to performance on another measure of the same constructs that relaxes testing time requirements, and reduces both receptive and expressive language demand.
Study citation Wechsler, D. (2014). WISC -V: Technical and Interpretive Manual. Bloomington, MN: Pearson.
Research study contributors
NA
Type of study Criterion validity study
Sample size N=550 children, ages 6-16
Description of sample
Participants came from a nationally representative sample. Participants in each of 11 age groups were closely matched to 2012 US census data on race/ethnicity, parent education level, and geographic region, and were balanced with respect to gender.
Assessment quality indicator measured
Test scores can be interpreted as measures of intelligence in children and can be used for identification, placement, and resource allocation (validity)
WISC-V integrated technical and interpretive manual
Efficacy Research Report | WISC-V 14
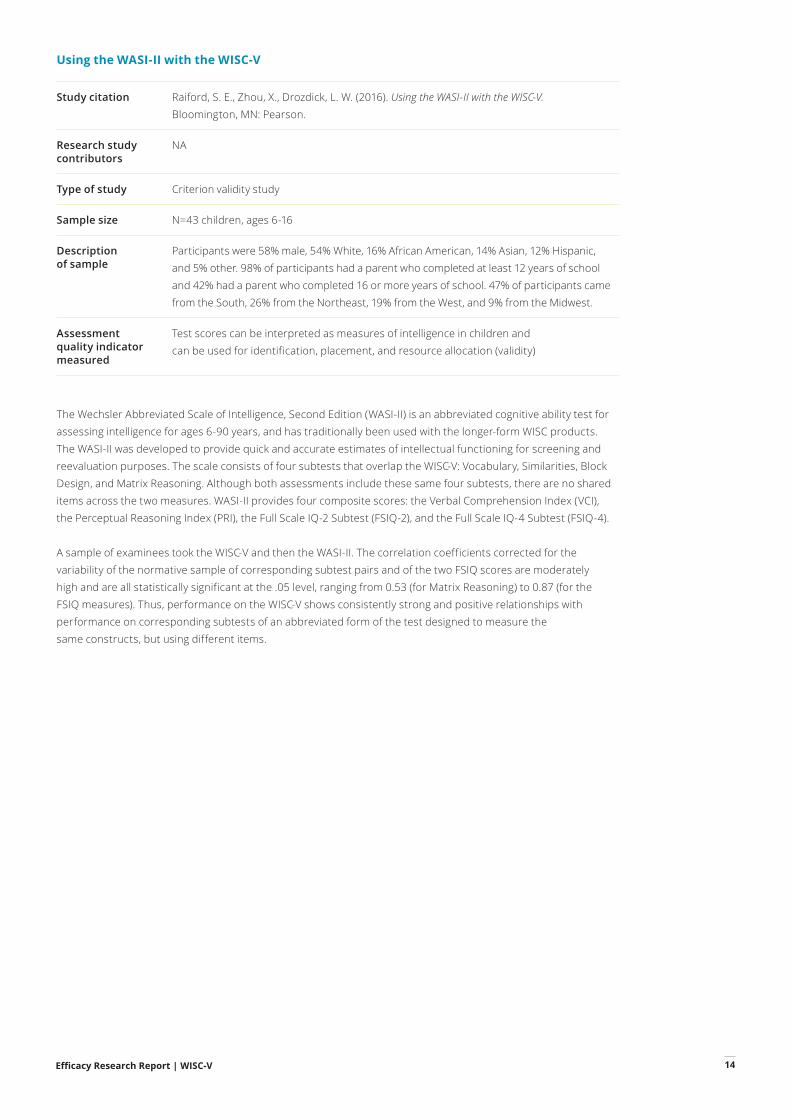
Using the WASI-II with the WISC-V
The Wechsler Abbreviated Scale of Intelligence, Second Edition (WASI-II) is an abbreviated cognitive ability test for assessing intelligence for ages 6-90 years, and has traditionally been used with the longer-form WISC products. The WASI-II was developed to provide quick and accurate estimates of intellectual functioning for screening and reevaluation purposes. The scale consists of four subtests that overlap the WISC-V: Vocabulary, Similarities, Block Design, and Matrix Reasoning. Although both assessments include these same four subtests, there are no shared items across the two measures. WASI-II provides four composite scores: the Verbal Comprehension Index (VCI), the Perceptual Reasoning Index (PRI), the Full Scale IQ-2 Subtest (FSIQ-2), and the Full Scale IQ-4 Subtest (FSIQ-4).
A sample of examinees took the WISC-V and then the WASI-II. The correlation coefficients corrected for the variability of the normative sample of corresponding subtest pairs and of the two FSIQ scores are moderately high and are all statistically significant at the .05 level, ranging from 0.53 (for Matrix Reasoning) to 0.87 (for the FSIQ measures). Thus, performance on the WISC-V shows consistently strong and positive relationships with performance on corresponding subtests of an abbreviated form of the test designed to measure the same constructs, but using different items.
Study citation Raiford, S. E., Zhou, X., Drozdick, L. W. (2016). Using the WASI-II with the WISC-V. Bloomington, MN: Pearson.
Research study contributors
NA
Type of study Criterion validity study
Sample size N=43 children, ages 6-16
Description of sample
Participants were 58% male, 54% White, 16% African American, 14% Asian, 12% Hispanic, and 5% other. 98% of participants had a parent who completed at least 12 years of school and 42% had a parent who completed 16 or more years of school. 47% of participants came from the South, 26% from the Northeast, 19% from the West, and 9% from the Midwest.
Assessment quality indicator measured
Test scores can be interpreted as measures of intelligence in children and can be used for identification, placement, and resource allocation (validity)
Efficacy Research Report | WISC-V 15
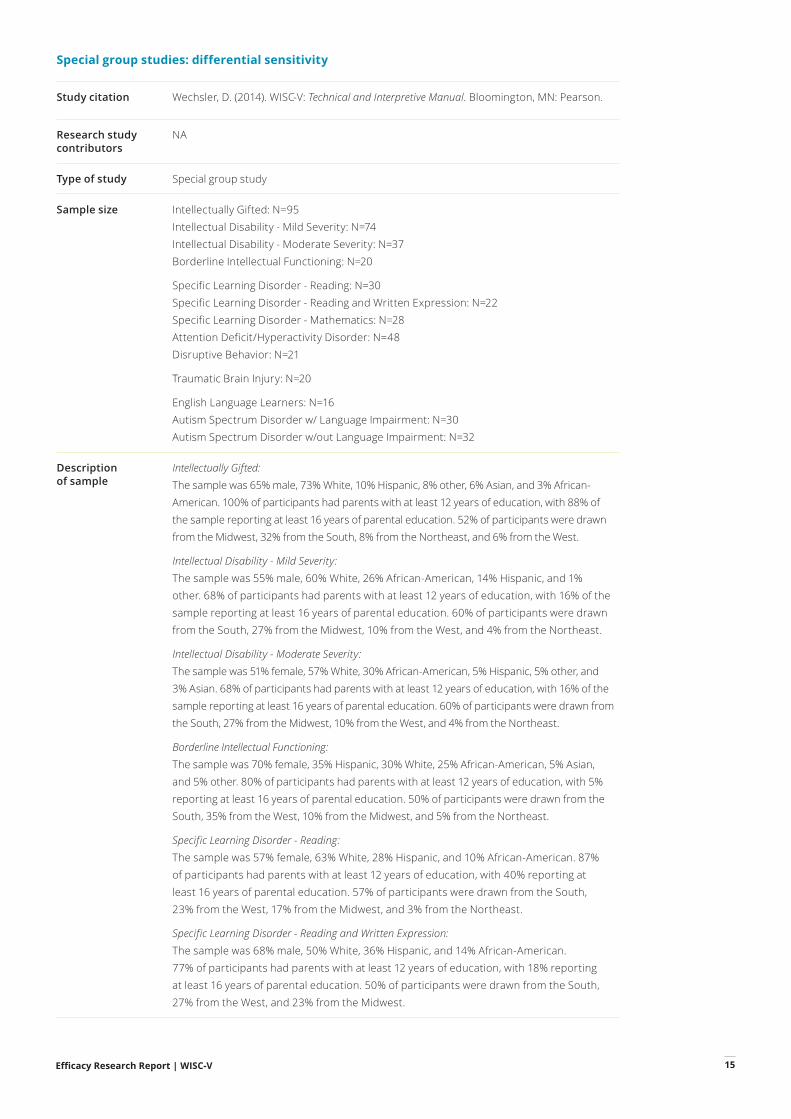
Special group studies: differential sensitivity
Study citation Wechsler, D. (2014). WISC -V: Technical and Interpretive Manual. Bloomington, MN: Pearson.
Research study contributors
NA
Type of study Special group study
Sample size Intellectually Gifted: N=95Intellectual Disability - Mild Severity: N=74 Intellectual Disability - Moderate Severity: N=37 Borderline Intellectual Functioning: N=20
Specific Learning Disorder - Reading: N=30Specific Learning Disorder - Reading and Written Expression: N=22Specific Learning Disorder - Mathematics: N=28 Attention Deficit/Hyperactivity Disorder: N=48 Disruptive Behavior: N=21
Traumatic Brain Injury: N=20
English Language Learners: N=16Autism Spectrum Disorder w/ Language Impairment: N=30Autism Spectrum Disorder w/out Language Impairment: N=32
Description of sample
Intellectually Gifted: The sample was 65% male, 73% White, 10% Hispanic, 8% other, 6% Asian, and 3% African- American. 100% of participants had parents with at least 12 years of education, with 88% of the sample reporting at least 16 years of parental education. 52% of participants were drawn from the Midwest, 32% from the South, 8% from the Northeast, and 6% from the West.
Intellectual Disability - Mild Severity: The sample was 55% male, 60% White, 26% African- American, 14% Hispanic, and 1% other. 68% of participants had parents with at least 12 years of education, with 16% of the sample reporting at least 16 years of parental education. 60% of participants were drawn from the South, 27% from the Midwest, 10% from the West, and 4% from the Northeast.
Intellectual Disability - Moderate Severity: The sample was 51% female, 57% White, 30% African -American, 5% Hispanic, 5% other, and 3% Asian. 68% of participants had parents with at least 12 years of education, with 16% of the sample reporting at least 16 years of parental education. 60% of participants were drawn from the South, 27% from the Midwest, 10% from the West, and 4% from the Northeast.
Borderline Intellectual Functioning: The sample was 70% female, 35% Hispanic, 30% White, 25% African -American, 5% Asian, and 5% other. 80% of participants had parents with at least 12 years of education, with 5% reporting at least 16 years of parental education. 50% of participants were drawn from the South, 35% from the West, 10% from the Midwest, and 5% from the Northeast.
Specific Learning Disorder - Reading: The sample was 57% female, 63% White, 28% Hispanic, and 10% African -American. 87% of participants had parents with at least 12 years of education, with 40% reporting at least 16 years of parental education. 57% of participants were drawn from the South, 23% from the West, 17% from the Midwest, and 3% from the Northeast.
Specific Learning Disorder - Reading and Written Expression: The sample was 68% male, 50% White, 36% Hispanic, and 14% African -American. 77% of participants had parents with at least 12 years of education, with 18% reporting at least 16 years of parental education. 50% of participants were drawn from the South, 27% from the West, and 23% from the Midwest.
Efficacy Research Report | WISC-V 16
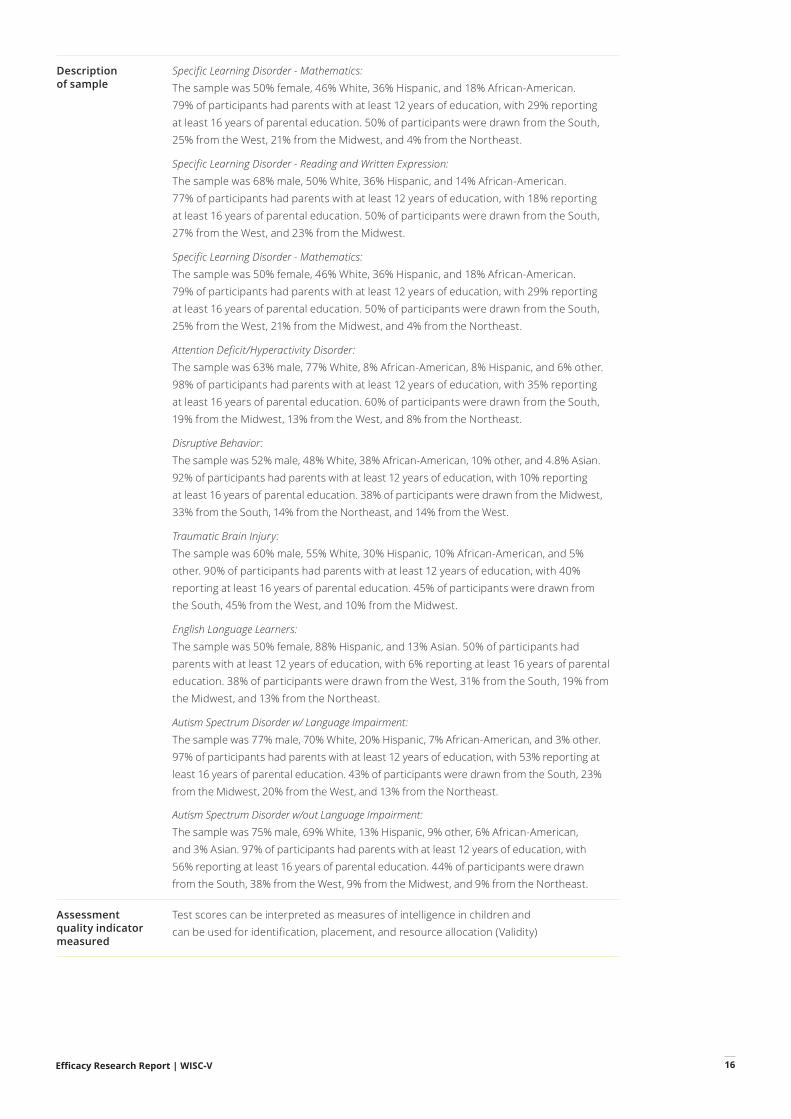
Description of sample
Specific Learning Disorder - Mathematics: The sample was 50% female, 46% White, 36% Hispanic, and 18% African- American. 79% of participants had parents with at least 12 years of education, with 29% reporting at least 16 years of parental education. 50% of participants were drawn from the South, 25% from the West, 21% from the Midwest, and 4% from the Northeast.
Specific Learning Disorder - Reading and Written Expression: The sample was 68% male, 50% White, 36% Hispanic, and 14% African -American. 77% of participants had parents with at least 12 years of education, with 18% reporting at least 16 years of parental education. 50% of participants were drawn from the South, 27% from the West, and 23% from the Midwest.
Specific Learning Disorder - Mathematics: The sample was 50% female, 46% White, 36% Hispanic, and 18% African- American. 79% of participants had parents with at least 12 years of education, with 29% reporting at least 16 years of parental education. 50% of participants were drawn from the South, 25% from the West, 21% from the Midwest, and 4% from the Northeast.
Attention Deficit/Hyperactivity Disorder: The sample was 63% male, 77% White, 8% African -American, 8% Hispanic, and 6% other. 98% of participants had parents with at least 12 years of education, with 35% reporting at least 16 years of parental education. 60% of participants were drawn from the South, 19% from the Midwest, 13% from the West, and 8% from the Northeast.
Disruptive Behavior: The sample was 52% male, 48% White, 38% African -American, 10% other, and 4.8% Asian. 92% of participants had parents with at least 12 years of education, with 10% reporting at least 16 years of parental education. 38% of participants were drawn from the Midwest, 33% from the South, 14% from the Northeast, and 14% from the West.
Traumatic Brain Injury: The sample was 60% male, 55% White, 30% Hispanic, 10% African- American, and 5% other. 90% of participants had parents with at least 12 years of education, with 40% reporting at least 16 years of parental education. 45% of participants were drawn from the South, 45% from the West, and 10% from the Midwest.
English Language Learners: The sample was 50% female, 88% Hispanic, and 13% Asian. 50% of participants had parents with at least 12 years of education, with 6% reporting at least 16 years of parental education. 38% of participants were drawn from the West, 31% from the South, 19% from the Midwest, and 13% from the Northeast.
Autism Spectrum Disorder w/ Language Impairment: The sample was 77% male, 70% White, 20% Hispanic, 7% African- American, and 3% other. 97% of participants had parents with at least 12 years of education, with 53% reporting at least 16 years of parental education. 43% of participants were drawn from the South, 23% from the Midwest, 20% from the West, and 13% from the Northeast.
Autism Spectrum Disorder w/out Language Impairment: The sample was 75% male, 69% White, 13% Hispanic, 9% other, 6% African- American, and 3% Asian. 97% of participants had parents with at least 12 years of education, with 56% reporting at least 16 years of parental education. 44% of participants were drawn from the South, 38% from the West, 9% from the Midwest, and 9% from the Northeast.
Assessment quality indicator measured
Test scores can be interpreted as measures of intelligence in children and can be used for identification, placement, and resource allocation (Validity)
Efficacy Research Report | WISC-V 17
Several special group studies were conducted concurrently with WISC-V standardization to determine if the constructs measured by the scale perform as expected in selected criterion groups with known characteristics. Participants were drawn from a variety of clinical settings and were accepted for participation in special group samples based on specified inclusion criteria, including a positive diagnosis for that particular disorder. Comparison groups were derived from the WISC-V normative sample and were matched to each clinical group according to age, sex, race/ethnicity, and parent education level. Control subjects were then randomly selected from the comparison groups. For each group, researchers calculated an effect size between the clinical and comparison groups, which equals the standardized mean performance difference between the two groups, and provides an indication of the sensitivity of the WISC -V to that particular diagnostic group. Effect sizes for the different groups were as follows (with significance reported at the p<.05 or p<.01 level):
— Intellectually gifted students significantly outperformed their matched control counterparts on all WISC -V subtests and composites, with effect sizes ranging from 0.39 to 2.05.
— Children with mild intellectual disability scored significantly lower than their matched control counterparts on all WISC -V subtests and composites, with effect sizes ranging from 1.23 to 3.02.
— Children with moderate intellectual disability scored significantly lower than their matched control counterparts on all WISC -V subtests and composites, with effect sizes ranging from 1.23 to 3.63.
— All primary index scores except one were significantly lower for children with borderline intellectual functioning compared to the means of the matched control group, and most subtest scores were also significantly lower for this group.
— Children with specific learning disorder-reading (SLD-R) earned significantly lower primary index scores than their matched control counterparts and most subtests were also significantly lower for this group, with the largest effect sizes observed for the Working Memory and Verbal Comprehension indices.
— Children with specific learning disorder-reading and writing had similar results to the SLD- R group, where working memory, naming speed, and paired associate learning tasks demonstrated moderate to large effects relative to the matched control group.
— Children with specific learning disorder-mathematics (SLD-M) earned significantly lower scores than their matched control group counterparts for all primary and ancillary indices but one, with the largest differences observed for quantitative, conceptual, and spatial reasoning, verbal working memory, and paired associate learning and recall.
— Children with ADHD earned significantly lower scores than their matched control group counterparts on the Verbal Comprehension, Working Memory, and Processing Speed indices, with a pattern of significant subtest differences indicating specific difficulty with working memory, graphomotor processing speed, and automaticity of naming.
— Children with traumatic brain injury earned significantly lower scores than their matched control group counterparts for all primary and ancillary index scores, with the largest effect sizes for the Visual Spatial, Fluid Reasoning, and Working Memory indices.
— Children who are English Language Learners scored significantly lower than their matched control counterparts on the Verbal Comprehension and Working Memory indices, as well as the Full Scale IQ, whereas index scores containing subtests requiring minimal expressive language and reduced receptive language abilities showed no significant differences between groups.
— Children with Autism Spectrum Disorder with accompanying language impairment scored significantly lower than their matched control counterparts on all primary indices, with the largest effect sizes for the Working Memory and Verbal Comprehension indices.
— Children with Autism Spectrum Disorder without accompanying language impairment performed similarly on the primary index scores to those in the control group, with the exception of the Working Memory Index.
Efficacy Research Report | WISC-V 18
Study citation Costa, E. B. Adams, Day, L. A., & Raiford, S. E. (2016). WISC–V special group study: Children with hearing differences who utilize spoken language and have assistive technology. Bloomington, MN: Pearson.
Research study contributors
The River School/River REACH Clinic
Gallaudet University
Type of study Special group study
Sample size N=15 children, 6-8 years of age, with hearing differences
Description of sample
The sample was 60% male, 40% White, 20% Asian, 20% Other, 13% African-American, and 7% Hispanic. 100% of participants had parents with at least some college or technical school, and 80% of participants had parents holding a Bachelor’s degree. 100% of participants came from the South.
Participants included children with hearing loss falling within at least the mild range unilaterally, who use either a cochlear implant or hearing aid.
Assessment quality indicator measured
Test scores can be interpreted as measures of intelligence in children and can be used for identification, placement, and resource allocation (validity)
It should be noted that the clinical samples were not randomly selected but were recruited based on availability. Thus, these studies may not be representative of the WISC-V performance of all children in the diagnostic category. Moreover, the diagnoses of children within the same special group might have been made on the basis of different criteria and procedures, and the sample sizes for some of the studies are small and cover only a portion of the WISC-V age range. Only group performance is reported. Finally, the technical manual cautions that scores on the WISC-V should never be used as the sole criteria for diagnostic or classification purposes. Nonetheless, this collection of special studies demonstrates that the WISC-V is sensitive to performance differences of learners in various clinical reference groups, with the patterns of score differences consistent with each diagnostic category, thus providing support for the diagnostic utility of the WISC-V in identifying children with learning disabilities, neurodevelopmental disorders, or intellectual giftedness.
WISC-V Special group study: children with hearing differences who utilize spoken language and have assistive technology
Researchers conducted a special study to examine WISC-V performance of learners with hearing impairments. Previous research and theory suggest that working memory is critical to the development of spoken language (Gupta & MacWhinney, 1997), and correlations have been found between working memory and language development in children with hearing differences (Hansson, Forsberg, Löfqvist, Mäki-Torkko, & Sahlén, 2004; Pisoni & Geers, 2000). Previous studies of children who use listening and spoken English as a preferred communication modality and utilize hearing aids and/or cochlear implants (Costa, Day, & Raiford, 2016) have demonstrated lower performance on verbally-based subtests that required greater language output (i.e., Similarities, Vocabulary, and Comprehension) as compared to those with little to no expressive output. Significant differences were also seen on some measures of fluid reasoning and working memory.
Efficacy Research Report | WISC-V 19
Study citation Kaufman, A. S., Raiford, S. E., & Coalson, D. L. (2016). Intelligent testing with the WISC-V. John Wiley & Sons.
Research study contributors
NA
Type of study Descriptive and correlational
Sample size Demographic analysis sample N=2,198
Risk factors analysis sample sizes— Academic-Q Questionnaire sample size=2,226— Behavior-Q Questionnaire sample size=2,327
Scatter analysis sample— Normative sample N=2,198— Clinical sample N=461— Nonclinical N=2,882
Description of sample
Each sample was drawn from the nationally representative standardization sample. Participants in each of 11 age groups were closely matched to 2012 US census data on race/ethnicity, parent education level, and geographic region, and were balanced with respect to gender.
The risk factors analysis sample excluded all clinical and intellectually-gifted learners.
Assessment quality indicator measured
Test scores can be interpreted as measures of intelligence in children and can be used for identification, placement, and resource allocation (validity)
All of the WISC-V primary subtests from the final edition were administered to matched samples of learners. Comparison groups were derived from the WISC-V normative sample and were matched to each clinical group according to age, sex, race/ethnicity, and parent education level. Control subjects were then randomly selected from the comparison groups. Researchers calculated an effect size between the hearing impaired and comparison groups, which equals the standardized mean performance difference between the two groups, and provides an indication of the sensitivity of the WISC -V. Effect sizes were as follows (with significance reported at the p<.05 level):
— With the exception of the WMI and the AWMI, none of the mean composite scores are significantly different between the hearing differences group and the matched control group
— The WMI and AWMI differences show large effect sizes of 1.04 and 1.02, respectively— The hearing impaired group scored significantly lower on Comprehension and Picture Span
than did the matched control group, with effect sizes of 0.98 and 0.91, respectively
Thus, these results replicate previous research on cochlear implant users that demonstrated lower scores on subtests from the Verbal Comprehension domain. In addition, these findings are consistent with previous research that demonstrates vulnerability in the area of verbal working memory for children with hearing differences (Geraci, Gozzi, Papagno, & Cecchetto, 2008). It should be noted that that the sample was one of convenience, and included children who use appropriate technology and receive specialized educational services and supports. Further, the sample was small and not necessarily representative in several demographic factors (e.g., parental education, geographic region). Nevertheless, results from this study support the conclusion that the WISC-V is sensitive to performance differences exhibited by hearing impaired individuals with access to high-quality assistive devices and ideal levels of educational support.
Intelligent testing with the WISC-V
Efficacy Research Report | WISC-V 20
Performance trends by demographic groups
Previous research has demonstrated several consistent trends in performance on tests of cognitive ability for different subgroups:
— Males and females tend to perform differently on measures of cognitive ability, although the nature and magnitude of these differences evolves over the lifespan (e.g., Keith, Reynolds, Roberts, Winter, & Austin, 2011; Lynn & Irwing, 2008; Preiss & Fránová, 2006)
— Socioeconomic status, as measured by a variety of proxy variables, is strongly associated with performance on cognitive ability tests from infancy through adolescence (e.g., Sellers, Burns, & Guyrke, 1996; Von Stumm & Plomin, 2015)
— There are performance differences among White, African-American, and Hispanic test-takers, although the magnitude of these differences varies by age, and the differences can be at least partially attenuated by controlling for socioeconomic status (e.g., Arinoldo, 1981; Sellers et al., 1996)
Researchers analyzed the WISC-V performance of several subgroups using the normative sample. First, they computed the mean male-female difference on all composite scores to identify those exhibiting significant sex-related differences (at p<.05 or p<.01). Researchers concluded that the WISC-V Working Memory Index, Processing Speed Index, FSIQ, Nonverbal Index, Cognitive Proficiency Index, and Symbol Translation Index are significantly higher in female than in male children, and the Quantitative Reasoning Index is significantly higher in male than in female children. However, with the exception of the Processing Speed Index and the Cognitive Proficiency Index, the magnitude of mean differences is small (i.e., most differences are less than 1.5 points). The Verbal Comprehension Index, Visual Spatial Index, Auditory Working Memory Index, General Ability Index, Naming Speed Index, and Storage and Retrieval Index showed no significant sex differences.
Next, researchers computed mean score differences among test-takers with different parental education levels as a proxy indicator for socioeconomic status. Differences between all levels were statistically significant at the p<.001 level and favored children with higher parental education levels. This effect was strongest for composites that depend on verbal ability — the General Ability Index, FSIQ, and the Verbal Comprehension Index.
Finally, researchers computed mean composite score differences among White, African-American, Asian, Hispanic, and Other test-takers. Before adjusting for sex and parental education level, Asian and White test-takers tend to outperform their African-American, Hispanic, and Other counterparts on all composites. Combined, sex and parental education account for between 3.5% and 19.5% of the variance in composite scores. However, even when subgroup means were adjusted for sex and parental education level, there were still performance differences between groups, with the largest amount of residual variance attributable to race/ethnicity for the Visual Spatial Index, General Ability Index, Verbal Comprehension Index, and FSIQ. The differences between White and African-American test-takers were the largest, with significant differences persisting on all composite scores, and the largest differences observed for measures of crystallized ability and acquired knowledge. Even where large differences persist, however, the percentage of variance attributable to race/ethnicity is relatively small, ranging from 1% to 6%. White and Hispanic group score differences are noticeably smaller after adjusting for sex and parental education level, and may no longer be practically meaningful.
Taken together, this analysis of performance trends of various subgroups of test-takers shows consistent results with previous literature on subgroup differences that manifest on measures of cognitive ability and their relationship to socioeconomic status, providing support for the WISC-V as a measure of cognitive ability.
Relationship to academic and behavioral risk factors
Previous research on academic failure and delinquency has identified a large number of risk factors that predict a learner’s likelihood of dropping out of school or engaging in criminal behavior (Andrews & Bonta, 2010; Casillas, Robbins, Allen, Kuo, Hanson, & Schmeiser, 2012; Quist & Matshazi, 2000). Such factors include both static factors (e.g., age, gender, race, history of abuse) and dynamic factors (e.g., motivation, school attendance, current substance abuse). Having specific learning disabilities, low cognitive ability, and poor attention span have all been linked to academic failure, which is itself a risk factor for delinquency (Hinshaw, 1992; Howse, Calkins, Anastopoulos, Keane, & Shelton, 2003; Leech, Day, Richardson, & Goldschmidt, 2003). Family-level risk factors, such as low income, single-parent households, and low parental education have also been shown to be important predictors of academic failure (Carlson & Corcoran, 2001; Rauh, et al., 2003).
Efficacy Research Report | WISC-V 21
Researchers designed two new risk assessments: the Child and Adolescent Academic Questionnaire (Academic-Q), containing items related to risk factors for school failure, and the Child and Adolescent Behavior Questionnaire (Behavior-Q), containing items related to risk factors for delinquency and criminal behavior. Instruments were based on an extensive review of the academic and delinquency risk research and included both static and dynamic factors, as well as both individual-level and family-level risk factors.
Researchers computed correlations between Academic-Q and Behavior-Q composites with the WISC-V FSIQ. Results showed that in the full sample, FSIQ correlated -0.50 with the Academic-Q, which means that academic risk factors predict 25% of the variance in the FSIQ. The correlation with Behavior-Q was much smaller (r=-.12), demonstrating that less than 2% of the variance in IQ scores is accounted for by delinquency risk factors. This pattern of results is consistent with previous literature on the relationship between cognitive ability measures and academic and delinquency outcomes in children and adolescents, providing support for the WISC-V as a measure of cognitive ability.
Scatter analysis
Scatter refers to the degree of variability across, between, and within composite and subtest scores, and has long been a topic of interest for the Wechsler family of assessments (Matarazzo, Daniel, Prifitera, & Herman, 1988; McLean, Kaufman, & Reynolds, 1989; Wechsler, 1991; Wechsler, 2003) . Traditionally, scatter analysis has been used to inform comparison of different types of scores as a way of identifying relative cognitive strengths and weaknesses. The concept of normative base rates is important in any discussion of scatter, and captures the degree of variability in scores for nonclinical samples.
Researchers investigated the prevalence of scatter in the normative sample using the index range, calculated by subtracting the lowest primary index score from the highest. The mean index range and standard deviations (SDs) were calculated separately for each age level, gender, parental education level, and racial/ethnic category. The means and SDs were highly consistent across these groups, with mean differences hovering around 25 points and SDs of approximately 10 points. This result suggests that the large amount of scatter in the index scores cannot be attributed to demographic factors. Researchers also computed index ranges for different clinical groups and the intellectually gifted. Results suggest that all but one of the special groups (those with intellectual disabilities) exhibit mean index ranges consistent with the “normal” range of about 25. Moreover, researchers found that 18% of learners in the normative sample earned three or more significant differences between primary indexes and their FSIQ, and only a few clinical groups (intellectually gifted, children with intellectual disability) demonstrated rates that were substantially different from this.
Researchers replicated this analysis with subtest scores for the 10 primary subtests to compute the mean subtest range across demographic groups. Once again, mean ranges were quite similar across demographic groups (hovering around 7 +/- 2 points) and were consistent with previous estimates of subtest ranges for the Wechsler assessments. Similarly, subtest scatter for most special groups (excluding children with intellectual disability) was comparable to that for both the normative and non clinical samples. Once again, as many as 17% of learners in the normative sample earned four or more significant differences between primary subtest scores, and results for most special groups did not differ much.
Given the relatively large amount of scatter in the normative sample, as well as the similarity in scatter for many clinical and special groups, the researchers conclude that scatter may not be useful in terms of enhancing clinical diagnosis; however, when coupled with base rate information — which is provided in the WISC-V manual — scatter is important for supporting accurate interpretation of strengths and weaknesses relative to a “normal” population.
These results are consistent with previous research showing a large degree of variability in cognitive ability scores for nonclinical samples (Orsini, Pezzuti, & Hulbert, 2014), which supports the value of the WISC-V as a measure of cognitive ability. They also provide support for the practice of interpreting discrepancies in terms of significance and prevalence, which is facilitated by including WISC-V base rates in the manual. Thus, WISC-V interpretive materials enhance clinical utility.
Efficacy Research Report | WISC-V 22
Study citation Wechsler, D. (2014). WISC -V: Technical and Interpretive Manual. Bloomington, MN: Pearson.
Research study contributors
NA
Type of study Correlational
Sample size N=2,200 participants ages 6-16
Description of sample
Participants came from a nationally representative sample. Participants in each of 11 age groups were closely matched to 2012 US census data on race/ethnicity, parent education level, and geographic region and were balanced with respect to gender.
Assessment quality indicator measured
Test scores are consistent over time and/or over multiple raters (reliability)
Internal consistency reliability study
Study citation Wechsler, D. (2014). WISC -V: Technical and Interpretive Manual. Bloomington, MN: Pearson.
Research study contributors
NA
Type of study Correlational
Sample size N=2,200 participants ages 6-16
Description of sample
Participants came from a nationally representative sample. Participants in each of 11 age groups were closely matched to 2012 U.S. census data on race/ethnicity, parent education level, and geographic region and were balanced with respect to gender.
Assessment quality indicator measured
Test scores are consistent over time and/or over multiple raters (reliability)
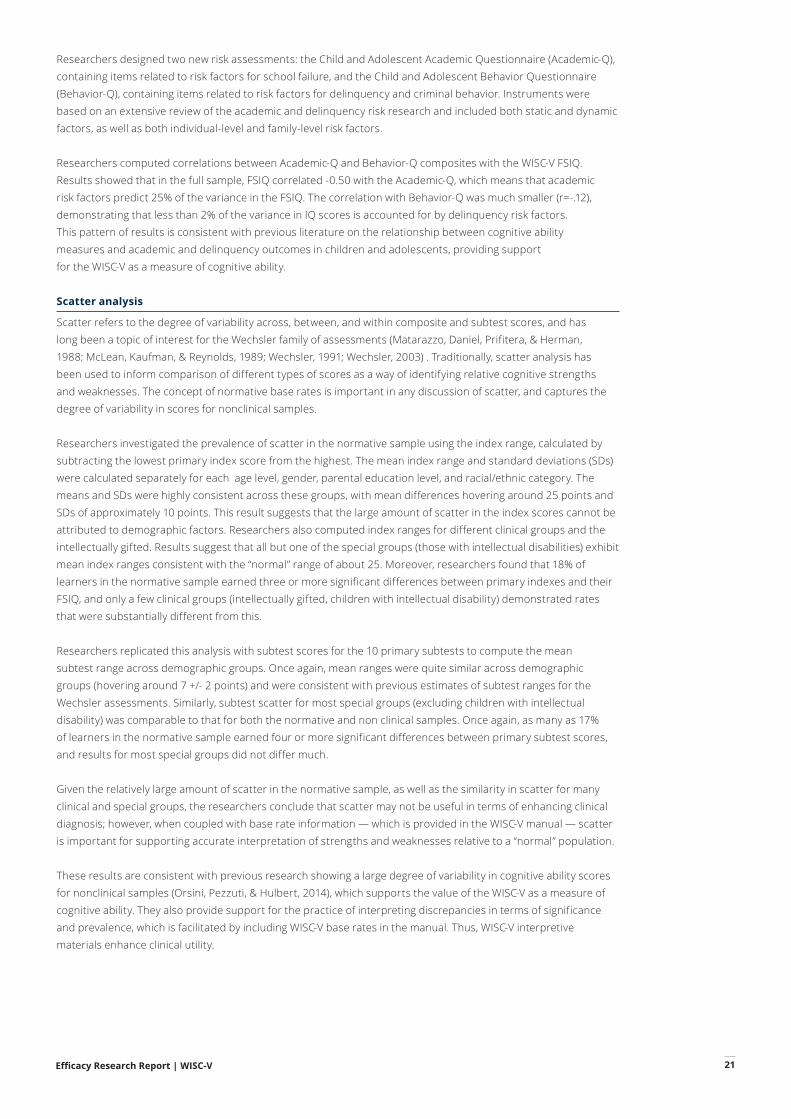
The WISC-V normative data was established using a sample collected from April 2013 to March 2014 that was stratified on key demographic variables (i.e., age, sex, race/ethnicity, parent education level, and geographic region), according to the October 2012 US census data. The sample included 2,200 participants that are representative of the US English -speaking population of children aged 6:0–16:11, as well as samples of children from 13 special groups. Split -half reliability coefficients were computed for each subtest and composite score, and were averaged across age groups using Fisher’s z transformation. For the overall normative sample, the split- half reliability of the FSIQ was 0.96, the overall average reliability coefficients for WISC-V primary index scores ranged from 0.88 to 0.93, and reliability of the individual subtests ranged from 0.80 to 0.94. Thus, composite and subtest scores demonstrate high levels of internal consistency.
Test -retest reliability study
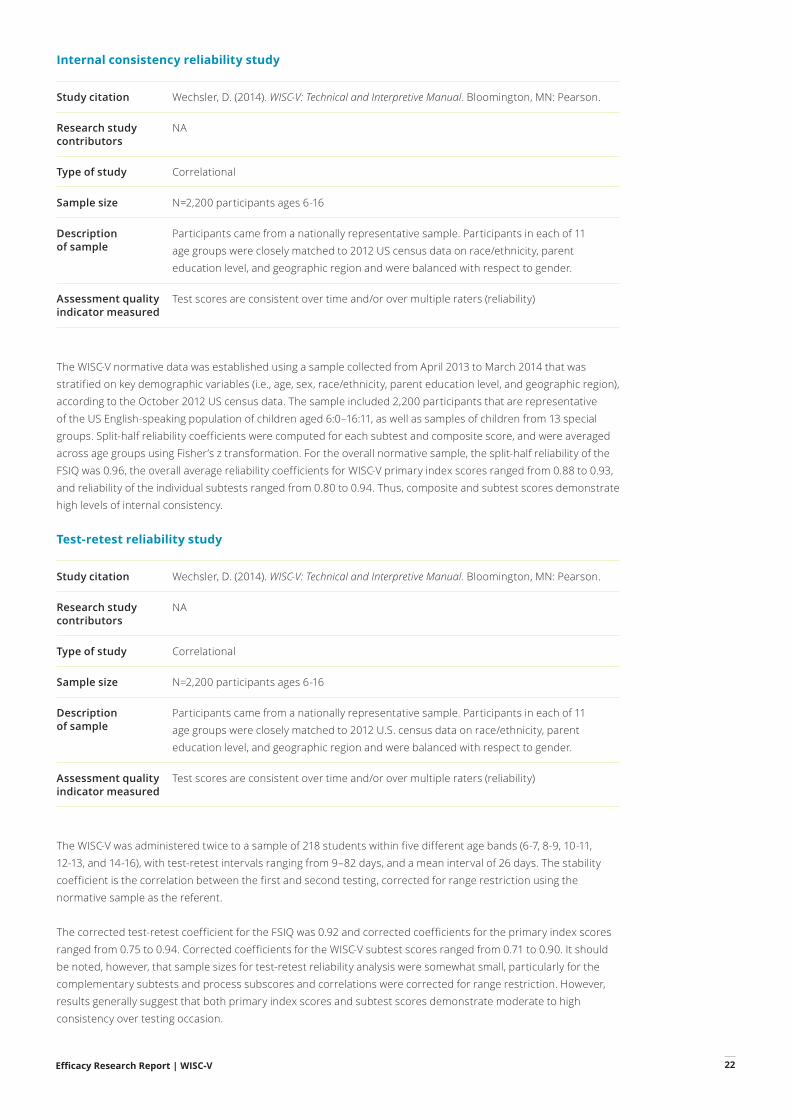
The WISC-V was administered twice to a sample of 218 students within five different age bands (6-7, 8-9, 10- 11, 12- 13, and 14- 16), with test -retest intervals ranging from 9–82 days, and a mean interval of 26 days. The stability coefficient is the correlation between the first and second testing, corrected for range restriction using the normative sample as the referent.
The corrected test -retest coefficient for the FSIQ was 0.92 and corrected coefficients for the primary index scores ranged from 0.75 to 0.94. Corrected coefficients for the WISC -V subtest scores ranged from 0.71 to 0.90. It should be noted, however, that sample sizes for test -retest reliability analysis were somewhat small, particularly for the complementary subtests and process subscores and correlations were corrected for range restriction. However, results generally suggest that both primary index scores and subtest scores demonstrate moderate to high consistency over testing occasion.
Efficacy Research Report | WISC-V 23
Study citation Wechsler, D. (2014). WISC -V: Technical and Interpretive Manual. Bloomington, MN: Pearson.
Research study contributors
NA
Type of study Correlational
Sample size N=2,200 participants ages 6-16
Description of sample
The mean age of the participants was 11.3 years. The sample was evenly split between males and females. 47% of the sample was White, 28% Hispanic, 12% African American, 8% Other, and 5% Asian. 83% of the sample reported parental educational levels of at least 12 years and 30% reported at least 16 years of parental education. 38% of the sample was drawn from the South, 28% from the West, 22% from the Midwest, and 12% from the Northeast.
Assessment quality indicator measured
Test scores are consistent over time and/or over multiple raters (reliability)
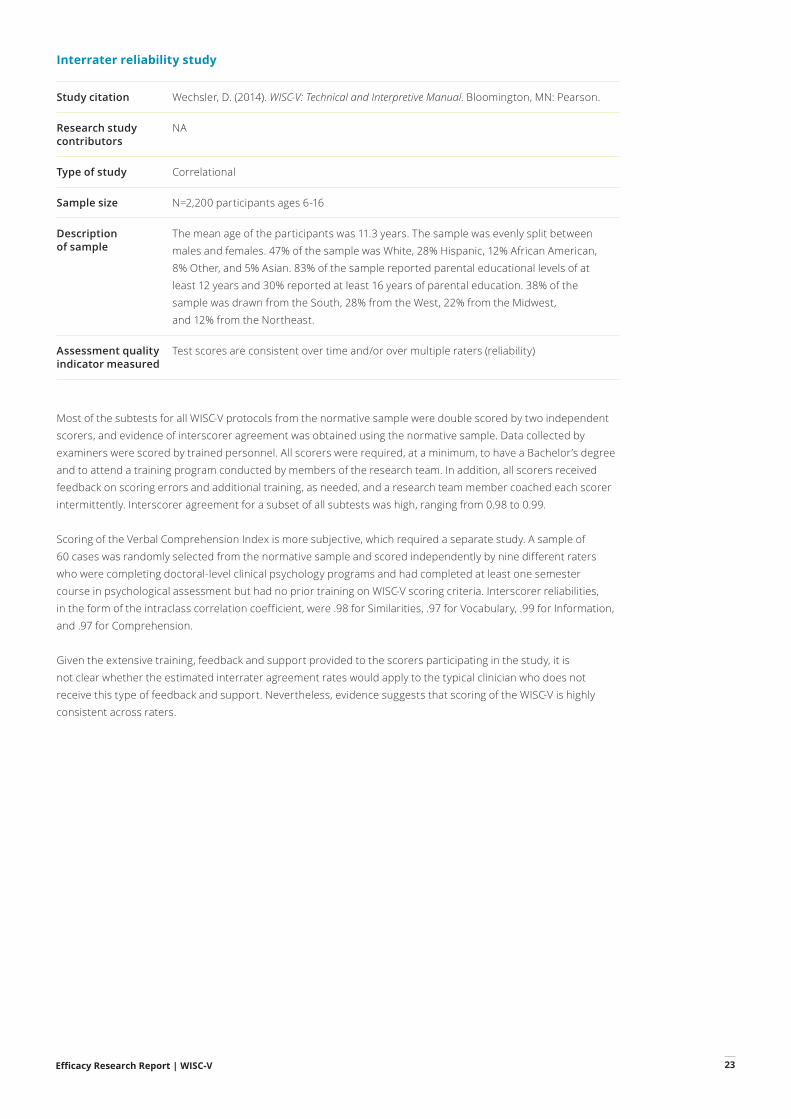
Most of the subtests for all WISC-V protocols from the normative sample were double scored by two independent scorers, and evidence of interscorer agreement was obtained using the normative sample. Data collected by examiners were scored by trained personnel. All scorers were required, at a minimum, to have a Bachelor’s degree and to attend a training program conducted by members of the research team. In addition, all scorers received feedback on scoring errors and additional training, as needed, and a research team member coached each scorer intermittently. Interscorer agreement for a subset of all subtests was high, ranging from 0.98 to 0.99.
Scoring of the Verbal Comprehension Index is more subjective, which required a separate study. A sample of 60 cases was randomly selected from the normative sample and scored independently by nine different raters who were completing doctoral- level clinical psychology programs and had completed at least one semester course in psychological assessment but had no prior training on WISC -V scoring criteria. Interscorer reliabilities, in the form of the intraclass correlation coefficient, were .98 for Similarities, .97 for Vocabulary, .99 for Information, and .97 for Comprehension.
Given the extensive training, feedback and support provided to the scorers participating in the study, it is not clear whether the estimated interrater agreement rates would apply to the typical clinician who does not receive this type of feedback and support. Nevertheless, evidence suggests that scoring of the WISC-V is highly consistent across raters.
Interrater reliability study
Efficacy Research Report | WISC-V 24
Q -interactive and paper administrations of cognitive tasks: WISC -V
Study citation Daniel, M.H., Wahlstrom, D., & Zhang, O. (2014). Equivalence of Q- interactive and Paper Administrations of Cognitive Tasks: WISC -V. Q- interactive Technical Report 8. Bloomington, MN: Pearson.
Research study contributors
NA
Type of study Equivalence Study
Sample size N=350 participants, ages 6 -16
Description of sample
Paper: The sample was 58% female, 67% White, 17% Hispanic, 10% African -American, and 6% other. 90% of participants had parents with at least 12 years of education, with 42% reporting at least 16 years of parental education. The mean age for the group was 11.1 years.
Q-Interactive: The sample was 58% female, 66% White, 18% Hispanic, 11% African -American, and 5% other. 93% of participants had parents with at least 12 years of education, with 45% reporting at least 16 years of parental education. The mean age for the group was 11.1 years.
Assessment quality indicator measured
Test scores can be interpreted the same way for test- takers of different subgroups (fairness)
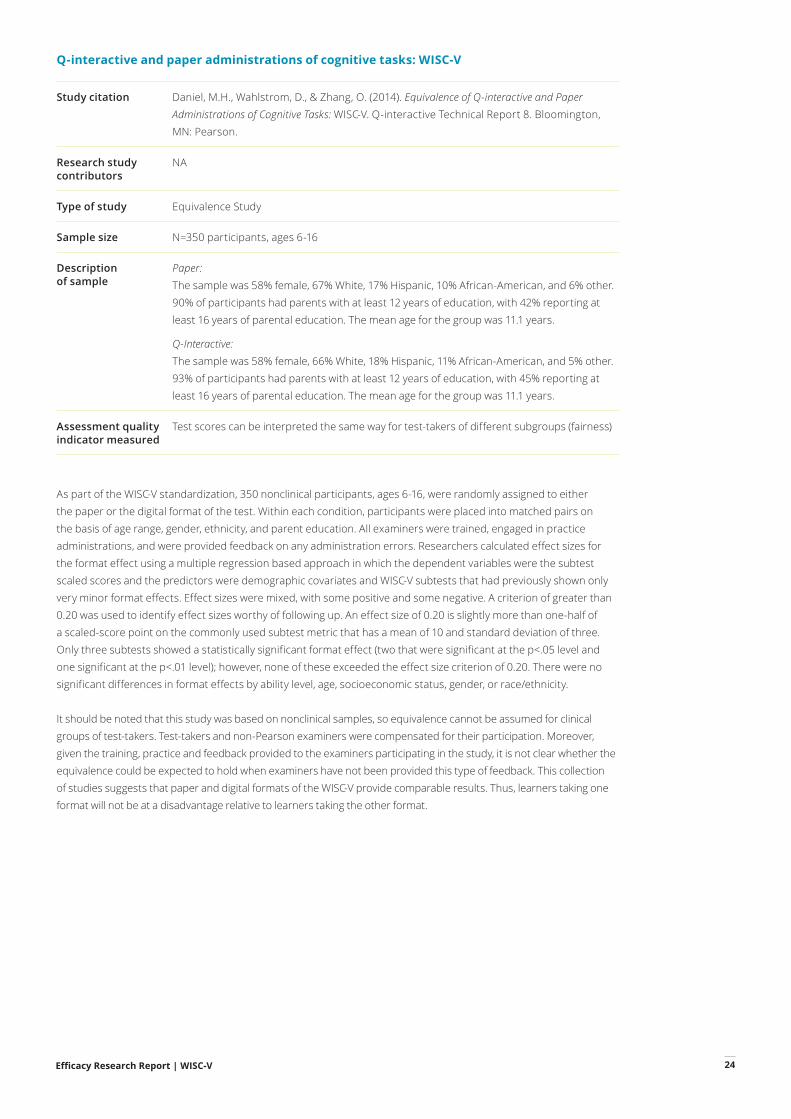
As part of the WISC -V standardization, 350 nonclinical participants, ages 6-16, were randomly assigned to either the paper or the digital format of the test. Within each condition, participants were placed into matched pairs on the basis of age range, gender, ethnicity, and parent education. All examiners were trained, engaged in practice administrations, and were provided feedback on any administration errors. Researchers calculated effect sizes for the format effect using a multiple regression based approach in which the dependent variables were the subtest scaled scores and the predictors were demographic covariates and WISC -V subtests that had previously shown only very minor format effects. Effect sizes were mixed, with some positive and some negative. A criterion of greater than 0.20 was used to identify effect sizes worthy of following up. An effect size of 0.20 is slightly more than one -half of a scaled -score point on the commonly used subtest metric that has a mean of 10 and standard deviation of three. Only three subtests showed a statistically significant format effect (two that were significant at the p<.05 level and one significant at the p<.01 level); however, none of these exceeded the effect size criterion of 0.20. There were no significant differences in format effects by ability level, age, socioeconomic status, gender, or race/ethnicity.
It should be noted that this study was based on nonclinical samples, so equivalence cannot be assumed for clinical groups of test- takers. Test- takers and non- Pearson examiners were compensated for their participation. Moreover, given the training, practice and feedback provided to the examiners participating in the study, it is not clear whether the equivalence could be expected to hold when examiners have not been provided this type of feedback. This collection of studies suggests that paper and digital formats of the WISC-V provide comparable results. Thus, learners taking one format will not be at a disadvantage relative to learners taking the other format.
Efficacy Research Report | WISC-V 25
Q -interactive special group studies: the WISC -V and children with intellectual giftedness and intellectual disability
Study citation Daniel, M.H., Wahlstrom, D., & Zhang, O. (2014). Equivalence of Q- interactive and Paper Administrations of Cognitive Tasks: WISC -V. Q- interactive Technical Report 8. Bloomington, MN: Pearson.
Research study contributors
NA
Type of study Q- interactive performance for special populations
Sample size Intellectual giftedness sample: N=24 participants, ages 6 16
Intellectual disability sample: N=22 participants, ages 7 16
Description of sample
Intellectual giftedness sample: The sample was 54% male, 71% White, 17% other, 8% Hispanic, and 4% Asian. 100% of participants had parents with at least 12 years of education, with 88% reporting at least 16 years of parental education.
Sample demographics were similar to those of the intellectually gifted sample used for the special group study conducted with the WISC -V paper format.
Intellectual disability sample: The sample was 64% male, 59% White, 18% Hispanic, 14% African -American, 5% Asian and 5% other. 73% of participants had parents with at least 12 years of education, with 46% reporting at least 16 years of parental education. Sample demographics were generally similar to those of the intellectual disability -mild severity sample used for the special group study conducted with the WISC-V paper format, with slight differences in parental education levels.
Assessment quality indicator measured
Test scores can be interpreted the same way for test- takers of different subgroups (fairness)
A special study was conducted to investigate the performance of the digital format of the WISC -V for clinical groups. The purpose of the study was to show that the digital format of the test demonstrates similar sensitivity to clinical conditions as the paper format. 24 test- takers identified as intellectually gifted and 22 test- takers identified as intellectually disabled were each matched with a non- clinical counterpart from the sample used in the first digital — paper equivalence study on the basis of age range, gender, ethnicity, and parent education. All examiners were trained, engaged in practice administrations, and were provided feedback on any administration errors. For each protocol, two independent scorers reevaluated all subjectively scored items using the final scoring rules, and an expert scorer or a member of the research team resolved any discrepancies between the two scorers as needed.
The intellectual giftedness sample outperformed the matched control sample across all composite scores and subtests. Most of these differences were significant at the p<.01 level, with Cohen’s D effect sizes ranging from 0.46 to 1.72. Moreover, the pattern of subtest effect sizes is consistent with those observed in the WISC -V paper study, and mean General Ability Index scores were identical for the intellectually gifted samples on both paper and digital formats. The intellectual disability sample earned significantly lower scores than their matched control counterparts across all primary and ancillary indices, as well as all subtests, with Cohen’s D effect sizes ranging from 1.76 to 3.86. In addition, the mean General Ability Index scores were nearly identical for the intellectual disability samples on both forms (63.7 on the digital versus 63.5 on paper).
It should be noted that test -takers and non -Pearson examiners were compensated for their participation. Moreover, given the training, practice and feedback provided to the examiners participating in the study, it is not clear whether the equivalence could be expected to hold when examiners have not been provided this type of feedback. However, this collection of studies provides further support for the comparability of paper and digital formats of the WISC-V for intellectually gifted learners and those with an intellectual disability.
Efficacy Research Report | WISC-V 26
Q -interactive special group studies: the WISC -V and children with autism spectrum disorder and accompanying language impairment or attention deficit/hyperactivity disorder
Study citation Raiford, S.E., Drozdick, L., & Zhang, O., (2015). Q- interactive special group studies: The WISC -V and children with Autism Spectrum Disorder and accompanying language impairment or Attention Deficit/Hyperactivity disorder. Q- interactive Technical Report 11. Bloomington, MN: Pearson.
Research study contributors
NA
Type of study Q- interactive performance for special populations
Sample size Autism Spectrum with accompanying language impairment sample: N=30 participants, ages 6- 16
Attention Deficit/Hyperactivity Disorder sample: N=25 participants, ages 6 -16
Description of sample
Autism Spectrum with accompanying language impairment sample: The sample was 90% male, 53% White, 27% Hispanic, 13% African American, and 7% Asian. 93% of participants had parents with at least 12 years of education, with 57% reporting at least 16 years of parental education. Sample demographics were generally similar to those of the ASD L sample used for the special group study conducted with the WISC -V paper format, although the sample was slightly more racially diverse and more male, and reported slightly lower levels of parental education.
Attention Deficit/Hyperactivity Disorder sample: The sample was 64% male, 64% White, 16% Hispanic, 16% African- American, and 4% other. 88% of participants had parents with at least 12 years of education, with 48% reporting at least 16 years of parental education. Sample demographics were generally similar to those of the ADHD sample used for the special group study conducted with the WISC-V paper format, although the sample was slightly younger and more racially diverse and reported slightly higher levels of parental education.
Assessment quality indicator measured
Test scores can be interpreted the same way for test- takers of different subgroups (fairness)
A special study was conducted to investigate the performance of digital formats of the WISC -V for clinical groups. The purpose of the study was to show that the digital format of the test demonstrates similar sensitivity to clinical conditions as the paper format. 30 test- takers identified as being on the autism spectrum with accompanying language impairment (ASD -L) and 25 test- takers identified as having ADHD were each matched with a non- clinical counterpart from the sample used in the first digital -paper equivalence study on the basis of age range, gender, ethnicity, and parent education. All examiners were trained, engaged in practice administrations, and were provided feedback on any administration errors. For each protocol, two independent scorers reevaluated all subjectively scored items using the final scoring rules, and an expert scorer or a member of the research team resolved any discrepancies between the two scorers as needed.
The ASD- L sample earned significantly lower scores (p<.01) than the matched control sample on all primary and ancillary indices, as well as all subtests, with Cohen’s D effect sizes ranging from 0.81 to 2.00. The pattern of performance differences was similar to those observed for the paper format. The mean General Ability Index scores for the ASD- L samples taking the digital and paper formats were 81.8 and 85.7, respectively.
Efficacy Research Report | WISC-V 27
The ADHD sample earned lower scores than their matched control counterparts across all primary and ancillary indices, as well as all subtests, although the only significant differences (p<.01) were for the Fluid Reasoning Index, Auditory Working Memory Index, General Ability Index, Matrix Reasoning, Letter -Number Sequencing, and Delayed Symbol Translation. Across all indices, Cohen’s D effect sizes ranged from 0.03 to 1.11. Although performance differences between ADHD examinees and the nonclinical sample were not as stark as those observed for the paper format, the direction of the differences was consistent, and the means and effect size patterns were similar. In addition, mean General Ability Index scores for the ADHD samples taking the digital and paper formats were very similar (98.8 for digital and 97.1 for paper). Furthermore, it is possible that the observed differences in sample demographics caused the disparity in results.
It should be noted that test- takers and non -Pearson examiners were compensated for their participation. Moreover, given the training, practice and feedback provided to the examiners participating in the study, it is not clear whether the equivalence could be expected to hold when examiners have not been provided this type of feedback. However, this collection of studies provides further support for the comparability of paper and digital formats of the WISC-V for ASD-L and ADHD groups.
Q -interactive special group studies: the WISC -V and children with specific learning disorders in reading or mathematics
Study citation Raiford, S.E., Drozdick, L. W., & Zhang, O., (2016). Q- interactive special group studies: The WISC -V and children with specific learning disorders in reading or mathematics. Q- interactive Technical Report 13. Bloomington, MN: Pearson.
Research study contributors
NA
Type of study Q- interactive performance for special populations
Sample size Specific Learning Disorder - Reading (SLD-R) sample: N=24 participants, ages 6- 16
Specific Learning Disorder - Mathematics (SLD-M) sample: N=23 participants, ages 8- 16
Description of sample
SLD-R sample: The sample was 63% male, 88% White, 8% Hispanic, and 4% African American. 88% of participants had parents with at least a high school diploma or equivalent, with 42% of participants having a parent with a Bachelor’s degree. Sample demographics were generally similar to those of the SLD-R sample used for the special group study conducted with the WISC -V paper format, although the sample was slightly older and more male.
SLD-M sample: The sample was 44% male, 61% White, 13% Hispanic, 13% African- American, and 13% other. 91% of participants had parents with at least a high school diploma or equivalent, with 35% of participants having a parent with a Bachelor’s degree. Sample demographics were generally similar to those of the ADHD sample used for the special group study conducted with the WISC-V paper format, although the sample was slightly younger and less racially diverse and reported slightly higher levels of parental education.
Assessment quality indicator measured
Test scores can be interpreted the same way for test- takers of different subgroups (fairness)
Efficacy Research Report | WISC-V 28
A special study was conducted to investigate the performance of a digital format of the WISC -V for clinical groups. The purpose of the study was to show that the digital format of the test demonstrates similar sensitivity to clinical conditions as the paper format. 24 test- takers identified as having SLD-R and 23 test- takers identified as having SLD-M were each matched with a non- clinical counterpart from the sample used in the first digital -paper equivalence study on the basis of age range, gender, ethnicity, and parent education. All examiners were trained, engaged in practice administrations, and were provided feedback on any administration errors. For each protocol, two independent scorers reevaluated all subjectively scored items using the final scoring rules, and an expert scorer or a member of the research team resolved any discrepancies between the two scorers as needed.
The SLD-R sample earned significantly lower scores on all primary indexes (p<.05) than the matched control sample, with the largest effect sizes seen on VCI (1.01), WMI (1.24), and AWMI (1.14). Several individual subtest scores were also significantly lower (p<.01) for the SLD-R sample than for the control sample, including Letter-Number Sequencing, Digit Span, Arithmetic, Picture Concepts, Information, Picture Span, and Similarities, with effect sizes ranging from 0.99 to 1.44. Finally, all of the complementary subtest scores were lower for the SLD-R sample than for the control sample (p<.05), with effect sizes ranging from 0.92 to 1.79. The results indicate significant difficulties with immediate paired associate learning, rapid verbal naming, verbal comprehension, and working memory. This pattern of performance differences was similar to those observed for the paper format.
The SLD-M sample earned significantly lower scores on all primary indexes (p<.01) than the matched control sample, with the largest effect sizes seen on QRI (1.50), AWMI (1.39), and WMI (1.28). All subtest scores except PC and CO were significantly lower (p<.05) for the SLD-M sample than for the control sample, with effect sizes ranging from 0.67 to 1.55. Finally, all of the complementary subtest scores except DST were significantly lower for the SLD-M sample than for the control sample (p<.05), with effect sizes ranging from 0.62 to 1.32. Overall, the results suggest that the most significant difficulties are with quantitative and spatial reasoning, auditory working memory, rapid automatic quantity naming tasks, and paired associate learning and recall. This pattern of performance differences was also similar to those observed for the paper format.
It should be noted that test- takers and non -Pearson examiners were compensated for their participation. Moreover, given the training, practice and feedback provided to the examiners participating in the study, it is not clear whether the equivalence could be expected to hold when examiners have not been provided this type of feedback. However, this collection of studies provides further support for the comparability of paper and digital formats of the WISC-V for learners with specific learning disabilities in reading and mathematics.
Efficacy Research Report | WISC-V 29
WISC -V coding and symbol search in digital format: reliability, validity, special group studies, and interpretation
Study citation Raiford, S. E., Zhang, O., Drozdick, L.W., Getz, K., Wahlstrom, D., Gabel, A., Holdnack, J. A., & Daniel, M. (2016). WISC -V Coding and Symbol Search in digital format: Reliability, validity, special group studies, and interpretation. Q- interactive Technical Report 12. Bloomington, MN: Pearson.
Research study contributors
NA
Type of study Q- interactive equivalence study and performance for special populations
Sample size Non- clinical equivalence: N=651 students ages 6 -16
Specific Learning Disorder -Reading (SLD-R): N=24 students ages 6- 16
Specific Learning Disorder -Mathematics (SLD-M): N=22 students ages 6- 16
Motor Impaired (MI): N=15 students ages 6 -16
Description of sample
Non- clinical equivalence: The sample was 52% male, and was 55% White, 24% Hispanic, 12% African- American, 7% other, and 1% Asian. 87% of participants had parents with at least 12 years of education, and one -third reported their parents had a Bachelor’s degree. 48% of the sample was drawn from the South, 25% from the West, 14% from the Northeast, and 12% from the Midwest.
SLD-R: The sample was 58% male, and was 50% Hispanic, 46% White, and 4% other. 100% of participants had parents with at least 12 years of education, and one -third reported their parents had a Bachelor’s degree. 71% of the sample was drawn from the South, 12% from the Northeast, and 8% each from the Midwest and the West.
SLD -M:The sample was 54% male, and was 54% White, 23% Hispanic, 18% African- American, and 4% other. 100% of participants had parents with at least 12 years of education, and 13% reported their parents had a Bachelor’s degree. 82% of the sample was drawn from the South, and 9% each from the Midwest and the West.
MI:The sample was 80% male, and was 80% White, 13% Hispanic, and 7% other. 93% of participants had parents with at least 12 years of education, and 47% reported their parents had a Bachelor’s degree. 73% of the sample was drawn from the South, 20% from the Northeast, and 7% from the West.
Assessment quality indicator measured
Test scores can be interpreted the same way for test- takers of different subgroups (fairness)
Using a test- retest design, 651 participants were administered both the digital and paper formats of the Processing Speed subtests, with the order of administration counterbalanced. The testing interval ranged from 14 to 72 days, with a mean testing interval of around 25 days. Researchers computed correlations between raw scores and scaled scores from these two administrations, corrected for range restriction using the normative sample as the referent. They also computed effect sizes, equal to standardized mean differences, using a criterion of 2.0 to flag substantial differences. Raw score correlations between the paper and digital formats ranged from 0.84 to 0.88, and scaled score correlations ranged from 0.63 to 0.68. There were no significant differences between scores on the two formats, suggesting that the scores from the paper and digital formats of these subtests can be considered equivalent.
Efficacy Research Report | WISC-V 30
A special study was conducted to investigate the performance of digital formats of the WISC -V for clinical groups. The purpose of the study was to show that the digital format of the test demonstrates similar sensitivity to specific learning disorders in reading and mathematics as the paper format. For motor -impaired children, the purpose of the study was to illustrate typical performance for touch response compared to written responses. 24 test- takers identified as having SLD -R, 22 test- takers identified as having SLD -M, and 15 test- takers with significant motor impairment were each matched with a non -clinical counterpart from the sample used in the scaling study on the basis of age range, gender, ethnicity, and parent education.
The SLD -R sample earned significantly lower scores (p<.05) than the matched control sample on most primary indices and the FSIQ, with Cohen’s D effect sizes ranging from 0.30 to 1.77. The SLD -M sample earned significantly lower scores than their matched control counterparts across all primary and ancillary indices (p<.05). Across all indices, Cohen’s D effect sizes ranged from 0.75 to 1.85. The MI sample earned significantly lower scores (p<.05) than the matched control sample on the Coding and Symbol Search subtests and the Processing Speed Index, with Cohen’s D effect sizes ranging from 0.81 to 0.95. For all three special groups, the pattern of performance differences was similar to those observed for the paper format, suggesting that when the Processing Speed Index subtests are administered digitally, scores are comparable to the paper format for these groups.
Efficacy Research Report | WISC-V 31
Study citation Wechsler, D. (2014). WISC -V: Technical and Interpretive Manual. Bloomington, MN: Pearson.
Research study contributors
NA
Type of study Correlational
Sample size Intellectually Gifted: N=95Intellectual Disability - Mild Severity: N=74 Intellectual Disability - Moderate Severity: N=37 Borderline Intellectual Functioning: N=20
Specific Learning Disorder - Reading: N=30Specific Learning Disorder - Reading and Written Expression: N=22Specific Learning Disorder - Mathematics: N=28 Attention Deficit/Hyperactivity Disorder: N=48 Disruptive Behavior: N=21Traumatic Brain Injury: N=20 English Language Learners: N=16Autism Spectrum Disorder w/ Language Impairment: N=30Autism Spectrum Disorder w/out Language Impairment: N=32
Description of sample
Intellectually Gifted: The sample was 65% male, 73% White, 10% Hispanic, 8% other, 6% Asian, and 3% African- American. 100% of participants had parents with at least 12 years of education, with 88% of the sample reporting at least 16 years of parental education. 52% of participants were drawn from the Midwest, 32% from the South, 8% from the Northeast, and 6% from the West.
Intellectual Disability - Mild Severity: The sample was 55% male, 60% White, 26% African- American, 14% Hispanic, and 1% other. 68% of participants had parents with at least 12 years of education, with 16% of the sample reporting at least 16 years of parental education. 60% of participants were drawn from the South, 27% from the Midwest, 10% from the West, and 4% from the Northeast.
Intellectual Disability - Moderate Severity:The sample was 51% female, 57% White, 30% African- American, 5% Hispanic, 5% other, and 3% Asian. 68% of participants had parents with at least 12 years of education, with 16% of the sample reporting at least 16 years of parental education. 60% of participants were drawn from the South, 27% from the Midwest, 10% from the West, and 4% from the Northeast.
Borderline Intellectual Functioning:The sample was 70% female, 35% Hispanic, 30% White, 25% African- American, 5% Asian, and 5% other. 80% of participants had parents with at least 12 years of education, with 5% reporting at least 16 years of parental education. 50% of participants were drawn from the South, 35% from the West, 10% from the Midwest, and 5% from the Northeast.
Specific Learning Disorder - Reading: The sample was 56.7% female, 63.3% White, 27.6% Hispanic, and 10% African- American. 86.7% of participants had parents with at least 12 years of education, with 40% reporting at least 16 years of parental education. 56.7% of participants were drawn from the South, 23.3% from the West, 16.7% from the Midwest, and 3.3% from the Northeast.
Specific Learning Disorder - Reading and Written Expression: The sample was 68% male, 50% White, 36% Hispanic, and 14% African- American. 77% of participants had parents with at least 12 years of education, with 18% reporting at least 16 years of parental education. 50% of participants were drawn from the South, 27% from the West, and 23% from the Midwest.
Internal consistency reliability: special groups study
Efficacy Research Report | WISC-V 32
Description of sample
Attention Deficit/Hyperactivity Disorder: The sample was 63% male, 77% White, 8% African- American, 8% Hispanic, and 6% other. 98% of participants had parents with at least 12 years of education, with 35% reporting at least 16 years of parental education. 60% of participants were drawn from the South, 19% from the Midwest, 13% from the West, and 8% from the Northeast.
Disruptive Behavior: The sample was 52% male, 48% White, 38% African- American, 10% other, and 4.8% Asian. 92% of participants had parents with at least 12 years of education, with 10% reporting at least 16 years of parental education. 38% of participants were drawn from the Midwest, 33% from the South, 14% from the Northeast, and 14% from the West.
Traumatic Brain Injury: The sample was 60% male, 55% White, 30% Hispanic, 10% African- American, and 5% other. 90% of participants had parents with at least 12 years of education, with 40% reporting at least 16 years of parental education.
45% of participants were drawn from the South, 45% from the West, and 10% from the Midwest.
English Language Learners: The sample was 50% female, 88% Hispanic, and 13% Asian. 50% of participants had parents with at least 12 years of education, with 6% reporting at least 16 years of parental education. 38% of participants were drawn from the West, 31% from the South, 19% from the Midwest, and 13% from the Northeast.
Autism Spectrum Disorder w/ Language Impairment: The sample was 77% male, 70% White, 20% Hispanic, 7% African- American, and 3% other. 97% of participants had parents with at least 12 years of education, with 53% reporting at least 16 years of parental education. 43% of participants were drawn from the South, 23% from the Midwest, 20% from the West, and 13% from the Northeast.
Autism Spectrum Disorder w/out Language Impairment: The sample was 75% male, 69% White, 13% Hispanic, 9% other, 6% African- American, and 3% Asian. 97% of participants had parents with at least 12 years of education, with 56% reporting at least 16 years of parental education. 44% of participants were drawn from the South, 38% from the West, 9% from the Midwest, and 9% from the Northeast.
Assessment quality indicator measured
Test scores can be interpreted the same way for test- takers of different subgroups (fairness) and they are consistent over time and/or over multiple raters (reliability)
Several special group studies were conducted concurrently with WISC-V standardization. Participants were drawn from a variety of clinical settings and were accepted for participation in special group samples based on specified inclusion criteria, including a positive diagnosis for that particular disorder. The following special groups were included in the study: intellectually gifted, intellectual disability- mild severity, intellectual disability -moderate severity, borderline intellectual functioning, specific learning disorder- reading, specific learning disorder- reading and written expression, specific learning disorder -mathematics, attention -deficit/hyperactivity disorder, disruptive behavior, traumatic brain injury, English language learners, Autism Spectrum Disorder with language impairment, and Autism Spectrum Disorder without language impairment.
Efficacy Research Report | WISC-V 33
Split -half reliability coefficients were computed for each subtest, with the exception of the following subtests: Coding, Symbol Search, Cancellation, Naming Speed, and the Naming Speed and Symbol Translation standard process scores. Coefficients were averaged across groups using Fisher’s z transformation. Across all special groups, the average split -half reliability of the subtest and scaled process scores ranged from 0.86 to 0.97. Coefficients were generally consistent with corresponding estimates for the normative sample. It should be noted that the clinical samples were not randomly selected but were recruited based on availability. These studies may not be representative of the WISC-V performance of all children in the diagnostic category. The diagnoses of children within the same special group might have been made on the basis of different criteria and procedures. Moreover, the sample sizes for some of the studies are small and cover only a portion of the WISC-V age range. Nevertheless, evidence from these studies suggests that the WISC-V subtests are internally consistent for a wide variety of clinical groups, and their consistency is comparable to that for non-clinical test-takers.
Factor invariance between genders of the Wechsler Intelligence Scale for Children – Fifth Edition
Study citation Chen, H., Zhang, O., Raiford, S. E., Zhu, J., & Weiss, L. G. (2015). Factor invariance between genders on the Wechsler Intelligence Scale for Children–Fifth Edition. Personality and Individual Differences, 86, 1 5.
Research study contributors
National Taiwan Normal University Pearson
Type of study Factor analytic
Sample size N=2,200 children in 11 different age groups
Description of sample
Participants came from a nationally representative sample. Participants in each of 11 age groups were closely matched to 2012 US census data on race/ethnicity, parent education level, and geographic region and were balanced with respect to gender.
Assessment quality indicator measured
Test scores can be interpreted the same way for test- takers of different subgroups (fairness)
A representative sample of 2,200 children, ages 6–16, from the standardization study was administered 16 subtests from the WISC -V. A second -order factor model, positing an overarching general intelligence factor subsuming five additional factors (Verbal Comprehension, Visual Spatial, Fluid Reasoning, Working Memory, and Processing Speed) was tested for invariance across males and females. Results demonstrated that the hypothesized model showed configural invariance (same number of factors and factor pattern) and metric invariance (equal factor loadings) across males and females (overall model Chi -square=428.14, df=207, CFI=0.99, RMSEA=0.031). These results suggest that WISC -V scores can be interpreted in the same way for males and females.
Efficacy Research Report | WISC-V 34
Study citation Scheiber, C. (2016). Is the Cattell–Horn–Carroll-based factor structure of the Wechsler Intelligence Scale for Children—Fifth Edition (WISC-V) construct invariant for a representative sample of African-American, Hispanic, and Caucasian male and female students ages 6 to 16 years? Journal of Pediatric Neuropsychology, 2(3-4): 79-88.
Research study contributors
NA
Type of study Factor analytic
Sample size N=2,637 children in 11 different age groups
Description of sample
Participants came from a nationally representative sample of children without clinical conditions. Participants in each of 11 age groups were closely matched to 2012 US census data on race/ethnicity, parent education level, and geographic region, and were balanced with respect to gender.
Assessment quality indicator measured
Test scores can be interpreted the same way for test- takers of different subgroups (fairness)
Is the Cattell–Horn–Carroll-Based Factor Structure of the Wechsler Intelligence Scale for Children—Fifth Edition (WISC-V) construct invariant for a representative sample of African-American, Hispanic, and Caucasian male and female students, ages 6 to 16 years?
A representative sample of 2,637 children, ages 6 -16, from the standardization sample was administered 16 subtests from the WISC -V. A second -order factor model, positing an overarching general intelligence factor subsuming five additional factors (Verbal Comprehension, Visual Spatial, Fluid Reasoning, Working Memory, and Processing Speed) was tested for invariance across Caucasian, African-American, and Hispanic males and females. The model tested was identical to the model from the Chen et al. (2015) paper, except that Arithmetic scores were allowed to cross-load on Working Memory and Verbal Comprehension, in addition to Fluid Reasoning. Based on CFI, RMSEA, and changes in CFI and RMSEA for successive models, results demonstrate that the hypothesized model shows configural invariance (same number of factors and factor pattern) metric invariance (equal factor loadings), and intercept invariance (equal subtest means) across all groups (overall model Chi -square=1644.45, df=747, CFI=0.95, RMSEA=0.051). These results suggest that WISC -V scores can be interpreted in the same way for Caucasian, African-American, and Hispanic males and females.
Efficacy Research Report | WISC-V 35
Study citation Raiford, S. E. (2017). Essentials of WISC -V Integrated Assessment. Hoboken, NJ: Wiley.
Research study contributors
NA
Type of study Intercorrelation study
Sample size Not reported
Description of sample
Not reported
Assessment quality indicator measured
Test scores can be interpreted as measures of intelligence in children and can be used for identification, placement, and resource allocation (validity)
WISC-V integrated intercorrelation study
Results related to the validity of the WISC-V Integrated are reported, though without indication of sample size or methodology. The average correlations between WISC-V Integrated and standard WISC-V subtests, within each index (Verbal Comprehension, Visual Spatial, Fluid Reasoning, Working Memory, Processing Speed), ranged from .39 to .51. These correlations suggest that the WISC-V Integrated and standard WISC-V measure the same constructs.
The WISC-V Integrated contains “adaption” versions of standard WISC-V subtests (tests with the same content presented in a more accessible format) and “variation” versions (tests with different, but related, content, also presented in a more accessible format). The average correlations of the WISC-V Integrated adaptation/variation subtest with the standard WISC-V subtests ranged from .49 to .77, depending on the index. These correlations are evidence that the WISC-V Integrated subtests measure cognitive processes that are relevant to performance on the corresponding standard WISC-V subtext.
WISC-V integrated intercorrelation study
Study citation Raiford, S. E. (2017). Essentials of WISC -V Integrated Assessment. Hoboken, NJ: Wiley.
Research study contributors
NA
Type of study Standardization study
Sample size Complete sample: N=550
Retest reliability sub-sample: N=128
Description of sample
Complete sample: Stratified by age, sex, race-ethnicity, parent education level, and US geographic region in order to match proportions from 2012 US Census data. Eleven age groups were created, each having fifteen children.
Retest reliability sub-sample: Demographic data on the participants were not reported.
Assessment quality indicator measured
Test scores can be interpreted as measures of intelligence in children and can be used for identification, placement, and resource allocation (validity)
Efficacy Research Report | WISC-V 36
A nationally representative sample of 550 children was collected between April 2013 and October 2014. The sam-ple was stratified by age, sex, race-ethnicity, parent education level, and US geographic region in order to match proportions from 2012 US Census data. Eleven age groups were created having fifteen children in each. Internal consistency coefficients for the WISC-V Integrated subtests and indices ranged from .79 to .93. A subset of 128 participants provided retest reliability data, and the resulting retest reliability coefficients ranged from .69 to .91, depending on the subtest or index.
Principal components analysis was conducted on the WISC-V integrated subtest scores with particular attention given to the unrotated loadings on the first factor. These loadings are taken as evidence of the association between the subtests and general intelligence. The loadings ranged from .38 to .84, most of which were judged to be “good or fair” measures of general intelligence, and the pattern of these loadings was similar to that in the Wechsler intelligence scales.
WISC-V Integrated Essentials composite scores
Study citation Raiford, S. E. (2017). Essentials of WISC -V Integrated Assessment. Hoboken, NJ: Wiley.
Research study contributors
Raiford, S. E.
Type of study Assessment development
Sample size Complete sample: N=550
Description of sample
WISC-V Integrated normative sample
Assessment quality indicator measured
Test scores can be interpreted as measures of intelligence in children and can be used for identification, placement, and resource allocation (validity).
Test scores are consistent over time and/or over multiple raters (reliability)
Test scores can be interpreted the same way for test- takers of different subgroups (fairness)
The new Essentials composite scores include twelve new global and index scores for children with expressive and/or motor issues. Four new expanded index scores are expanded measures of the WISC-V cognitive domains. These include the Expanded Visual Spatial Index, Expanded Working Memory Index, Expanded Auditory Working Memory Index, and Expanded Processing Speed Index. Additionally, the Nonexpressive Expanded Crystallized Index, Nonexpressive General Verbal Information Index, Nonexpressive Fluid-Crystallized Index, and Nonexpressive Full Scale Score are analogues to composites from the standard WISC-V, but are comprised of subtests suitable for children with expressive issues. Likewise, the Nonmotor Visual Spatial Index, Nonmotor Nonverbal Index, Nonmotor General Ability Index, and Nonmotor Full Scale Score are analogues to composites from the standard WISC-V that are suitable for children with motor issues.
These additions serve two purposes. First, they allow for the cognitive assessment of children without relying on expressive or motor involvement that may hinder them. Second, the new composites can inform on the reasons for low performance on subtests. The overall reliability coefficients (across age groups) for the Essentials composite scores range from .89 to .96. The overall standard errors of measurement ranged from 2.87 to 4.83. Both are also reported for each age group, though the subgroup results tend to be similar to the overall results.
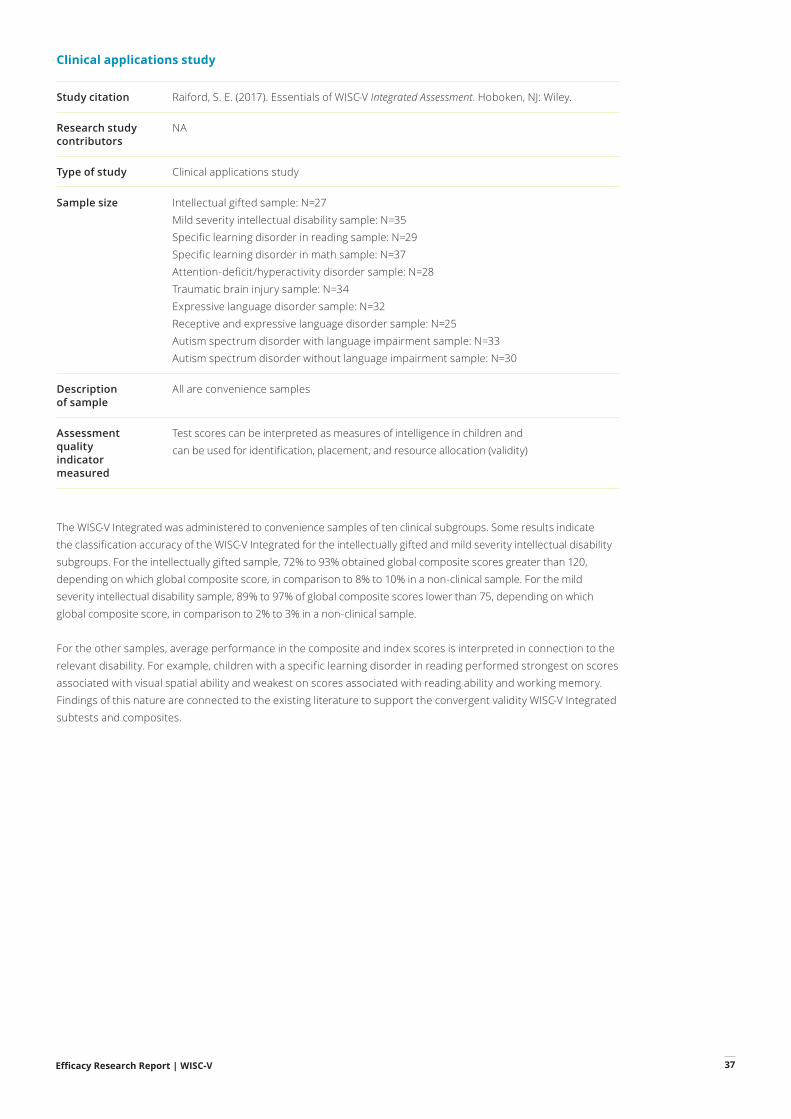
Efficacy Research Report | WISC-V 37
Clinical applications study
Study citation Raiford, S. E. (2017). Essentials of WISC -V Integrated Assessment. Hoboken, NJ: Wiley.
Research study contributors
NA
Type of study Clinical applications study
Sample size Intellectual gifted sample: N=27Mild severity intellectual disability sample: N=35Specific learning disorder in reading sample: N=29Specific learning disorder in math sample: N=37Attention-deficit/hyperactivity disorder sample: N=28Traumatic brain injury sample: N=34Expressive language disorder sample: N=32Receptive and expressive language disorder sample: N=25Autism spectrum disorder with language impairment sample: N=33Autism spectrum disorder without language impairment sample: N=30
Description of sample
All are convenience samples
Assessment quality indicator measured
Test scores can be interpreted as measures of intelligence in children and can be used for identification, placement, and resource allocation (validity)
The WISC-V Integrated was administered to convenience samples of ten clinical subgroups. Some results indicate the classification accuracy of the WISC-V Integrated for the intellectually gifted and mild severity intellectual disability subgroups. For the intellectually gifted sample, 72% to 93% obtained global composite scores greater than 120, depending on which global composite score, in comparison to 8% to 10% in a non-clinical sample. For the mild severity intellectual disability sample, 89% to 97% of global composite scores lower than 75, depending on which global composite score, in comparison to 2% to 3% in a non-clinical sample.
For the other samples, average performance in the composite and index scores is interpreted in connection to the relevant disability. For example, children with a specific learning disorder in reading performed strongest on scores associated with visual spatial ability and weakest on scores associated with reading ability and working memory. Findings of this nature are connected to the existing literature to support the convergent validity WISC-V Integrated subtests and composites.
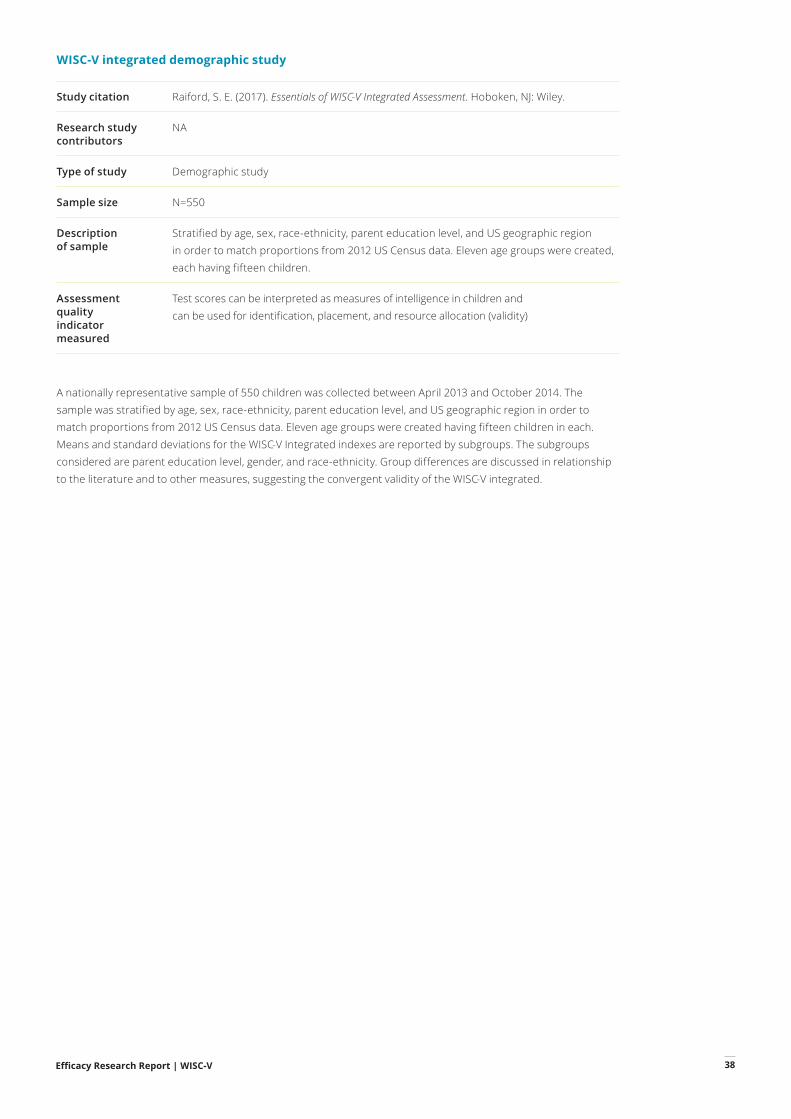
Efficacy Research Report | WISC-V 38
WISC-V integrated demographic study
Study citation Raiford, S. E. (2017). Essentials of WISC -V Integrated Assessment. Hoboken, NJ: Wiley.
Research study contributors
NA
Type of study Demographic study
Sample size N=550
Description of sample
Stratified by age, sex, race-ethnicity, parent education level, and US geographic region in order to match proportions from 2012 US Census data. Eleven age groups were created, each having fifteen children.
Assessment quality indicator measured
Test scores can be interpreted as measures of intelligence in children and can be used for identification, placement, and resource allocation (validity)
A nationally representative sample of 550 children was collected between April 2013 and October 2014. The sample was stratified by age, sex, race-ethnicity, parent education level, and US geographic region in order to match proportions from 2012 US Census data. Eleven age groups were created having fifteen children in each. Means and standard deviations for the WISC-V Integrated indexes are reported by subgroups. The subgroups considered are parent education level, gender, and race-ethnicity. Group differences are discussed in relationship to the literature and to other measures, suggesting the convergent validity of the WISC-V integrated.
Efficacy Research Report | WISC-V 39
References
American Educational Research Association, American Psychological Association, NationalCouncil on Measurement in Education, Joint Committee on Standards for Educational and Psychological Testing (U.S.). (2014). Standards for educational and psychological testing. Washington, DC: AERA.
Andrews, D. A., & Bonta, J. (2010). The psychology of criminal conduct. Routledge.
Arinoldo, C. G. (1981). Black–White differences in the general cognitive index of the McCarthy scales and in the full scale IQS of Wechsler's scales. Journal of Clinical Psychology, 37(3), 630-638.
Carlson, M. J., & Corcoran, M. E. (2001). Family structure and children's behavioral and cognitive outcomes. Journal of Marriage and Family, 63(3), 779-792.
Casillas, A., Robbins, S., Allen, J., Kuo, Y. L., Hanson, M. A., & Schmeiser, C. (2012). Predicting early academic failure in high school from prior academic achievement, psychosocial characteristics, and behavior. Journal of Educational Psychology, 104(2), 407.
Chen, H., Zhang, O., Raiford, S. E., Zhu, J., & Weiss, L. G. (2015). Factor invariance between genders on the Wechsler Intelligence Scale for Children–Fifth Edition. Personality and Individual Differences, 86, 1 5.
Costa, E. B. Adams, Day, L. A., & Raiford, S. E. (2016). WISC-V special group study: Children with hearing differences who utilize spoken language and have assistive technology. Bloomington, MN: Pearson.
Daniel, M.H., Wahlstrom, D., & Zhang, O. (2014). Equivalence of Q- interactive and paper administrations of cognitive tasks: WISC -V. Q- interactive Technical Report 8. Bloomington, MN: Pearson.
Flanagan, D. P. & Alfonso, V. C. (2017). Essentials of WISC-V assessment. Hoboken, NJ: Wiley.
Geraci, C., Gozzi, M., Papagno, C., & Cecchetto, C. (2008). How grammar can cope with limited short-term memory: Simultaneity and seriality in sign languages. Cognition, 106(2), 780-804.
Gottfredson, L., & Saklofske, D. H. (2009). Intelligence: Foundations and issues in assessment. Canadian Psychology, 50(3), 183.
Gupta, P., & MacWhinney, B. (1997). Vocabulary acquisition and verbal short-term memory: Computational and neural bases. Brain and Language, 59(2), 267-333.
Hansson, K., Forsberg, J., Löfqvist, A., Mäki‐Torkko, E., & Sahlén, B. (2004). Working memory and novel word learning in children with hearing impairment and children with specific language impairment. International Journal of Language & Communication Disorders, 39(3), 401-422.
Hinshaw, S. P. (1992). Externalizing behavior problems and academic underachievement in childhood and adolescence: causal relationships and underlying mechanisms. Psychological Bulletin, 111(1), 127.
Efficacy Research Report | WISC-V 40
Howse, R. B., Calkins, S. D., Anastopoulos, A. D., Keane, S. P., & Shelton, T. L. (2003). Regulatory contributors to children's kindergarten achievement. Early Education and Development, 14(1), 101-120.
Johnson, W., Bouchard, T. J., Krueger, R. F., McGue, M., & Gottesman, I. I. (2004). Just one g: Consistent results from three test batteries. Intelligence, 32(1), 95 107.
Kaufman, A. S., Raiford, S. E., & Coalson, D. L. (2016). Intelligent testing with the WISC -V. Hoboken, NJ: John Wiley & Sons.
Keith, T. Z., Reynolds, M. R., Roberts, L. G., Winter, A. L., & Austin, C. A. (2011). Sex differences in latent cognitive abilities ages 5 to 17: Evidence from the Differential Ability Scales—Second Edition. Intelligence, 39(5), 389-404.
Leech, S. L., Day, N. L., Richardson, G. A., & Goldschmidt, L. (2003). Predictors of self-reported delinquent behavior in a sample of young adolescents. The Journal of Early Adolescence, 23(1), 78-106.
Lynn, R., & Irwing, P. (2008). Sex differences in mental arithmetic, digit span, and g defined as working memory capacity. Intelligence, 36(3), 226-235.
Matarazzo, J. D., Daniel, M. H., Prifitera, A., & Herman, D. O. (1988). Inter-subtest scatter in the WAIS-R standardization sample. Journal of Clinical Psychology, 44, 940-950.
McLean, J. E., Kaufman, A. S., & Reynolds, C. R. (1989). Subtest scatter on the WAIS-R. Journal of Clinical Psychology, 45, 919-926.
Orsini, A., Pezzuti, L., & Hulbert, S. (2014). The unitary ability of IQ in the WISC-IV and its computation. Personality and Individual Differences, 69, 173-175.
Pisoni, D. D., & Geers, A. E. (2000). Working memory in deaf children with cochlear implants: Correlations between digit span and measures of spoken language processing. The Annals of otology, rhinology & laryngology. Supplement, 185, 92.
Preiss, M., & Fránová, L. (2006). Depressive symptoms, academic achievement, and intelligence. Studia Psychologica, 48(1), 57.
Quist, R. M., & Matshazi, D. G. (2000). The Child and Adolescent Functional Assessment Scale (CAFAS): A dynamic predictor of juvenile recidivism. Adolescence, 35(137), 181-192.
Raiford, S.E., Drozdick, L., & Zhang, O., (2015). Q- interactive special group studies: The WISC -V and children with Autism Spectrum Disorder and accompanying language impairment or Attention Deficit/Hyperactivity disorder. Q- interactive Technical Report 11. Bloomington, MN: Pearson.
Raiford, S.E., Drozdick, L. W., & Zhang, O., (2016). Q- interactive special group studies: The WISC -V and children with specific learning disorders in reading or mathematics. Q- interactive Technical Report 13. Bloomington, MN: Pearson.
Raiford, S. E., Zhou, X., Drozdick, L. W. (2016). Using the WASI-II with the WISC-V. Bloomington, MN: Pearson.
Raiford, S. E. (2017). Essentials of WISC -V Integrated Assessment. Hoboken, NJ: Wiley.
Rauh, V. A., Parker, F. L., Garfinkel, R. S., Perry, J., & Andrews, H. F. (2003). Biological, social, and community influences on third-grade reading levels of minority Head Start children: A multilevel approach. Journal of Community Psychology, 31(3), 255-278.
Efficacy Research Report | WISC-V 41
Scheiber, C. (2016). Is the Cattell–Horn–Carroll-based factor structure of the Wechsler Intelligence Scale for Children—Fifth Edition (WISC-V) construct invariant for a representative sample of African-American, Hispanic, and Caucasian male and female students ages 6 to 16 years? Journal of Pediatric Neuropsychology, 2(3-4): 79-88.
Sellers, A. H., Burns, W. J., & Guyrke, J. S. (1996). Prediction of premorbid intellectual functioning of young children using demographic information. Applied Neuropsychology, 3(1), 21-27.
Von Stumm, S., & Plomin, R. (2015). Socioeconomic status and the growth of intelligence from infancy through adolescence. Intelligence, 48, 30-36.
Wechsler, David (1939). The Measurement of Adult Intelligence. Baltimore (MD): Williams & Witkins.
Wechsler, D. (1991). Wechsler Intelligence Scale for Children–Third Edition. San Antonio, TX: Psychological Corporation.
Wechsler, D. (2003). Wechsler Intelligence Scale for Children–Fourth Edition. San Antonio, TX: Psychological Corporation.
Wechsler, D. (2014). WISC -V Technical and interpretive manual. Bloomington, MN: Pearson.
Wechsler, D., & Kaplan, E. (2015). WISC-V Integrated Technical and Interpretive Manual. Bloomington, MN: Pearson.
Weiss, L., Saklofske, D., Holdnack, J., & Prifitera, A. (2016). WISC -V assessment and interpretation: Scientist- practitioner perspectives. London, UK: Academic Press.

Efficacy Research Report | WISC-V 42