Embed Size (px)
Citation preview
www.cmar.csiro.au
Rapid spatial indexing and web mapping using the “c-squares” global grid
Tony Rees
Manager, Divisional Data Centre
23 March 2007
CSIRO Marine and Atmospheric Research

Introduction
• Web mapping – here considered to be dynamic map generation and return in response to an internet request (OGC-compliant requests and responses are a subset of these)
• Slightly different / extended concept – web plotting of user-supplied data – subject of this talk
• Data may be supplied by human user, or (more typically) a client application, over the web for real-time plotting
• Example to be discussed is the “c-squares mapper” – developed at CMAR and in use for last 5+ years
• “C-squares” are units of spatial indexing – data format used as mapper input (however, underlying mechanics may be hidden from the human user).

Example usage – CMAR “CAAB” database http://www.cmar.csiro.au/caab/
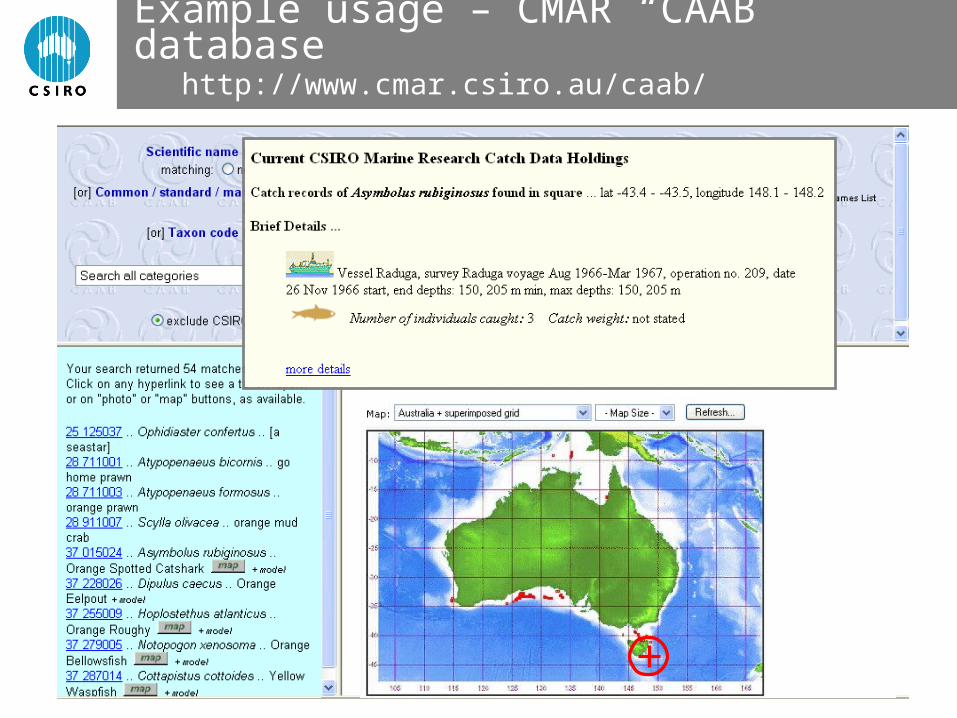
Example usage – CMAR “CAAB” database http://www.cmar.csiro.au/caab/
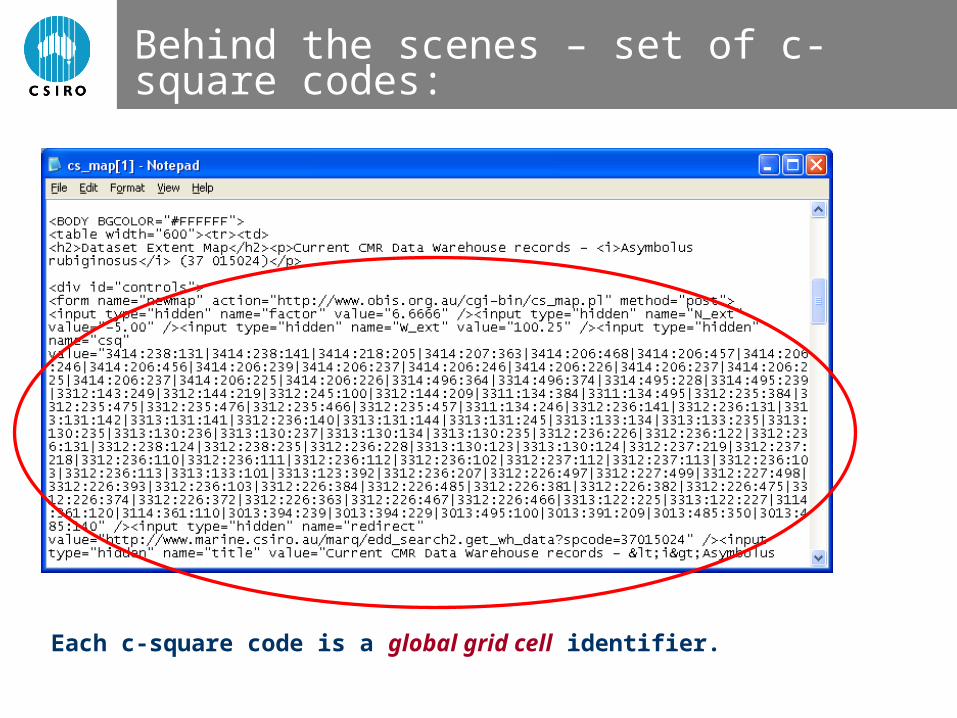
Behind the scenes – set of c-square codes:
Each c-square code is a global grid cell identifier.

Regional and Global grids
Regional grid example: British Isles…
3 problems for large scale use:
(1) Grid does not align with lat-lon graticule

Regional and Global grids
Regional grid example: British Isles…
3 problems for large scale use:
(1) Grid does not align with lat-lon graticule
(2) No single grid covers whole target area – problems where grids meet
(3) Some outlying portions have no grid coverage at all (e.g. Channel Is.)
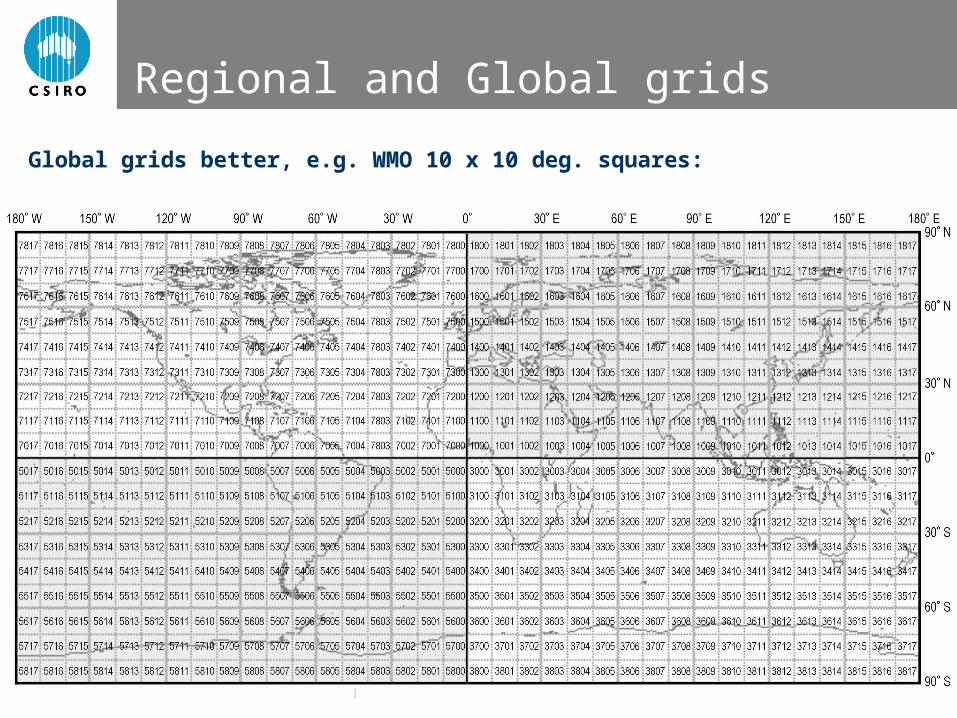
Regional and Global grids
Global grids better, e.g. WMO 10 x 10 deg. squares:

Regional and Global grids
In our region:

The “c-squares” global grid
• C-squares = “Concise Spatial Query and Representation System” – now 5 years old (initial code, mapper written Jan ’02)
• Creates hierarchical subdivisions of WMO 10 x 10 deg. squares, e.g.
3414 = 10 deg. square
3414:1 = 5 deg. square within square 3414
3414:104 = 1 deg. square within square 3414:1
3414:104:3 = 0.5 deg. square within square 3414:104
(etc., etc.)
Note the “telephone number” analogy, i.e. country => area => sub-area => sub-sub-area etc.

The “c-squares” global grid
Example squares + IDs
3414:227(1 deg. square)
3414:227:2(0.5 deg. square)
3414:227:209(0.1 deg. square)

Spatial indexing using c-squares
Sample uses:
Multi-point data set(NB, can be 1 - many points in a square)

Spatial indexing using c-squares
Predicted marine species range (~= polygon)
Sample uses:

Spatial indexing using c-squares
Gridded data (density per cell)
Sample uses:
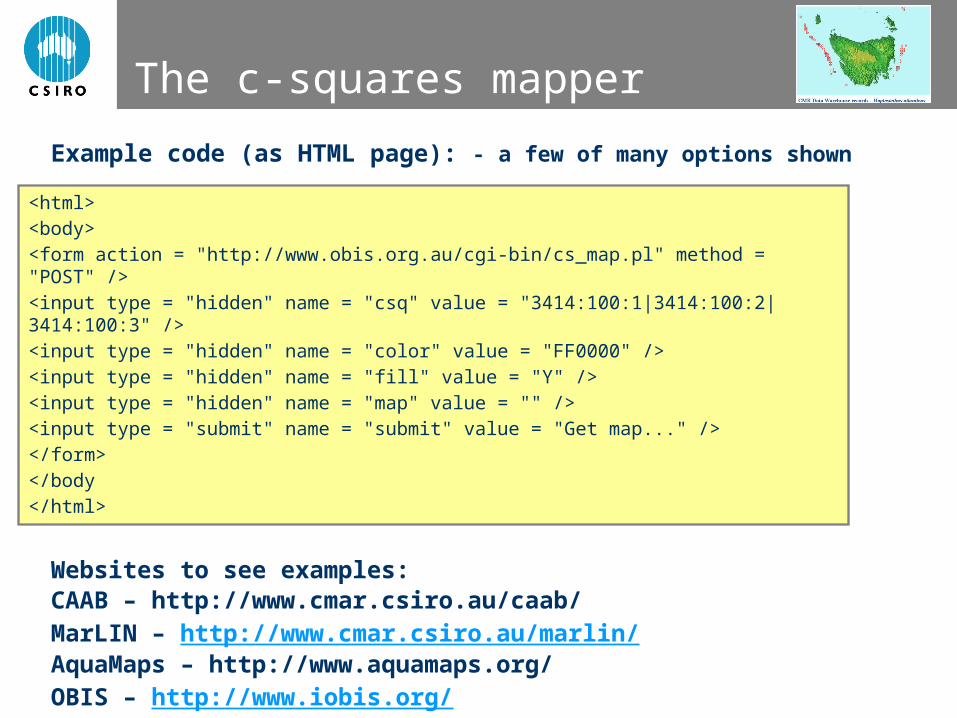
The c-squares mapper
Example code (as HTML page): - a few of many options shown
<html><body><form action = "http://www.obis.org.au/cgi-bin/cs_map.pl" method = "POST" /><input type = "hidden" name = "csq" value = "3414:100:1|3414:100:2|3414:100:3" /><input type = "hidden" name = "color" value = "FF0000" /><input type = "hidden" name = "fill" value = "Y" /><input type = "hidden" name = "map" value = "" /><input type = "submit" name = "submit" value = "Get map..." /></form></body</html>
Websites to see examples:CAAB – http://www.cmar.csiro.au/caab/MarLIN – http://www.cmar.csiro.au/marlin/AquaMaps – http://www.aquamaps.org/OBIS – http://www.iobis.org/

Example code (as HTML page): - a few of many options shown
The c-squares mapper
<html><body><form action = "http://www.obis.org.au/cgi-bin/cs_map.pl" method = "POST" /><input type = "hidden" name = "csq" value = "3414:100:1|3414:100:2|3414:100:3" /><input type = "hidden" name = "color" value = "FF0000" /><input type = "hidden" name = "fill" value = "Y" /><input type = "hidden" name = "map" value = "" /><input type = "submit" name = "submit" value = "Get map..." /></form></body</html>
Websites to see examples:CAAB – http://www.cmar.csiro.au/caab/MarLIN – http://www.cmar.csiro.au/marlin/AquaMaps – http://www.aquamaps.org/OBIS – http://www.iobis.org/

Sample usage
MarLIN – metadata catalogue for CSIRO Marine and Atmospheric Research – www.cmar.csiro.au/marlin/
Behind the scenes…
Sample usage
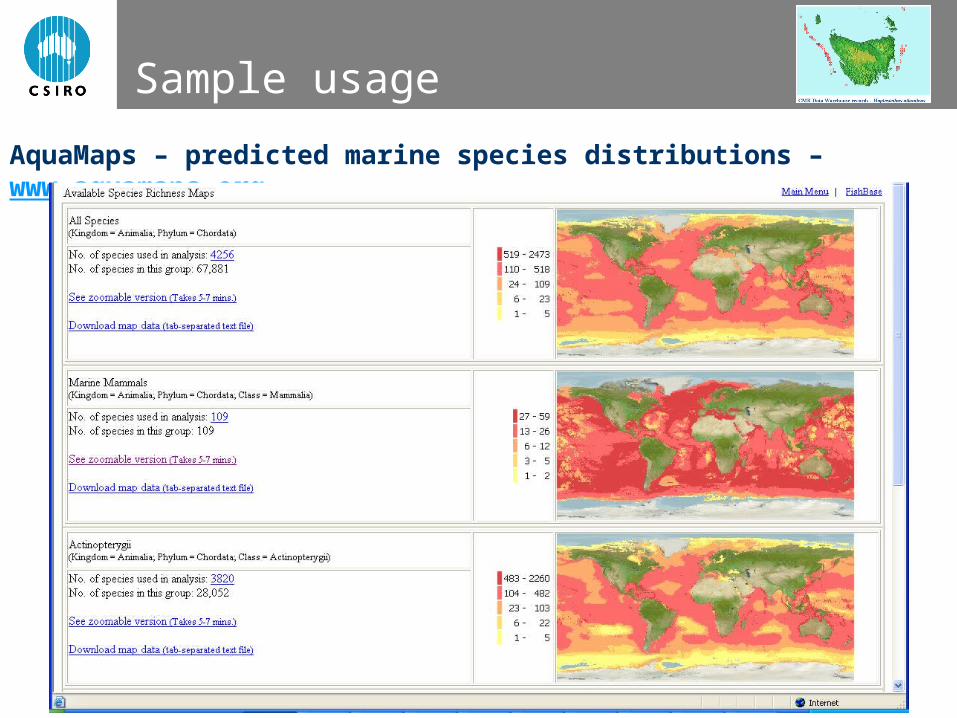
AquaMaps – predicted marine species distributions – www.aquamaps.org

Sample usage
OBIS – Ocean Biogeographic Information System – www.iobis.org/
OBIS data – “all vertebrates” (6 million records, 41,000 squares) ... plotting time 16 / 25 secs (std. vs. large size map)

Sample usage
OBIS species page – “wandering albatross”

Sample usage
OBIS data – “wandering albatross” (970 records, 530 squares) ...

Sample usage

Sample usage
Current max. zoom(from “globe views”)

Sample usage
Some plotting times compared (Duke University Geospatial Lab, unpubl, Mar 2006, plus present data)
Plotted data ArcIMS MapServer Google Earth c-squares mapper *
1,200 points 4 secs. 6 secs. 4 secs. 3-10 secs.
* - present data (not in Duke Univ. study). Longer times are for “large world” base maps.
NB, new CSQ mapper “globe views” take only 2-3 secs each time after initial map generation

Sample usage
Some plotting times compared (Duke University Geospatial Lab, unpubl, Mar 2006, plus present data)
Plotted data ArcIMS MapServer Google Earth c-squares mapper *
1,200 points 4 secs. 6 secs. 4 secs. 3-10 secs.
15,000 points 8 secs. 8 secs. 9 secs. 4-15 secs.
90,000 points 14 secs. 18 secs. not stated 25-45 secs.
206,000 points 55 secs. 19 secs. > 5 mins. 3-6 mins.
1,090,000 points 58 secs. 20 secs. not possible not possible **
* - present data (not in Duke Univ. study). Longer times are for “large world” base maps.
NB, new CSQ mapper “globe views” take only 2-3 secs each time after initial map generation
** c-squares mapper can plot millions of points in practice after data reduction (e.g. OBIS “vertebrates” example: 6 m records / 41,000 squares / 25 secs or less to plot)

Some future gazing…
SWOT Analysis – strengths, weaknesses, opportunities, threats?
STRENGTHS• Low / no cost solution for basic spatial indexing and search, and “entry-level” web mapping
• Easy to install in non-GIS enabled systems (e.g. metadata catalogues, text documents, standard databases)
• Good fit with grid-based data, multi-point data
• Good for data reduction (e.g. many points, fewer squares)
• No date line problems, also OK with polar data (although indexing is least efficient at poles)
• Remote mapper, no dedicated client-side software, plugins, etc. needed (cf. Google Earth, desktop GIS)

Some future gazing…
SWOT Analysis – strengths, weaknesses, opportunities, threats?
WEAKNESSES• “Jaggies” when representing curves, polylines, polygons
• Large regions require a lot of squares to be processed (slower mapping)
• Spatial queries are approximations (2 features may share the same square, but not quite intersect)
• Squares are not equal-area (latter may be preferred for some purposes)
• Mapper not as fully featured as true web mapping solution; limited zoom, mostly medium / large scale physical backdrops at this time
• No current integration with OGC standards

Some future gazing…
SWOT Analysis – strengths, weaknesses, opportunities, threats?
THREATS• True GIS offers more features / precision, may be needed by many users – if not now, eventually
• Other remote web data plotting solutions have arrived since 2002 (some with more features, better zoom/pan, etc.)
• Google Earth offers great functionality, becoming a “de facto” standard for some types of data presentation
• Mapper development is resources-limited, may lead to being outclassed eventually

Some future gazing…
SWOT Analysis – strengths, weaknesses, opportunities, threats?
OPPORTUNITIES• Further development of c-squares mapper (including open source community, remote installation administrators)
• Additional mapper installations around the world coming on line (today AUS + GER + SWE; USA soon)
• OBIS and other “power users” are providing useful exposure and load testing for the system, also user feedback e.g. desired features
• May be possible to integrate with OGC Web Mapping standards (how…?)
• Maybe keep indexing method, use different mapping solution (provide data as polygons in GML or similar, to a more sophisticated mapper or web map client)

Resources availableC-squares initial published description (Mar 2003) – “Oceanography” vol. 16 (1)

Resources availableC-squares website at CMAR: http://www.cmar.csiro.au/csquares/ (sample page)

Resources availableC-squares SourceForge site: http://csquares.sourceforge.net/

Resources availableC-squares on wikipedia: http://en.wikipedia.org/wiki/C-squares

Thank you!
Questions, comments invited…
Acknowledgements: Miroslaw Ryba, Philip Bohm [CMAR] (programming assistance); GD (graphics routine for the basic plotting); Xplanet (rendering engine for the “Globe Views”).

www.cmar.csiro.au
Thank You
Contact
Name: Tony ReesTitle: Data Centre ManagerPhone: 03 6232 5318Email: [email protected]: www.cmar.csiro.au/datacentre
Contact CSIRO
Phone: 1300 363 400+61 3 9545 2176Email: [email protected]: www.csiro.au

![Www.csiro.au CM [A] R’s “MarLIN” Metadata System - or, how do we discover what data we’ve got?? Tony Rees Manager, Divisional Data Centre 3 June 2005 CSIRO](https://img.pdfslide.net/doc/110x75/56649e155503460f94b00221/wwwcsiroau-cm-a-rs-marlin-metadata-system-or-how-do-we-discover.jpg)