Embed Size (px)
Citation preview

www.students.org.nz
New Zealand Union of Students’ Associations
Education by numbers:A picture of tertiary education
through statistics
January Conference 2010

www.students.org.nz
New Zealand Union of Students’ Associations
Overview
• Why do we need information and statistics?• What sort of info is useful?• Where do we get it?• How can we use this to our advantage?• What are some of the statistical trends in recent
times?

www.students.org.nz
New Zealand Union of Students’ Associations
Why do we need good reliable useful appropriate info and stats?
• To:– be informed, credible, effective– To understand our membership – To plan and implement policy and change– To better understand your members & achieve positive
results for students• Because:– Appropriate & effective advocacy & representation require
knowledge and evidence
www.students.org.nz
New Zealand Union of Students’ Associations
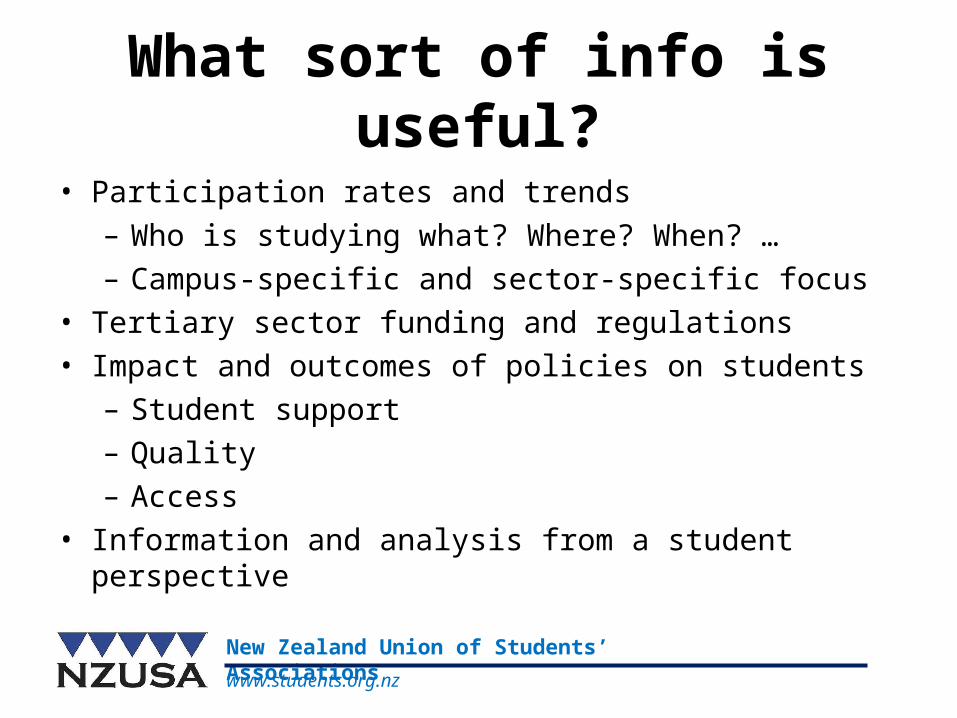
What sort of info is useful?
• Participation rates and trends– Who is studying what? Where? When? …– Campus-specific and sector-specific focus
• Tertiary sector funding and regulations• Impact and outcomes of policies on students – Student support– Quality– Access
• Information and analysis from a student perspective
www.students.org.nz
New Zealand Union of Students’ Associations
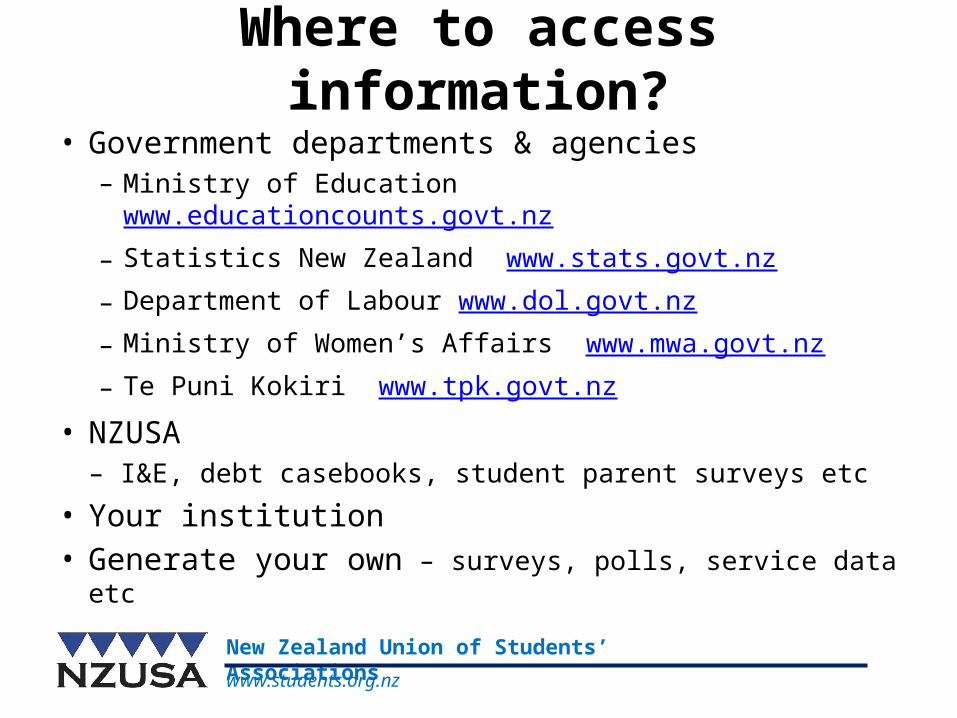
Where to access information?• Government departments & agencies– Ministry of Education www.educationcounts.govt.nz – Statistics New Zealand www.stats.govt.nz – Department of Labour www.dol.govt.nz – Ministry of Women’s Affairs www.mwa.govt.nz – Te Puni Kokiri www.tpk.govt.nz
• NZUSA – I&E, debt casebooks, student parent surveys etc
• Your institution• Generate your own – surveys, polls, service data etc
www.students.org.nz
New Zealand Union of Students’ Associations
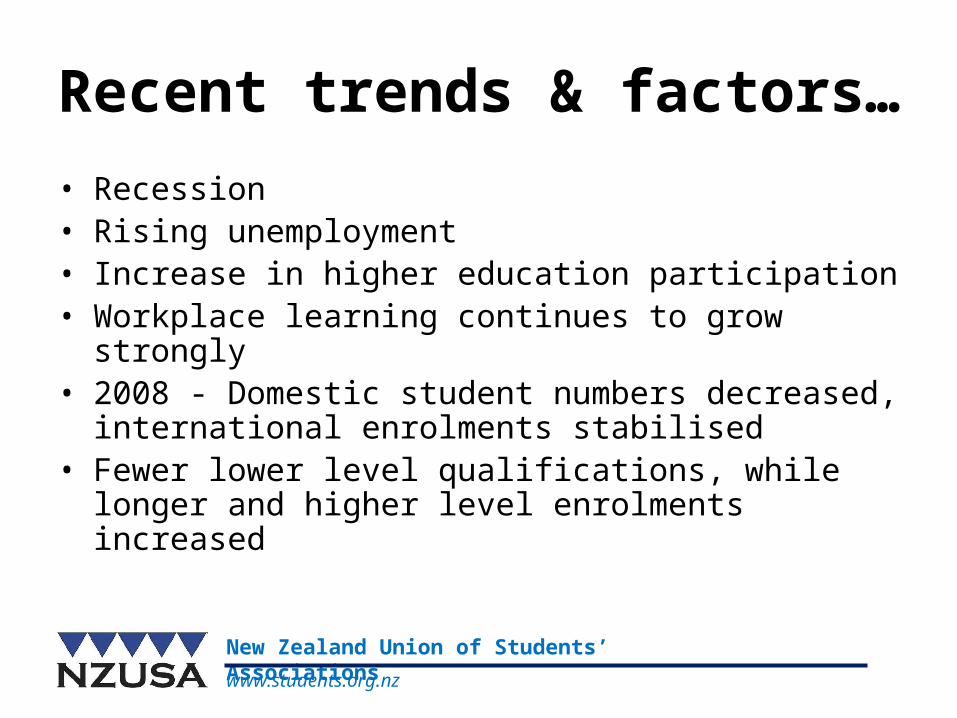
Recent trends & factors…• Recession• Rising unemployment• Increase in higher education participation• Workplace learning continues to grow strongly• 2008 - Domestic student numbers decreased, international
enrolments stabilised• Fewer lower level qualifications, while longer and higher level
enrolments increased
www.students.org.nz
New Zealand Union of Students’ Associations
The Landscape - What students where?
• Very diverse but integrated sector• Training/vocational mixed with wider education• Significant rates of participation, but in specific areas• High participation doesn’t necessarily mean high equity or
achievement

www.students.org.nz
New Zealand Union of Students’ Associations
Who studies? Student numbers
Year Universities ITPs Wananga
1999 129,756 117,594 2,043
2000 129,275 123,362 4,408
2001 131,518 125,593 16,959
2002 135,454 137,616 44,587
2003 136,433 177,900 65,357
2004 135,937 201,080 69,925
2005 168,333 213,602 62,200
2006 165,571 214,394 48,842
2007 146,931 206,965 42,352
2008 147,128 186,942 40,326
www.students.org.nz
New Zealand Union of Students’ Associations
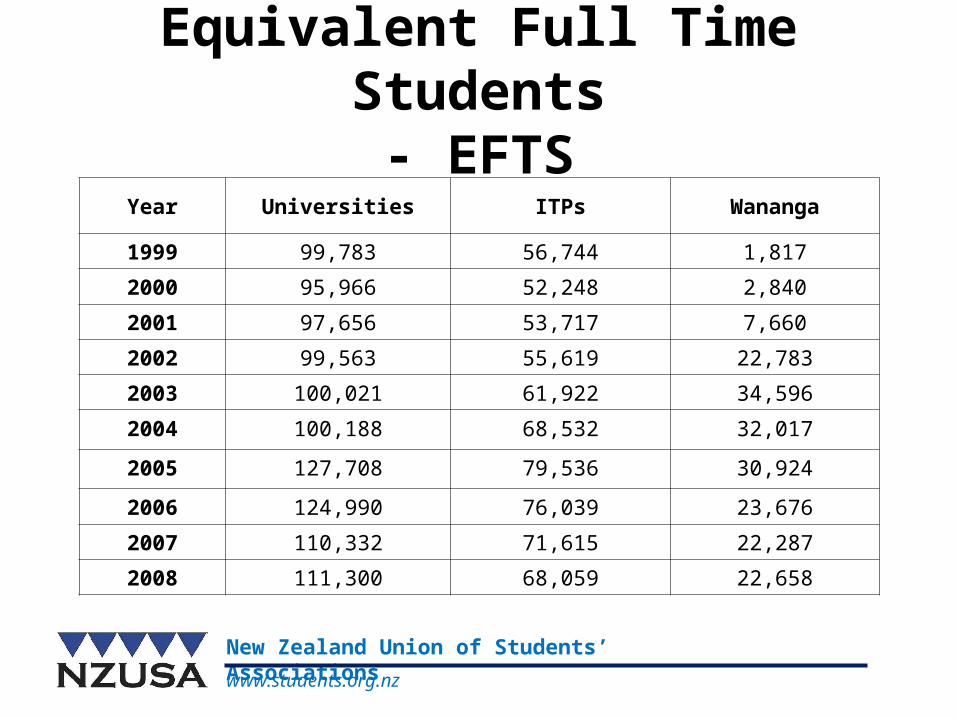
Equivalent Full Time Students- EFTS
Year Universities ITPs Wananga
1999 99,783 56,744 1,817
2000 95,966 52,248 2,840
2001 97,656 53,717 7,660
2002 99,563 55,619 22,783
2003 100,021 61,922 34,596
2004 100,188 68,532 32,017
2005 127,708 79,536 30,924
2006 124,990 76,039 23,676
2007 110,332 71,615 22,287
2008 111,300 68,059 22,658
www.students.org.nz
New Zealand Union of Students’ Associations
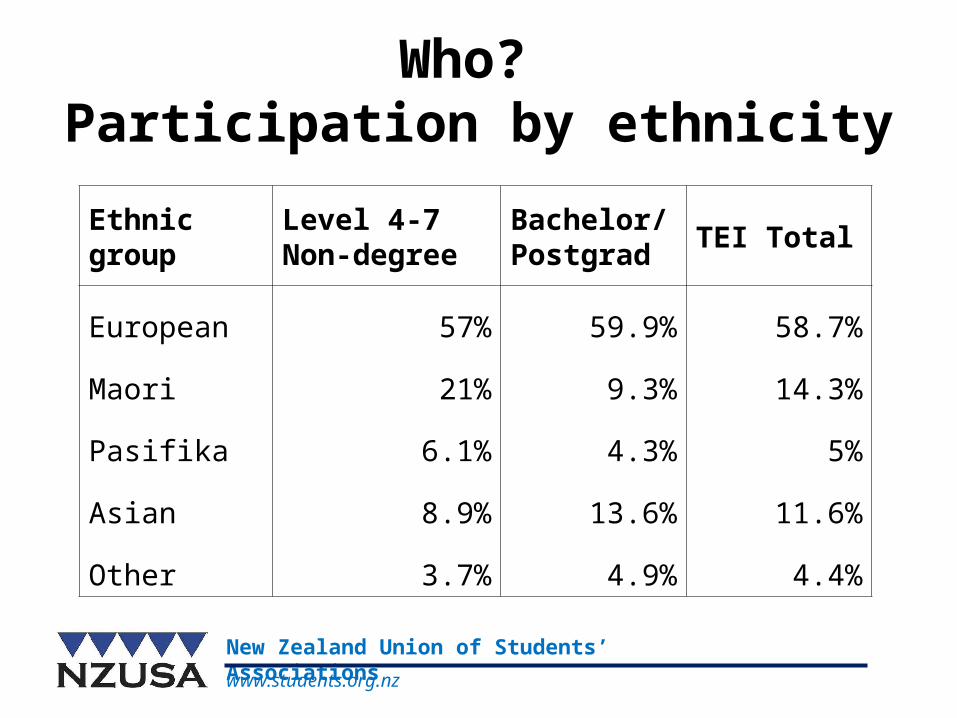
Who? Participation by ethnicity
Ethnic group Level 4-7Non-degree
Bachelor/Postgrad TEI Total
European 57% 59.9% 58.7%
Maori 21% 9.3% 14.3%
Pasifika 6.1% 4.3% 5%
Asian 8.9% 13.6% 11.6%
Other 3.7% 4.9% 4.4%

www.students.org.nz
New Zealand Union of Students’ Associations
GenderGender Universities ITPs Wananga Total
Female 57% 52% 67% 57%
Male 43% 48% 33% 43%
AgeAge group Universities ITPs Wananga
under 18 1% 5% 2%
18-24 54% 26% 11%
25-39 28% 36% 42%
40+ 16% 33% 45%

www.students.org.nz
New Zealand Union of Students’ Associations
In 2008…• 502,000 people in tertiary education in 2008• 39,800 international students• 29,100 in targeted training programmes• 38,800 in courses of less than a week’s duration• 195,000 in industry based training• 12,100 in modern apprenticeships• 223,000 in adult and community education• 12% of population participated in some form of learning

www.students.org.nz
New Zealand Union of Students’ Associations
I & E summary• Debt– Average debt $28,838– Risen 54% since 2004 – 147% higher than 1998– 88% fulltime students have loans
• Expenditure rises since 2004– Food, accommodation, living expenses all rose
• Fee rises • Decrease in student earnings and assets• More students in paid work

www.students.org.nz
New Zealand Union of Students’ Associations
I&E policy responses
• 77% agreed a universal allowance should be provided for all fulltime students
• 91% agreed interest should not be charged on student loans
• 76% agreed that fees were too high• 68% agreed that tertiary education should be fully
funded

www.students.org.nz
New Zealand Union of Students’ Associations
I&E course quality responses
• 87% rated overall quality of main course as good or very good
• 80% rated quality of teaching as good or very good• 74% rated library resources as good or very good• Reasonableness of workload and quality of academic
support services rated poorest

www.students.org.nz
New Zealand Union of Students’ Associations
How & when to use it?
• Timing and purpose are crucial– Prioritise tasks and actions, tailoring info to support– Key messages crucial
• Where?– at Council, within your students’ association, at various
committees etc, directly to your students
• When you least expect it!– Be informed and prepared– Reliable, credible, robust data and info important

www.students.org.nz
New Zealand Union of Students’ Associations
Discussion…